
Sex Differences between Urinary Phthalate Metabolites and Metabolic Syndrome in Adults: A Cross-Sectional Taiwan Biobank Study

 , ,
, ,
Abstract
:1. Introduction
2. Methods
2.1. Study Design and Data Collection
2.2. Measures
2.2.1. Study Population
2.2.2. Measurement of Phthalate Metabolites
2.2.3. Metabolic Syndrome
2.3. Statistical Analysis
3. Results
3.1. Participants’ Demographics Based on MetS Status
3.2. Differences in MetS Status and Urinary Phthalate Metabolite Concentrations
3.3. Multiple Logistic Regression Analysis between MetS Status and Urinary Phthalate Metabolite Concentrations
3.4. Associations between Phthalate Metabolite Quartiles and MetS Components
3.5. Associations between Quartiles of Phthalate Metabolites and MetS Stratified by Age and Sex
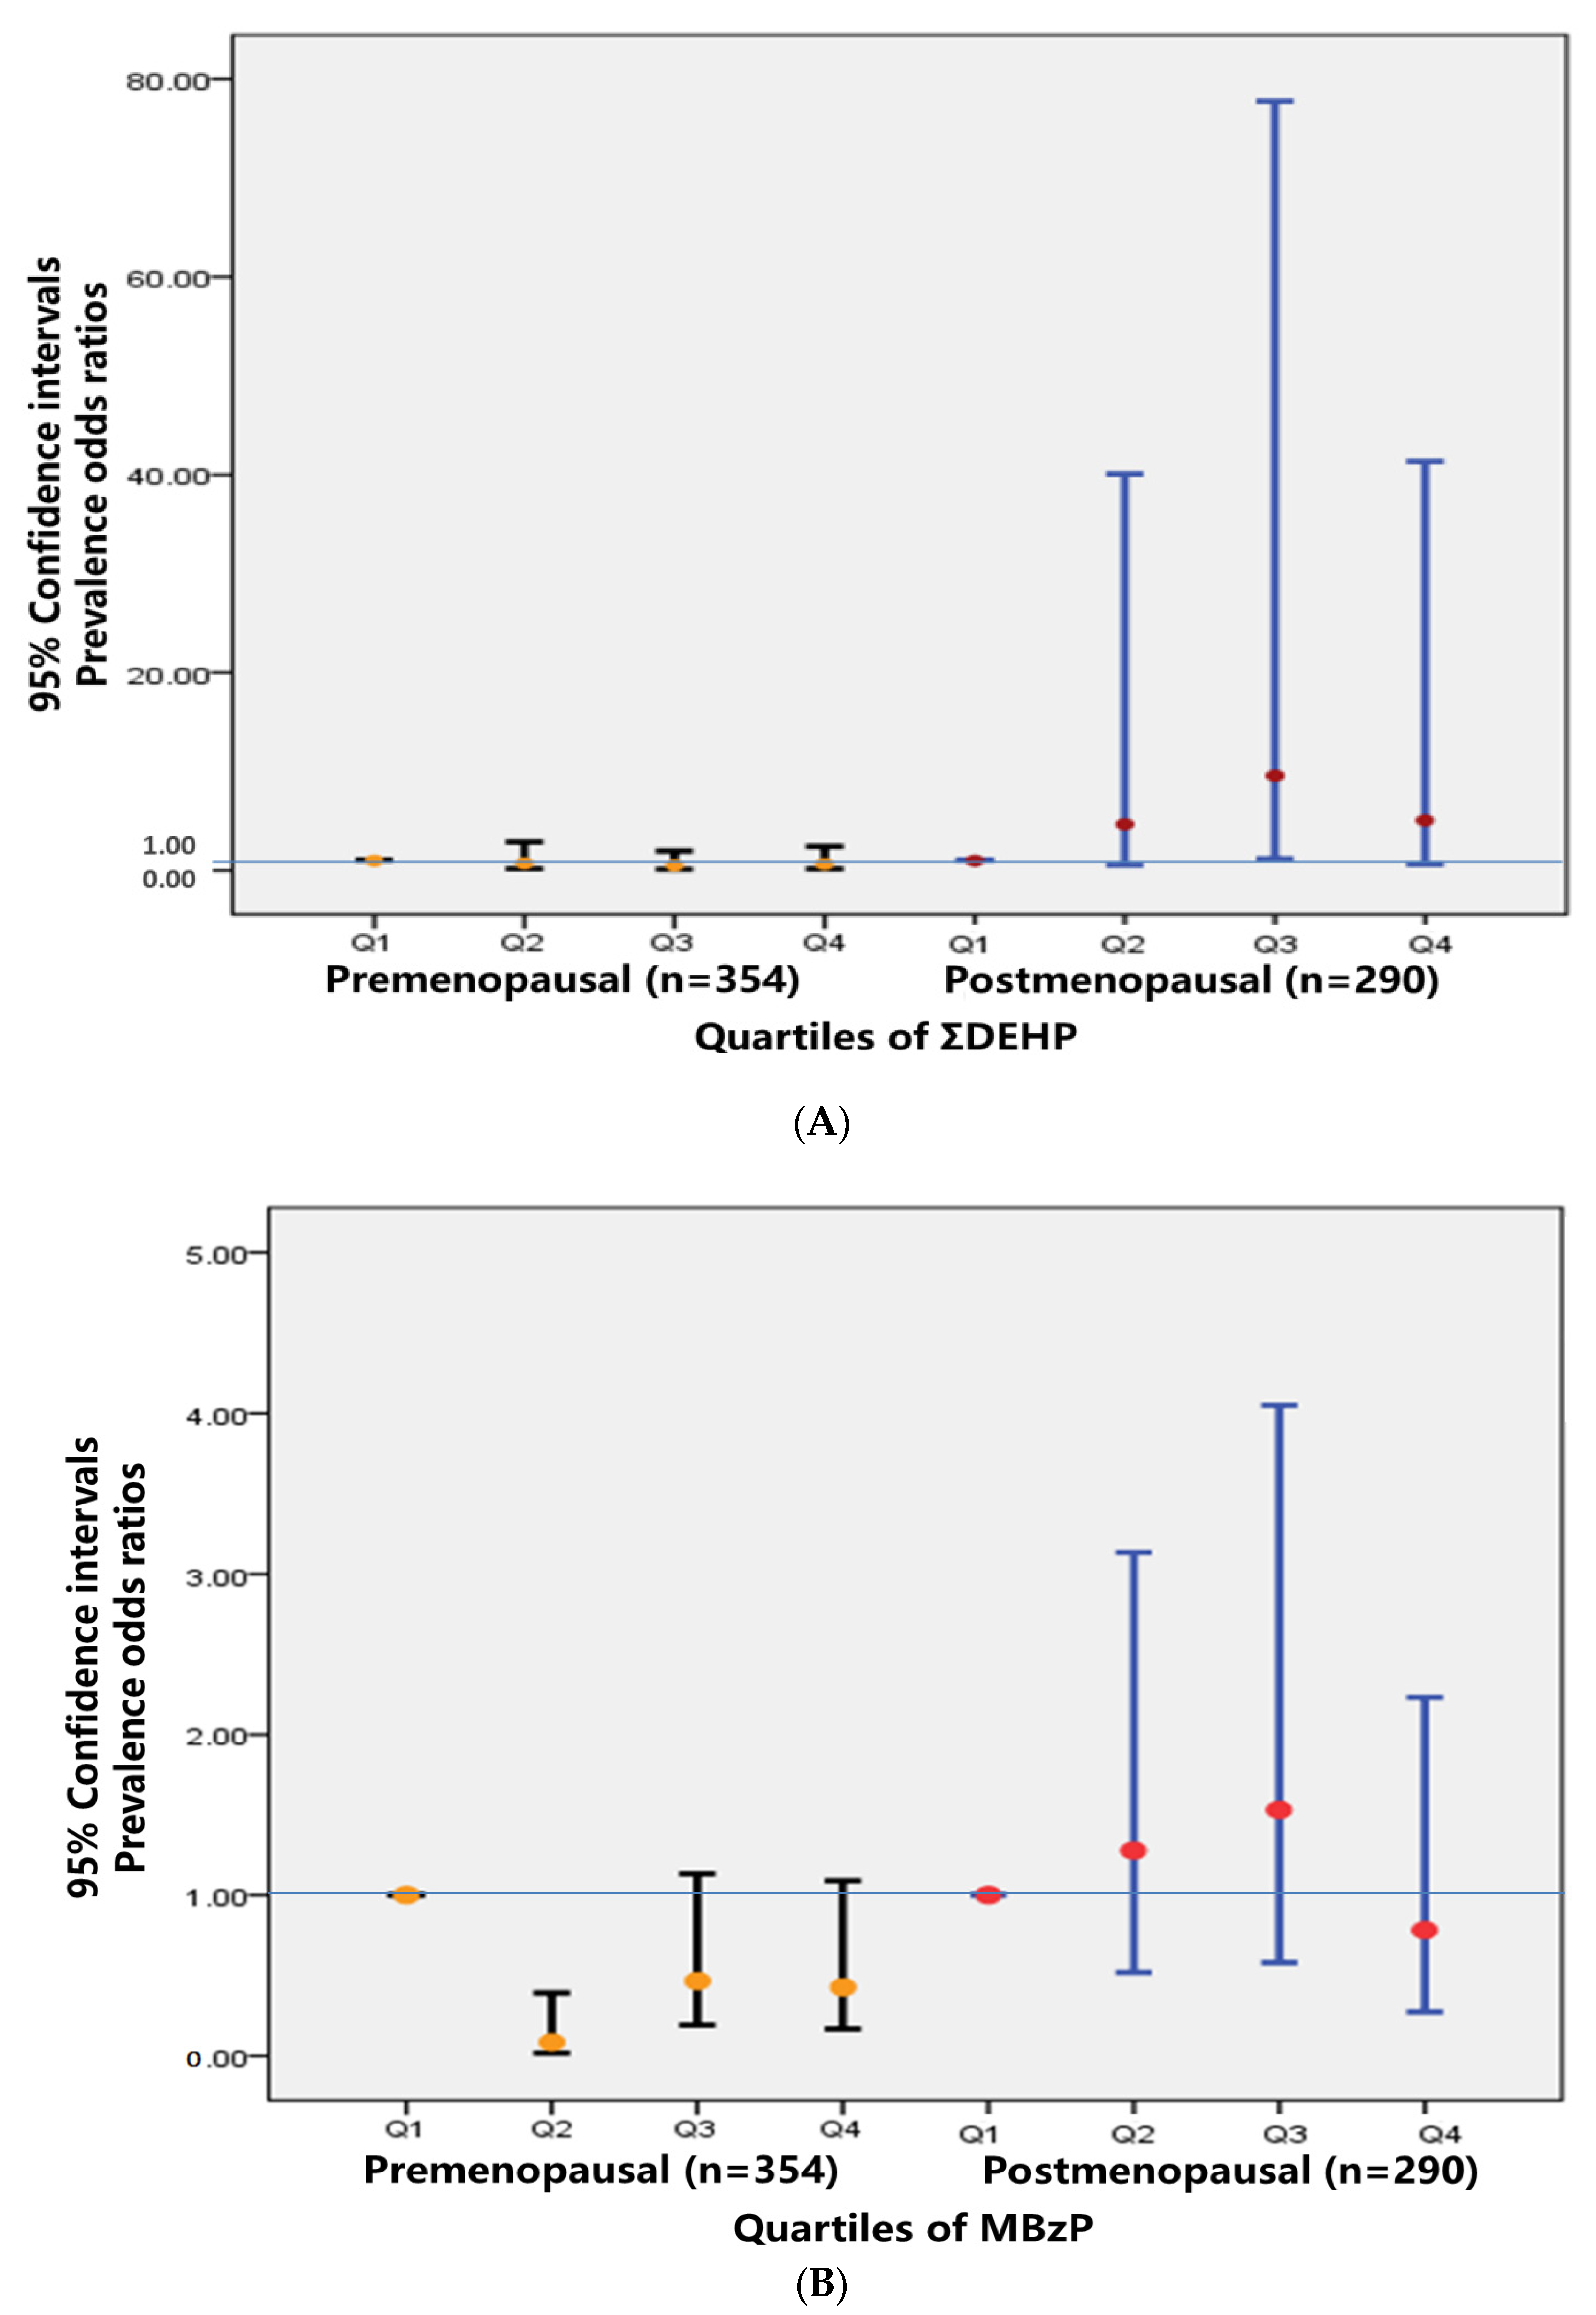
3.6. Associations between Quartiles of Phthalate Metabolites and MetS Stratified by Menopause
4. Discussion
5. Conclusions
Supplementary Materials
Author Contributions
Funding
Institutional Review Board Statement
Informed Consent Statement
Data Availability Statement
Acknowledgments
Conflicts of Interest
References
- Alberti, K.G.; Eckel, R.H.; Grundy, S.M.; Zimmet, P.Z.; Cleeman, J.I.; Donato, K.A.; Fruchart, J.-C.; James, W.P.T.; Loria, C.M.; Smith, S.C., Jr. Harmonizing the Metabolic Syndrome: A Joint Interim Statement of the International Diabetes Federation Task Force on Epidemiology and Prevention; National Heart, Lung, and Blood Institute; American Heart Association; World Heart Federation; International Atherosclerosis Society; and International Association for the Study of Obesity. Circulation 2009, 120, 1640–1645. [Google Scholar] [PubMed] [Green Version]
- Cornier, M.-A.; Dabelea, D.; Hernandez, T.L.; Lindstrom, R.C.; Steig, A.J.; Stob, N.R.; Van Pelt, R.E.; Wang, H.; Eckel, R.H. The metabolic syndrome. Endocr. Rev. 2008, 29, 777–822. [Google Scholar] [CrossRef] [PubMed]
- Saklayen, M.G. The global epidemic of the metabolic syndrome. Curr. Hypertens. Rep. 2018, 20, 12. [Google Scholar] [CrossRef] [Green Version]
- Frisardi, V.; Solfrizzi, V.; Seripa, D.; Capurso, C.; Santamato, A.; Sancarlo, D.; Vendemiale, G.; Pilotto, A.; Panza, F. Metabolic-cognitive syndrome: A cross-talk between metabolic syndrome and Alzheimer’s disease. Ageing Res. Rev. 2010, 9, 399–417. [Google Scholar] [CrossRef] [PubMed]
- Nam, G.E.; Kim, S.M.; Han, K.; Kim, N.H.; Chung, H.S.; Kim, J.W.; Han, B.; Cho, S.J.; Yu, J.H.; Park, Y.G. Metabolic syndrome and risk of Parkinson disease: A nationwide cohort study. PLoS Med. 2018, 15, e1002640. [Google Scholar] [CrossRef] [PubMed] [Green Version]
- O’Neill, S.; O’Driscoll, L. Metabolic syndrome: A closer look at the growing epidemic and its associated pathologies. Obes. Rev. 2015, 16, 1–12. [Google Scholar] [CrossRef] [Green Version]
- Ranasinghe, P.; Mathangasinghe, Y.; Jayawardena, R.; Hills, A.P.; Misra, A. Prevalence and trends of metabolic syndrome among adults in the Asia-Pacific region: A systematic review. BMC Public Health 2017, 17, 101. [Google Scholar] [CrossRef] [Green Version]
- Gore, A.; Chappell, V.; Fenton, S.; Flaws, J.; Nadal, A.; Prins, G.; Toppari, J.; Zoeller, R. Executive summary to EDC-2: The Endocrine Society’s second scientific statement on endocrine-disrupting chemicals. Endocr. Rev. 2015, 36, 593–602. [Google Scholar] [CrossRef] [Green Version]
- Gore, A.C.; Chappell, V.A.; Fenton, S.E.; Flaws, J.A.; Nadal, A.; Prins, G.S.; Toppari, J.; Zoeller, R. EDC-2: The Endocrine Society’s second scientific statement on endocrine-disrupting chemicals. Endocr. Rev. 2015, 36, E1–E150. [Google Scholar] [CrossRef]
- Luís, C.; Algarra, M.; Câmara, J.S.; Perestrelo, R. Comprehensive insight from phthalates occurrence: From health outcomes to emerging analytical approaches. Toxics 2021, 9, 157. [Google Scholar] [CrossRef]
- Haverinen, E.; Fernandez, M.F.; Mustieles, V.; Tolonen, H. Metabolic syndrome and endocrine disrupting chemicals: An overview of exposure and health effects. Int. J. Environ. Res. Public Health 2021, 18, 13047. [Google Scholar] [CrossRef] [PubMed]
- Trasande, L.; Zoeller, R.T.; Hass, U.; Kortenkamp, A.; Grandjean, P.; Myers, J.P.; DiGangi, J.; Bellanger, M.; Hauser, R.; Legler, J. Estimating burden and disease costs of exposure to endocrine-disrupting chemicals in the European Union. J. Clin. Endocrinol. Metab. 2015, 100, 1245–1255. [Google Scholar] [CrossRef] [PubMed]
- Chen, C.Y.; Chou, Y.Y.; Lin, S.J.; Lee, C.C. Developing an intervention strategy to reduce phthalate exposure in Taiwanese girls. Sci. Total Environ. 2015, 517, 125–131. [Google Scholar] [CrossRef] [PubMed]
- Huang, P.-C.; Tsai, C.-H.; Liang, W.-Y.; Li, S.-S.; Pan, W.-H.; Chiang, H.-C. Age and gender differences in urinary levels of eleven phthalate metabolites in general Taiwanese population after a DEHP episode. PLoS ONE 2015, 10, e0133782. [Google Scholar] [CrossRef] [Green Version]
- Huang, P.-C.; Tsai, C.-H.; Liang, W.-Y.; Li, S.-S.; Huang, H.-B.; Kuo, P.-L. Early phthalates exposure in pregnant women is associated with alteration of thyroid hormones. PLoS ONE 2016, 11, e0159398. [Google Scholar] [CrossRef] [Green Version]
- Chang, J.-W.; Lee, C.-C.; Pan, W.-H.; Chou, W.-C.; Huang, H.-B.; Chiang, H.-C.; Huang, P.-C. Estimated daily intake and cumulative risk assessment of phthalates in the general Taiwanese after the 2011 DEHP food scandal. Sci. Rep. 2017, 7, 45009. [Google Scholar] [CrossRef]
- Hsieh, C.-J.; Chang, Y.-H.; Hu, A.; Chen, M.-L.; Sun, C.-W.; Situmorang, R.F.; Wu, M.-T.; Wang, S.-L.; Group, T.S. Personal care products use and phthalate exposure levels among pregnant women. Sci. Total Environ. 2019, 648, 135–143. [Google Scholar] [CrossRef]
- Chuang, S.-C.; Chen, H.-C.; Sun, C.-W.; Chen, Y.-A.; Wang, Y.-H.; Chiang, C.-J.; Chen, C.-C.; Wang, S.-L.; Chen, C.-J.; Hsiung, C.A. Phthalate exposure and prostate cancer in a population-based nested case-control study. Environ. Res. 2020, 181, 108902. [Google Scholar] [CrossRef]
- Kahn, L.G.; Philippat, C.; Nakayama, S.F.; Slama, R.; Trasande, L. Endocrine-disrupting chemicals: Implications for human health. Lancet Diabetes Endocrinol. 2020, 8, 703–718. [Google Scholar] [CrossRef]
- Trasande, L.; Zoeller, R.T.; Hass, U.; Kortenkamp, A.; Grandjean, P.; Myers, J.P.; DiGangi, J.; Hunt, P.M.; Rudel, R.; Sathyanarayana, S.; et al. Burden of disease and costs of exposure to endocrine disrupting chemicals in the European Union: An updated analysis. Andrology 2016, 4, 565–572. [Google Scholar] [CrossRef] [Green Version]
- Milošević, N.; Milanović, M.; Sudji, J.; Bosić Živanović, D.; Stojanoski, S.; Vuković, B.; Milić, N.; Medić Stojanoska, M. Could phthalates exposure contribute to the development of metabolic syndrome and liver disease in humans? Environ. Sci. Pollut. Res. Int. 2020, 27, 772–784. [Google Scholar] [CrossRef] [PubMed]
- Ghosh, R.; Haque, M.; Turner, P.C.; Cruz-Cano, R.; Dallal, C.M. Racial and sex differences between urinary phthalates and metabolic syndrome among U.S. Adults: NHANES 2005–2014. Int. J. Environ. Res. Public Health 2021, 18, 6870. [Google Scholar] [CrossRef] [PubMed]
- James-Todd, T.M.; Huang, T.; Seely, E.W.; Saxena, A.R. The association between phthalates and metabolic syndrome: The national health and nutrition examination survey 2001–2010. Environ. Health 2016, 15, 52. [Google Scholar] [CrossRef] [Green Version]
- Gaston, S.A.; Tulve, N.S. Urinary phthalate metabolites and metabolic syndrome in U.S. Adolescents: Cross-sectional results from the National Health and Nutrition Examination Survey (2003–2014) data. Int. J. Hyg. Environ. Health 2019, 222, 195–204. [Google Scholar] [CrossRef] [PubMed]
- Shim, Y.H.; Ock, J.W.; Kim, Y.-J.; Kim, Y.; Kim, S.Y.; Kang, D. Association between heavy metals, bisphenol A, volatile organic compounds and phthalates and metabolic syndrome. Int. J. Environ. Res. Public Health 2019, 16, 671. [Google Scholar] [CrossRef] [PubMed] [Green Version]
- Huang, P.L. A comprehensive definition for metabolic syndrome. Dis. Models Mech. 2009, 2, 231–237. [Google Scholar] [CrossRef] [Green Version]
- Health Promotion Administration, Ministry of Health and Welfare. Metabolic Syndrome. Available online: https://www.hpa.gov.tw/pages/list.aspx?nodeid=221 (accessed on 1 April 2022).
- O’Brien, K.M.; Upson, K.; Cook, N.R.; Weinberg, C.R. Environmental chemicals in urine and blood: Improving methods for creatinine and lipid adjustment. Environ. Health Perspect. 2016, 124, 220–227. [Google Scholar] [CrossRef]
- Liu, C.-S.; Huang, Y.-C.; Liao, P.-T.; Lin, C.-C.; Li, T.-C.; Yeh, C.-C. The risk factors of metabolic syndrome. J. Chang. Gung Inst. Technol. 2012, 16, 1–14. [Google Scholar]
- Zamora, A.N.; Jansen, E.C.; Tamayo-Ortiz, M.; Goodrich, J.M.; Sánchez, B.N.; Watkins, D.J.; Tamayo-Orozco, J.A.; Téllez-Rojo, M.M.; Mercado-García, A.; Baylin, A.; et al. Exposure to phenols, phthalates, and parabens and development of metabolic syndrome among Mexican women in midlife. Front. Public Health 2021, 9, 620769. [Google Scholar] [CrossRef]
- Sears, C.G.; Braun, J.M. Phthalate exposure, adolescent health, and the need for primary prevention. Endocrinol. Metab. Clin. 2020, 49, 759–770. [Google Scholar] [CrossRef]
- Silva, M.J.; Barr, D.B.; Reidy, J.A.; Malek, N.A.; Hodge, C.C.; Caudill, S.P.; Brock, J.W.; Needham, L.L.; Calafat, A.M. Urinary levels of seven phthalate metabolites in the US population from the National Health and Nutrition Examination Survey (NHANES) 1999–2000. Environ. Health Perspect. 2004, 112, 331–338. [Google Scholar] [CrossRef] [PubMed]
- Huang, T.; Saxena, A.R.; Isganaitis, E.; James-Todd, T. Gender and racial/ethnic differences in the associations of urinary phthalate metabolites with markers of diabetes risk: National Health and Nutrition Examination Survey 2001–2008. Environ. Health 2014, 13, 6. [Google Scholar] [CrossRef] [PubMed] [Green Version]
- Parlett, L.E.; Calafat, A.M.; Swan, S.H. Women’s exposure to phthalates in relation to use of personal care products. J. Expo. Sci. Environ. Epidemiol. 2013, 23, 197–206. [Google Scholar] [CrossRef] [PubMed]
- Tang-Péronard, J.L.; Andersen, H.R.; Jensen, T.K.; Heitmann, B.L. Endocrine-disrupting chemicals and obesity development in humans: A review. Obes. Rev. 2011, 12, 622–636. [Google Scholar] [CrossRef]
- Grindler, N.M.; Allsworth, J.E.; Macones, G.A.; Kannan, K.; Roehl, K.A.; Cooper, A.R. Persistent organic pollutants and early menopause in US women. PLoS ONE 2015, 10, e0116057. [Google Scholar] [CrossRef] [PubMed]
- Díaz Santana, M.V.; Hankinson, S.E.; Bigelow, C.; Sturgeon, S.R.; Zoeller, R.T.; Tinker, L.; Manson, J.A.E.; Calafat, A.M.; Meliker, J.R.; Reeves, K.W. Urinary concentrations of phthalate biomarkers and weight change among postmenopausal women: A prospective cohort study. Environ. Health 2019, 18, 1–12. [Google Scholar] [CrossRef] [PubMed] [Green Version]
- Shen, O.; Du, G.; Sun, H.; Wu, W.; Jiang, Y.; Song, L.; Wang, X. Comparison of in vitro hormone activities of selected phthalates using reporter gene assays. Toxicol. Lett. 2009, 191, 9–14. [Google Scholar] [CrossRef]
- Caporossi, L.; Viganò, P.; Paci, E.; Capanna, S.; Alteri, A.; Campo, G.; Pigini, D.; De Rosa, M.; Tranfo, G.; Papaleo, B. Female reproductive health and exposure to phthalates and bisphenol A: A cross sectional study. Toxics 2021, 9, 299. [Google Scholar] [CrossRef]
- Weiss, J.M.; Gustafsson, Å.; Gerde, P.; Bergman, Å.; Lindh, C.H.; Krais, A.M. Daily intake of phthalates, MEHP, and DINCH by ingestion and inhalation. Chemosphere 2018, 208, 40–49. [Google Scholar] [CrossRef]
- James-Todd, T.; Stahlhut, R.; Meeker, J.D.; Powell, S.G.; Hauser, R.; Huang, T.; Rich-Edwards, J. Urinary phthalate metabolite concentrations and diabetes among women in the National Health and Nutrition Examination Survey (NHANES) 2001–2008. Environ. Health Perspect. 2012, 120, 1307–1313. [Google Scholar] [CrossRef] [Green Version]
- Balk, S.J.; Etzel, R.A. Chapter 41—Plasticizer. In Pediatric Environmental Health, 4th ed.; American Academy of Pediatrics: Itasca, IL, USA, 2018. [Google Scholar]
- Bekö, G.; Weschler, C.J.; Langer, S.; Callesen, M.; Toftum, J.; Clausen, G. Children’s phthalate intakes and resultant cumulative exposures estimated from urine compared with estimates from dust ingestion, inhalation and dermal absorption in their homes and daycare centers. PLoS ONE 2013, 8, e62442. [Google Scholar] [CrossRef] [PubMed] [Green Version]
- Krais, A.M.; Andersen, C.; Eriksson, A.C.; Johnsson, E.; Nielsen, J.; Pagels, J.; Gudmundsson, A.; Lindh, C.H.; Wierzbicka, A. Excretion of urinary metabolites of the phthalate esters dep and DEHP in 16 volunteers after inhalation and dermal exposure. Int. J. Environ. Res. Public Health 2018, 15, 2514. [Google Scholar] [CrossRef] [PubMed] [Green Version]
- Diamanti-Kandarakis, E.; Bourguignon, J.-P.; Giudice, L.C.; Hauser, R.; Prins, G.S.; Soto, A.M.; Zoeller, R.T.; Gore, A.C. Endocrine-disrupting chemicals: An Endocrine Society Scientific statement. Endocr. Rev. 2009, 30, 293–342. [Google Scholar] [CrossRef] [PubMed]
- Lovekamp-Swan, T.; Davis, B.J. Mechanisms of phthalate ester toxicity in the female reproductive system. Environ. Health Perspect. 2003, 111, 139–145. [Google Scholar] [CrossRef] [PubMed] [Green Version]
- Park, C.; Lee, J.; Kong, B.; Park, J.; Song, H.; Choi, K.; Guon, T.; Lee, Y. The effects of bisphenol A, benzyl butyl phthalate, and di (2-ethylhexyl) phthalate on estrogen receptor alpha in estrogen receptor-positive cells under hypoxia. Environ. Pollut. 2019, 248, 774–781. [Google Scholar] [CrossRef]
- Huang, P.C.; Li, W.F.; Liao, P.C.; Sun, C.W.; Tsai, E.M.; Wang, S.L. Risk for estrogen-dependent diseases in relation to phthalate exposure and polymorphisms of cyp17a1 and estrogen receptor genes. Environ. Sci. Pollu. Res. 2014, 21, 13964–13973. [Google Scholar] [CrossRef]


| Total (n = 1337) | p | Males (n = 693) | p | Females (n = 644) | p | ||||
|---|---|---|---|---|---|---|---|---|---|
| MetS | No MetS | MetS | No MetS | MetS | No MetS | ||||
| (n = 219) | (n = 1118) | <0.001 | (n = 91) | (n = 602) | (n = 128) | (n = 516) | |||
| N (%) | |||||||||
| Age | 219 (16.40) | 1118 (83.60) | <0.001 | 91 (13.10) | 602 (86.90) | 0.077 | 128 (19.90) | 516 (80.10) | <0.001 |
| 30–39 | 44 (3.30) | 304 (22.70) | 20 (2.90) | 160 (23.10) | 24 (3.70) | 144 (22.40) | |||
| 40–49 | 36 (2.70) | 285 (21.30) | 13 (1.90) | 143 (20.60) | 23 (3.60) | 142 (22.00) | |||
| 50–59 | 74 (5.50) | 302 (22.60) | 31 (4.50) | 161 (23.20) | 43 (6.70) | 141 (21.90) | |||
| 60–70 | 65 (4.90) | 227 (17.00) | 27 (3.90) | 138 (19.90) | 38 (5.90) | 89 (13.80) | |||
| Education level | 219 (16.40) | 1118 (83.60) | 0.003 | 91 (13.10) | 602 (86.90) | 0.013 | 128 (19.90) | 516 (80.10) | 0.034 |
| Illiterate | 1 (0.10) | 1 (0.10) | 0 (0.00) | 0 (0.00) | 1 (0.20) | 1 (0.20) | |||
| Literate | 1 (0.11) | 1 (0.11) | 1 (1.10) | 0 (0.00) | 0 (0.00) | 1 (0.20) | |||
| Elementary | 13 (1.00) | 46 (3.40) | 1 (1.10) | 22 (3.20) | 12 (1.90) | 24 (3.70) | |||
| Junior | 15 (1.10) | 76 (5.70) | 5 (0.70) | 37 (5.30) | 10 (1.60) | 39 (6.10) | |||
| Senior | 71 (5.30) | 318 (23.80) | 25 (3.60) | 146 (21.10) | 46 (7.20) | 172 (26.80) | |||
| Undergraduate | 112 (8.30) | 548 (41.00) | 54 (7.80) | 309 (44.60) | 58 (8.90) | 239 (37.10) | |||
| Graduate | 6 (0.40) | 128 (9.60) | 5 (0.70) | 88 (12.70) | 1 (0.20) | 40 (6.20) | |||
| Marriage | 219 (16.40) | 1118 (83.60) | 0.132 | 91 (13.20) | 602 (86.80) | 0.704 | 128 (19.90) | 516 (80.10) | 0.043 |
| Single | 25 (1.90) | 161 (12.10) | 10 (1.40) | 77 (11.10) | 15 (2.30) | 84 (13.10) | |||
| Married | 170 (12.70) | 836 (62.50) | 74 (10.70) | 495 (71.40) | 96 (14.90) | 341 (52.90) | |||
| Separated/Divorced | 11 (0.80) | 82 (6.10) | 5 (0.70) | 23 (3.30) | 6 (0.90) | 59 (9.20) | |||
| Widowed | 13 (1.00) | 39 (2.90) | 2 (0.30) | 7 (1.00) | 11 (1.70) | 32 (5.00) | |||
| Working Status | 161 (16.93) | 790 (83.07) | 0.002 | 67 (14.00) | 411 (86.00) | 0.048 | 94 (19.90) | 379 (80.10) | 0.033 |
| Yes | 87 (9.15) | 528 (55.52) | 39 (8.20) | 289 (60.50) | 48 (10.10) | 239 (50.00) | |||
| No | 74 (7.78) | 262 (27.55) | 28 (5.90) | 122 (25.50) | 46 (9.70) | 140 (29.60) | |||
| Alcohol Consumption Status | 219 (16.40) | 1118 (83.60) | 0.327 | 91 (13.20) | 602 (86.80) | 0.035 | 128 (19.90) | 516 (80.10) | 0.700 |
| No | 189 (14.10) | 1000 (74.80) | 66 (9.50) | 499 (72.00) | 123 (19.10) | 501 (77.80) | |||
| Ever, Stop drinking | 10 (0.70) | 33 (2.50) | 9 (1.30) | 28 (4.00) | 1 (0.20) | 5 (0.80) | |||
| Yes | 20 (1.50) | 85 (6.40) | 16 (2.30) | 75 (10.80) | 4 (0.60) | 10 (1.60) | |||
| Smoking Status | 219 (16.40) | 1118 (83.60) | 0.383 | 91 (13.20) | 602 (86.80) | 0.483 | 128 (19.90) | 516 (80.10) | 0.79 |
| Never Smoker | 173 (12.90) | 847 (63.40) | 55 (7.90) | 363 (52.40) | 118 (18.30) | 484 (75.20) | |||
| Former Smoker | 28 (2.10) | 144 (10.80) | 23 (3.30) | 127 (18.30) | 5 (0.80) | 17 (2.60) | |||
| Current Smoker | 18 (1.30) | 127 (9.50) | 13 (1.90) | 112 (16.20) | 5 (0.80) | 15 (2.30) | |||
| Betel Nut Consumption | 219 (16.40) | 1118 (83.60) | 0.092 | 91 (13.20) | 602 (86.80) | 0.014 | 128 (19.90) | 516 (80.10) | 0.618 |
| No | 212 (15.90) | 1098 (82.10) | 84 (12.10) | 583 (84.10) | 128 (19.90) | 515 (80.00) | |||
| Occasional or Socializing | 6 (0.40) | 11 (0.80) | 6 (0.90) | 10 (1.40) | 0 (0.00) | 1 (0.20) | |||
| Yes (Every Day) | 1 (0.10) | 9 (0.70) | 1 (0.10) | 9 (1.30) | 0 (0.00) | 0 (0.00) | |||
| Regular Exercise | 219 (16.40) | 1118 (83.60) | 0.894 | 91 (13.20) | 602 (86.80) | 0.147 | 128 (19.90) | 516 (80.10) | 0.078 |
| Yes | 94 (7.00) | 474 (35.50) | 35 (5.10) | 280 (40.50) | 59 (9.20) | 194 (30.10) | |||
| No | 125 (9.40) | 644 (48.10) | 56 (8.10) | 322 (46.40) | 69 (10.70) | 322 (50.00) | |||
| Weight Control | 219 (16.4) | 1118 (83.6) | 0.970 | 91 (13.20) | 602 (86.80) | 0.710 | 128 (19.90) | 516 (80.10) | 0.468 |
| Yes | 154 (11.50) | 721 (53.90) | 68 (9.80) | 392 (56.60) | 86 (13.40) | 329 (51.10) | |||
| No | 65 (4.90) | 397 (29.70) | 23 (13.10) | 210 (30.30) | 42 (6.50) | 187 (29.00) | |||
| Menopausal Status | - | - | - | - | - | - | 128 (19.90) | 516 (80.10) | 0.004 |
| Premenopausal | - | - | - | - | 56 (8.70) | 298 (46.30) | |||
| Postmenopausal | - | - | - | - | 72 (11.20) | 218 (33.90) | |||
| Metabolic Syndrome | No Metabolic Syndrome | p | |||||
|---|---|---|---|---|---|---|---|
| (n = 219) | (n = 1118) | ||||||
| Geometric Mean (95% CI) | Geometric Mean (95% CI) | ||||||
| MEHP | 10.98 | (10.82, | 11.15) | 9.43 | (9.27, | 9.59) | 0.058 |
| MEOHP | 8.02 | (7.91, | 8.14) | 8.00 | (7.88, | 8.12) | 0.961 |
| MEHHP | 12.87 | (12.75, | 12.99) | 12.83 | (12.70, | 12.95) | 0.960 |
| MECPP | 18.60 | (18.49, | 18.71) | 18.58 | (18.46, | 18.69) | 0.979 |
| MCMHP | 4.50 | (4.32, | 4.67) | 4.02 | (3.83, | 4.20) | 0.214 |
| MBzP | 1.13 | (0.98, | 1.28) | 1.15 | (0.99, | 1.30) | 0.875 |
| MEP | 15.28 | (15.04, | 15.52) | 12.07 | (11.85, | 12.29) | 0.026 |
| MiBP | 8.25 | (8.12, | 8.38) | 9.18 | (9.04, | 9.33) | 0.141 |
| MnBP | 20.85 | (20.72, | 20.98) | 21.36 | (21.23, | 21.49) | 0.714 |
| MMP | 2.28 | (2.13, | 2.44) | 2.07 | (1.91, | 2.23) | 0.223 |
| MiNP | 0.45 | (0.31, | 0.58) | 0.43 | (0.30, | 0.56) | 0.539 |
| ΣHMW | 37.91 | (37.80, | 38.03) | 36.14 | (36.03, | 36.26) | 0.390 |
| ΣLMW | 62.22 | (62.08, | 62.35) | 58.28 | (58.15, | 58.41) | 0.319 |
| ΣDEHP | 61.97 | (61.86, | 62.08) | 59.83 | (59.72, | 59.94) | 0.508 |
| ΣDBP | 31.37 | (31.26, | 31.48) | 33.09 | (32.97, | 33.21) | 0.382 |
| Phthalate Metabolites | Overall | Males | Females | ||||||||||||||||
|---|---|---|---|---|---|---|---|---|---|---|---|---|---|---|---|---|---|---|---|
| (n = 1337) | (n = 693) | (n = 644) | |||||||||||||||||
| Model 1 a | Model 2 b | Model 1 a | Model 2 c | Model 1 a | Model 2 c | ||||||||||||||
| MEHP | |||||||||||||||||||
| Q1 | Ref | Ref | Ref | Ref | Ref | Ref | |||||||||||||
| Q2 | 0.81 | (0.52, | 1.25) | 0.63 | (0.36, | 1.12) | 0.72 | (0.44, | 1.20) | 0.66 | (0.36, | 1.20) | 1.10 | (0.42, | 2.90) | 1.43 | (0.13, | 15.46) | |
| Q3 | 1.10 | (0.73, | 1.65) | 0.80 | (0.44, | 1.48) | 0.93 | (0.49, | 1.73) | 0.85 | (0.41, | 1.76) | 0.99 | (0.43, | 2.30) | 2.14 | (0.25, | 18.49) | |
| Q4 | 1.29 | (0.86, | 1.94) | 0.72 | (0.36, | 1.43) | 0.00 | (0.00, | -----) | 0.00 | (0.00, | -----) | 1.10 | (0.49, | 2.50) | 2.01 | (0.24, | 17.04) | |
| MEOHP | |||||||||||||||||||
| Q1 | Ref | Ref | Ref | Ref | Ref | Ref | |||||||||||||
| Q2 | 0.81 | (0.53, | 1.23) | 0.80 | (0.49, | 1.29) | 0.83 | (0.46, | 1.47) | 0.93 | (0.48, | 1.79) | 0.75 | (0.40, | 1.38) | 0.68 | (0.33, | 1.39) | |
| Q3 | 1.01 | (0.67, | 1.51) | 0.88 | (0.54, | 1.42) | 0.54 | (0.28, | 1.04) # | 0.48 | (0.21, | 1.09) * | 1.31 | (0.75, | 2.29) | 1.12 | (0.59, | 2.13) | |
| Q4 | 0.95 | (0.63, | 1.42) | 0.64 | (0.38, | 1.07) * | 0.96 | (0.53, | 1.75) | 0.87 | (0.41, | 1.83) | 0.86 | (0.48, | 1.52) | 0.54 | (0.26, | 1.09) # | |
| MEHHP | |||||||||||||||||||
| Q1 | Ref | Ref | Ref | Ref | Ref | Ref | |||||||||||||
| Q2 | 1.02 | (0.68, | 1.53) | 1.16 | (0.73, | 1.84) | 0.95 | (0.54, | 1.67) | 1.19 | (0.62, | 2.30) | 1.10 | (0.61, | 1.96) | 1.12 | (0.58, | 2.17) | |
| Q3 | 0.85 | (0.56, | 1.30) | 0.72 | (0.43, | 1.18) | 0.57 | (0.29, | 1.12) | 0.57 | (0.25, | 1.31) | 1.01 | (0.58, | 1.77) | 0.83 | (0.43, | 1.58) | |
| Q4 | 1.02 | (0.68, | 1.53) | 0.83 | (0.51, | 1.36) | 0.88 | (0.48, | 1.62) | 0.81 | (0.38, | 1.71) | 1.11 | (0.64, | 1.94) | 0.87 | (0.45, | 1.68) | |
| MECPP | |||||||||||||||||||
| Q1 | Ref | Ref | Ref | Ref | Ref | Ref | |||||||||||||
| Q2 | 0.85 | (0.56, | 1.29) | 0.79 | (0.48, | 1.31) | 0.66 | (0.37, | 1.17) | 0.65 | (0.33, | 1.28) | 1.07 | (0.57, | 2.01) | 1.22 | (0.56, | 2.70) | |
| Q3 | 1.07 | (0.71, | 1.59) | 0.91 | (0.56, | 1.49) | 0.82 | (0.46, | 1.47) | 0.65 | (0.32, | 1.34) | 1.23 | (0.67, | 2.24) | 1.50 | (0.70, | 3.18) | |
| Q4 | 0.90 | (0.59, | 1.35) | 0.74 | (0.45, | 1.23) | 0.50 | (0.25, | 0.99) * | 0.46 | (0.20, | 1.02) # | 1.16 | (0.64, | 2.10) | 1.26 | (0.59, | 2.70) | |
| MCMHP | |||||||||||||||||||
| Q1 | Ref | Ref | Ref | Ref | Ref | Ref | |||||||||||||
| Q2 | 1.21 | (0.79, | 1.85) | 1.22 | (0.71, | 2.09) | 1.02 | (0.56, | 1.86) | 1.21 | (0.61, | 2.37) | 1.03 | (0.50, | 2.19) | 1.73 | (0.53, | 5.71) | |
| Q3 | 1.38 | (0.91, | 2.10) | 1.42 | (0.83, | 2.45) | 1.15 | 0.62, | 2.12) | 1.22 | (0.58, | 2.56) | 1.13 | (0.56, | 2.31) | 2.13 | (0.66, | 6.95) | |
| Q4 | 1.35 | (0.89, | 2.05) | 1.38 | (0.79, | 2.44) | 1.06 | (0.59, | 1.92) | 1.35 | (0.62, | 2.92) | 1.23 | (0.60, | 2.53) | 1.97 | (0.59, | 6.56) | |
| MBzP | |||||||||||||||||||
| Q1 | Ref | Ref | Ref | Ref | Ref | Ref | |||||||||||||
| Q2 | 0.59 | (0.39, | 0.91) * | 0.65 | (0.40, | 1.04) # | 0.70 | (0.37, | 1.33) | 0.85 | (0.42, | 1.73) | 0.49 | (0.27, | 0.87) * | 0.50 | (0.26, | 0.96) * | |
| Q3 | 0.93 | (0.63, | 1.39) | 1.07 | (0.66, | 1.72) | 0.97 | (0.53, | 1.76) | 1.26 | (0.61, | 2.60) | 0.84 | (0.49, | 1.44) | 0.85 | (0.45, | 1.62) | |
| Q4 | 0.89 | (0.60, | 1.33) | 0.88 | (0.53, | 1.46) | 0.98 | (0.54, | 1.79) | 1.55 | (0.73, | 3.29) | 0.77 | (0.45, | 1.32) | 0.55 | (0.27, | 1.09) | |
| MEP | |||||||||||||||||||
| Q1 | Ref | Ref | Ref | Ref | Ref | Ref | |||||||||||||
| Q2 | 1.51 | (0.98, | 2.32) # | 1.40 | (0.81, | 2.42) | 2.29 | (1.21, | 4.33) * | 2.03 | (0.93, | 4.42) # | 0.99 | (0.55, | 1.80) | 0.93 | (0.43, | 2.00) | |
| Q3 | 1.58 | (1.03, | 2.43) * | 1.65 | (0.98, | 2.79) # | 1.75 | (0.91, | 3.39) | 2.13 | (1.01, | 4.50) * | 1.37 | (0.78, | 2.42) | 1.22 | (0.58, | 2.57) | |
| Q4 | 1.45 | (0.94, | 2.24) # | 1.46 | (0.86, | 2.47) | 1.52 | (0.76, | 3.01) | 1.33 | (0.59, | 2.99) | 1.27 | (0.72, | 2.24) | 1.38 | (0.67, | 2.85) | |
| MiBP | |||||||||||||||||||
| Q1 | Ref | Ref | Ref | Ref | Ref | Ref | |||||||||||||
| Q2 | 0.71 | (0.47, | 1.07) | 0.60 | (0.37, | 0.96) * | 0.68 | (0.37, | 1.27) | 0.61 | (0.30, | 1.23) | 0.70 | (0.40, | 1.21) | 0.59 | (0.31, | 1.13) | |
| Q3 | 0.93 | (0.63, | 1.37) | 0.75 | (0.47, | 1.20) | 0.75 | (0.41, | 1.36) | 0.65 | (0.31, | 1.36) | 1.05 | (0.62, | 1.79) | 0.80 | (0.43, | 1.49) | |
| Q4 | 0.69 | (0.46, | 1.05) # | 0.64 | (0.39, | 1.06) # | 0.63 | (0.34, | 1.16) | 0.68 | (0.33, | 1.43) | 0.75 | (0.42, | 1.32) | 0.61 | (0.31, | 1.23) | |
| MnBP | |||||||||||||||||||
| Q1 | Ref | Ref | Ref | Ref | Ref | Ref | |||||||||||||
| Q2 | 1.27 | (0.84, | 1.92) | 1.26 | (0.79, | 2.00) | 1.43 | (0.76 | ,2.68) | 1.46 | (0.72, | 2.96) | 1.09 | (0.63, | 1.89) | 1.11 | (0.60, | 2.08) | |
| Q3 | 1.38 | (0.92, | 2.07) | 1.16 | (0.71, | 1.91) | 1.74 | (0.94, | 3.22) # | 1.55 | (0.74, | 3.28) | 1.11 | (0.64, | 1.92) | 0.92 | (0.47, | 1.79) | |
| Q4 | 0.93 | (0.60, | 1.44) | 0.89 | (0.53, | 1.49) | 0.94 | (0.48, | 1.84) | 1.02 | (0.48, | 2.18) | 0.90 | (0.50, | 1.60) | 0.81 | (0.40, | 1.65) | |
| MMP | |||||||||||||||||||
| Q1 | Ref | Ref | Ref | Ref | Ref | Ref | |||||||||||||
| Q2 | 1.12 | (0.74, | 1.71) | 1.05 | (0.61, | 1.79) | 1.19 | (0.66, | 2.15) | 1.47 | (0.74, | 2.95) | 0.63 | (0.32, | 1.24) | 0.52 | (0.22, | 1.27) | |
| Q3 | 1.17 | (0.77, | 1.79) | 1.06 | (0.62, | 1.82) | 1.33 | (0.74, | 2.39) | 1.33 | (0.65, | 2.72) | 0.60 | (0.30, | 1.18) | 0.57 | (0.23, | 1.37) | |
| Q4 | 1.30 | (0.85, | 1.98) | 1.16 | (0.67, | 2.03) | 1.09 | (0.57, | 2.08) | 1.34 | (0.61, | 2.94) | 0.76 | (0.39, | 1.49) | 0.62 | (0.25, | 1.52) | |
| MiNP | |||||||||||||||||||
| Q1 | Ref | Ref | Ref | Ref | Ref | Ref | |||||||||||||
| Q2 | 0.98 | (0.51, | 1.86) | 1.36 | (0.63, | 2.93) | 0.41 | (0.06, | 2.63) | 0.39 | (0.06, | 2.59) | 1.13 | (0.56, | 2.26) | 1.89 | (0.79, | 4.49) | |
| Q3 | 1.35 | (0.59, | 3.10) | 1.81 | (0.66, | 4.95) | 0.29 | (0.02, | 3.79) | 0.28 | (0.02, | 3.77) | 1.69 | (0.69, | 4.14) | 2.76 | (0.89, | 8.52) # | |
| Q4 | 1.43 | (0.47, | 4.31) | 2.06 | (0.55, | 7.72) | 0.76 | (0.03, | 19.12) | 0.72 | (0.03, | 19.65) | 1.58 | (0.48, | 5.18) | 2.83 | (0.65, | 12.31) | |
| ΣHMW | |||||||||||||||||||
| Q1 | Ref | Ref | Ref | Ref | Ref | Ref | |||||||||||||
| Q2 | 0.87 | (0.57, | 1.33) | 0.8 | (0.47, | 1.36) | 0.61 | (0.35, | 1.08) # | 0.65 | (0.33, | 1.27) | 1.13 | (0.52, | 2.46) | 1.60 | (0.49, | 5.30) | |
| Q3 | 1.05 | (0.70, | 1.58) | 0.81 | (0.47, | 1.39) | 0.79 | (0.43, | 1.44) | 0.65 | (0.30, | 1.40) | 1.08 | (0.51, | 2.27) | 1.48 | (0.47, | 4.72) | |
| Q4 | 1.16 | (0.78, | 1.75) | 0.75 | (0.43, | 1.32) | 0.82 | (0.40, | 1.67) | 0.81 | (0.35, | 1.90) | 1.10 | (0.53, | 2.28) | 1.26 | (0.40, | 4.00) | |
| ΣLMW | |||||||||||||||||||
| Q1 | Ref | Ref | Ref | Ref | Ref | Ref | |||||||||||||
| Q2 | 1.97 | (1.30, | 2.98) ** | 1.65 | (1.02, | 2.66) * | 2.03 | (1.12, | 3.66) * | 1.96 | (0.98, | 3.88) # | 1.87 | (1.04, | 3.36) * | 1.45 | (0.74, | 2.87) | |
| Q3 | 1.28 | (0.83, | 1.99) | 1.13 | (0.68, | 1.89) | 0.91 | (0.46, | 1.77) | 0.88 | (0.39, | 1.97) | 1.59 | (0.87, | 2.90) | 1.31 | (0.65, | 2.63) | |
| Q4 | 1.25 | (0.81, | 1.95) | 1.09 | (0.65, | 1.80) | 1.01 | (0.53, | 1.93) | 0.97 | (0.46, | 2.03) | 1.47 | (0.79, | 2.71) | 1.19 | (0.58, | 2.42) | |
| ΣDEHP | |||||||||||||||||||
| Q1 | Ref | Ref | Ref | Ref | Ref | Ref | |||||||||||||
| Q2 | 0.73 | (0.47, | 1.12) | 0.62 | (0.36, | 1.06) # | 0.52 | (0.29, | 0.94) * | 0.48 | (0.23, | 0.98) * | 1.02 | (0.48, | 2.16) | 1.41 | (0.48, | 4.16) | |
| Q3 | 1.23 | (0.83, | 1.83) | 0.90 | (0.54, | 1.49) | 0.82 | (0.46, | 1.46) | 0.75 | (0.38, | 1.47) | 1.59 | (0.79, | 3.22) | 1.88 | (0.66, | 5.33) | |
| Q4 | 1.05 | (0.70, | 1.58) | 0.69 | (0.40, | 1.18) | 0.64 | (0.31, | 1.30) | 0.52 | (0.22, | 1.24) | 1.24 | (0.62, | 2.49) | 1.41 | (0.50, | 3.99) | |
| ΣDBP | |||||||||||||||||||
| Q1 | Ref | Ref | Ref | Ref | Ref | Ref | |||||||||||||
| Q2 | 1.15 | (0.76, | 1.73) | 1.09 | (0.68, | 1.74) | 1.36 | (0.73, | 2.51) | 1.40 | (0.70, | 2.81) | 0.95 | (0.54, | 1.64) | 0.88 | (0.47, | 1.64) | |
| Q3 | 1.26 | (0.85, | 1.89) | 1.03 | (0.64, | 1.66) | 1.43 | (0.78, | 2.65) | 1.31 | (0.64, | 2.68) | 1.10 | (0.64, | 1.90) | 0.84 | (0.44, | 1.60) | |
| Q4 | 0.87 | (0.56, | 1.33) | 0.85 | (0.51, | 1.40) | 0.80 | (0.42, | 1.55) | 0.90 | (0.42, | 1.90) | 0.92 | (0.52, | 1.64) | 0.80 | (0.40, | 1.60) | |
| High Blood Pressure | Low HDL Cholesterol | High Waist Circumference | Hyperglycemia | Elevated Triglycerides | ||||||||||||
|---|---|---|---|---|---|---|---|---|---|---|---|---|---|---|---|---|
| n with/without component | 308/1029 | 381/956 | 601/736 | 267/1070 | 313/1024 | |||||||||||
| MEHP | Q1 | Ref | Ref | Ref | Ref | Ref | ||||||||||
| Q2 | 0.71 | (0.45, | 1.12) | 1.06 | (0.59, | 1.90) | 0.76 | (0.50, | 1.14) | 0.54 | (0.33, | 0.88) * | 0.78 | (0.49, | 1.24) | |
| Q3 | 0.85 | (0.50, | 1.43) | 1.17 | (0.64, | 2.17) | 0.84 | (0.53, | 1.33) | 0.55 | (0.31, | 0.95) * | 0.89 | (0.53, | 1.47) | |
| Q4 | 0.83 | (0.44, | 1.58) | 1.07 | (0.56, | 2.07) | 0.62 | (0.36, | 1.04) # | 0.88 | (0.47, | 1.64) | 0.76 | (0.42, | 1.38) | |
| MEOHP | Q1 | Ref | Ref | Ref | Ref | Ref | ||||||||||
| Q2 | 0.92 | (0.59, | 1.44) | 0.88 | (0.57, | 1.36) | 0.92 | (0.64, | 1.33) | 0.76 | (0.49, | 1.20) | 0.90 | (0.60, | 1.36) | |
| Q3 | 1.24 | (0.79. | 1.95) | 0.68 | (0.44, | 1.06) # | 0.93 | (0.64, | 1.35) | 0.88 | (0.56, | 1.38) | 0.81 | (0.53, | 1.24) | |
| Q4 | 0.73 | (0.45, | 1.19) | 0.71 | (0.45, | 1.10) | 0.85 | (0.58, | 1.25) | 0.97 | (0.62, | 1.53) | 0.82 | (0.53, | 1.27) | |
| MEHHP | Q1 | Ref | Ref | Ref | Ref | Ref | ||||||||||
| Q2 | 1.00 | (0.64, | 1.56) | 1.05 | (0.69, | 1.61) | 0.94 | (0.65, | 1.35) | 0.75 | (0.48, | 1.16) | 1.36 | (0.91, | 2.03) | |
| Q3 | 0.97 | (0.61, | 1.54) | 0.87 | (0.57, | 1.32) | 0.86 | (0.60, | 1.24) | 0.62 | (0.39, | 0.99) * | 0.82 | (0.53, | 1.26) | |
| Q4 | 0.95 | (0.60, | 1.50) | 0.84 | (0.55, | 1.30) | 0.93 | (0.64, | 1.34) | 0.98 | (0.63, | 1.50) | 0.87 | (0.56, | 1.34) | |
| MECPP | Q1 | Ref | Ref | Ref | Ref | Ref | ||||||||||
| Q2 | 0.96 | (0.61, | 1.50) | 1.44 | (0.92, | 2.26) | 0.75 | (0.51, | 1.09) | 0.69 | (0.43, | 1.10) | 1.27 | (0.83, | 1.94) | |
| Q3 | 1.05 | (0.66, | 1.66) | 0.93 | (0.59, | 1.47) | 1.15 | (0.79, | 1.67) | 0.78 | (0.49, | 1.24) | 1.07 | (0.69, | 1.67) | |
| Q4 | 0.74 | (0.46, | 1.19) | 0.98 | (0.62, | 1.55) | 0.83 | (0.57, | 1.21) | 0.96 | (0.61, | 1.49) | 1.15 | (0.74, | 1.78) | |
| MCMHP | Q1 | Ref | Ref | Ref | Ref | Ref | ||||||||||
| Q2 | 1.05 | (0.67, | 1.65) | 0.99 | (0.61, | 1.63) | 1.12 | (0.76, | 1.65) | 1.45 | (0.90, | 2.34) | 0.92 | (0.59, | 1.44) | |
| Q3 | 1.04 | (0.65, | 1.68) | 0.91 | (0.55, | 1.51) | 1.39 | (0.93, | 2.08) | 1.42 | (0.86, | 2.34) | 1.21 | (0.77, | 1.90) | |
| Q4 | 0.88 | (0.53, | 1.47) | 1.12 | (0.67, | 1.87) | 1.15 | (0.76, | 1.74) | 1.72 | (1.04, | 2.84) * | 1.14 | (0.71, | 1.82) | |
| MBzP | Q1 | Ref | Ref | Ref | Ref | Ref | ||||||||||
| Q2 | 0.80 | (0.52, | 1.23) | 0.73 | (0.49, | 1.10) | 1.04 | (0.74, | 1.47) | 0.56 | (0.37, | 0.86) ** | 0.74 | (0.50, | 1.09) | |
| Q3 | 0.94 | (0.59, | 1.49) | 0.68 | (0.44, | 1.05) # | 1.03 | (0.71, | 1.49) | 0.86 | (0.56, | 1.33) | 0.73 | (0.48, | 1.12) | |
| Q4 | 0.96 | (0.59, | 1.55) | 0.65 | (0.41, | 1.01) # | 1.09 | (0.74, | 1.60) | 0.60 | (0.37, | 0.97) * | 0.59 | (0.37, | 0.92) * | |
| MEP | Q1 | Ref | Ref | Ref | Ref | Ref | ||||||||||
| Q2 | 0.94 | (0.58, | 1.52) | 0.96 | (0.60, | 1.53) | 0.92 | (0.62, | 1.35) | 1.74 | (1.06, | 2.85) * | 1.20 | (0.77, | 1.86) | |
| Q3 | 1.11 | (0.70, | 1.75) | 1.09 | (0.69, | 1.72) | 1.19 | (0.81, | 1.73) | 1.35 | (0.82, | 2.22) | 1.07 | (0.69, | 1.65) | |
| Q4 | 0.97 | (0.61, | 1.54) | 1.47 | (0.94, | 2.30) # | 0.93 | (0.64, | 1.35) | 1.73 | (1.07, | 2.80) * | 1.08 | (0.70, | 1.68) | |
| MiBP | Q1 | Ref | Ref | Ref | Ref | Ref | ||||||||||
| Q2 | 0.68 | (0.44, | 1.06) # | 0.75 | (0.49, | 1.14) | 0.82 | (0.58, | 1.16) | 0.66 | (0.42, | 1.03) # | 0.92 | (0.61, | 1.38) | |
| Q3 | 0.87 | (0.56, | 1.36) | 0.96 | (0.63, | 1.46) | 0.96 | (0.67, | 1.38) | 1.00 | (0.65, | 1.54) | 1.05 | (0.69, | 1.59) | |
| Q4 | 0.85 | (0.54, | 1.36) | 0.89 | (0.57, | 1.38) | 0.57 | (0.39, | 0.84) ** | 1.00 | (0.64, | 1.56) | 1.01 | (0.65, | 1.55) | |
| MnBP | Q1 | Ref | Ref | Ref | Ref | Ref | ||||||||||
| Q2 | 1.57 | (1.01, | 2.42) * | 1.11 | (0.73, | 1.69) | 0.93 | (0.65, | 1.33) | 1.13 | (0.73, | 1.74) | 1.25 | (0.83, | 1.90) | |
| Q3 | 1.05 | (0.65, | 1.71) | 1.21 | (0.78, | 1.86) | 0.79 | (0.54, | 1.14) | 1.04 | (0.66, | 1.64) | 1.54 | (1.01, | 2.36) * | |
| Q4 | 1.10 | (0.69, | 1.75) | 1.13 | (0.73, | 1.75) | 0.78 | (0.54, | 1.13) | 0.96 | (0.61, | 1.52) | 1.07 | (0.69, | 1.66) | |
| MMP | Q1 | Ref | Ref | Ref | Ref | Ref | ||||||||||
| Q2 | 0.85 | (0.53 | 1.36) | 1.01 | (0.62, | 1.67) | 0.93 | (0.63, | 1.38) | 1.12 | (0.69, | 1.83) | 0.89 | (0.57, | 1.39) | |
| Q3 | 0.92 | (0.57, | 1.49) | 1.17 | (0.71, | 1.93) | 1.00 | (0.68, | 1.48) | 1.43 | (0.88, | 2.32) | 1.00 | (0.65, | 1.56) | |
| Q4 | 1.25 | (0.77, | 2.04) | 1.02 | (0.61, | 1.73) | 0.98 | (0.65, | 1.49) | 1.42 | (0.85, | 2.37) | 0.75 | (0.46, | 1.21) | |
| MiNP | Q1 | Ref | Ref | Ref | Ref | Ref | ||||||||||
| Q2 | 0.76 | (0.35, | 1.65) | 1.00 | (0.54, | 1.85) | 0.98 | (0.55, | 1.77) | 0.67 | (0.32, | 1.40) | 1.74 | (0.85, | 3.56) | |
| Q3 | 0.91 | (0.33, | 2.54) | 1.22 | (0.53, | 2.81) | 0.98 | (0.45, | 2.16) | 0.77 | (0.29, | 2.06) | 3.68 | (1.45, | 9.35) ** | |
| Q4 | 0.97 | (0.25, | 3.77) | 1.44 | (0.47, | 4.35) | 1.10 | (0.38, | 3.17) | 0.71 | (0.19, | 2.66) | 2.80 | (0.81, | 9.70) | |
| ΣHMW | Q1 | Ref | Ref | Ref | Ref | Ref | ||||||||||
| Q2 | 1.14 | (0.72, | 1.80) | 0.98 | (0.59, | 1.63) | 0.93 | (0.63, | 1.38) | 0.54 | (0.33, | 0.88) * | 1.00 | (0.65, | 1.55) | |
| Q3 | 1.16 | (0.71, | 1.87) | 0.72 | (0.43, | 1.22) | 1.01 | (0.67, | 1.52) | 0.55 | (0.33, | 0.91) * | 0.76 | (0.48, | 1.21) | |
| Q4 | 0.81 | (0.48, | 1.38) | 0.72 | (0.43, | 1.23) | 0.85 | (0.56, | 1.30) | 0.92 | (0.56, | 1.50) | 0.78 | (0.48, | 1.27) | |
| ΣLMW | Q1 | Ref | Ref | Ref | Ref | Ref | ||||||||||
| Q2 | 1.22 | (0.78, | 1.92) | 1.37 | (0.88, | 2.11) | 0.85 | (0.59, | 1.22) | 1.23 | (0.79, | 1.92) | 1.24 | (0.82, | 1.89) | |
| Q3 | 1.11 | (0.70, | 1.77) | 1.28 | (0.83, | 2.00) | 0.94 | (0.65, | 1.36) | 0.94 | (0.59, | 1.50) | 1.06 | (0.69, | 1.63) | |
| Q4 | 0.98 | (0.62, | 1.55) | 1.48 | (0.96, | 2.29) # | 0.71 | (0.50, | 1.03) # | 1.19 | (0.76, | 1.85) | 1.03 | (0.68, | 1.58) | |
| ΣDEHP | Q1 | Ref | Ref | Ref | Ref | Ref | ||||||||||
| Q2 | 0.90 | (0.57, | 1.43) | 0.82 | (0.50, | 1.34) | 0.90 | (0.61, | 1.33) | 0.81 | (0.51, | 1.30) | 1.11 | (0.72, | 1.72) | |
| Q3 | 1.25 | (0.79, | 1.98) | 0.74 | (0.45, | 1.21) | 1.06 | (0.72, | 1.57) | 0.71 | (0.43, | 1.15) | 0.96 | (0.61, | 1.50) | |
| Q4 | 0.69 | (0.41, | 1.15) | 0.66 | (0.40, | 1.09) | 0.86 | (0.57, | 1.30) | 1.11 | (0.69, | 1.80) | 0.88 | (0.55, | 1.42) | |
| ΣDBP | Q1 | Ref | Ref | Ref | Ref | Ref | ||||||||||
| Q2 | 0.94 | (0.60, | 1.47) | 1.21 | (0.80, | 1.84) | 1.01 | (0.71, | 1.43) | 1.05 | (0.68, | 1.62) | 1.32 | (0.87, | 1.99) | |
| Q3 | 1.14 | (0.73, | 1.78) | 1.29 | (0.84, | 1.98) | 0.74 | (0.51, | 1.06) | 1.01 | (0.65, | 1.58) | 1.28 | (0.84, | 1.95) | |
| Q4 | 0.85 | (0.53, | 1.35) | 1.28 | (0.82, | 1.99) | 0.77 | (0.53, | 1.12) | 0.89 | (0.56, | 1.41) | 1.27 | (0.82, | 1.95) | |
| Phthalate Metabolites | Males | Females | |||||||||||
|---|---|---|---|---|---|---|---|---|---|---|---|---|---|
| <50 Years | ≥50 Years | <50 Years | ≥50 Years | ||||||||||
| (n = 336) | (n = 357) | (n = 333) | (n = 311) | ||||||||||
| MEOHP | Q1 | Ref | Ref | Ref | Ref | ||||||||
| Q2 | 0.94 | (0.31, | 2.84) | 0.98 | (0.42, | 2.24) | 0.32 | (0.10, | 0.97) * | 1.11 | (0.40, | 3.08) | |
| Q3 | 0.43 | (0.10, | 1.80) | 0.60 | (0.21, | 1.68) | 0.76 | (0.30, | 1.95) | 1.43 | (0.56, | 3.67) | |
| Q4 | 0.78 | (0.21, | 2.95) | 1.02 | (0.40, | 2.59) | 0.31 | (0.10, | 0.93) * | 0.79 | (0.29, | 2.16) | |
| MBzP | Q1 | Ref | Ref | Ref | Ref | ||||||||
| Q2 | 0.85 | (0.25, | 2.86) | 0.75 | (0.30, | 1.87) | 0.04 | (0.01, | 0.31) * | 1.42 | (0.59, | 3.44) | |
| Q3 | 2.17 | (0.69, | 6.85) | 0.82 | (0.30, | 2.22) | 0.37 | (0.15, | 0.93) * | 1.78 | (0.69, | 4.592) | |
| Q4 | 1.18 | (0.26, | 5.28) | 1.73 | (0.71, | 4.24) | 0.31 | (0.12, | 0.82) * | 0.98 | (0.35, | 2.75) | |
| MEP | Q1 | Ref | Ref | Ref | Ref | ||||||||
| Q2 | 0.84 | (0.23, | 3.13) | 3.11 | (1.12, | 8.63) * | 1.76 | (0.48, | 6.39) | 0.55 | (0.20, | 1.54) | |
| Q3 | 1.95 | (0.62, | 6.15) | 2.32 | (0.84, | 6.37) | 1.75 | (0.49, | 6.33) | 0.98 | (0.38, | 2.58) | |
| Q4 | 0.54 | (0.12, | 2.39) | 2.07 | (0.74, | 5.79) | 1.68 | (0.49, | 5.83) | 1.16 | (0.45, | 2.99) | |
| MiBP | Q1 | Ref | Ref | Ref | Ref | ||||||||
| Q2 | 0.18 | (0.05, | 0.75) * | 1.02 | (0.43, | 2.43) | 0.47 | (0.17, | 1.31) | 0.58 | (0.24, | 1.42) | |
| Q3 | 0.37 | (0.11, | 1.26) | 0.96 | (0.37, | 2.50) | 1.00 | (0.38, | 2.61) | 0.58 | (0.24, | 1.36) | |
| Q4 | 0.67 | (0.19, | 2.38) | 0.90 | (0.35, | 2.29) | 0.32 | (0.10, | 1.05) # | 0.73 | (0.29, | 1.83) | |
| ΣDEHP | Q1 | Ref | Ref | Ref | Ref | ||||||||
| Q2 | 0.71 | (0.24, | 2.11) | 0.35 | (0.12, | 0.98) * | 0.87 | (0.19, | 3.91) | 1.85 | (0.35, | 9.87) | |
| Q3 | 1.08 | (0.33, | 3.47) | 0.77 | (0.32, | 1.85) | 0.66 | (0.15, | 3.00) | 3.97 | (0.82, | 19.36) # | |
| Q4 | 0.24 | (0.03, | 1.96) | 0.80 | (0.29, | 2.18) | 0.60 | (0.13, | 2.68) | 2.66 | (0.54, | 13.05) | |
Publisher’s Note: MDPI stays neutral with regard to jurisdictional claims in published maps and institutional affiliations. |
© 2022 by the authors. Licensee MDPI, Basel, Switzerland. This article is an open access article distributed under the terms and conditions of the Creative Commons Attribution (CC BY) license (https://creativecommons.org/licenses/by/4.0/).
Share and Cite
Shih, Y.-L.; Hsieh, C.-J.; Lee, T.-Y.; Liao, P.-H.; Wu, H.-T.; Liu, C.-Y. Sex Differences between Urinary Phthalate Metabolites and Metabolic Syndrome in Adults: A Cross-Sectional Taiwan Biobank Study. Int. J. Environ. Res. Public Health 2022, 19, 10458. https://doi.org/10.3390/ijerph191610458
Shih Y-L, Hsieh C-J, Lee T-Y, Liao P-H, Wu H-T, Liu C-Y. Sex Differences between Urinary Phthalate Metabolites and Metabolic Syndrome in Adults: A Cross-Sectional Taiwan Biobank Study. International Journal of Environmental Research and Public Health. 2022; 19(16):10458. https://doi.org/10.3390/ijerph191610458
Chicago/Turabian StyleShih, Ya-Ling, Chia-Jung Hsieh, Tso-Ying Lee, Pei-Hung Liao, Hao-Ting Wu, and Chieh-Yu Liu. 2022. "Sex Differences between Urinary Phthalate Metabolites and Metabolic Syndrome in Adults: A Cross-Sectional Taiwan Biobank Study" International Journal of Environmental Research and Public Health 19, no. 16: 10458. https://doi.org/10.3390/ijerph191610458