Article

Winning the Blue Sky Defense War: Assessing Air Pollution Prevention and Control Action Based on Synthetic Control Method

Business School, Shandong University of Technology, Zibo 255000, China
*
Author to whom correspondence should be addressed.
Int. J. Environ. Res. Public Health 2022, 19(16), 10211; https://doi.org/10.3390/ijerph191610211
Submission received: 6 July 2022 / Revised: 10 August 2022 / Accepted: 16 August 2022 / Published: 17 August 2022
(This article belongs to the Topic Climate Change, Air Pollution, and Human Health)

Abstract

:
Undoubtedly, the rapid development of urbanization and industrialization in China has led to environmental problems, among which air pollution is particularly prominent. In response, the Chinese government has introduced a series of policies, including the Air Pollution Control and Prevention Action Plan (APPA), which is one of the most stringent environmental regulations in history. The scientific evaluation of the implementation of this regulation is important for China to win the battle of blue sky. Therefore, this study uses a synthetic control method to explore the effects of APPA on air pollution (AP) based on data of 30 provinces from 2000 to 2019. The study concludes that (1) APPA significantly reduces AP in the treatment provinces, and subsequent robustness tests validate our findings. However, the persistence of the policy effect is short in some provinces, and the rate of AP reduction slows down or even rebounds in the later stages of the policy. (2) The reduction effect of APPA varies significantly between regions and provinces. (3) The results of mechanism tests show that APPA reduces AP through high-quality economic development, population agglomeration, control of carbon emissions, and optimization of energy structure. Based on the above findings, targeted recommendations are proposed to promote AP control in China and win the blue sky defense war.

1. Introduction

China’s rapid economic development is accompanied by massive fossil energy consumption and serious environmental pollution [1]. In recent years, air pollution (AP), represented by hazy weather, has attracted widespread public, media, and government attention [2]. In addition to causing a series of related diseases and posing a serious threat to the health of residents, AP also causes huge economic losses and hinders the sustainable development of society [3,4]. In the 1970s, air pollution management in developed countries focused mainly on sulfur and nitrogen oxides, and only in the 21st century did they start to shift to managing particulate matter such as PM2.5 and PM10. Part of these particulate matter comes from the direct emissions of pollutants, such as industrial waste gas, and part of it comes from sulfur and nitrogen oxides. China’s air pollution management started late, and it was not until 2012 that PM2.5 was included as an air quality testing standard [5]. According to the 2013 China Environmental Quality Bulletin, only three of the 74 cities that have implemented fine particulate matter (PM2.5) monitoring have met China’s National Ambient Air Quality Standards (NAAQS), and more cities are experiencing problems such as exploding AP indices and haze [6]. Hourly PM2.5 concentrations in Beijing even exceeded 1000 μg/m3, which is 40 times higher than the World Health Organization (WHO) health standard level. PM2.5 exposure caused about 8.9 million deaths worldwide in 2015, more than a quarter of which occurred in China [7].
In response to China’s growing environmental and AP problems, the Chinese government has introduced measures to improve air quality and reduce AP. The State Council promulgated the Air Pollution Prevention and Control Action Plan (hereafter referred to as “APPA”) in September 2013, known as the most stringent air pollution control system in history [8]. The policy puts forward more specific goals for future AP management and sets out the implementation plan for AP prevention and control in ten areas. The Beijing–Tianjin–Hebei region, Yangtze River Delta, and Pearl River Delta are facing more serious AP problems due to the concentration of resource elements and rapid economic development [9,10,11] (Figure 1). Therefore, one of the important goals of APPA is to reduce the concentration of fine particles in the Beijing–Tianjin–Hebei region, Yangtze River Delta, and Pearl River Delta regions to improve air quality.
Has the policy achieved the government’s intended goals? Have the key provinces where the policy was implemented produced significant changes in air quality compared to other provinces? Although some scholars explored the effects of APPA, these studies are mostly based on the multiplication method from an overall perspective. The conclusions of these studies may be biased because the assumption of parallel trends in the difference-in-difference method is often not satisfied due to the specificity of the policy implementation focus provinces (e.g., Beijing and Shanghai). Facing the assessment of policy effects with significant differences between samples, it is better to use the synthetic control method to construct a sample similar to the treatment group.
Based on the above motivation, an accurate and objective assessment of the implementation effect of APPA is of great practical significance to further promote AP control and win the battle for the blue sky. The contributions of this paper are: (1) This study adopts a synthetic control method (SCM) to assess the impact of APPA policy on AP. Compared with the traditional Difference in Difference (DID) method, it avoids the endogeneity problem brought by excessive subjectivity in sample selection and the bias brought by the treatment and control groups not satisfying parallel trends. It can obtain more specific research conclusions for each province. (2) Comparing previous studies that focused only on the overall effect of the policy, this study focused on examining the regional heterogeneity of policy effects for regional policies, intending to propose more targeted policies for different provinces to promote regional AP reduction. (3) The mechanism test of APPA is explored to provide paths for improving air quality.
The remainder of this paper is structured as follows. Section 2 presents the literature review and policy background. Section 3 provides the method and data source. Section 4 presents the results and discussion. Section 5 provides the conclusion and policy implications.

2. Literature Review and Policy Background

2.1. Literature Review

Numerous studies have shown that AP significantly threatens human health. Studies by the World Health Organization show that more than 7 million people worldwide die each year from AP, and about 90% of the population is exposed to high air concentrations. Long-term exposure to the harsh atmospheric environment increases the risk of respiratory infections, cardiovascular diseases, lung cancer, and other diseases and threatens the population’s lives [12]. On the one hand, AP increases mortality and disease, creating a burden of health costs [13]. On the other hand, reduced environmental quality can damage the central nervous system, threaten people’s mental health and increase the risk of suicide [14]. In addition, AP can cause serious economic losses by increasing health care expenditures, reducing labor productivity, and impeding human capital mobility [15].
The causes of AP are multifaceted. Economic development is undoubtedly one of the most important factors affecting AP in a region [16]. Some scholars believe that there is an inverted U-shaped curve between the economy and the environment; i.e., AP increases with the level of economic development. However, at higher levels of economic development, AP begins to decrease as the level of economic development increases [17]. This phenomenon is similar to the inverted U-curve proposed by Kuznets for income disparity and GDP per capita and is also known as the environmental Kuznets curve [18]. However, some scholars believe that the relationship between economic development and environmental pollution is positive U and N-shaped [19,20]. Similarly, past studies have had no uniform conclusion on the relationship between population and AP. Some believe that population concentration promotes industrial clusters and urban scale, which is conducive to the scale effect and improves urban environmental quality [21]. However, others believe that population agglomeration causes more pollution emissions [22,23]. In addition, the excessive burning of fossil fuels produces large amounts of carbon dioxide, contributing to AP [24]. Of course, the industrial structure is also a key factor in resolving the conflict between economic development and the environment [25].
Various environmental policies have always been one of the main instruments of the government to combat AP, especially in the top–down command-and-control environmental management system in China, where the government is supposed to be the leading force in combating AP [26]. Over the past period, many scholars have conducted in-depth analyses of the effects of different AP prevention and control policies [27,28]. Of course, the APPA has also attracted extensive attention from scholars since its introduction. Many scholars have studied the effects of green total factor productivity [29], business investment [30] and population health [31]. Many scholars have explored the policy effects of APPA from the perspectives of green total factor productivity, enterprise investment, and residents’ health. Meanwhile, some scholars have also studied the impact of APPA on pollutant emissions. For example, Zhang [32] using the DID method investigated the impact of APPA on carbon emissions based in 285 cities. After implementing APPA, Yang [33] used the DID method to investigate the major AP concentrations in 125 prefecture-level cities. After APPA implementation, the above studies generally concluded that APPA has contributed to AP reduction, but they all focused on the overall level of policy implementation.
In summary, many studies focused on AP, and some focused on the effects of APPA. However, most studies often choose the multiplication method, which mainly explores the overall perspective of policy implementation. However, in the policy implementation process, each province differs because of factors such as resource endowment, economic development level, and the use of the traditional DID will not satisfy the parallel trend test and thus produce bias. Therefore, this study adopts the synthetic control method to investigate the impact of APPA on air quality at the provincial level and then investigate the mechanism on AP, which can help propose more localized policy recommendations and provide reference for promoting future AP reduction actions in China.

2.2. Policy Ground

The Chinese government has issued several policies to improve air quality in light of the increasingly frequent environmental pollution problems. In the Eleventh Five-Year Plan, China proposed to reduce energy consumption per unit of GDP and national sulfur dioxide emissions by 20% and 10%, respectively, in 2010 compared to 2005 [34] in 2010. In the 12th Five-Year Plan, China aims to reduce energy consumption per unit of GDP and national emissions of sulfur dioxide and nitrogen oxides by 16%, 8% and 10%, respectively, by 2015 compared to 2010 [35].
The Air Pollution Control and Prevention Action Plan, released by the State Council in 2013, is a general management plan designed to treat AP. Its content mainly covers many aspects such as increasing the comprehensive treatment of pollution sources, adjusting and optimizing the industrial structure, accelerating the green technological transformation of enterprises, increasing the supply of clean energy, strict energy-saving and environmental protection access, establishing a regional integrated management mechanism, establishing a monitoring, early warning and emergency response system and mobilizing all people to participate in environmental protection. The main goal of APPA is to reduce the concentration of respirable particulate matter in cities at the prefecture level. Therefore, it is important to investigate the policy effects of APPA to improve air quality and win the blue sky defense war in China.

3. Method and Materials

3.1. Syntenic Control Method (SCM)

Assessing the effect of a policy implemented in a given area is usually not possible by directly comparing the change in outcomes before and after the implementation of the policy due to possible time trends or confounding events. Moreover, the assumption of parallel trends is not always satisfied, so multiplicative difference or fixed effects models are not always appropriate. Abadie provides a good way to construct a counterfactual control group: a synthetic control method [36,37,38]. This approach allows for the selection of optimal weights for linear combinations based on data-driven, avoiding the arbitrariness of the researcher’s subjective choice of control group and avoiding extrapolation bias, and it is well suited for assessing the impact of APPA on AP.
The sample for this study was selected for 30 provinces (except Tibet). The provinces in the key regions of APPA implementation were used as the treatment group—Beijing, Tianjin, Hebei, Anhui, Shanghai, Zhejiang, Jiangsu, and Guangdong—and the other provinces were used as the control group. The other treatment group provinces were excluded from the sample selection process of the control group. The synthetic control method model was constructed as follows.
We assume that K + 1 provinces can be observed in t [ 1 ,   T 0 ] within the AP data, assuming that area i (i = 1) serves as the treatment group for the APPA shock and the other K provinces (i > 1) serve as the control group. A P i t N represents the APs without and with APPA shocks at time point t. We assume that α 1 t = A P I A P N , α 1 t represents the net effect of the policy in i province. This study refers to Abadie’s study and extracts the impact factors for areas not affected by the policy (i > 1).
AP   i t N = θ t C o n t r o l t + γ t μ i + y e a r t + ε i t  
In Equation (1), the C o n t r o l t is the control variable, the matching variable for SCM, and γ t μ i represents the individual and time interaction effects. In addition, the K provinces that do not receive policy effects are assigned weights w2, w3, … wk+1 (w2 + w3 +…+wk+1 = 1, wi > 0), which are weighted to obtain Equation (2):
k = 2 K + 1 w k A P k t N = θ t k = 2 K + 1 w k C o n t r o l k + γ t k = 2 K + 1 w k μ k + y e a r + k = 2 K + 1 w k ε k t      
To reduce the error of the resultant variables in the treatment and synthesis groups while making the other matching features fit better, we set a constraint that:
{ k = 2 K + 1 w k * A P k 1 N = A P 11 k = 2 K + 1 w k * A P k 2 N = A   12 k = 2 K + 1 w k *   A P k T 0 N = A P 1 T o k = 2 K + 1 w k * C o n t r o l k = C o n t r o l 1  
A P 1 t I k = 2 K + 1 w k *   A P k t = k = 2 K + 1 w k * s = 1 T s λ t ( n = 1 T s λ n λ n ) 1 λ s ( ε j s ε 1 s ) k = 2 K + 1 w k * ( ε k t ε 1 t )
In Equation (4), if there exists n = 1 T 0 λ n λ n , then for any t T 0 , and the right-hand side of the formula tends to 0, then it is possible to use the K control group samples in period t   ( t T 0 ) . If the AP of the treatment group provinces is fitted, then a set of K weight matrices of the province values is taken so that the treatment group before the policy is the same as the AP of the matched group.
In this paper, we further construct the weight matrix as follows.
{ W * = ( w 2 * , w 3 * , , w K + 1 * ) X 1 X 0 W = ( X 1 X 0 W ) V ( X 1 X 0 W )
In Equation (5), X1 and X0 represent the matrices of treatment and control group characteristic variables, respectively. W is the surrogate weight matrix. V is a K-dimensional diagonal matrix with non-negative weights for all diagonal elements, reflecting the relative importance of the corresponding predictor variables for the outcome variable. Obviously, the optimal solution of this constrained minimization problem depends on the diagonal matrix V. The mean square error in performing synthetic control estimation is minimized by the choice of V. The optimal matrix W* is derived using a reasonable choice of V as the matrix composed of the weights of the K provinces in the synthetic group.
In summary, the marginal effect of APPA on AP is
α 1 t = A P 1 t I k = 2 K + 1 w k *   A P k t N
In Equation (6), the indicator is the treatment effect of the APPC shock on the AP effect in the treatment group’s province. It is important to note that in the application of Abadie et al. for the synthetic control method, two important criteria are pointed out. First, the difference between the synthetic and treatment groups in matching variables before the occurrence of the exogenous shock event is not significant, while the difference between the two groups’ independent variables is not significant. Second, there is a significant difference between the synthetic and treatment groups in dependent variables after the occurrence of the exogenous shock, and such a difference, after excluding the effect of other matching variable difference characteristics, can be considered to be due to exogenous event shocks [36]. This difference can be attributed to exogenous event shocks after excluding the effect of other matching variables.
This study defines the weights for each province according to the following rules.
(1)
Use the eight APPC focus provinces before 2013 as the treatment group.
(2)
Match control group provinces for each treatment group province with no treatment group provinces included in the matched sample.
(3)
Select reasonable weights by synthetic control method to construct synthetic group provinces for treatment group provinces.
(4)
Derive the optimal weight matrix using a reasonable choice of the semi-positive definite matrix. Specifically, the average values of each matching index from 2000 to 2012 and the provincial air quality in 2000, 2005, and 2010 are taken. The weight matrix is derived by solving a system of joint cubic equations so that the weighted average of the matching variables of the synthetic group of provinces in each year is comparable to the values taken by the matching variables of the treatment group of provinces, and the weights are greater than 0.
(5)
The annual means of matching variables in the synthetic group were calculated and compared with the treatment group, making the matching variables in the 2000–2012 treatment group close to those in the synthetic group.

3.2. Variables and Data Source

3.2.1. Dependent Variable

Common indicators for measuring AP include SO2, NO2, and Respirable Particulate Matter (RPM). PM2.5 can remain in the atmosphere for longer while being transported over longer distances by air currents, which has a greater impact on the environment and a greater degree of risk to human health than other pollutants [39]. Therefore, this paper selects PM2.5 as the most important pollutant. Therefore, the concentration of PM2.5 is chosen to measure the AP level in this paper.

3.2.2. Predictor Variables

(1)
Economic Development (GDP): Many studies in the past have demonstrated a strong link between the level of economic development and air quality [40]. In this study, GDP per capita was used to measure the economic development level of the region.
(2)
Population Size (POP): The population size reflects to some extent the level of industrialization and urbanization of the region, and the population size affects the level of economic development and thus the AP in the city [41]. In this study, the year-end population of the region is used to express the population size.
(3)
Industrial Structure (IS): Differences in regional industrial structure can cause regional differences in pollution, and traditional industries represented by secondary industries are often the main source of pollution in a region [42]. The traditional industry represented by the secondary industry is often the main source of pollution in a region. In this study, the proportion of the output value of the secondary industry is used to reflect the industrial structure.
(4)
Carbon Emissions (CO2): Many studies in the past have proven that carbon dioxide is one of the main sources of atmospheric pollution and that carbon emissions of a region are closely related to its air quality [43]. The carbon emissions are calculated as follows.
C a r b o n i t = E n e r g y i t × η j ( i = 30 ; j = 1 , 2 , , 9 )
In Equation (7), C a r b o n i t represents the carbon emissions of province i in t year, while ηj is the carbon emission factor of the j energy consumption (Table 1). According to the China Energy Statistical Yearbook caliber, the final energy consumption types are divided into nine categories (Raw Coal, Coke, Crude Oil, Gasoline, Kerosene, Diesel, Fuel oil, Liquefied Petroleum Gas, and Natural Gas). The conversion coefficients of the nine categories of energy are shown in Table 1.

3.3. Data

The variables are measured and sourced as shown in Table 2. PM2.5 data were obtained from the Atmospheric Composition Analysis Organization. The predictor variable data were obtained from each province’s China Statistical Yearbook and Statistical Yearbooks. For the few missing values, this study used linear interpolation to supplement them. The descriptive statistics of the variables are shown in Table 3. It can be seen that the maximum, minimum and mean values of the annual average PM2.5 concentrations of the treatment and control groups are significantly different. In addition, the mean values of annual average PM2.5 concentrations are 47.7 μg/m3 and 38.52 μg/m3, both of which did not meet the national standard of annual average concentration level 2 (35 μg/m3). In the subsequent tests, we logged the variables in order to reduce the absolute differences between the data [44].
Figure 2 shows the time trends of AP in the treatment and control provinces. It can be seen that the AP levels in the treatment provinces are significantly higher than those in the control provinces, and the AP levels in the treatment provinces do show a significant downward trend after 2013. We will further verify whether APPA causes this downward trend in the later experiments and verify the changes of AP in each treatment province from a microscopic perspective.

4. Results and Discussion

4.1. Variable Matching

Table 4 shows the control of predictor variables for the synthetic control method. It can be seen that most of the predictor variables for the provinces in the focus group of policy implementation and their synthetic provinces do not have significant deviations, indicating that the predictor variables do not differ significantly between the treated and synthetic provinces. It should be noted that the Tianjin sample was excluded because the AP in Tianjin was significantly higher than that in other provinces, and no suitable province could be selected to match it. After the matching process, the differences in the pre-predictor AP between the treatment group provinces and the synthetic provinces were also not significant. The above matching results indicate that the characteristics of the treatment and control groups are similar and can be subjected to synthetic control analysis.
Table 5 shows the selection and weights of the synthesized provinces. For example, the provinces involved in synthesizing Beijing are Henan, Hubei, Ningxia, and Shandong, where the largest weight is Henan (0.565), indicating a higher similarity between Henan and Beijing; the lowest weight is Ningxia (0.044), indicating a lower similarity between Ningxia and Beijing.

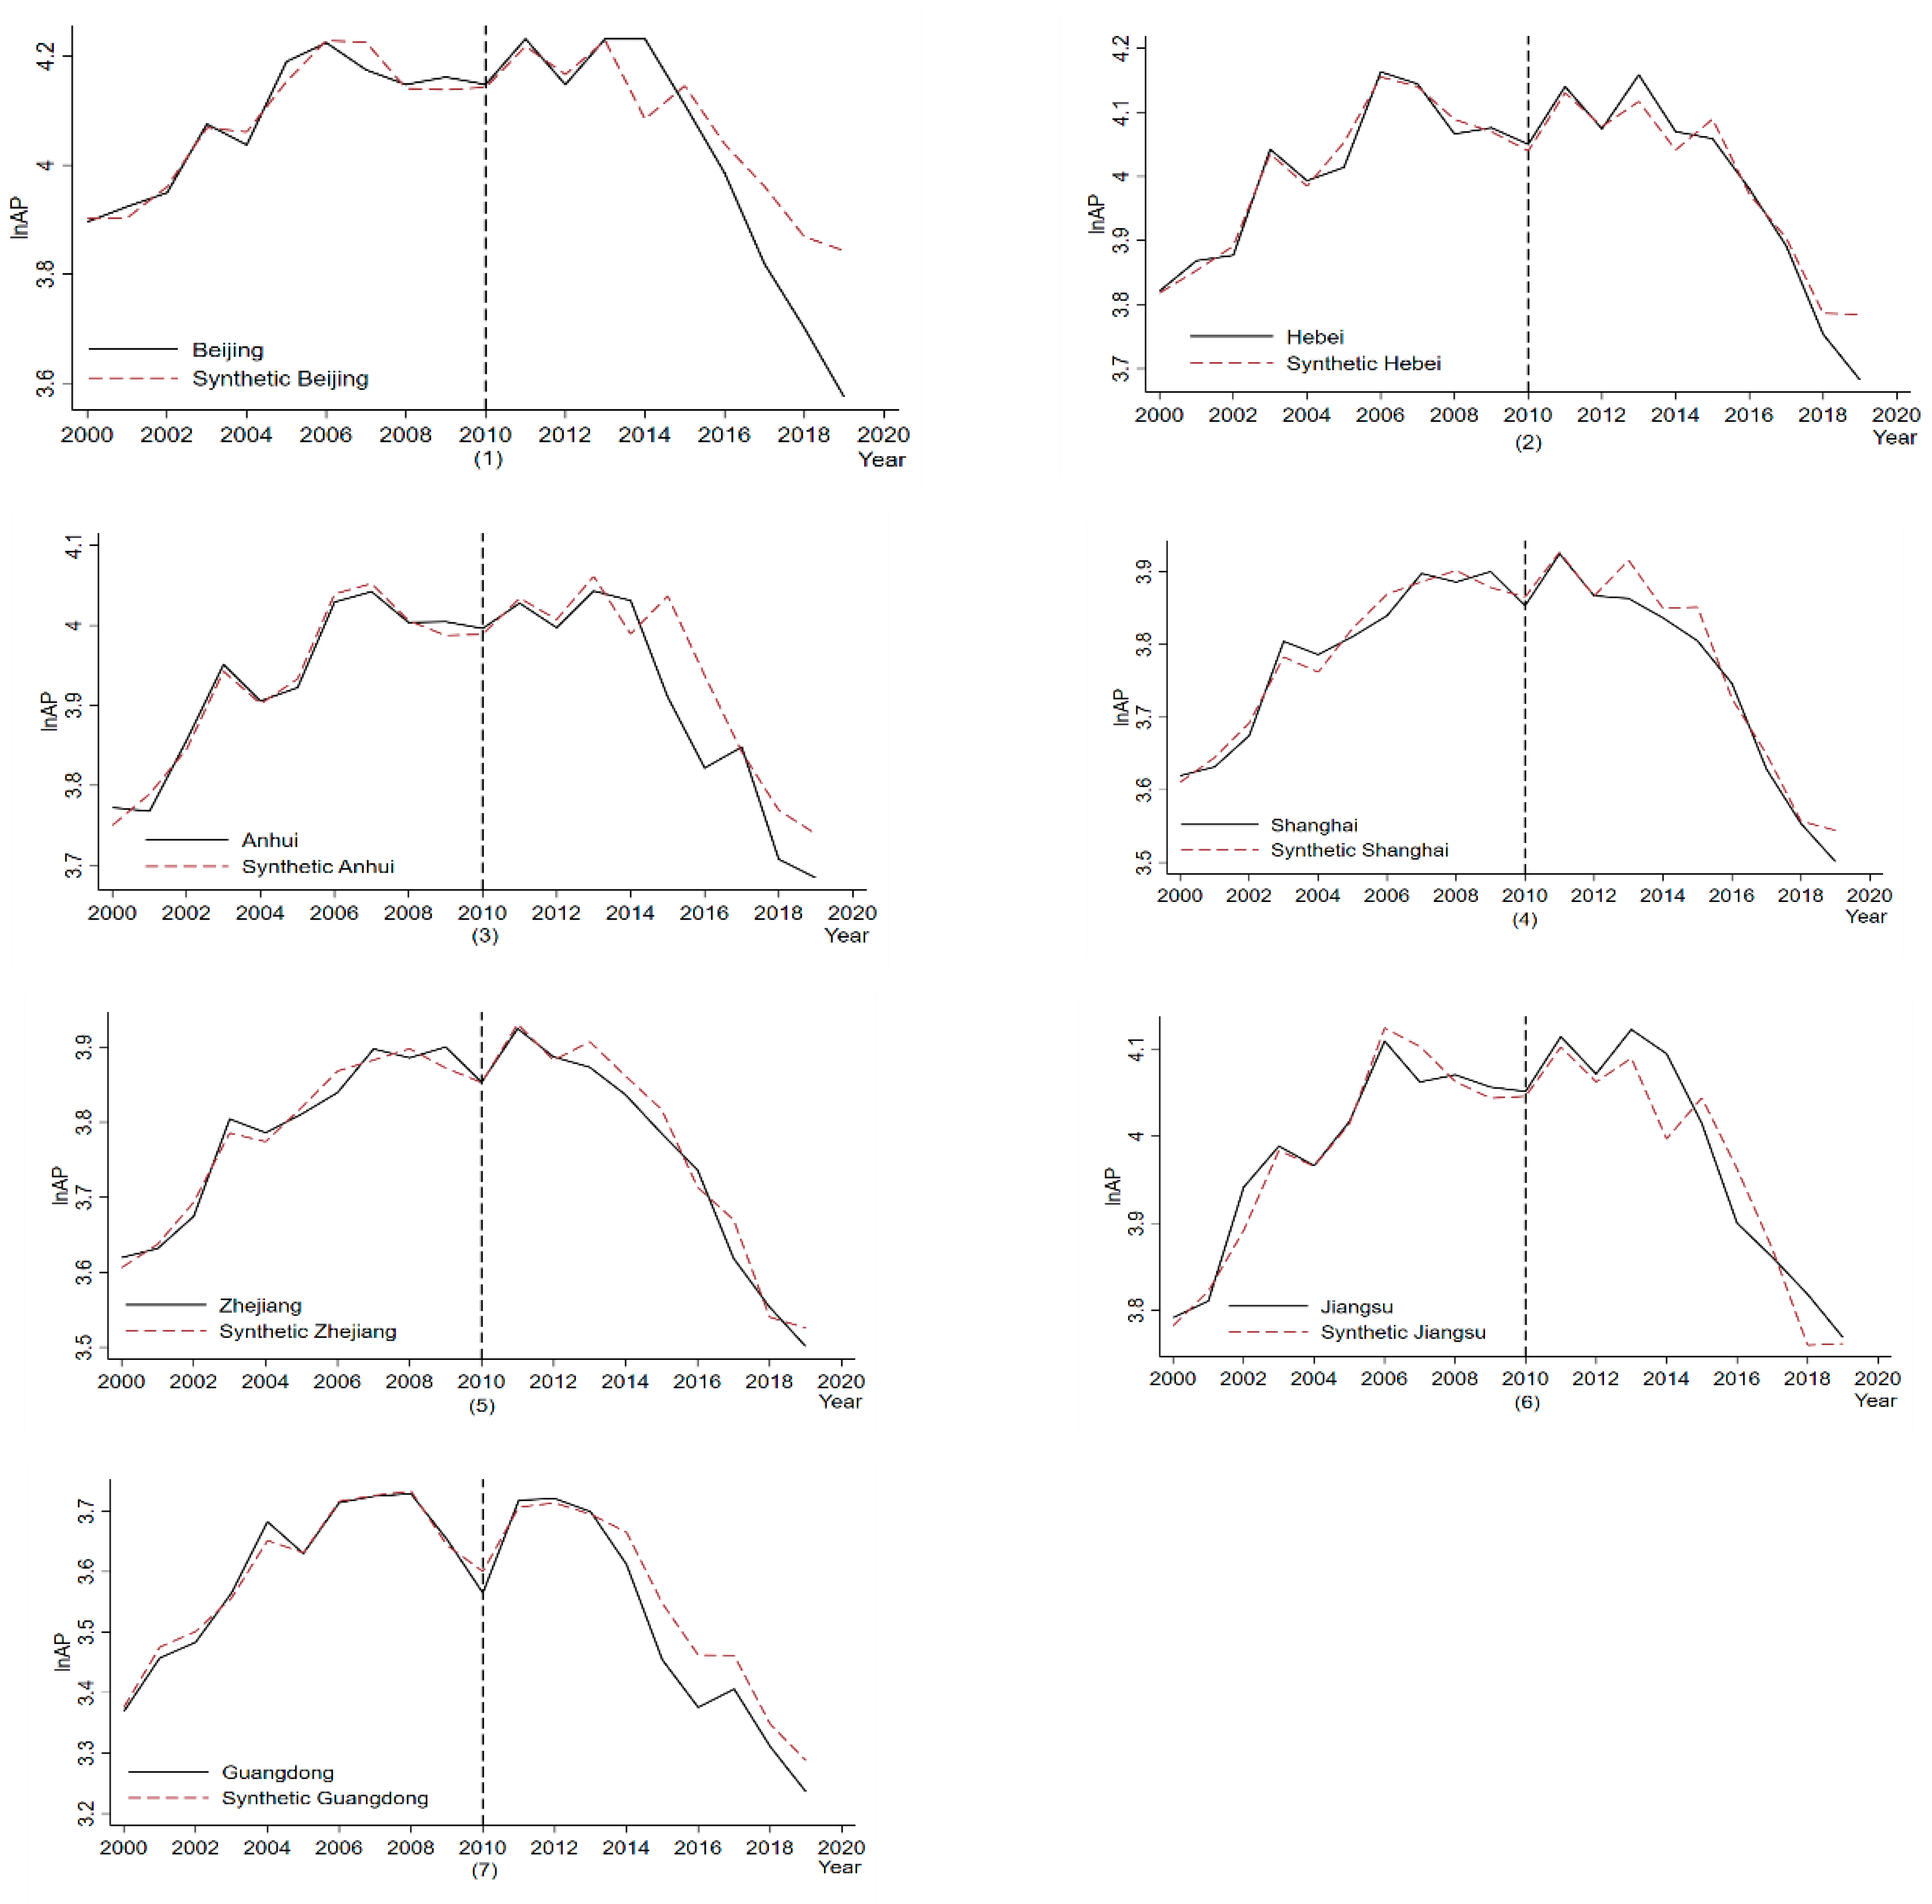
4.2. Baseline Results

We analyze the trend of AP changes in the treatment and synthetic provinces, and Figure 3 shows the AP changes after APPA. The solid black line represents the AP level in the treatment province, the red dashed line represents the AP level in the synthetic province, and the black dashed line represents the policy implementation time, i.e., 2013.
Before the implementation of APPA, the synthetic and treatment provinces generally fit well, such as Guangdong and Hebei, which showed excellent fitting trends. Beijing and Shanghai provinces still have a good overall fit, although there are individual years with fit deviations before APPA.
After the implementation of APPA, the AP in the treatment provinces showed a more significant decrease compared to the synthetic provinces. It indicates that the implementation of APPA did promote the reduction in AP in the treatment provinces. At the same time, we also found several interesting phenomena: (1) The policy effect in some provinces is only more effective in the early period after the policy implementation (2013–2016), and the AP decline slows down or even rebounds in the later period of the policy. For example, Guangdong’s AP levels showed a significant downward trend compared to synthetic Guangdong after the policy implementation, but the AP levels slightly rebounded in 2017. (2) The emission reduction effect of APPA on AP varies significantly among provinces. For example, while in the same Beijing–Tianjin–Hebei region, Beijing and Hebei show huge differences in emission reduction effects. Beijing shows a significant downward trend in AP levels compared to synthetic Beijing. Because Beijing’s economic, political, and cultural development is superior to that of other provinces, the implementation of the policy will receive more financial and social support than other regions to promote the implementation of the policy. However, after the implementation of the policy, the decline of AP in Hebei and synthetic Hebei did not show a significant difference. The reason may be that although Hebei is located in the Beijing–Tianjin–Hebei region, it does not have the capital city advantage of Beijing and still maintains a production model based on a traditional industrial structure. At the same time, many problems in the policy system’s top–down implementation have led to a relatively poor AP reduction in Hebei. In addition, the AP emission reduction effect in Jiangsu, Zhejiang and Shanghai (Shanghai, Zhejiang, Jiangsu and Anhui) is better than that in Beijing, Tianjin and Hebei and the Pearl River Delta region. It may be because in the Jiangsu, Zhejiang, and Shanghai regions, compared to the other two regions, industrial transformation is completed earlier, the industrial chain is more complete, and multiple entities collaborate to promote regional ecological and environmental integration AP energy saving and emission reduction.

4.3. Robustness Tests
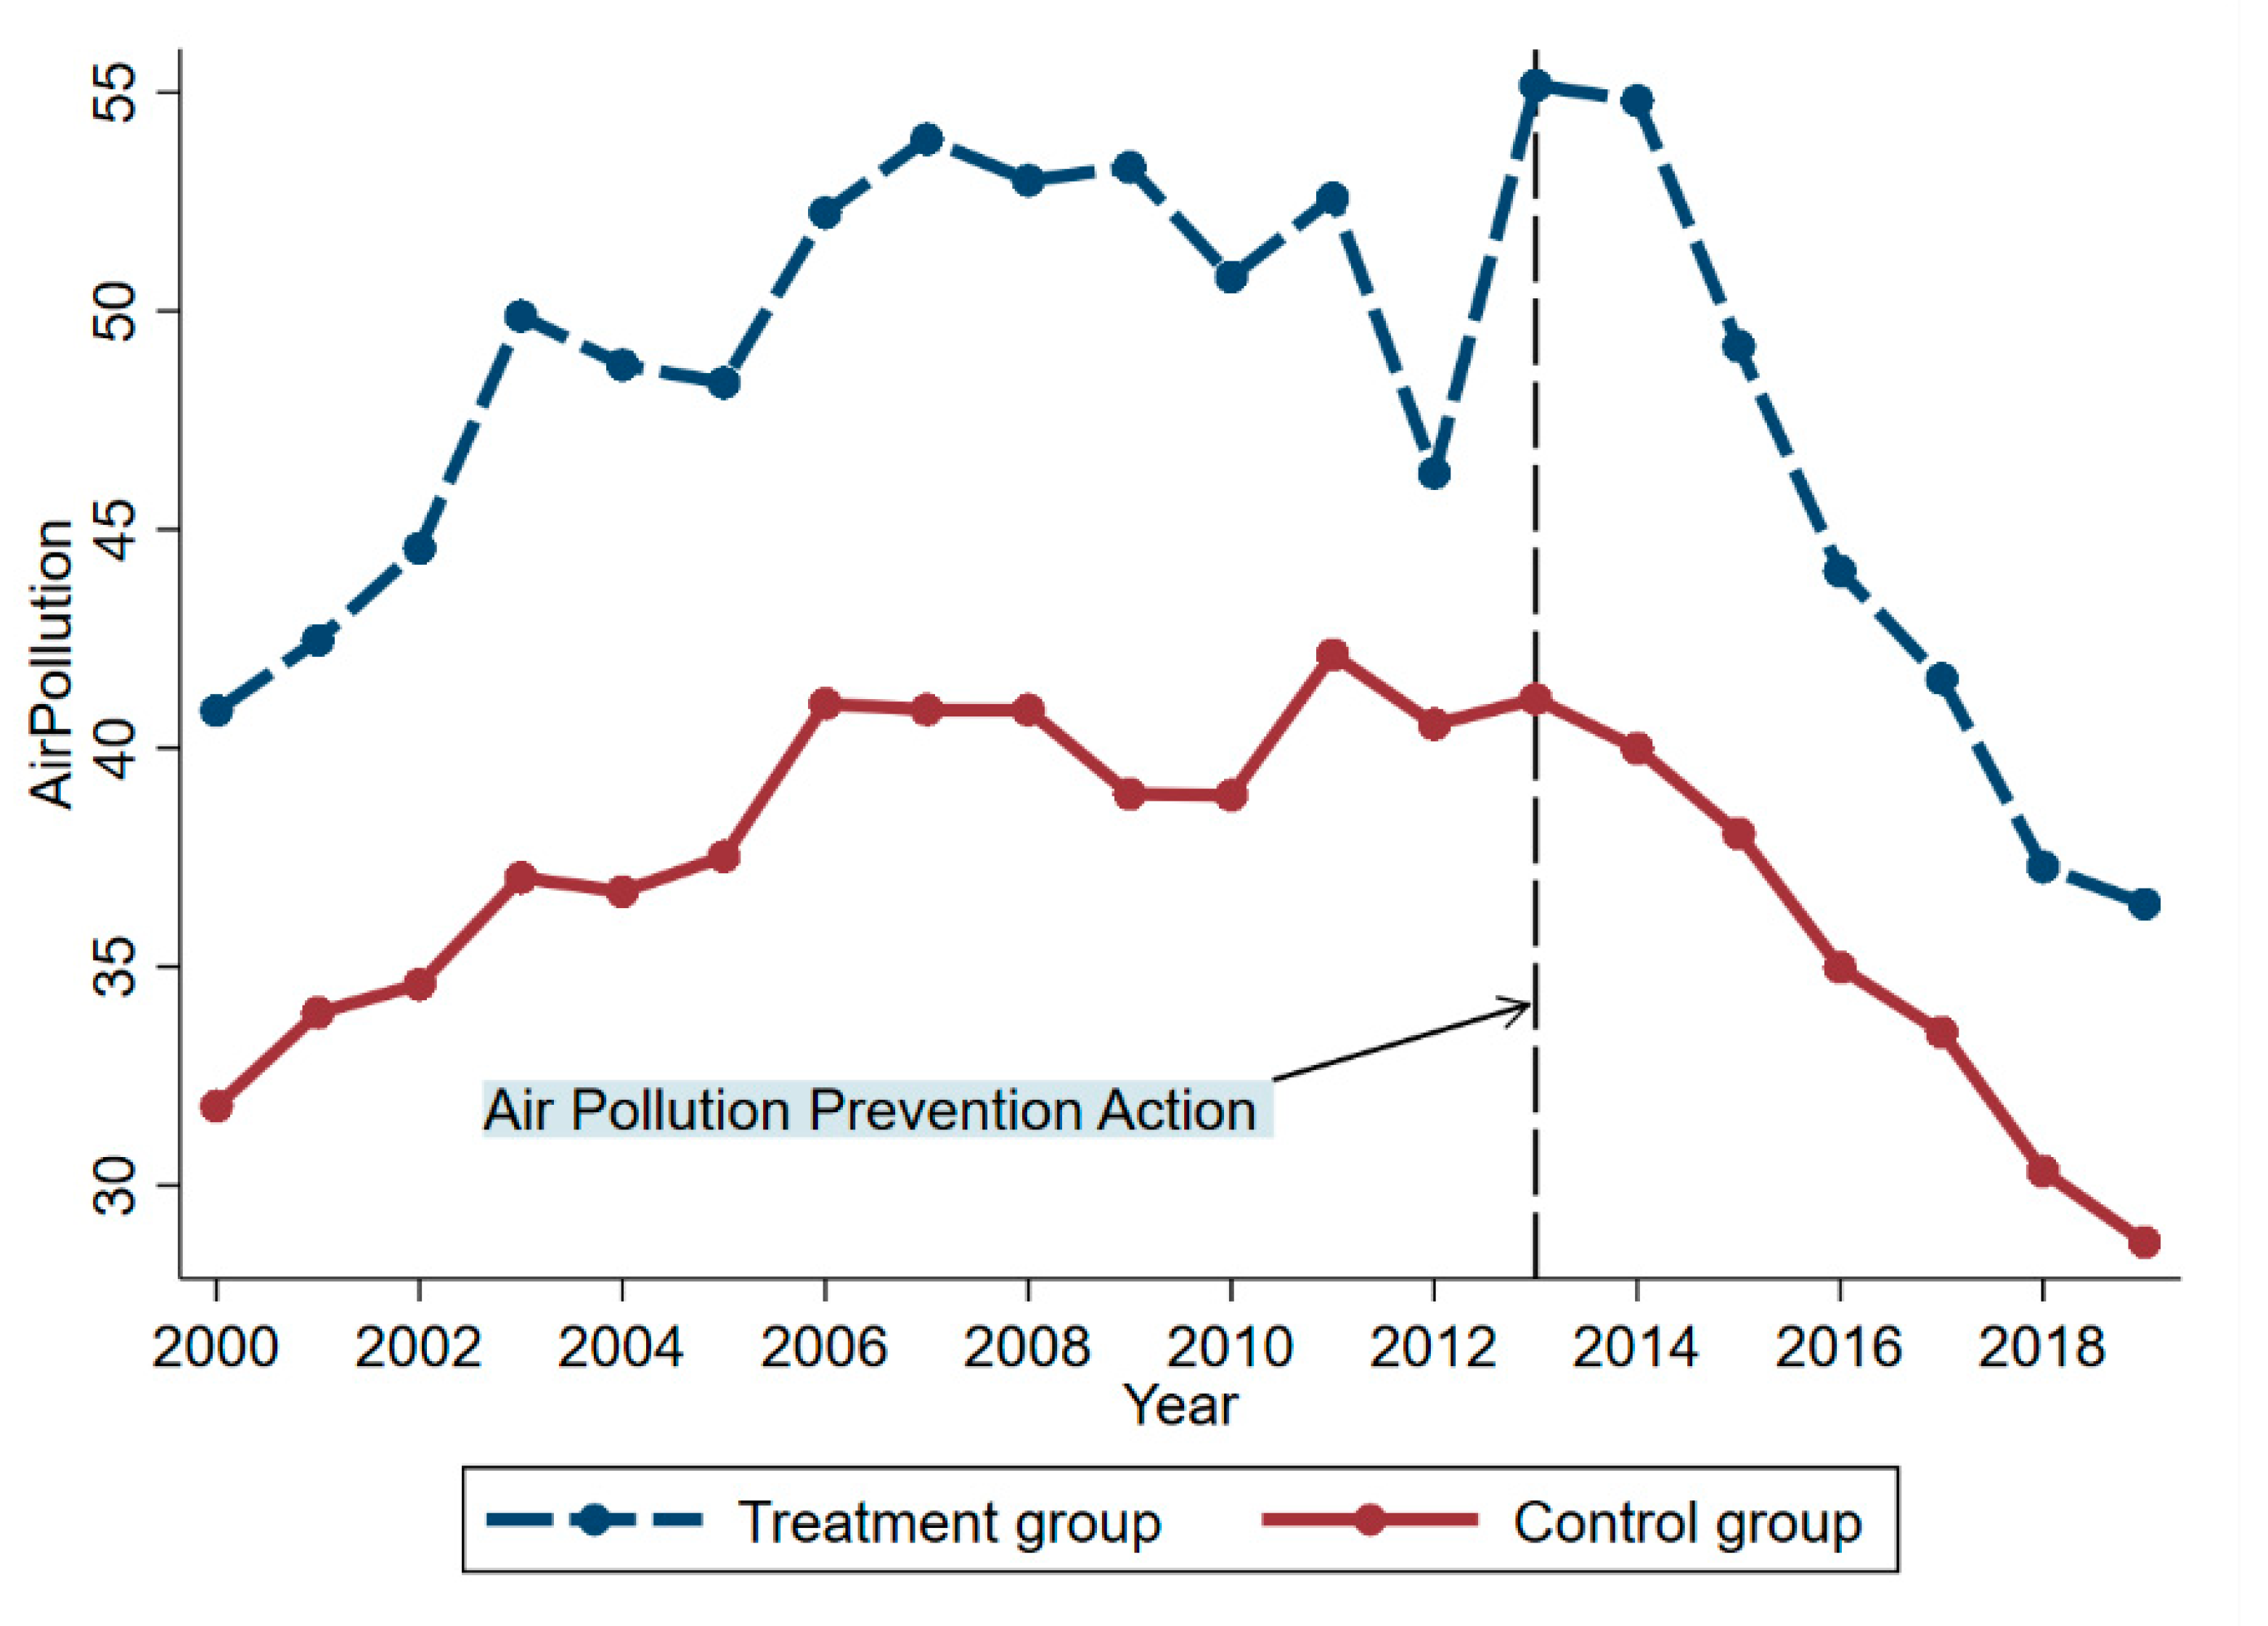
4.3.1. DID

DID is still the dominant method for exploring policy effects today because of its effectiveness in avoiding the endogeneity of policy issues and omitted variables. We construct DID models to verify the robustness of the previous results.
A i r P o l l u t i o n i t = α 0 + α 1 t r e a t e d i t × t i m e i t + α 2 C o n t r o l + u i + λ t + ε i t
In Equation (8), the A i r P o l l u t i o n i t is an AP variable, representing AP in year t in province i. treatit is an individual dummy variable representing 1 for provinces in the treatment group in year t and 0 for other provinces. Timeit is a time dummy variable bounded by the year of policy implementation (2013), with the year before policy as 0 and the other years defined as 1. Controlit is a set of observable control variables with an impact on AP The cross-term treatit × timeit represents the province dummy variable after the policy implementation, and the coefficient α1 represents the net effect of APPC on AP. ui and λt represent the individual and time fixed effects, respectively, and εit represents the random error term.
Table 6 shows the regression results for the two-way fixed effects; (1) and (2) represent the results with and without the control variables, respectively, and it can be seen that the coefficients of the interaction terms are negative and pass the significance level test, indicating that the implementation of APPC significantly reduces the AP in the priority provinces. This also proves that the baseline results are robust.

4.3.2. Time to Change Policy
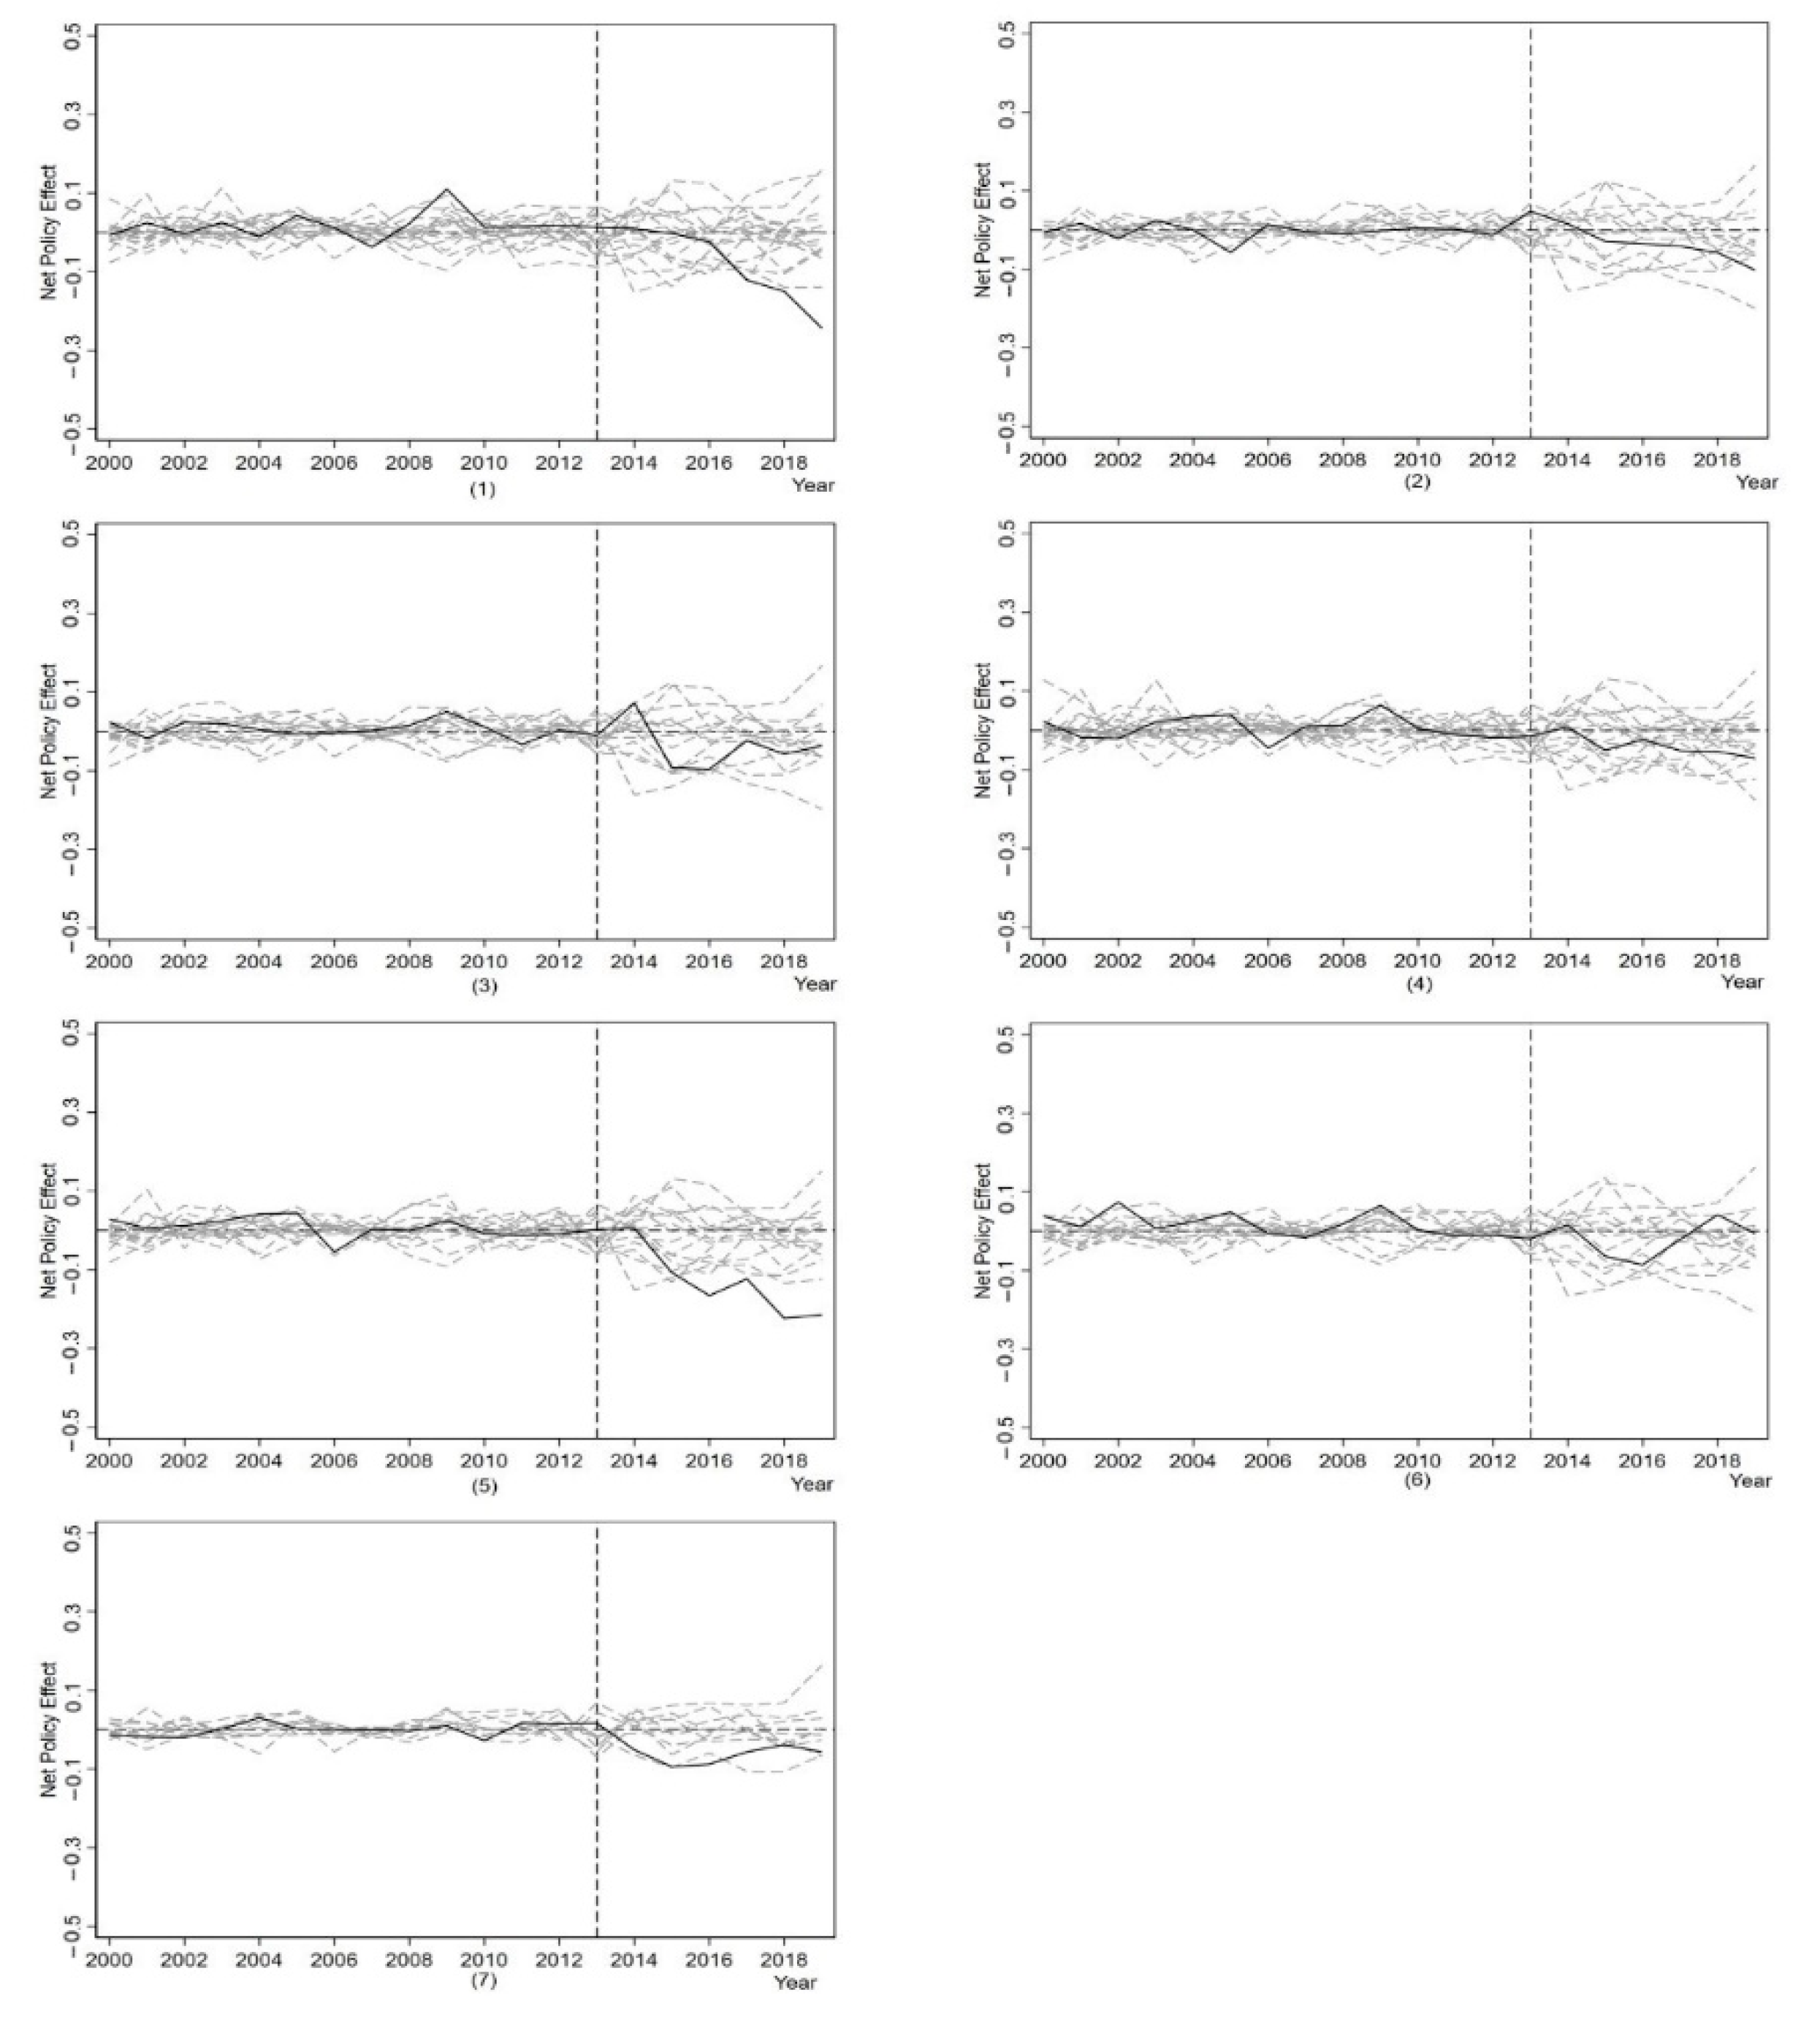
We assume that the policy is advanced to 2010 and re-run the synthetic control analysis. Figure 4 shows the synthetic control results after changing the time point of the policy. It can be seen that after changing the policy time point, the trends of AP water in the treatment and synthetic provinces are almost identical and do not fluctuate due to the policy shock until around 2013, when the gap started to appear. It indicates that the hypothesis of using 2010 as the policy shock time point is invalid and further proves our previous results’ robustness.

4.3.3. Placebo Test

A placebo test can be used to determine whether the synthetic control method’s policy effect is statistically significant. The placebo test involves assuming all 22 provinces in the control group as the treatment group, conducting synthetic control for each province, and calculating the difference between the true and synthetic values. If the reduction in air pollution in the experimental group should be much greater than that in the control group, it indicates that APPA effectively reduces air pollution. It should be noted that if the difference of AP is larger after the policy time point, it may also be caused by the poor fitting degree before the policy time point, which is unrelated to the policy implementation. The synthetic control method requires a well-fitting synthetic control object for each province before the policy implementation. If a province has a large root of the mean square prediction error (RMSPE), then the larger predictive variable differences obtained later in the policy do not reflect the effect. Therefore, to avoid problems caused by too large fitting errors, we exclude samples with RMSPE greater than two times the experimental provinces. Table 7 shows the results of Figure 5, showing the placebo test for each province with the solid black line representing the experimental provinces and the dashed line showing the policy effects for the control group provinces. If the overall trend of the solid line is much lower than the dashed line after the policy is implemented, it indicates that the policy effect is significant. For the air pollution abatement effect, the number of dashed lines that exceed the solid line along the overall trend is divided by the total number of dashed lines (excluding the excluded samples and solid lines), which are denoted as P(Φ). Since there were only 22 samples in the control group in this study, and then after excluding the samples with too high RMSPE, the remaining samples were small, it was difficult to meet the significance condition of the statistic P < 0.05 (95% confidence level), the confidence level was relaxed appropriately. P(Φ) < 0.2 was used as the criterion for whether the placebo test was significant.
In Beijing, for example, the number of dashed lines after excluding samples is 17. After the implementation of the policy, there is no overall trend of dashed lines over the lower edge of the solid line, i.e., P(Φ) = 0/17 < 0.2. This indicates that the decrease in air pollution in Beijing is significantly greater than that of the placebo test, which is significant. However, in Hebei, for example, after excluding the sample, there are 13 dashed lines, and the overall trend of the dashed line exceeds the lower edge of the solid line in 2 cases, P(Φ) = 2/13 = 0.15 < 0.2, and the placebo test is also significant. However, P(Φ) = 4/17 = 0.235 for Shanghai; it can be concluded that APPA does not entirely cause the decrease in air pollution in Shanghai. The placebo test (Table 7) shows that all experimental provinces passed the placebo test except Shanghai, ensuring our conclusion’s robustness.

4.4. Mechanism Testing

Based on the previous results, APPA reduced AP in the treatment provinces. Many studies in the past usually concluded that there is an inverted U-shaped curve between economic development and air quality. Excessive economic growth rates in most developing countries in the early stages have led to severe AP. The relationship between AP and population size has never been conclusively established. However, many scholars believe that the increasing population in cities is accompanied by rapid growth in the service sector and technological innovation, which contribute to cleaner cities. In addition, many scholars also believe that controlling carbon emissions and optimizing industrial structure can promote air quality improvement. Therefore, we select the level of economic development, population size, carbon emission and industrial structure as mechanism variables to investigate the influence mechanism of APPA to reduce AP and construct the following model.
M e c h a n i s m i t = α 0 + α 1 t r e a t t i m e + u i + λ t + ε i t
In Equation (9), Mechanismit represents the impact mechanism variables (lnECO, lnPOP, lnCO2, lnIS). treatit is the province dummy variable, timeit is the policy time dummy variable, ui and λt represent the province individual effect and time effect, and εit is the random perturbation term.
The results in Table 8 show that all interaction coefficients pass the significance level test. lnECO has a coefficient of −0.1938, indicating that the per capita GDP of the treatment province decreased after APPA. The reason may be that the treatment province was pressured by environmental policies to improve air quality by slowing down its economic development and shifting to high-quality development. lnPOP has a coefficient of 0.0853, indicating that APPA expanded the population size of the treatment province, suggesting that APPA reduced AP through population clustering. The coefficients of lnCO2 and lnIS are −0.1912 and 0.0907, indicating that both carbon emissions and the share of secondary industry in the treatment provinces have decreased, suggesting that controlling carbon emissions and optimizing industrial structure are important channels to improve air quality. The absolute values of the coefficients of lnECO and lnCO2 are significantly higher than those of lnPOP and lnIS, indicating that promoting high-quality economic development and controlling carbon emissions have a more important impact on reducing AP.

5. Conclusions and Policy Implication

5.1. Conclusions

This study explored the effect of APPA on AP using a synthetic control method based on panel data from 30 provinces for 2000 to 2019. This paper draws the following conclusions:
(1)
After APPA, the treatment provinces all showed a more significant reduction in AP compared with synthetic provinces. It indicates that APPA significantly reduces AP in the treatment provinces, and subsequent robustness tests verify the baseline results. Beijing and Zhejiang have significantly better air pollution reduction effects than other provinces. However, APPA produces less persistent policy effects in some provinces (i.e., Anhui and Jiangsu); the rate of AP decline slows down or even rebounds in the later stages of the policy.
(2)
The emission reduction effect of APPA on AP varies significantly both among provinces in the same region and among different regions. For example, Beijing and Hebei belong to the same Beijing–Tianjin–Hebei region, but the emission reduction effect greatly differs. In addition, the AP abatement effect in the Yangtze River Delta is better than that in the Beijing–Tianjin–Hebei and Pearl River Delta regions.
(3)
The results of the mechanism test show that APPA reduces AP through high quality economic development, population agglomeration, control of carbon emissions and optimization of energy mix. The effects are in the order of strongest to weakest (ECO, POP, CO2, IS).

5.2. Policy Implication

Although APPA has significantly contributed to reducing AP, it is even more important to introduce effective long-term policies to combat AP. Therefore, this study makes the following policy recommendations.
(1)
The formulation of government environmental policies should consider the regional resource endowment, economic development level and other conditions and make policies that meet the region’s characteristics according to local conditions. For example, the Beijing–Tianjin–Hebei region’s main task is to eliminate low-end, polluting industries and achieve industrial transfer to reduce environmental pressure. The Yangtze River Delta and the Pearl River Delta have already reduced emissions and promoted synergistic regional environmental and economic development while achieving industrial clustering.
(2)
This study’s findings show significant differences in the effects of AP management in different provinces. AP management is a long-term process, and if we want to tackle AP at its root, we must adhere to the approach of regional coordination and joint prevention and control and strengthen policy communication and coordination to win the blue sky defense war.
(3)
The results of the influence mechanism test show that high-quality economic development, population agglomeration, control of carbon emissions and optimization of energy structure are all important channels to reduce AP. Therefore, we need to change and transform the economic development mode, develop the circular economy, optimize the industrial structure and promote industrial transformation and upgrading. For example, we could promote the Beijing–Tianjin–Hebei region and other heavily polluted areas to revise the access conditions for high energy consumption, high pollution and resource-based industries, and clarify indicators such as resource and energy conservation and pollutant emissions. In addition, we could also promote population urbanization and create clean, low-carbon cities scientifically and rationally.
However, this paper also has some limitations. We will obtain a more nuanced conclusion when the quantitative results of the APPA policy effects are combined. In addition, the impact of the pandemic should be considered for inclusion in the research framework after COVID-19 in future studies.

Author Contributions

Conceptualization, H.Z. and X.W.; methodology, H.Z. and X.W.; software, H.Z. and X.W.; formal analysis, H.Z.; resources, H.Z. and X.S.; data curation, H.Z. and S.Y.; writing—original draft preparation, H.Z., writing—review and editing, H.Z. and S.Y.; supervision, X.S. and S.Y.; project administration, X.S. and H.Z.; funding acquisition, X.S.; All authors have read and agreed to the published version of the manuscript.

Funding

This work was supported by the project supported by the National Social Science Fund of China (19BGL276). The authors are grateful for the receipt of these funds.

Institutional Review Board Statement

Not applicable.

Informed Consent Statement

Not applicable.

Data Availability Statement

PM2.5 data were obtained from the Atmospheric Composition Analysis Organization. The predictor variable data were obtained from each province’s China Statistical Yearbook and Statistical Yearbooks.

Conflicts of Interest

The authors declare no conflict of interest.

References

  1. Balsalobre-Lorente, D.; Driha, O.M.; Halkos, G.; Mishra, S. Influence of Growth and Urbanization on CO2 Emissions: The Moderating Effect of Foreign Direct Investment on Energy Use in BRICS. Sustain. Dev. 2021, 30, 227–240. [Google Scholar] [CrossRef]
  2. Ramaswami, A.; Tong, K.; Fang, A.; Lal, R.M.; Nagpure, A.S.; Li, Y.; Yu, H.; Jiang, D.; Russell, A.G.; Shi, L.; et al. Urban Cross-Sector Actions for Carbon Mitigation with Local Health Co-Benefits in China. Nat. Clim. Chang. 2017, 7, 736–742. [Google Scholar] [CrossRef]
  3. Cole, M.A.; Elliott, R.J.R.; Liu, B. The Impact of the Wuhan COVID-19 Lockdown on Air Pollution and Health: A Machine Learning and Augmented Synthetic Control Approach. Environ. Resour. Econ. 2020, 76, 553–580. [Google Scholar] [CrossRef]
  4. Reis, L.A.; Drouet, L.; Tavoni, M. Internalising Health-Economic Impacts of Air Pollution into Climate Policy: A Global Modelling Study. Lancet Planet. Health 2022, 6, e40–e48. [Google Scholar] [CrossRef]
  5. Zhang, Q.; Zheng, Y.; Tong, D.; Shao, M.; Wang, S.; Zhang, Y.; Xu, X.; Wang, J.; He, H.; Liu, W.; et al. Drivers of Improved PM2.5 Air Quality in China from 2013 to 2017. Proc. Natl. Acad. Sci. USA 2019, 116, 24463–24469. [Google Scholar] [CrossRef]
  6. Song, C.; Wu, L.; Xie, Y.; He, J.; Chen, X.; Wang, T.; Lin, Y.; Jin, T.; Wang, A.; Liu, Y.; et al. Air Pollution in China: Status and Spatiotemporal Variations. Environ. Pollut. 2017, 227, 334–347. [Google Scholar] [CrossRef]
  7. Zhang, H.; Wang, S.; Hao, J.; Wang, X.; Wang, S.; Chai, F.; Li, M. Air Pollution and Control Action in Beijing. J. Clean. Prod. 2016, 112, 1519–1527. [Google Scholar] [CrossRef]
  8. The State Council of the People’s Republic of China. Air Pollution Prevention and Control Action Plan; The State Council of the People’s Republic of China: Beijing, China, 2013.
  9. Hu, M.; Wang, Y.; Wang, S.; Jiao, M.; Huang, G.; Xia, B. Spatial-Temporal Heterogeneity of Air Pollution and Its Relationship with Meteorological Factors in the Pearl River Delta, China. Atmos. Environ. 2021, 254, 118415. [Google Scholar] [CrossRef]
  10. Wu, X.; Tian, Z.; Kuai, Y.; Song, S.; Marson, S.M. Study on Spatial Correlation of Air Pollution and Control Effect of Development Plan for the City Cluster in the Yangtze River Delta. Socioecon. Plann. Sci. 2021, 83, 101213. [Google Scholar] [CrossRef]
  11. Lu, Z.; Huang, L.; Liu, J.; Zhou, Y.; Chen, M.; Hu, J. Carbon Dioxide Mitigation Co-Benefit Analysis of Energy-Related Measures in the Air Pollution Prevention and Control Action Plan in the Jing-Jin-Ji Region of China. Resour. Conserv. Recycl. X 2019, 1, 100006. [Google Scholar] [CrossRef]
  12. Evans, M.F.; Smith, V.K. Do New Health Conditions Support Mortality—Air Pollution Effects? J. Environ. Econ. Manag. 2005, 50, 496–518. [Google Scholar] [CrossRef]
  13. Fan, M.; He, G.; Zhou, M. The Winter Choke: Coal-Fired Heating, Air Pollution, and Mortality in China. J. Health Econ. 2020, 71, 102316. [Google Scholar] [CrossRef]
  14. Zheng, S.; Wang, J.; Sun, C.; Zhang, X.; Kahn, M.E. Air Pollution Lowers Chinese Urbanites’ Expressed Happiness on Social Media. Nat. Hum. Behav. 2019, 3, 237–243. [Google Scholar] [CrossRef]
  15. Zheng, B.; Huang, G.; Liu, L.; Li, J.; Li, Y. Development of a Multi-Factorial Enviro-Economic Analysis Model for Assessing the Interactive Effects of Combined Air Pollution Control Policies. Resour. Conserv. Recycl. 2021, 175, 105882. [Google Scholar] [CrossRef]
  16. Zhang, H.; Sun, X.; Bi, C.; Ahmad, M.; Wang, J. Can Sustainable Development Policy Reduce Carbon Emissions? Empirical Evidence from Resource-Based Cities in China. Sci. Total Environ. 2022, 838, 156341. [Google Scholar] [CrossRef]
  17. He, A.; Xue, Q.; Zhao, R.; Wang, D. Renewable Energy Technological Innovation, Market Forces, and Carbon Emission Efficiency. Sci. Total Environ. 2021, 796, 148908. [Google Scholar] [CrossRef]
  18. Kuznets, S. Economic Growth and Income Equality. Am. Econ. Rev. 1955, 45, 1–28. [Google Scholar]
  19. Sunak, M.Y. Impacts of Urbanization on Urban Structures and Energy Demand: What Can We Learn for Urban Energy Planning and Urbanization Management? Sustain. Cities Soc. 2011, 1, 45–53. [Google Scholar]
  20. Jie, H.; Richard, P. Environmental Kuznets Curve for CO2 in Canada. Ecol. Econ. 2010, 69, 1083–1093. [Google Scholar]
  21. Quan, C.; Cheng, X.; Yu, S.; Ye, X. Analysis on the Influencing Factors of Carbon Emission in China’s Logistics Industry Based on LMDI Method. Sci. Total Environ. 2020, 734, 138473. [Google Scholar] [CrossRef]
  22. Yahaya, N.S.; Hussaini, M.; Bashir, A.B. Population Growth and Environmental Degradation in Nigeria. Acad. J. Econ. Stud. 2020, 6, 31–35. [Google Scholar]
  23. Liang, L.; Wang, Z.; Li, J. The Effect of Urbanization on Environmental Pollution in Rapidly Developing Urban Agglomerations. J. Clean. Prod. 2019, 237, 117649. [Google Scholar] [CrossRef]
  24. Dong, Z.; Xia, C.; Fang, K.; Zhang, W. Effect of the Carbon Emissions Trading Policy on the Co-Benefits of Carbon Emissions Reduction and Air Pollution Control. Energy Policy 2022, 165, 112998. [Google Scholar] [CrossRef]
  25. Zheng, Y.; Peng, J.; Xiao, J.; Su, P.; Li, S. Industrial Structure Transformation and Provincial Heterogeneity Characteristics Evolution of Air Pollution: Evidence of a Threshold Effect from China. Atmos. Pollut. Res. 2020, 11, 598–609. [Google Scholar] [CrossRef]
  26. Yan, J.; Zhao, J.; Yang, X.; Su, X.; Wang, H.; Ran, Q.; Shen, J. Does Low-Carbon City Pilot Policy Alleviate Urban Haze Pollution? Empirical Evidence from a Quasi-Natural Experiment in China. Int. J. Environ. Res. Public Health 2021, 18, 1287. [Google Scholar] [CrossRef] [PubMed]
  27. Chen, H.; Xu, Y. Environmental Regulation and Exports: Evidence from the Comprehensive Air Pollution Policy in China. Int. J. Environ. Res. Public Health 2021, 18, 1316. [Google Scholar] [CrossRef]
  28. Liu, F.; Fan, Y.; Yang, S. Environmental Benefits of Innovation Policy: China’s National Independent Innovation Demonstration Zone Policy and Haze Control. J. Environ. Manag. 2022, 317, 115465. [Google Scholar] [CrossRef]
  29. Li, T.; Ma, J.; Mo, B. Does Environmental Policy Affect Green Total Factor Productivity? Quasi-Natural Experiment Based on China’s Air Pollution Control and Prevention Action Plan. Int. J. Environ. Res. Public Health 2021, 18, 8216. [Google Scholar] [CrossRef]
  30. Li, M.; Dong, L.; Luan, J.; Wang, P. Do Environmental Regulations Affect Investors? Evidence from China’s Action Plan for Air Pollution Prevention. J. Clean. Prod. 2020, 244, 118817. [Google Scholar] [CrossRef]
  31. Huang, J.; Pan, X.; Guo, X.; Li, G. Health Impact of China’s Air Pollution Prevention and Control Action Plan: An Analysis of National Air Quality Monitoring and Mortality Data. Lancet Planet. Health 2018, 2, e313–e323. [Google Scholar] [CrossRef]
  32. Zhang, Z.; Zhang, J.; Feng, Y. Assessment of the Carbon Emission Reduction Effect of the Air Pollution Prevention and Control Action Plan in China. Int. J. Environ. Res. Public Health 2021, 18, 13307. [Google Scholar] [CrossRef] [PubMed]
  33. Siyue, Y.; Feng, W.; Na, L. Assessment of the Air Pollution Prevention and Control Action Plan in China: A Difference-in-Difference Analysis. China Popul. Resour. Environ. 2020, 30, 110–117. [Google Scholar]
  34. The State Council of the People’s Republic of China. The Eleventh Five-Year Plan for National Economic and Social Development of the People’s Republic of China; The State Council of the People’s Republic of China: Beijing, China, 2006; ISBN 0123456789.
  35. The State Council of the People’s Republic of China. The Twelfth Five-Year Plan for Energy Saving and Emission Reduction; The State Council of the People’s Republic of China: Beijing, China, 2012.
  36. Abadie, A.; Diamond, A.; Hainmueller, J. Synthetic Control Methods for Comparative Case Studies: Estimating the Effect of California’s Tobacco Control Program. J. Am. Stat. Assoc. 2010, 105, 493–505. [Google Scholar] [CrossRef]
  37. Abadie, A.; Diamond, A.J.; Hainmueller, J. Comparative Politics and the Synthetic Control Method. Am. J. Pol. Sci. 2012, 59, 495–510. [Google Scholar] [CrossRef]
  38. Abadie, A.; Gardeazabal, J. The Economic Costs of Conflict: A Case Study of the Basque Country. Am. Econ. Rev. 2003, 93, 113–132. [Google Scholar] [CrossRef]
  39. Dong, J.; Li, S.; Xing, J.; Sun, Y.; Yang, J.; Ren, L.; Zeng, X.; Sahu, S.K. Air Pollution Control Benefits in Reducing Inter-Provincial Trade-Associated Environmental Inequality on PM2.5-Related Premature Deaths in China. J. Clean. Prod. 2022, 350, 131435. [Google Scholar] [CrossRef]
  40. Ahmad, M.; Ahmed, Z.; Yang, X.; Hussain, N.; Sinha, A. Financial Development and Environmental Degradation: Do Human Capital and Institutional Quality Make a Difference? Gondwana Res. 2021, 105, 299–310. [Google Scholar] [CrossRef]
  41. Wang, S.; Zhao, B.; Wu, Y.; Hao, J. Target and Measures to Prevent and Control Ambient Fine Particle Pollution in China. Chin. J. Environ. Manag. 2015, 7, 37–43. [Google Scholar]
  42. Zhang, H.; Sun, X.; Ahmad, M.; Lu, Y.; Xue, C. A Step Towards a Green Future: Does Sustainable Development Policy Reduce Energy Consumption in Resource-Based Cities of China? Front. Environ. Sci. 2022, 10, 901721. [Google Scholar] [CrossRef]
  43. Tan, Z.; Koondhar, M.A.; Nawaz, K.; Malik, M.N.; Khan, Z.A.; Koondhar, M.A. Foreign Direct Investment, Financial Development, Energy Consumption, and Air Quality: A Way for Carbon Neutrality in China. J. Environ. Manag. 2021, 299, 113572. [Google Scholar] [CrossRef]
  44. Yu, X.; Shen, M.; Wang, D.; Imwa, B.T. Does the Low-Carbon Pilot Initiative Reduce Carbon Emissions? Evidence from the Application of the Synthetic Control Method in Guangdong Province. Sustainability 2019, 11, 3979. [Google Scholar] [CrossRef]
Figure 1. APPA implementation focus areas.
Ijerph 19 10211 g001
Figure 2. Temporal trends of AP in the treatment and control provinces.
Ijerph 19 10211 g002
Figure 3. Air pollution in the treatment and synthetic provinces.
Ijerph 19 10211 g003aIjerph 19 10211 g003b
Figure 4. Robustness Tests for Changing Policy Point-in-Time.
Ijerph 19 10211 g004
Figure 5. Placebo test result−2. Note: (1)–(7) represent Beijing, Hebei, Anhui, Shanghai, Zhejiang, Jiangsu, and Guangdong.
Ijerph 19 10211 g005
Table 1. Energy Conversion Factor.
Energy TypeCarbon Dioxide
Raw Coal1.9003
Coke2.8604
Crude Oil3.0202
Gasoline2.9251
Kerosene3.0179
Diesel3.0959
Fuel Oil3.175
Liquefied Petroleum Gas3.1013
Natural Gas21.622
Table 2. Variable Measurements and Sources.
VariablesMeasurementUnitSource
APConcentration of PM2.5μg/m3Atmospheric Composition Analysis Organization
ECOGDP per capitaYuan/personChina Statistical Yearbook
POPPopulation size10,000 peopleChina Statistical Yearbook
CO2Save CO2 emissionsmillion tonsChina Statistical Yearbook
ISSecondary Industry%China Statistical Yearbook
Table 3. Descriptive Statistics.
GroupVariableNMeansdMinMax
Treatment groupPM2.514047.710.5425.4470.44
ECO14051,702.5135,611.664867.41164,220
POP1405706.752774.2135711,521
CO214040,904.9324,749.0310,049.1594,794.99
IS14044.89.7816.256.6
Control groupPM2.546038.5414.219.5785.63
ECO46029,549.8422,075.692661.56120,711
POP4604024.522493.3451710,070
CO246029,999.2926,095.49547.5379151,523.5
IS46045.757.5719.7661.5
TotalPM2.560040.6813.989.5785.63
ECO60034,718.7927,489.222661.56164,220
POP6004417.042656.4651711,521
CO260032,543.9426,177.52547.5379151,523.5
IS60045.538.1416.261.5
Table 4. Comparison of predictor variables.
lnECOlnPOPlnISlnCO2lnAP (2000)lnAP (2006)lnAP (2010)
Beijing10.76597.3948 3.3710 9.3905 3.8960 4.1900 4.1478
Synthetic Beijing9.58989.0916 3.9581 10.6459 3.8959 4.2145 4.1454
Hebei9.7250 8.8436 3.9509 10.9322 3.8212 4.1632 4.0702
Synthetic Hebei9.7629 8.8452 3.9633 10.7669 3.8189 4.1480 4.0542
Anhui9.2911 8.7289 3.8353 10.0145 3.7721 4.0292 3.9961
Synthetic Anhui9.8079 8.6492 3.9319 10.6340 3.7368 4.0411 3.9922
Shanghai10.967037.5421 3.8199 10.0236 3.6197 3.8397 3.8033
Synthetic Shanghai9.8962278.6023 3.9335 10.4393 3.5990 3.8897 3.8033
Zhejiang10.3239 8.5148 3.9588 10.3069 3.5501 3.6719 3.6940
Synthetic Zhejiang9.7799 8.1752 3.8927 10.1261 3.5296 3.7280 3.7052
Jiangsu10.2488 8.9351 3.9827 10.7251 3.7918 4.0997 4.0193
Synthetic Jiangsu9.8629 8.6790 3.9690 10.8428 3.7714 4.1156 4.0287
Guangdong10.2014 9.1093 3.9303 10.6028 3.3686 3.7138 3.5646
Synthetic Guangdong9.6877 8.3934 3.7995 9.5839 3.3749 3.7130 3.5881
Table 5. Synthetic province weighting factor.
Synthetic ProvinceSynthetic Weight
Synthetic BeijingHenanHubeiNingxiaShandong
0.565 0.059 0.044 0.332
Synthetic HebeiHenanLiaoningShandongShanxiXinjiang
0.355 0.129 0.359 0.075 0.082
Synthetic AnhuiHenanInner MongoliaShandongXinjiang
0.190 0.125 0.476 0.208
Synthetic ShanghaiFujianHenanHeilongjiangLiaoningInner MongoliaShandongXinjiang
0.025 0.165 0.021 0. 0480.120 0.342 0.054
Synthetic ZhejiangFujianHenanHeilongjiangLiaoningInner MongoliaShandongXinjiang
0.162 0.072 0.154 0.083 0.030 0.130 0.368
Synthetic JiangsuInner MongoliaNingxiaShandongShanxiXinjiang
0.044 0.024 0.655 0.182 0.094
Synthetic GuangdongFujianGuangxiHainanShandong
0.406 0.430 0.028 0.136
Table 6. DID results.
VARIABLES(1)(2)
lnAPlnAP
Treat × time−0.1305 ***−0.1254 ***
(0.0185)(0.0195)
lnECO −0.1180 ***
(0.0385)
lnPOP −0.3116 ***
(0.0781)
lnCO2 0.0681 ***
(0.0239)
lnIS −0.1299 **
(0.0548)
Constant3.5193 ***6.9513 ***
(0.0167)(0.8062)
Observations600600
R-squared0.6540.673
Number of code3030
City FEYesYes
Year FEYesYes
Control variablesNoYes
Note: Standard errors in parentheses. *** p < 0.01,** p < 0.05.
Table 7. Placebo test result-1.
ProvinceRMSPENumber of Dashed LinesNumber of Edge DashesP(Φ)Placebo Test
Beijing0.0203811700Significant
Hebei0.0155121320.154Significant
Anhui0.0151861420.1430Significant
Shanghai0.0205811740.235Insignificant
Zhejiang0.0238251500Significant
Jiangsu0.0242621630.1875Significant
Guangdong0.0141851210.083Significant
Table 8. Regression results of Mechanism Testing.
VARIABLES(1)(2)(3)(4)
lnECOlnPOPlnCO2lnIS
Treat × time−0.1938 ***0.0853 ***−0.1912 ***−0.0907 ***
(0.0269)(0.0113)(0.0363)(0.0192)
Constant8.8928 ***8.0952 ***9.2828 ***3.7780 ***
(0.0243)(0.0102)(0.0327)(0.0174)
Observations600600599600
R-squared0.9700.4270.8460.446
Number of provinces30303030
City FEYesYesYesYes
Year FEYesYesYesYes
Control variablesYesYesYesYes
Note: Standard errors in parentheses. *** p < 0.01.
Publisher’s Note: MDPI stays neutral with regard to jurisdictional claims in published maps and institutional affiliations.

