
Tempo-Spatial Modelling of the Spread of COVID-19 in Urban Spaces

 ,
,  , and
, and
Abstract
:1. Introduction
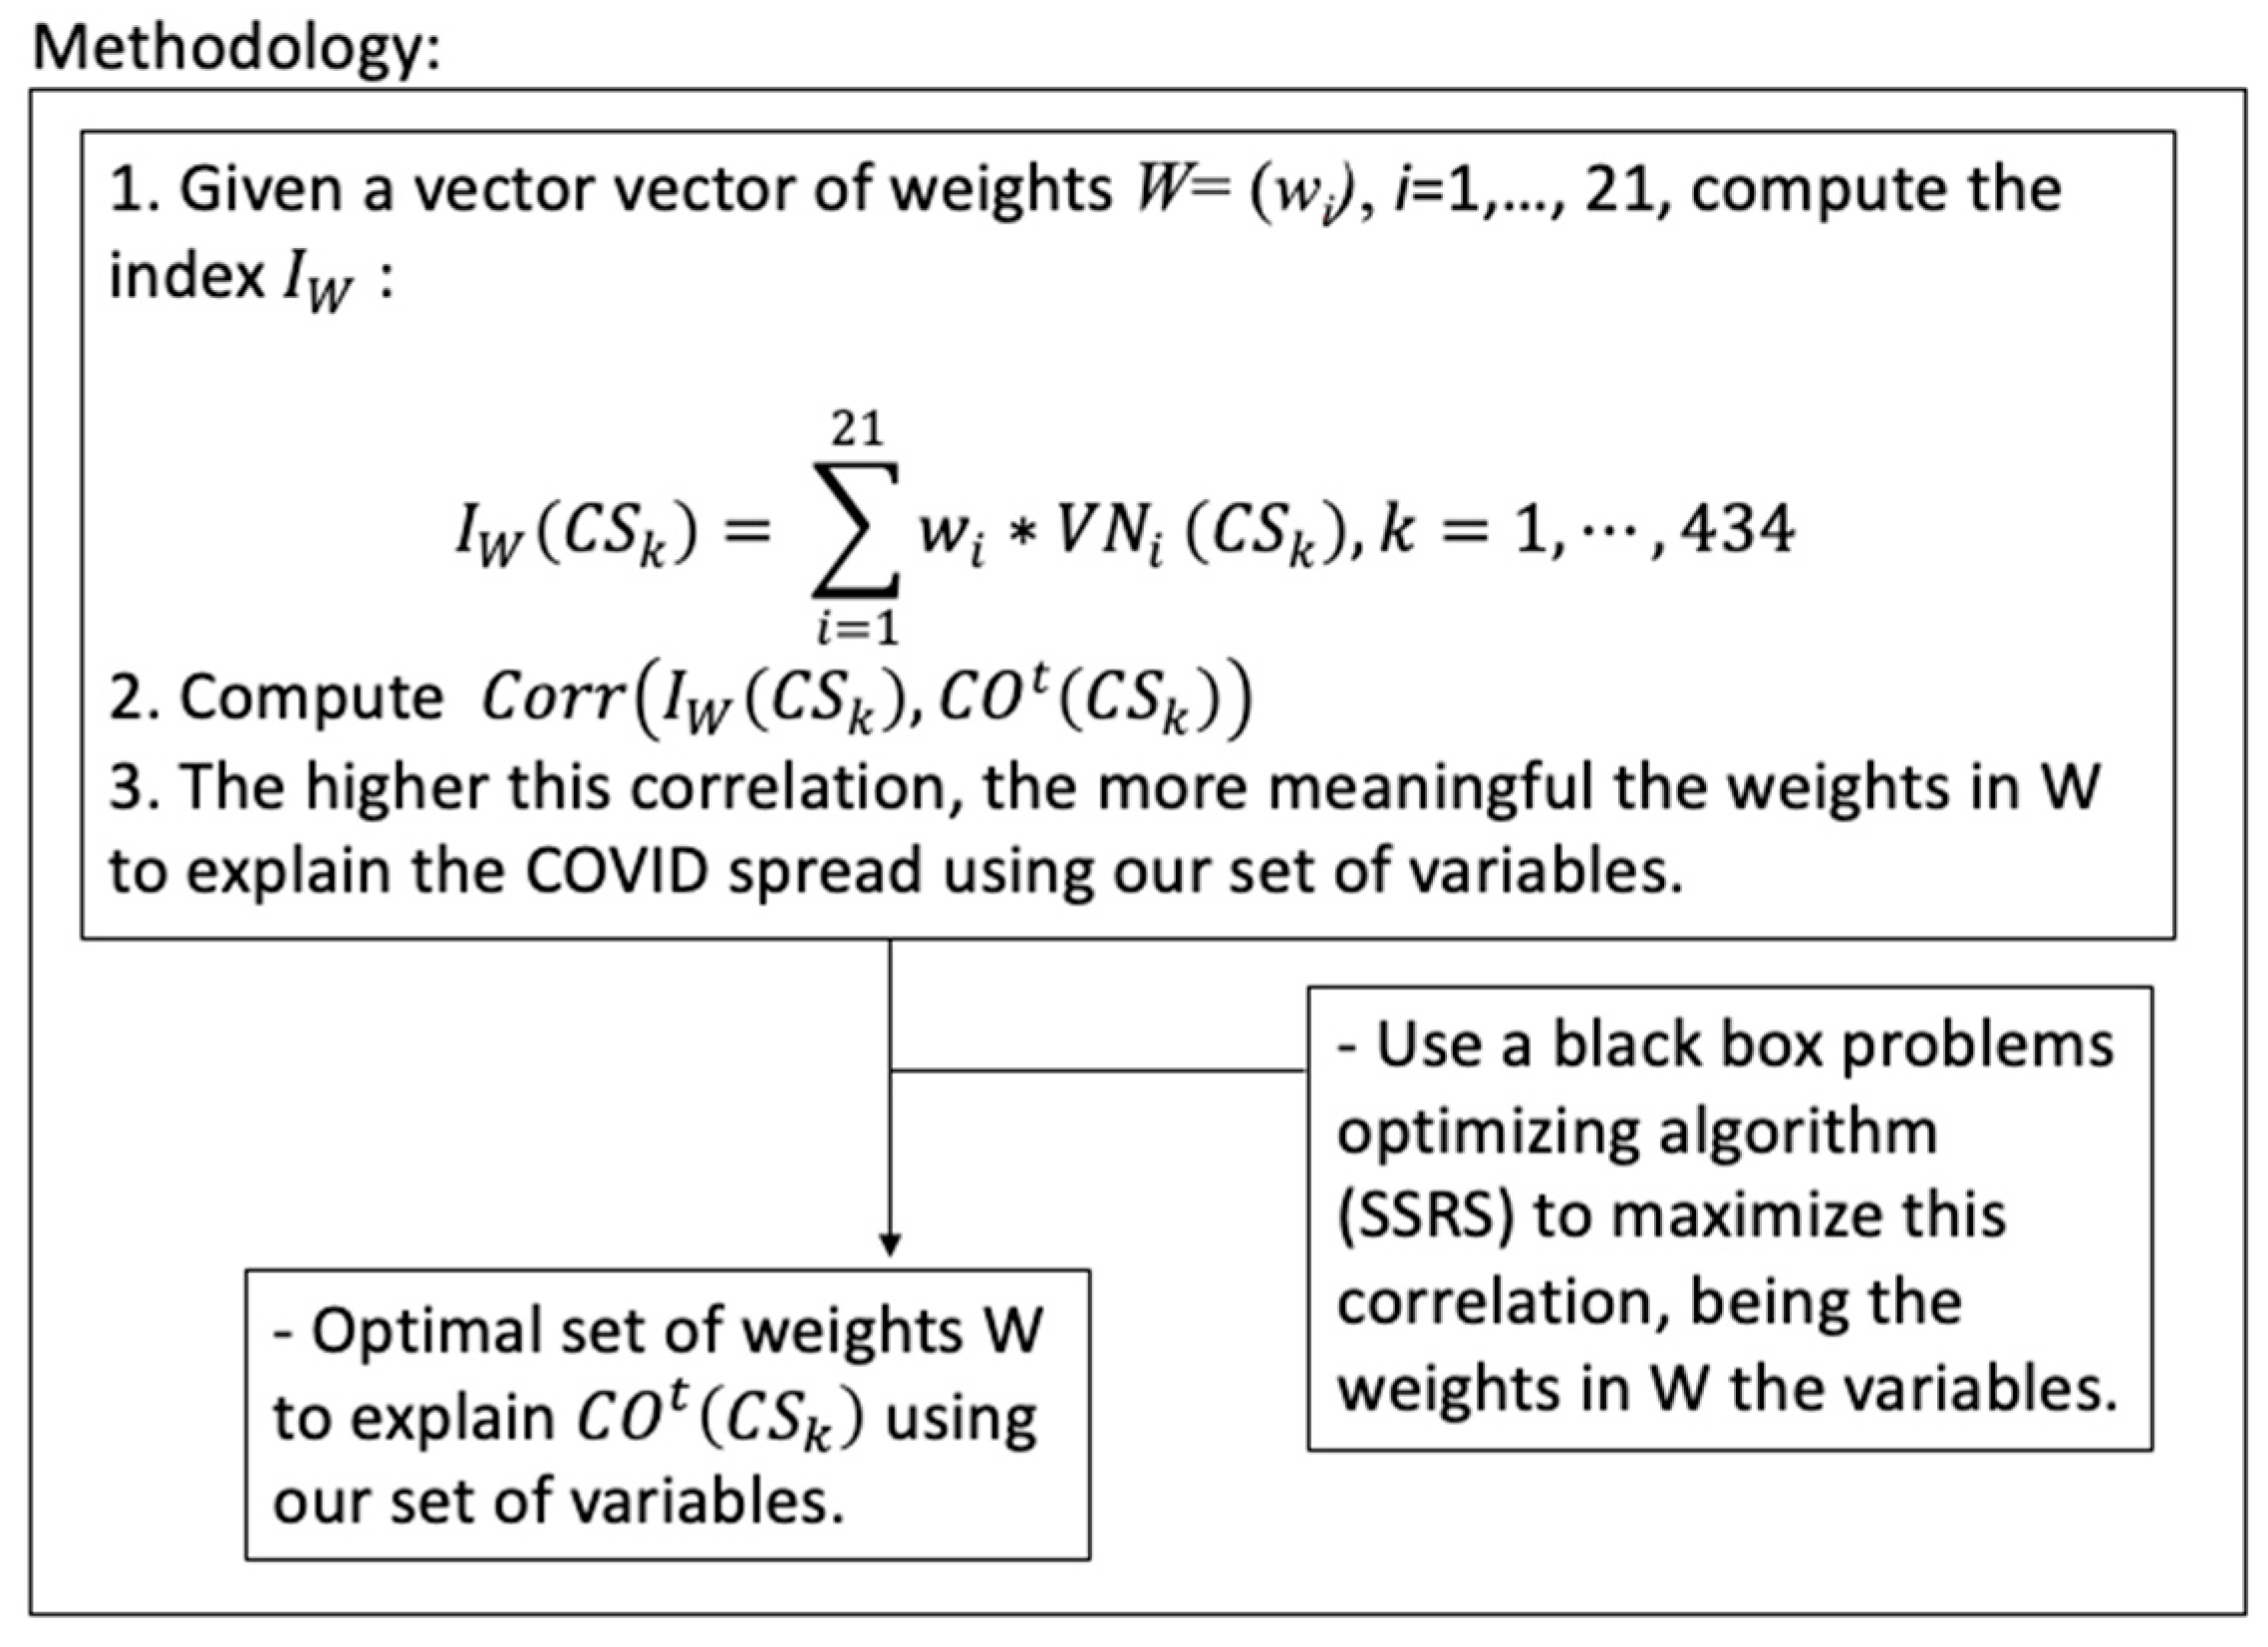
2. Methods
3. Results and Discussion
4. Conclusions
Author Contributions
Funding
Institutional Review Board Statement
Informed Consent Statement
Data Availability Statement
Acknowledgments
Conflicts of Interest
References
- El Khateeb, S.; Shawket, I.M. A new perception; generating well-being urban public spaces after the era of pandemics. Dev. Built Environ. 2022, 9, 100065. [Google Scholar] [CrossRef]
- Honey-Rosés, J.; Anguelovski, I.; Chireh, V.K.; Daher, C.; Konijnendijk, C.; Litt, J.S.; Mawani, V.; McCall, M.C.; Orellana, A.; Oscilowicz, E.; et al. The impact of the COVID-19 on public space: An early review of the emerging questions-design, perceptions and inequities. Cities Health 2020, 5 (Suppl. 1), S263–S279. [Google Scholar] [CrossRef]
- Florida, R.; Rodríguez-Pose, A.; Storper, M. Cities in a Post-COVID-19 World. Urban Studies 2021. [Google Scholar] [CrossRef]
- Galacho-Jiménez, F.B.; Carruana-Herrera, D.; Molina, J.; Ruiz-Sinoga, J.D. Evidence of the Relationship between Social Vulnerability and the Spread of COVID-19 in Urban Spaces. Int. J. Environ. Res. Public Health 2022, 19, 5336. [Google Scholar] [CrossRef] [PubMed]
- Tsiotas, D.; Axelis, N.; Polyzos, S. A methodological framework for defining city dipoles in urban systems based on a functional attribute. Cities 2021, 119, 103387. [Google Scholar] [CrossRef]
- Askarizad, R.; Jinliao, H.; Jafari, S. The influence of COVID-19 on the societal mobility of urban spaces. Cities 2021, 119, 103388. [Google Scholar] [CrossRef]
- Mena, G.E.; Martínez, P.P.; Mahmud, A.S.; Marquet, P.A.; Buckee, C.O.; Santillana, M. Socioeconomic status determines COVID-19 incidence and related mortality in Santiago, Chile. Science 2021, 372, 5298. [Google Scholar] [CrossRef]
- Barboza, M.; Marttila, A.; Burström, B.; Kulane, A. COVID-19 and pathways to health inequities for families in a socioeconomically disadvantaged area of Sweden—Qualitative analysis of home visitors’ observations. Int. J. Equity Health 2021, 20, 215. [Google Scholar] [CrossRef]
- Okonkwo, N.E.; Aguwa, U.T.; Jang, M.; Barré, I.A.; Page, K.R.; Sullivan, P.S.; Beyrer, C.H.; Baral, S. COVID-19 and the US response: Accelerating health inequities. BMJ Evid.-Based Med. 2021, 26, 176–179. Available online: https://ebm.bmj.com/content/ebmed/26/4/176.full.pdf (accessed on 20 July 2022). [CrossRef]
- Drefahl, S.; Wallace, M.; Mussino, E.; Aradhya, S.; Kolk, M.; Brandén, M.; Malmberg, B.; Andersson, G. A population-based cohort study of socio-demographic risk factors for COVID-19 deaths in Sweden. Nat. Commun. 2020, 11, 5097. [Google Scholar] [CrossRef]
- Wachtler, B.; Müters, S.; Michalski, N.; Koschollek, C.; Albrecht, S.; Haller, S.; Hamouda, O.; Hövener, C.; Hoebel, J. Socioeconomic inequalities in the prevalence and perceived dangerousness of SARS-CoV-2 infections in two early German hotspots: Fndings from a seroepidemiological study. BMC Res. Notes 2021, 14, 375. [Google Scholar] [CrossRef] [PubMed]
- Dueñas, M.; Campi, M.; Olmos, L.E. Changes in mobility and socioeconomic conditions during the COVID-19 outbreak. Humanit. Soc. Sci. Commun. 2021, 8, 101. [Google Scholar] [CrossRef]
- Davidescu, A.A.; Apostu, S.A.; Stoica, L.A. Socioeconomic Effects of COVID-19 Pandemic: Exploring Uncertainty in the Forecast of the Romanian Unemployment Rate for the Period 2020–2023. Sustainability 2021, 13, 7078. [Google Scholar] [CrossRef]
- Zárate, A. The Urban Mosaic. Internal Organization and Life in Cities; Editorial Cincel: Madrid, Spain, 1984; 164p, ISBN 10: 8470463551, 13: 9788470463556. [Google Scholar]
- Castell, M. The Urban Question; Editorial Siglo XXI: Mexico City, Mexico, 2004; 528p, ISBN 978-968-23-2173-3. [Google Scholar]
- Hombrados-Mendietaa, I.; López-Espigares, T. Dimensiones del sentido de comunidad que predicen la calidad de vida residencial en barrios con diferentes posiciones socioeconómicas. Psychosoc. Interv. 2014, 23, 159–167. [Google Scholar] [CrossRef] [Green Version]
- Hombrados, M.I.; Gómez, L. Community Organization; Gómez, L., Canto, J.M., Eds.; Social Psychology Piramide: Madrid, Spain, 2000; pp. 275–289. ISBN 84-368-1133-X. [Google Scholar]
- Wirth, L. Urbanism as a Way of Live. Am. J. Sociol. 1938, 44, 1–24. Available online: http://www.jstor.org/stable/2768119 (accessed on 20 July 2022).
- Wirth, L.; Reiss, A.J. Louis Wirth on Cities and Social Life: Selected Papers; University of Chicago Press: Chicago, IL, USA, 1964; 172p. [Google Scholar]
- Shaw, M. The Ecology of Social Change: Wolverhampton 1851–1871. Trans. Inst. Br. Geogr. 1977, 2, 332–348. [Google Scholar] [CrossRef]
- Abbott, W.F. Social Area Analysis in Comparative Perspective: Moscow in 1897 as a Preindustrial City. Sociol. Q. 1978, 19, 24–36. Available online: http://www.jstor.org/stable/4105910 (accessed on 18 July 2022). [CrossRef]
- Adda, J. Economic Activity and the Spread of Viral Diseases: Evidence from High Frequency Data. Q. J. Econ. 2016, 131, 891–941. [Google Scholar] [CrossRef] [Green Version]
- Marmot, M.; Allen, J.; Bell, R.; Bloomer, E.; Goldblatt, P. WHO European review of social determinants of health and the health divide. Lancet 2012, 380, 1011–1029. [Google Scholar] [CrossRef]
- Whitehead, M.; Pennington, A.; Orton, L.; Nayak, S.H.; Petticrew, M.; Sowden, A.; White, M. How could differences in ‘control over destiny’ lead to socio-economic inequalities in health? A synthesis of theories and pathways in the living environment. Health Place 2016, 39, 51–61. [Google Scholar] [CrossRef] [Green Version]
- Valenzuela-Levi, N.; Echiburu, T.; Correa, J.; Hurtubia, R.; Muñoz, J.C. Housing and accessibility after the COVID-19 pandemic: Rebuilding for resilience, equity and sustainable mobility. Transp. Policy 2021, 109, 48–60. [Google Scholar] [CrossRef]
- Bohman, H.; Ryan, J.; Stjernborg, V.; Nilsson, D. A study of changes in everyday mobility during the COVID-19 pandemic: As perceived by people living in Malmö, Sweden. Transp. Policy 2021, 106, 109–119. [Google Scholar] [CrossRef]
- Kephart, J.L.; Delclòs-Alió, X.; Rodríguez, D.A.; Sarmiento, O.L.; Barrientos-Gutiérrez, T.; Ramírez-Zea, M.; Quistberg, D.A.; Bilal, U.; Diez-Roux, A.V. The effect of population mobility on COVID-19 incidence in 314 Latin American cities: A longitudinal ecological study with mobile phone location data. Lancet Digit. Health 2021, 3, e716–e722. [Google Scholar] [CrossRef]
- Wielechowski, M.; Czech, K.; Grzęda, Ł. Decline in Mobility: Public Transport in Poland in the time of the COVID-19 Pandemic. Economies 2020, 8, 78. [Google Scholar] [CrossRef]
- Qiu, Y.; Chen, X.; Shi, W. Impacts of social and economic factors on the transmission of coronavirus disease 2019 (COVID-19) in China. J. Popul. Econ. 2020, 33, 1127–1172. [Google Scholar] [CrossRef]
- Awawdeh, R.; Melhem, S.; Alqudah, N.; Al-smadi, T.; Mustafa, A. Analyzing the Most Influencing Factors in Limiting the Spread of COVID-19 Disease. In Proceedings of the Sixth International Congress on Information and Communication Technology; Yang, X.S., Sherratt, S., Dey, N., Joshi, A., Eds.; Springer: Singapore, 2021; Volume 216. [Google Scholar] [CrossRef]
- Martín, E.B.; Peña, M.C.G.; Cots, P.M.; Luque, J.M.; Pastor, M.P.; Sinoga, J.D.R. Vulnerabilidad en Los Barrios de Málaga 2020; Edición Fundación CIEDES: Málaga, Spain, 2021; ISBN 978-84-09-32208-4. Available online: https://ciedes.es/publicaciones/otras-publicaciones/4840-estudio-sobre-la-vulnerabilidad-en-los-barrios-de-m%C3%A1laga-2.html (accessed on 21 July 2022).
- Laguna, M.; Molina, J.; Perez, F.; Caballero, R.; García, A. The Challenge of Optimising Expensive Black Boxes, A Scatter Search/Rough Set Theory Approach. J. Oper. Res. Soc. 2010, 61, 53–67. Available online: https://www.jstor.org/stable/40540228 (accessed on 21 July 2022). [CrossRef]
- Del Barrio, E.; Castejón, P.; Sancho, M.; Tortosa, M.A.; Sundström, G.; Malmberg, B. Loneliness among the Elderly in Spain and Sweden: Context and Culture. Rev. Esp. Geriatr. Gerontol. 2010, 45, 189–195. [Google Scholar] [CrossRef]
- Paino, L.; Poblet, L.; Ríos, L. The elderly living alone and malnutrition. SOLGER Study. Aten. Primaria 2017, 49, 450–458. [Google Scholar] [CrossRef]
- Hernández, A.; Rodríguez, R.; Rodríguez, I.; Gómez, J.M.; González, I.; Córdoba, R.; Alguacil, J.; Camacho, J.; Carmona, F.; Jaramillo, S. Vulnerable Neighbourhoods of the Big Spanish Cities. 1991/2001/2011; Instituto Juan de Herrera (IJH): Madrid, Spain, 2018; Available online: https://oa.upm.es/51015/ (accessed on 21 July 2022).
- Martinez, R.; Fernández, A. Social and Economic Impact of Illiteracy: Model of Analysis and Pilot Study 2010. Informe de la Comisión Económica para América Latina y el Caribe (CEPAL); Organización de las Naciones Unidas para la Educación, la Ciencia y la Cultura; 84p, Available online: https://www.cepal.org/es/publicaciones/3747-impacto-social-economico-analfabetismo-modelo-analisis-estudio-piloto (accessed on 21 November 2021).
- Bramley, G.; Power, S. Urban form and social sustainability: The role of density and housing type. Environ. Plan. B Plan. Des. 2009, 36, 30–48. [Google Scholar] [CrossRef]
- Ahmad, H. A Comprehensive Review on the Effects of COVID-19 Pandemic on Public Urban Spaces. Archit. Urban Plan. 2021, 17, 79–87. [Google Scholar] [CrossRef]
- Garcia-López, M.À.; Nicolini, R.; Roig Sabaté, J.L. Urban Spatial Structure in Barcelona (1902–2011): Immigration, Spatial Segregation and New Centrality Governance. Appl. Spat. Anal. 2021, 14, 591–629. [Google Scholar] [CrossRef]
- Wu, C.; Smith, D.; Wang, M. Simulating the urban spatial structure with spatial interaction: A case study of urban polycentricity under different scenarios. Comput. Environ. Urban Syst. 2021, 89, 101677. [Google Scholar] [CrossRef]
- López-Jiménez, J. The processes of residential and socio-economic segregation linked to the unequal intervention in urbanism and housing: The case of Alicante. Boletín Asoc. Geógrafos Españoles 2020, 86, 1–35. [Google Scholar] [CrossRef]
- Peponis, J.; Ross, C.; Rashids, M. The Structure of Urban Space, Movement and Co-presence: The Case of Atlanta. Geoforum 1997, 28, 341–358. [Google Scholar] [CrossRef]
- Park, R.E. The City and Other Urban Ecology Essays; Ediciones del Serbal: Barcelona, Spain, 1999; 148p, Available online: https://www.academia.edu/4245532/La_ciudad_y_otros_ensayos_de_ecologia_urbana_Park_Robert_Ezra (accessed on 30 November 2021).
- Park, R.E.; Burgess, E.W. The City; University of Chicago Press: Chicago, IL, USA, 2019. [Google Scholar] [CrossRef]
- Egea, C.; Nieto, J.A.; Domínguez, J.; González, R.A. Vulnerability of the Social Fabric of Disadvantaged Neighbourhoods in Andalusia. Analysis and Potentialities; Centro de Estudios Andaluces, Consejería de la Presidencia, Junta de Andalucía: Sevilla, Spain, 2008; 383p, Available online: https://www.centrodeestudiosandaluces.es/datos/factoriaideas/ifo11_08.pdf (accessed on 12 December 2021).
- Steckermeier, L.C.; Delhey, J. Better for Everyone? Egalitarian Culture and Social Wellbeing in Europe. Soc. Indic. Res. 2019, 143, 1075–1108. [Google Scholar] [CrossRef] [Green Version]
- Fusco, A.; Guio, A.C.; Marlier, E. Building a Material Deprivation Index in a Multinational Context: Lessons from the EU Experience. In Poverty and Social Exclusion Around the Mediterranean Sea, Economic Studies in Inequality, Social Exclusion and Well-Being 9; Bérenger, V., Bresson, F., Eds.; Springer Science + Business Media: New York, NY, USA, 2013. [Google Scholar] [CrossRef]
- Pampalon, R.; Raymond, G. A deprivation index for health and welfare planning in Quebec. Chronic Dis. Can. 2000, 21, 104–113. Available online: https://pubmed.ncbi.nlm.nih.gov/11082346/ (accessed on 21 July 2022).
- Franch-Pardo, I.; Desjardins, M.R.; Barea-Navarro, I.; Cerdà, A. A review of GIS methodologies to analyze the dynamics of COVID-19 in the second half of 2020. Trans. GIS 2021, 25, 2191–2239. [Google Scholar] [CrossRef] [PubMed]
- Jiao, J.; Chen, Y.; Azimian, A. Exploring temporal varying demographic and economic disparities in COVID-19 infections in four U.S. areas: Based on OLS, GWR, and random forest models. Comput. Urban Sci. 2021, 1, 1–16. [Google Scholar] [CrossRef]
- Kang, J.Y.; Michels, A.; Lyu, F.; Wang, S.; Agbodo, N.; Freeman, V.L.; Wang, S. Rapidly measuring spatial accessibility of COVID-19 healthcare resources: A case study of Illinois, USA. Int. J. Health Geogr. 2020, 19, 36. [Google Scholar] [CrossRef]
- Kim, K.; Ghorbanzadeh, M.; Horner, M.W.; Ozguven, E.E. Identifying areas of potential critical healthcare shortages: A case study of spatial accessibility to ICU beds during the COVID-19 pandemic in Florida. Transp. Policy 2021, 110, 478–486. [Google Scholar] [CrossRef]
- Ismail, M.; Warsame, A.; Wilhelmsson, M. An Exploratory Analysis of Housing and the Distribution of COVID-19 in Sweden. Buildings 2022, 12, 71. [Google Scholar] [CrossRef]
- Shaw, M. Housing and Public Health. Annu. Rev. Public Health 2004, 25, 397–418. Available online: https://www.annualreviews.org/doi/abs/10.1146/annurev.publhealth.25.101802.123036 (accessed on 21 July 2022). [PubMed] [Green Version]
- Tomal, M.; Helbich, M. The private rental housing market before and during the COVID-19 pandemic: A submarket analysis in Cracow, Poland. Environ. Plan. B Urban Anal. City Sci. 2022, 49, 1646–1662. [Google Scholar] [CrossRef] [PubMed]
- Tajani, F.; Liddo, F.D.; Guarini, M.R.; Ranieri, R.; Anelli, D. An Assessment Methodology for the Evaluation of the Impacts of the COVID-19 Pandemic on the Italian Housing Market Demand. Buildings 2021, 11, 592. [Google Scholar] [CrossRef]
- Amerio, A.; Brambilla, A.; Morganti, A.; Aguglia, A.; Bianchi, D.; Santi, F.; Costantini, L.; Odone, A.; Costanza, A.; Signorelli, C.; et al. COVID-19 Lockdown: Housing Built Environment’s Effects on Mental Health. Int. J. Environ. Res. Public Health 2020, 17, 5973. [Google Scholar] [CrossRef]


| Variable | Definition | Unit | Source | Date | |
|---|---|---|---|---|---|
| Demographic | (1) Dependency | Persons under 16 and over 64 years of age with respect to the total active population | % | Municipal Register, OMAU | 2019 |
| (2) Ageing | Persons over 64 years of age compared to those under 16 years of age | % | Municipal Register, OMAU | 2019 | |
| (3) 75+ alone | Persons over 75 who live alone out of the total population | % | Municipal Register, OMAU | 2019 | |
| (4) Life expectancy | Average age reached by the population | Years | Municipal Register, OMAU | 2019 | |
| Socioeconomic | (5) Household income | Average annual net income of households (set of income received minus taxes and social security contributions) | Thousand euros | INE, OMAU | 2017 |
| (6) Illiterate or uneducated population | Percentage of the population over 16 years of age that is illiterate or has no education | % | INE (Census) | 2011 | |
| (7) Job seekers | Percentage of the population between 16 and 65 years of age registered with the public employment services to search for a job or for other purposes | % | SEPE, Municipal Register | Dec. 2019 | |
| (8) Work intensity | Percentage of household members willing to work who work | % | Survey | 2019 | |
| (9) No severe material deprivation | Constructed index that indicates the percentage of the population that lives in households that can afford at least six items out of a ratio of nine | % | Survey | 2019 | |
| Welfare | (10) People served | Percentage of people served by community social service centres over the total population | % | SIUSS | 2019 |
| (11) Social integration needs detected | Percentage of assessments made by community social services professionals on social integration needs presented by users | % | SIUSS | 2019 | |
| (12) Resources applied to subsistence needs | Percentage of resources applied from community social service centres to meet subsistence needs of the population served | % | SIUSS | 2019 | |
| Territorial | (13) Green zones | Total green areas per inhabitant, square meters per inhabitant | Square meters per inhab. | OMAU | 2019 |
| (14) Altitude | Own elaboration from E:1.10.000 and from the centroid of each neighbourhood meters | meters | Topographic map | 2018 | |
| (15) Orientation | Own elaboration from the MDT of Malaga with ArcGis | Degrees longitude | Topographic map | 2018 | |
| (16) Torrentiality | Incidence of large downpours | Rate | AEMET | 2012 | |
| (17) Differences on the maximum temperature | Own elaboration, through a field study based on a citizen science experiment | Degrees °C | Own elaboration | 2013 | |
| (18) Accessibility | Index built from a group of proximity variables | % population | OMAU | 2019 | |
| (19) Average size of the dwelling | Average size of the dwellings calculated from the size of the dwellings of the alphanumeric data of the cadastre | Square meters | OMAU. Cadastre | 2020 |
| Var. | Wave1 | Wave2 | Wave3 | Wave4 | Final |
|---|---|---|---|---|---|
| (1) Dep Rate | −0.138 | 0 | 0.7188 | 0 | −0.5606 |
| (2) 75+Alone | 0 | 0.2784 | −0.7016 | −0.5236 | 0 |
| (3) Ageing | −0.663 | −0.265 | 0 | −0.855 | −0.5877 |
| (4) LifExp | −0.3978 | 0 | 0 | 0.468 | 0.0128 |
| (5) HousInc | −0.1324 | 0.7749 | 0.2798 | 0.6951 | 0.3864 |
| (6) Illiterate | 0 | 0 | 0.8642 | 0.4294 | 0.3862 |
| (7) JobSeek | −0.9179 | 0.9915 | 0.1588 | −0.0621 | −0.1967 |
| (8) WorkInt | −0.1154 | 0 | 0.9325 | −0.2401 | 0.0296 |
| (9) NoSevDep | 0 | 0 | 0.8625 | 0.6583 | 0.899 |
| (10) PeopServ | −0.5864 | 0.5281 | 0 | 0 | 0.5591 |
| (11) SocIntNeeds | −0.6669 | 0.3737 | 0.0119 | 0 | 0.8369 |
| (12) NecSub | 0 | −0.3773 | −0.2207 | 0 | 0.5002 |
| (13) GreenZon | 0 | −0.3854 | 0 | 0 | 0.6778 |
| (14) Altitude | −0.7803 | −0.4487 | 0 | −0.0074 | 0.4026 |
| (15) Aspect | −0.2769 | −0.6299 | 0 | 0 | −0.1042 |
| (16) Torrenc | 0.8391 | 0.9279 | 0 | −0.1132 | 0.7266 |
| (17) DifTMax | −0.3154 | −0.252 | −0.5051 | 0 | −0.898 |
| (18) Accessib | 0.5754 | −0.6656 | 0.6002 | 0.0328 | −0.2536 |
| (19) HomeSize | −0.8907 | 0.0299 | 0 | 0 | −0.5839 |
| (20) NGOs’SocCare | 0.9594 | −0.3652 | 0 | 0 | −0.6207 |
| (21) TourApart | 0.0103 | 0.7899 | 0 | 0 | 0.7361 |
| Correlation | 0.6368 | 0.7428 | 0.6478 | 0.6666 | 0.7355 |
Publisher’s Note: MDPI stays neutral with regard to jurisdictional claims in published maps and institutional affiliations. |
© 2022 by the authors. Licensee MDPI, Basel, Switzerland. This article is an open access article distributed under the terms and conditions of the Creative Commons Attribution (CC BY) license (https://creativecommons.org/licenses/by/4.0/).
Share and Cite
Galacho-Jiménez, F.B.; Carruana-Herrera, D.; Molina, J.; Ruiz-Sinoga, J.D. Tempo-Spatial Modelling of the Spread of COVID-19 in Urban Spaces. Int. J. Environ. Res. Public Health 2022, 19, 9764. https://doi.org/10.3390/ijerph19159764
Galacho-Jiménez FB, Carruana-Herrera D, Molina J, Ruiz-Sinoga JD. Tempo-Spatial Modelling of the Spread of COVID-19 in Urban Spaces. International Journal of Environmental Research and Public Health. 2022; 19(15):9764. https://doi.org/10.3390/ijerph19159764
Chicago/Turabian StyleGalacho-Jiménez, Federico Benjamín, David Carruana-Herrera, Julián Molina, and José Damián Ruiz-Sinoga. 2022. "Tempo-Spatial Modelling of the Spread of COVID-19 in Urban Spaces" International Journal of Environmental Research and Public Health 19, no. 15: 9764. https://doi.org/10.3390/ijerph19159764