
Epidemiology and Clinical Characteristics of Older Patients Transferred from Long-Term-Care Hospitals (LTCHs) to Emergency Departments by a Comparison with Non-LTCHs in South Korea: A Cross-Sectional Observational Study


Abstract
:1. Introduction
2. Materials and Methods
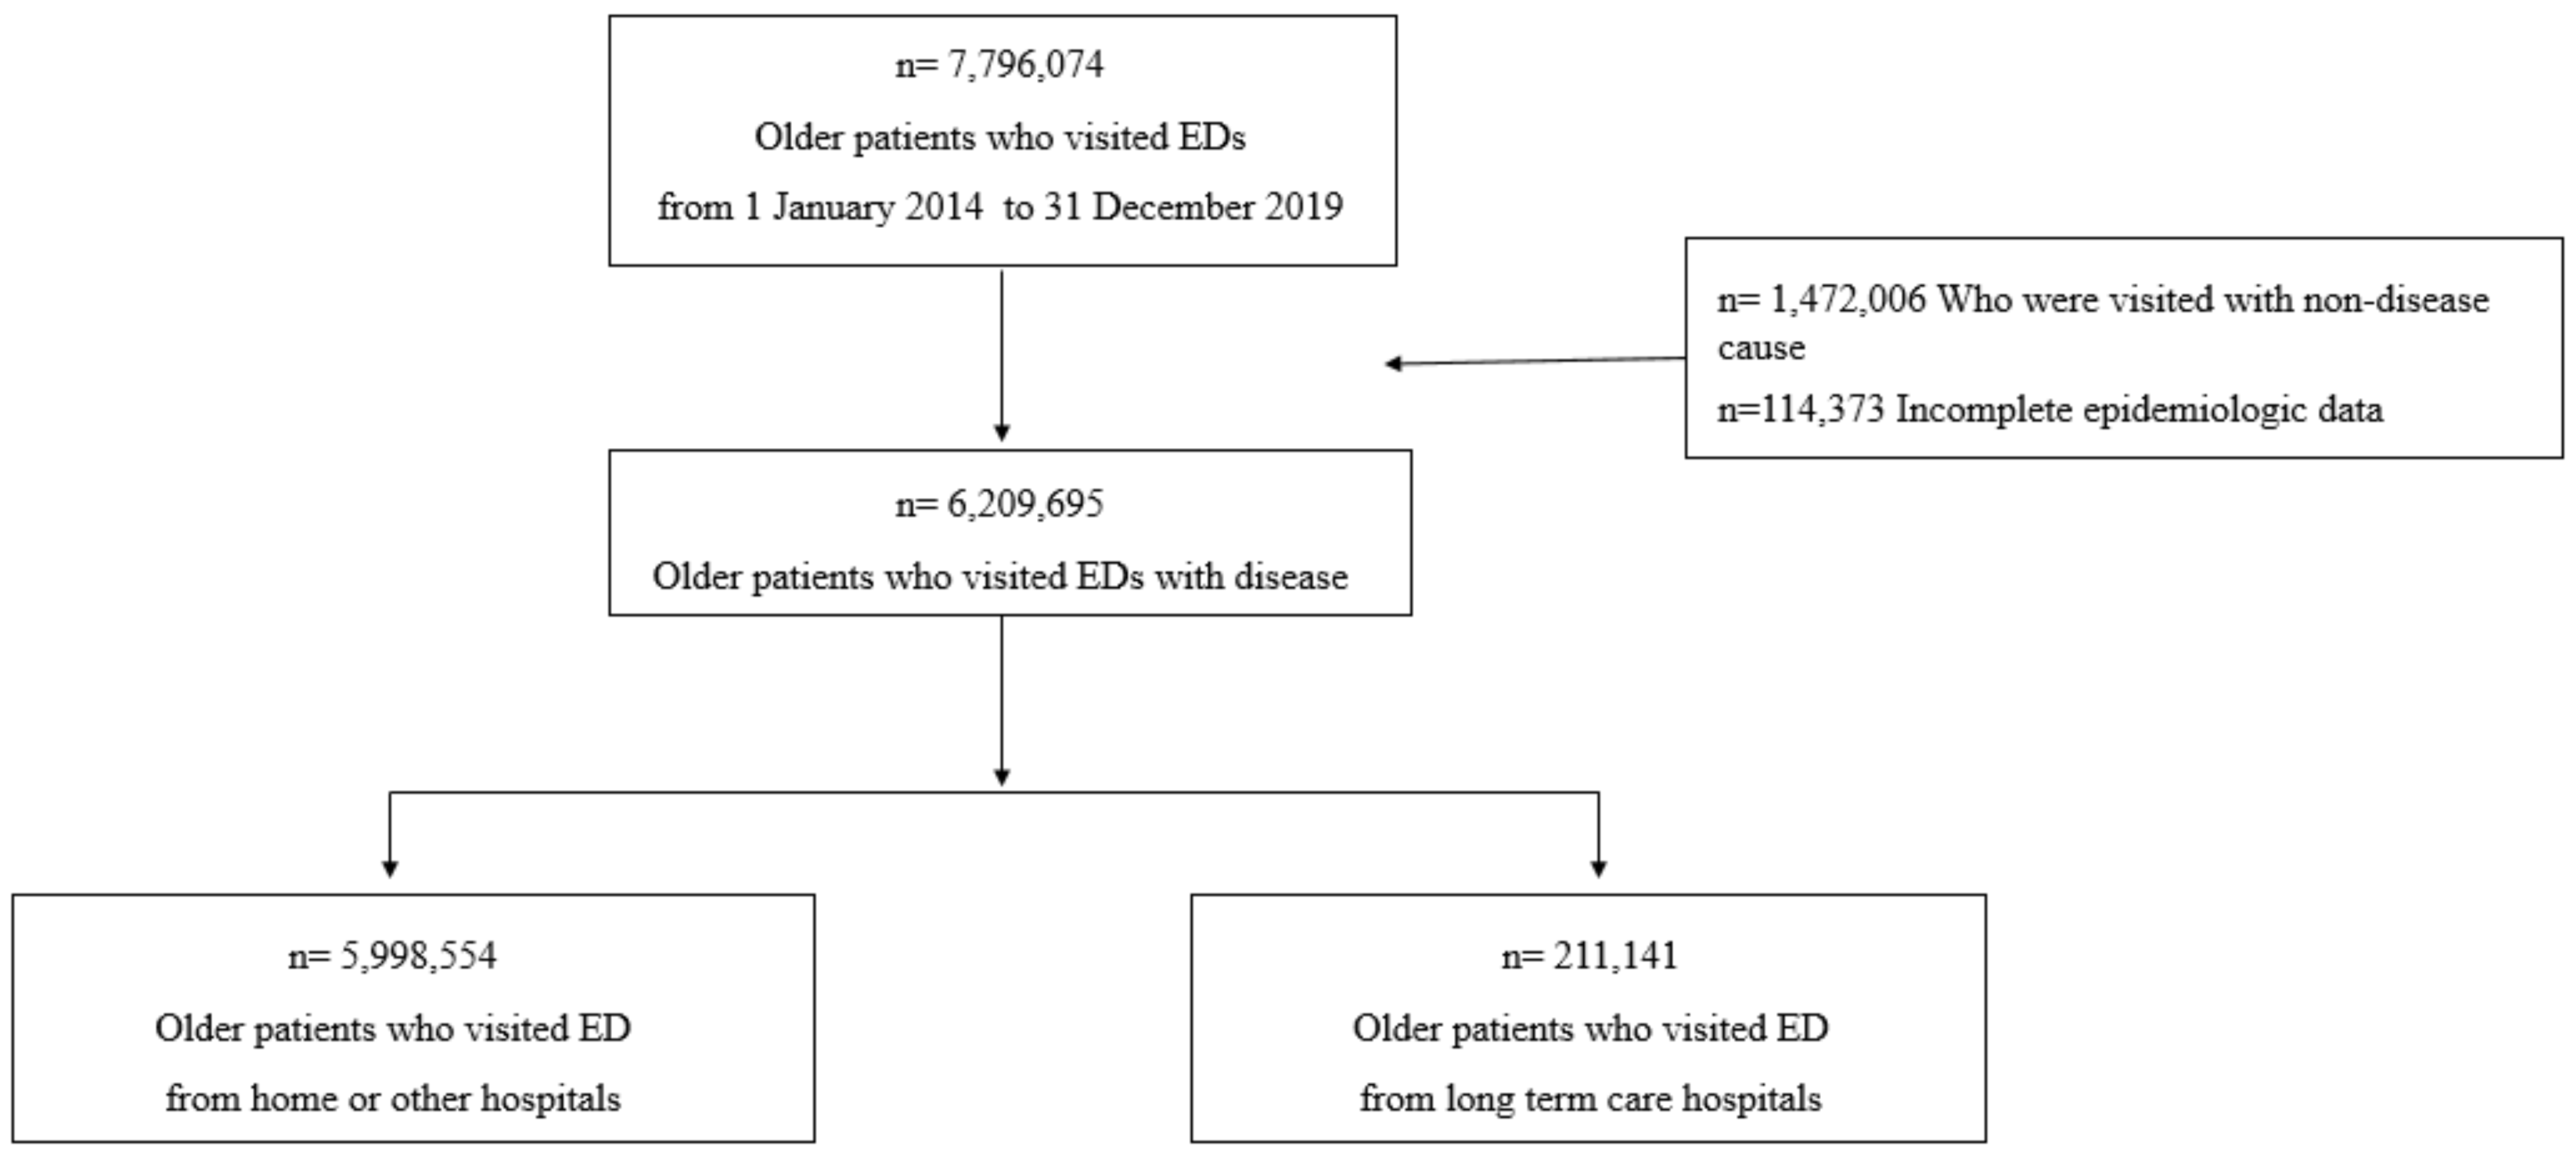
2.1. Setting and Data Collection
2.2. Variables and Outcome Measures
2.3. Statistical Analysis
3. Results
3.1. Epidemiological and Clinical Characteristics of Older Patients Who Were Admitted to Emergency Departments
3.2. Comparison of Groups According to ED Results of Patients Transferred from Long-Term-Care Hospitals
3.3. Comparison of the Length of Hospitalization and Outcomes between Older Patients Not from LTCHs and from LTCHs
3.4. Comparison of the Chief Complaints between Discharged and Admitted Patients Transferred from LTCHs
3.5. Diagnosis Analysis of Older Patients from LTCHs
3.6. Procedures Performed for LTCH Patients Who Visited EDs
4. Discussion
5. Limitations
6. Conclusions
Author Contributions
Funding
Institutional Review Board Statement
Informed Consent Statement
Data Availability Statement
Acknowledgments
Conflicts of Interest
Appendix A


| Discharged | Admitted to GW | Admitted ICU | Transfer | Return to LTCH | Death | |||||||||||||
|---|---|---|---|---|---|---|---|---|---|---|---|---|---|---|---|---|---|---|
| 51,176 | n | % | 90,879 | n | % | 43,626 | n | % | 6642 | n | % | 12,952 | n | % | 4488 | n | % | |
| 1 | Pneumonia | 2091 | (4.1) | Pneumonia | 13,763 | (15.1) | Pneumonia | 7590 | (17.4) | Pneumonia | 940 | (14.2) | Pneumonia | 1047 | (8.1) | Cardiac arrest | 744 | (16.6) |
| 2 | Urinary tract infection | 1883 | (3.7) | Urinary tract infection | 5097 | (5.6) | Sepsis | 2456 | (5.6) | Urinary tract infection | 259 | (3.9) | Urinary tract infection | 664 | (5.1) | Pneumonia | 607 | (13.5) |
| 3 | End-stage kidney disease | 1319 | (2.6) | GI hemorrhage | 3063 | (3.4) | Urinary tract infection | 1894 | (4.3) | Aspiration pneumonia | 212 | (3.2) | Fever | 353 | (2.7) | Death | 301 | (6.7) |
| 4 | Anemia | 1280 | (2.5) | Aspiration pneumonia | 2795 | (3.1) | GI hemorrhage | 1784 | (4.1) | Fever | 191 | (2.9) | Dyspnea | 340 | (2.6) | Sepsis | 222 | (4.9) |
| 5 | Fever | 1034 | (2.0) | Fever | 2729 | (3.0) | Aspiration pneumonia | 1761 | (4.0) | Dyspnea | 177 | (2.7) | Anemia | 316 | (2.4) | Aspiration pneumonia | 162 | (3.6) |
| 6 | Gastroenteritis and colitis | 952 | (1.9) | Acute pyelonephritis | 2185 | (2.4) | Septic shock | 1243 | (2.8) | Sepsis | 173 | (2.6) | Aspiration pneumonia | 283 | (2.2) | Septic shock | 157 | (3.5) |
| 7 | Dyspnea | 864 | (1.7) | Cerebral infarction | 1888 | (2.1) | Cerebral infarction | 1192 | (2.7) | GI hemorrhage | 145 | (2.2) | End-stage kidney disease | 246 | (1.9) | Dyspnea | 139 | (3.1) |
| 8 | Gross hematuria | 684 | (1.3) | Melena | 1789 | (2.0) | Dyspnea | 905 | (2.1) | Septic shock | 112 | (1.7) | GI hemorrhage | 225 | (1.7) | GI hemorrhage | 74 | (1.6) |
| 9 | GI hemorrhage | 680 | (1.3) | Gastroenteritis and colitis | 1483 | (1.6) | Heart failure | 898 | (2.1) | Cerebral infarction | 98 | (1.5) | Melena | 190 | (1.5) | Unattended death | 62 | (1.4) |
| 10 | Abdominal pain, unspecific | 672 | (1.3) | Pleural effusion | 1429 | (1.6) | Acute renal failure | 826 | (1.9) | Heart failure | 83 | (1.2) | Malaise and fatigue | 184 | (1.4) | Urinary tract infection | 53 | (1.2) |
References
- Muramatsu, N.; Akiyama, H. Japan: Super-aging society preparing for the future. Gerontologist 2011, 51, 425–432. [Google Scholar] [CrossRef] [PubMed]
- Feng, Z.; Glinskaya, E.; Chen, H.; Gong, S.; Qiu, Y.; Xu, J.; Yip, W. Long-term care system for older adults in China: Policy landscape, challenges, and future prospects. Lancet 2020, 396, 1362–1372. [Google Scholar] [CrossRef]
- Korean Statistical Information Service. Elderly Population Ratio. Available online: https://kosis.kr/statHtml/statHtml.do?orgId=101&tblId=DT_1YL20631&vw_cd=MT_GTITLE01&list_id=101&seqNo=&lang_mode=ko&language=kor&obj_var_id=&itm_id=&conn_path=MT_GTITLE01 (accessed on 5 August 2021).
- Social Protection Committee and the European Commission. 2021 Long-Term Care Report Trends, Challenges and Opportunities in an Ageing Society; Social Protection Committee and the European Commission: Brussels, Belgium, 2021. [Google Scholar]
- Kim, J. A Study on How to Establish the Role of Long-Term Care Hospitals and Nursing Facilities; 8968270813; Korea Institute for Health and Social Affairs: Seoul, Korea, 2013. [Google Scholar]
- Organisation for Economic Co-Operation and Development. Long-Term Care Resources and Utilisation, Long-Term Care Recipients. Available online: https://stats.oecd.org/ (accessed on 22 October 2021).
- The Board of Audit and Inspection of Korea. Nursing Hospital Operation and Pay Management Status; Ministry of Health and Welfare: Soeul, Korea, 2019. [Google Scholar]
- Lemoyne, S.E.; Herbots, H.H.; De Blick, D.; Remmen, R.; Monsieurs, K.G.; Van Bogaert, P. Appropriateness of transferring nursing home residents to emergency departments: A systematic review. BMC Geriatr. 2019, 19, 17. [Google Scholar] [CrossRef] [Green Version]
- Fried, T.R.; Mor, V. Frailty and hospitalization of long-term stay nursing home residents. J. Am. Geriatr. Soc. 1997, 45, 265–269. [Google Scholar] [CrossRef] [PubMed]
- Pines, J.M.; Mullins, P.M.; Cooper, J.K.; Feng, L.B.; Roth, K.E. National trends in emergency department use, care patterns, and quality of care of older adults in the United States. J. Am. Geriatr. Soc. 2013, 61, 12–17. [Google Scholar] [CrossRef]
- Gruneir, A. “Avoidable” emergency department transfers from long-term care homes: A brief review. Healthc. Q. 2013, 16, 13–15. [Google Scholar]
- Carter, E.J.; Pouch, S.M.; Larson, E.L. The relationship between emergency department crowding and patient outcomes: A systematic review. J. Nurs. Scholarsh. Off. Publ. Sigma Tau Int. Honor. Soc. Nurs. 2014, 46, 106–115. [Google Scholar] [CrossRef] [Green Version]
- Korea Health Insurance Review and Assessment Service. 2020 Health Insurance Statistical Yearbook. Available online: https://www.hira.or.kr/bbsDummy.do?pgmid=HIRAA020045020000&brdScnBltNo=4&brdBltNo=2313 (accessed on 15 May 2022).
- National Emergency Medical Center. Statistical Yearbook of Emergency Medical Service 2019; National Emergency Medical Center: Seoul, Korea, 2020. [Google Scholar]
- Park, J.; Lim, T. Korean triage and acuity scale (KTAS). J. Korean Soc. Emerg. Med. 2017, 28, 547–551. [Google Scholar]
- Gasperini, B.; Cherubini, A.; Pierri, F.; Barbadoro, P.; Fedecostante, M.; Prospero, E. Potentially preventable visits to the emergency department in older adults: Results from a national survey in Italy. PLoS ONE 2017, 12, e0189925. [Google Scholar] [CrossRef]
- Korean Standard Classification of Diseases, KCD. Available online: https://kcdcode.kr/browse/contents/0 (accessed on 19 July 2021).
- Park, J. Analysis of factors affecting length of hospital stay in geriatric patients transferred from long-term care hospitals. J. Korean Soc. Emerg. Med. 2015, 26, 165–171. [Google Scholar]
- Organisation for Economic Co-Operation and Development. Health at a Glance 2011 OECD INDICATORS. Available online: https://www.oecd.org/els/health-systems/49105858.pdf (accessed on 10 May 2022).
- Sletvold, O.; Tilvis, R.; Jonsson, A.; Schroll, M.; Snaedal, J.; Engedal, K.; Schultz-Larsen, K.; Gustafson, Y. Geriatric work-up in the Nordic countries. The Nordic approach to comprehensive geriatric assessment. Dan. Med. Bull. 1996, 43, 350–359. [Google Scholar] [PubMed]
- Nies, M.A.; McEwen, M. Community Health Nursing: Promoting the Health of Populations; Elsevier Health Sciences: Amsterdam, The Netherlands, 2001. [Google Scholar]
- Eng, C. The On Lok/PACE model of geriatric managed care: Interdisciplinary approach to care of frail elderly. Curr. Concepts Geriat. Mngd. Care 1996, 2, 4–24. [Google Scholar]
- Song, H. Long-term care hospital systems in developed countries and the implications for Korea. Ann. Geriatr. Med. Res. 2012, 16, 114–120. [Google Scholar]
- Yoo, H. The Concept and Necessity of Geriatrics. Korean J. Intern. Med. Fall Symp. Pap. 2018, 2018, 733–736. [Google Scholar]
- Jacob, L.; Breuer, J.; Kostev, K. Prevalence of chronic diseases among older patients in German general practices. Ger. Med. Sci. GMS E-J. 2016, 14, Doc03. [Google Scholar]
- Powell, M.P.; Yu, X.; Isehunwa, O.; Chang, C.F. National Trends in Hospital Emergency Department Visits among Those with and without Multiple Chronic Conditions, 2007–2012. Hosp. Top. 2018, 96, 1–8. [Google Scholar] [CrossRef]
- Sprivulis, P.C.; Da Silva, J.A.; Jacobs, I.G.; Frazer, A.R.; Jelinek, G.A. The association between hospital overcrowding and mortality among patients admitted via Western Australian emergency departments. Med. J. Aust. 2006, 184, 208–212. [Google Scholar] [CrossRef]
- Grant, K.L.; Lee, D.D.; Cheng, I.; Baker, G.R. Reducing preventable patient transfers from long-term care facilities to emergency departments: A scoping review. Can. J. Emerg. Med. 2020, 22, 844–856. [Google Scholar] [CrossRef]
- Snider, T.; Melady, D.; Costa, A.P. A national survey of Canadian emergency medicine residents’ comfort with geriatric emergency medicine. Can. J. Emerg. Med. 2017, 19, 9–17. [Google Scholar] [CrossRef] [Green Version]
- Deasey, D.; Kable, A.; Jeong, S. Influence of nurses’ knowledge of ageing and attitudes towards older people on therapeutic interactions in emergency care: A literature review. Australas. J. Ageing 2014, 33, 229–236. [Google Scholar] [CrossRef]
- Hesselink, G.; Sir, Ö.; Schoon, Y. Effectiveness of interventions to alleviate emergency department crowding by older adults: A systematic review. BMC Emerg. Med. 2019, 19, 69. [Google Scholar] [CrossRef] [PubMed]
- Stephens, C.; Halifax, E.; Bui, N.; Lee, S.J.; Harrington, C.; Shim, J.; Ritchie, C. Provider Perspectives on the Influence of Family on Nursing Home Resident Transfers to the Emergency Department: Crises at the End of Life. Curr. Gerontol. Geriatr. Res. 2015, 2015, 893062. [Google Scholar] [CrossRef] [PubMed] [Green Version]
- National Life-Sustaining Medical Management Agency. National Agency for Management of Life-Sustaining Treatment: Monthly Statistics. Available online: https://lst.go.kr/comm/monthlyStatistics.do (accessed on 10 May 2022).
- Kim, E. Factors Associated with Completion of Physician Orders for Life-Sustaining Treatment and Its Effects on the Healthcare Utilization before Death; Seoul National University: Seoul, Korea, 2020. [Google Scholar]
- Chou, M.Y.; Chou, S.L.; Tzeng, Y.M.; Chen, L.K.; Oliver, D.; Yen, D.H.; Hwang, S.J.; Huang, C.I.; Tu, M.S.; Lee, C.H. Emergency department (ED) utilization of oldest old men in a veterans care home in Taiwan. Arch. Gerontol. Geriatr. 2009, 48, 258–262. [Google Scholar] [CrossRef]
- Burke, R.E.; Rooks, S.P.; Levy, C.; Schwartz, R.; Ginde, A.A. Identifying Potentially Preventable Emergency Department Visits by Nursing Home Residents in the United States. J. Am. Med. Dir. Assoc. 2015, 16, 395–399. [Google Scholar] [CrossRef] [PubMed] [Green Version]
- National Emergency Medical Center. Emergency Medical Care Policy Research Newsletter. 2020. Available online: https://www.e-gen.or.kr/nemc/investigation_view.do?brdctsno=9501&upperfixyn=N¤tPageNum=&brdclscd=&searchTarget=ALL&searchKeyword=&searchDatayear= (accessed on 7 January 2022).
- Takashima, R.; Onishi, R.; Saeki, K.; Hirano, M. Perception of COVID-19 Restrictions on Daily Life among Japanese Older Adults: A Qualitative Focus Group Study. Healthcare 2020, 8, 450. [Google Scholar] [CrossRef]
- Razak, F.; Shin, S.; Pogacar, F.; Jung, H.Y.; Pus, L.; Moser, A.; Lapointe-Shaw, L.; Tang, T.; Kwan, J.L.; Weinerman, A.; et al. Modelling resource requirements and physician staffing to provide virtual urgent medical care for residents of long-term care homes: A cross-sectional study. CMAJ Open 2020, 8, e514–e521. [Google Scholar] [CrossRef]
- Liu, K.; Baseggio, C.; Wissoker, D.; Maxwell, S.; Haley, J.; Long, S. Long-term care hospitals under Medicare: Facility-level characteristics. Health Care Financ. Rev. 2001, 23, 1–18. [Google Scholar] [PubMed]


| Patients Who Visited ED Not from LTCHs | Patients Who Visited ED from LTCHs | Total | p-Value | ||||
|---|---|---|---|---|---|---|---|
| n | % | n | % | n | % | ||
| 5,998,554 | (96.6) | 211,141 | (3.4) | 6,209,695 | (100.0) | ||
| Age (years, mean ± SD) | 76.1 ± 7.2 | 79.7 ± 7.0 | 76.2 ± 7.3 | 0.000 | |||
| Age groups | 0.000 | ||||||
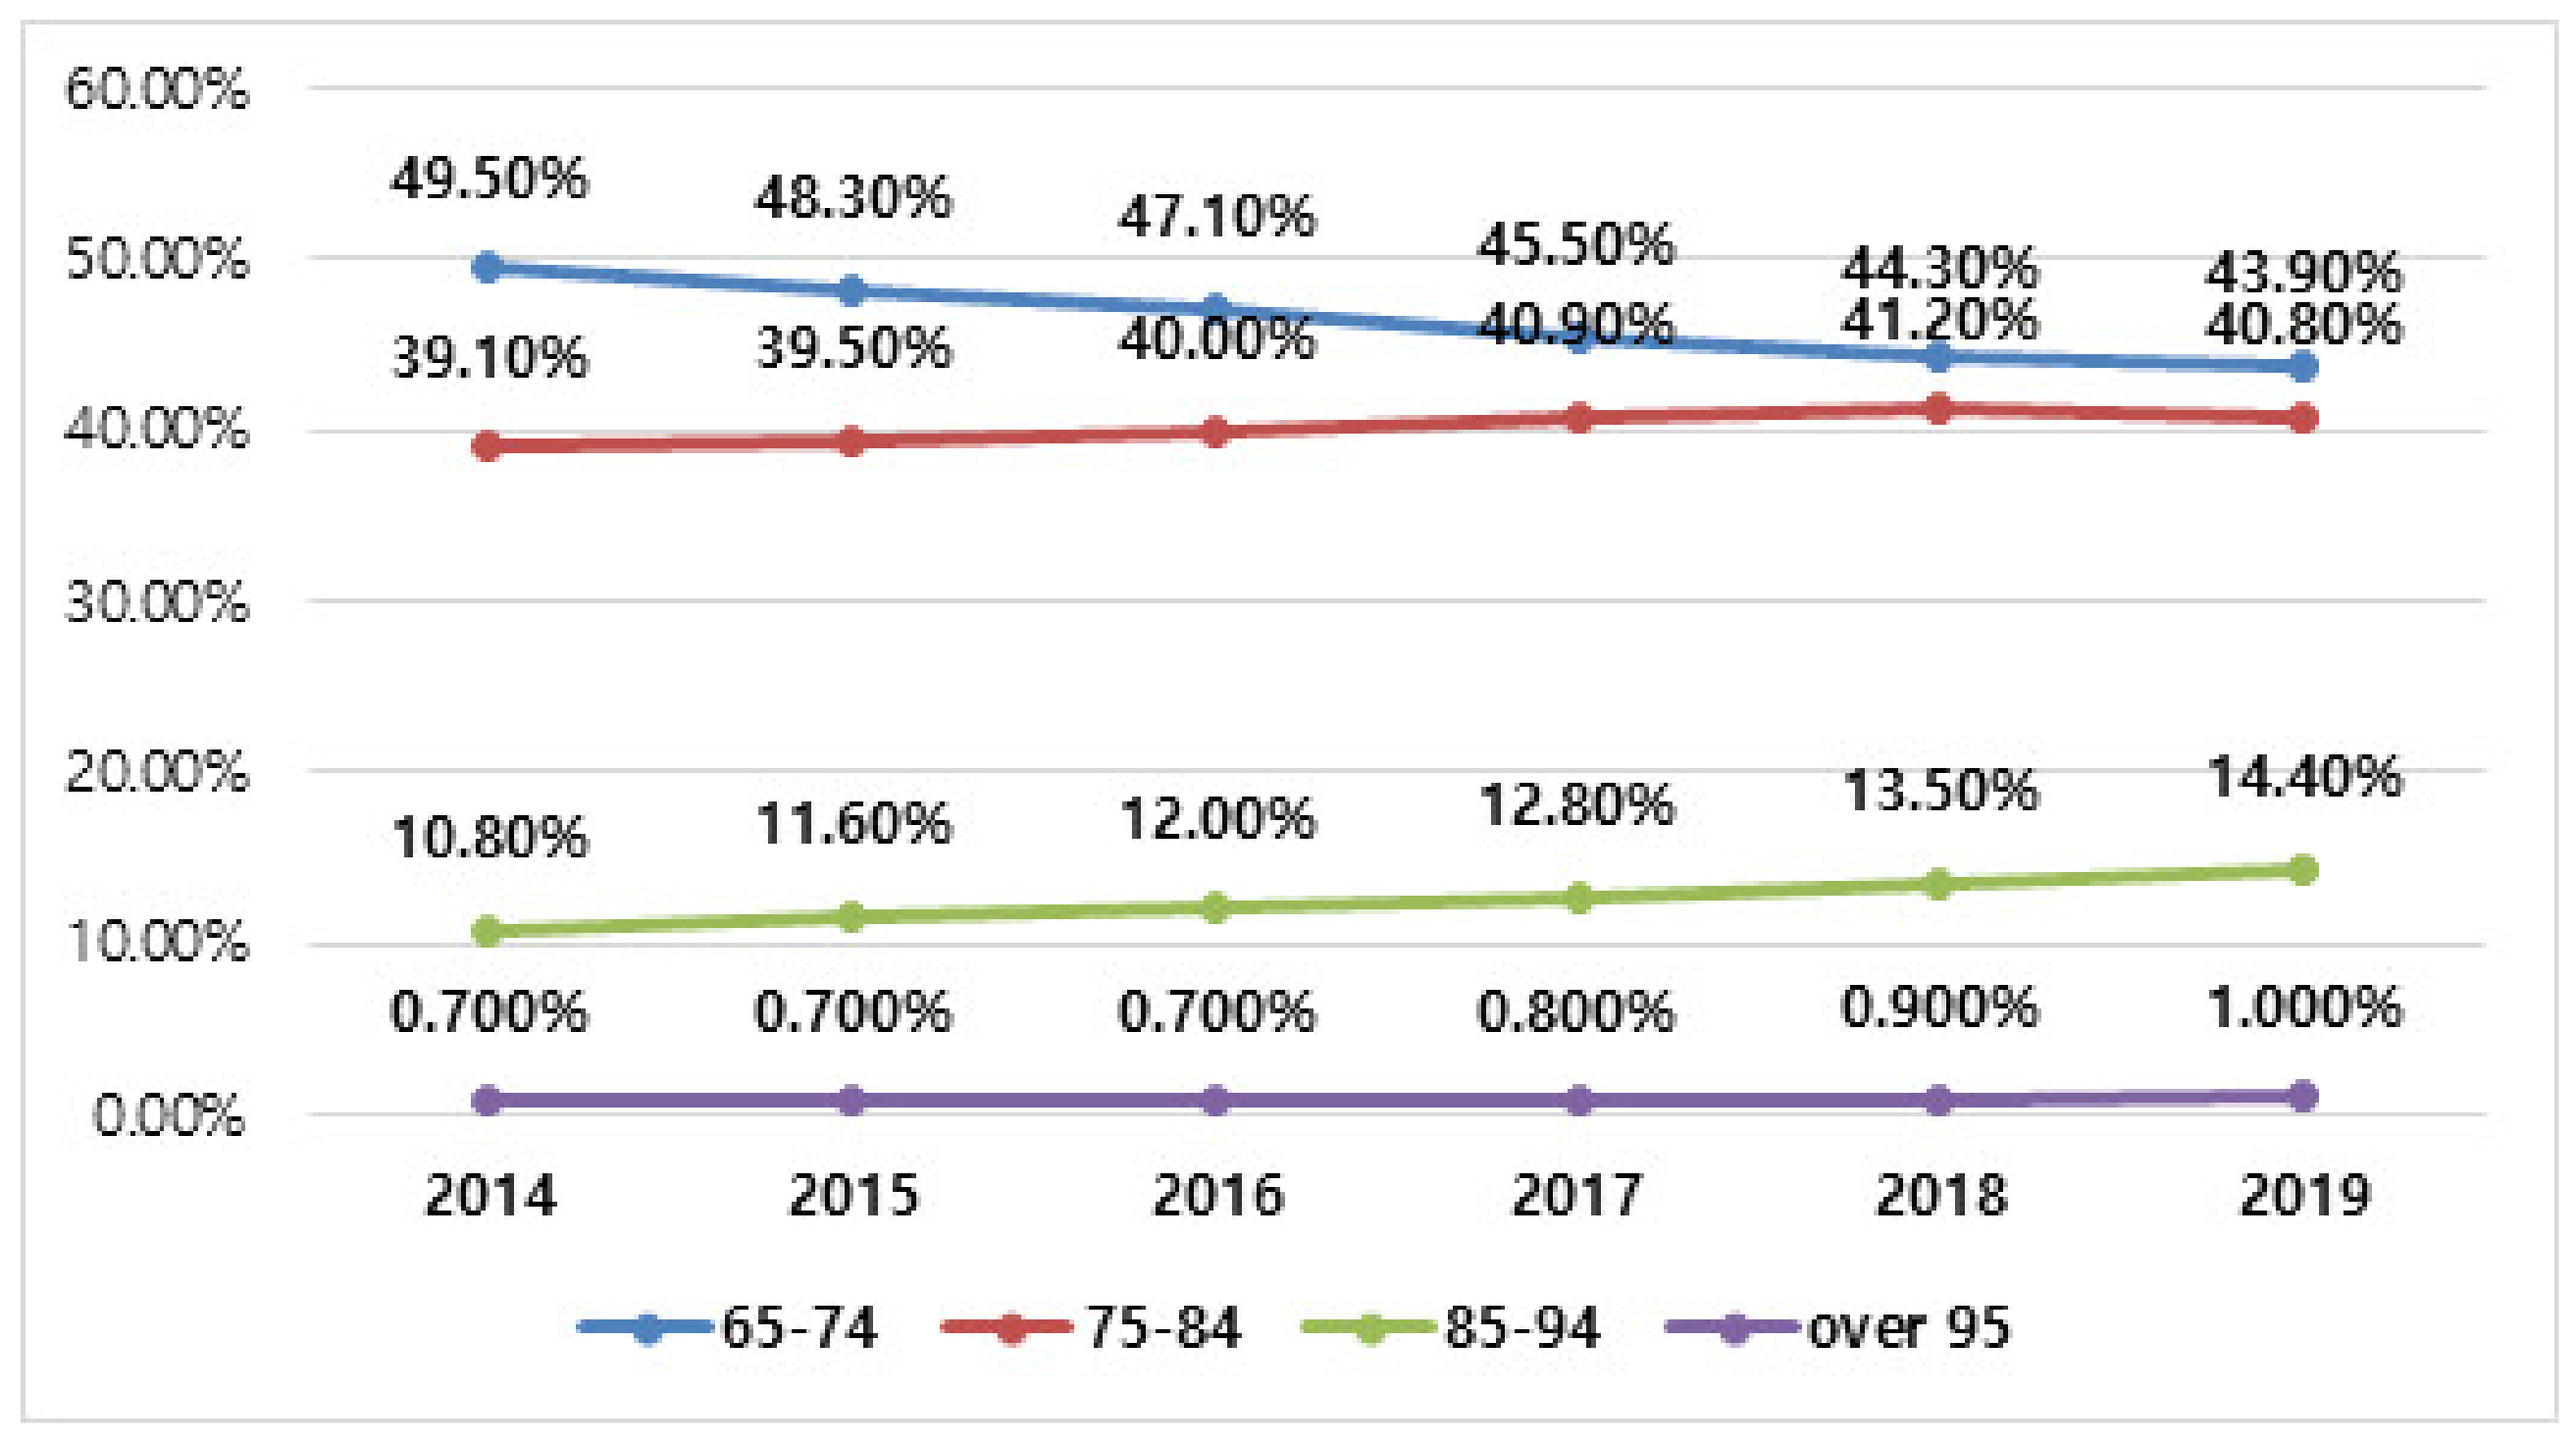
| 65–74 years | 2,712,398 | (45.2) | 49,613 | (23.5) | 2,762,011 | (44.5) | |
| 75–84 years | 2,477,159 | (41.3) | 107,802 | (51.1) | 2,584,961 | (41.6) | |
| ≥85 years | 808,997 | (13.5) | 53,726 | (25.4) | 862,723 | (13.9) | |
| Sex (male) [n(%)] | 2,901,263 | (48.4) | 89,791 | (42.5) | 2,991,054 | (48.2) | 0.000 |
| Level of ED | 0.000 | ||||||
| Regional emergency medical center | 1,649,090 | (27.5) | 78,339 | (37.1) | 1,727,429 | (27.8) | |
| Local emergency medical center | 3,627,287 | (60.5) | 132,509 | (62.8) | 3,759,796 | (60.5) | |
| Local emergency medical room | 722,177 | (12.0) | 293 | (0.1) | 722,470 | (11.6) | |
| Insurance | 0.000 | ||||||
| National health insurance | 5,269,883 | (87.9) | 176,335 | (83.5) | 5,446,218 | (87.7) | |
| Medicaid | 629,684 | (10.5) | 28,785 | (13.6) | 658,469 | (10.6) | |
| Others | 98,987 | (1.7) | 6021 | (2.9) | 105,008 | (1.7) | |
| Visiting means | 0.000 | ||||||
| 911 | 1,686,820 | (28.1) | 5902 | (2.8) | 1,692,722 | (27.3) | |
| Other ambulance | 563,114 | (9.4) | 163,261 | (77.3) | 726,375 | (11.7) | |
| Car | 3,639,159 | (60.7) | 40,642 | (19.2) | 3,679,801 | (59.3) | |
| Walk | 78,374 | (1.3) | 202 | (0.1) | 78,576 | (1.3) | |
| Others | 31,087 | (0.5) | 1134 | (0.5) | 32,221 | (0.5) | |
| Consciousness | 0.000 | ||||||
| Alert | 4,831,704 | (91.3) | 149,275 | (70.7) | 4,980,979 | (90.5) | |
| Verbal | 137,663 | (2.6) | 24,906 | (11.8) | 162,569 | (3.0) | |
| Pain response | 119,123 | (2.3) | 3885 | (1.8) | 123,008 | (2.2) | |
| Unresponsiveness | 204,664 | (3.9) | 33,062 | (15.7) | 237,726 | (4.3) | |
| KTAS | 0.000 | ||||||
| Level 1 | 136,478 | (3.1) | 8136 | (5.0) | 144,614 | (3.2) | |
| Level 2 | 490,436 | (11.3) | 31,519 | (19.3) | 521,955 | (11.6) | |
| Level 3 | 2,089,701 | (48.1) | 88,197 | (54.1) | 2,177,898 | (48.3) | |
| Level 4 | 1,277,212 | (29.4) | 27,283 | (16.7) | 1,304,495 | (28.9) | |
| Level 5 | 351,196 | (8.1) | 7919 | (4.9) | 359,115 | (8.0) | |
| Vital signs | 0.000 | ||||||
| Systolic blood pressure (mmHg) | 137.41 ± 28.49 | 124.39 ± 28.79 | 136.91 ± 28.62 | ||||
| Diastolic blood pressure (mmHg) | 78.36 ± 15.79 | 72.46 ± 16.72 | 78.13 ± 15.87 | ||||
| Pulse rate (beats/minute) | 85.46 ± 19.20 | 90.45 ± 21.63 | 85.65 ± 19.32 | ||||
| Respiratory rate (beats/minute) | 19.87 ± 3.37 | 20.67 ± 4.18 | 19.90 ± 3.41 | ||||
| Body temperature (°C) | 36.76 ± 0.82 | 36.84 ± 0.77 | 36.76 ± 0.81 | ||||
| Saturation (%) | 96.06 ± 5.17 | 94.28 ± 6.49 | 95.96 ± 5.26 | ||||
| Any abnormalities | 5,060,179 | (84.4) | 181,355 | (85.9) | 5,241,534 | (84.4) | |
| pulse ≤ 60 ≥ 100 | 2,241,853 | (37.4) | 77,188 | (36.6) | 2,319,041 | (37.3) | |
| SBP ≤ 90 ≥ 180 | 1,474,669 | (24.6) | 35,963 | (17.0) | 1,510,632 | (24.3) | |
| BT ≤ 36 ≥ 38.5 | 1,788,202 | (29.8) | 34,065 | (16.1) | 1,822,267 | (29.3) | |
| Respiration ≥ 20 | 4,332,578 | (72.2) | 153,160 | (72.5) | 4,485,738 | (72.2) | |
| Saturation < 93% | 270,126 | (4.5) | 31,503 | (14.9) | 301,629 | (4.9) | |
| Main department | |||||||
| Internal medicine | 0.000 | ||||||
| Cardiology | 317,558 | (6.0) | 11,494 | (5.4) | 329,052 | (6.0) | |
| Pulmonology | 305,849 | (5.8) | 31,484 | (14.9) | 337,333 | (6.1) | |
| Gastroenterology | 375,112 | (7.1) | 23,358 | (11.1) | 398,470 | (7.2) | |
| Nephrology | 149,477 | (2.8) | 15,408 | (7.3) | 164,885 | (3.0) | |
| Endocrine | 34,612 | (0.7) | 854 | (0.4) | 35,466 | (0.6) | |
| Infection | 71,370 | (1.3) | 8150 | (3.9) | 79,520 | (1.4) | |
| Hemato-oncology | 131,796 | (2.5) | 4597 | (2.2) | 136,393 | (2.5) | |
| Allergy | 1836 | (0.0) | 72 | (0.0) | 1908 | (0.0) | |
| Rheumatology | 3889 | (0.1) | 181 | (0.1) | 4070 | (0.1) | |
| Other internal medicine | 344,196 | (6.5) | 23,956 | (11.3) | 368,152 | (6.7) | |
| Surgery | |||||||
| General surgery | 182,754 | (3.5) | 8381 | (4.0) | 191,135 | (3.5) | |
| Neuro surgery | 155,650 | (2.9) | 4724 | (2.2) | 160,374 | (2.9) | |
| Thoracic surgery | 38,258 | (0.7) | 1809 | (0.9) | 40,067 | (0.7) | |
| Orthopedic surgery | 68,351 | (1.3) | 2326 | (1.1) | 70,677 | (1.3) | |
| Plastic surgery | 4718 | (0.1) | 258 | (0.1) | 4976 | (0.1) | |
| Other surgery | 5689 | (0.1) | 148 | (0.1) | 4385 | (0.1) | |
| OBGY | 11,039 | (0.2) | 607 | (0.3) | 11,646 | (0.2) | |
| Neurology | 354,966 | (6.7) | 9910 | (4.7) | 364,876 | (6.6) | |
| Emergency medicine | 2,493,432 | (47.1) | 54,328 | (25.7) | 2,547,760 | (46.3) | |
| ED length of stay (minutes, mean ± SD) | 344.18 ± 682.29 | 572.38 ± 856.27 | 351.95 ± 690.17 | 0.000 | |||
| ED outcome | 0.000 | ||||||
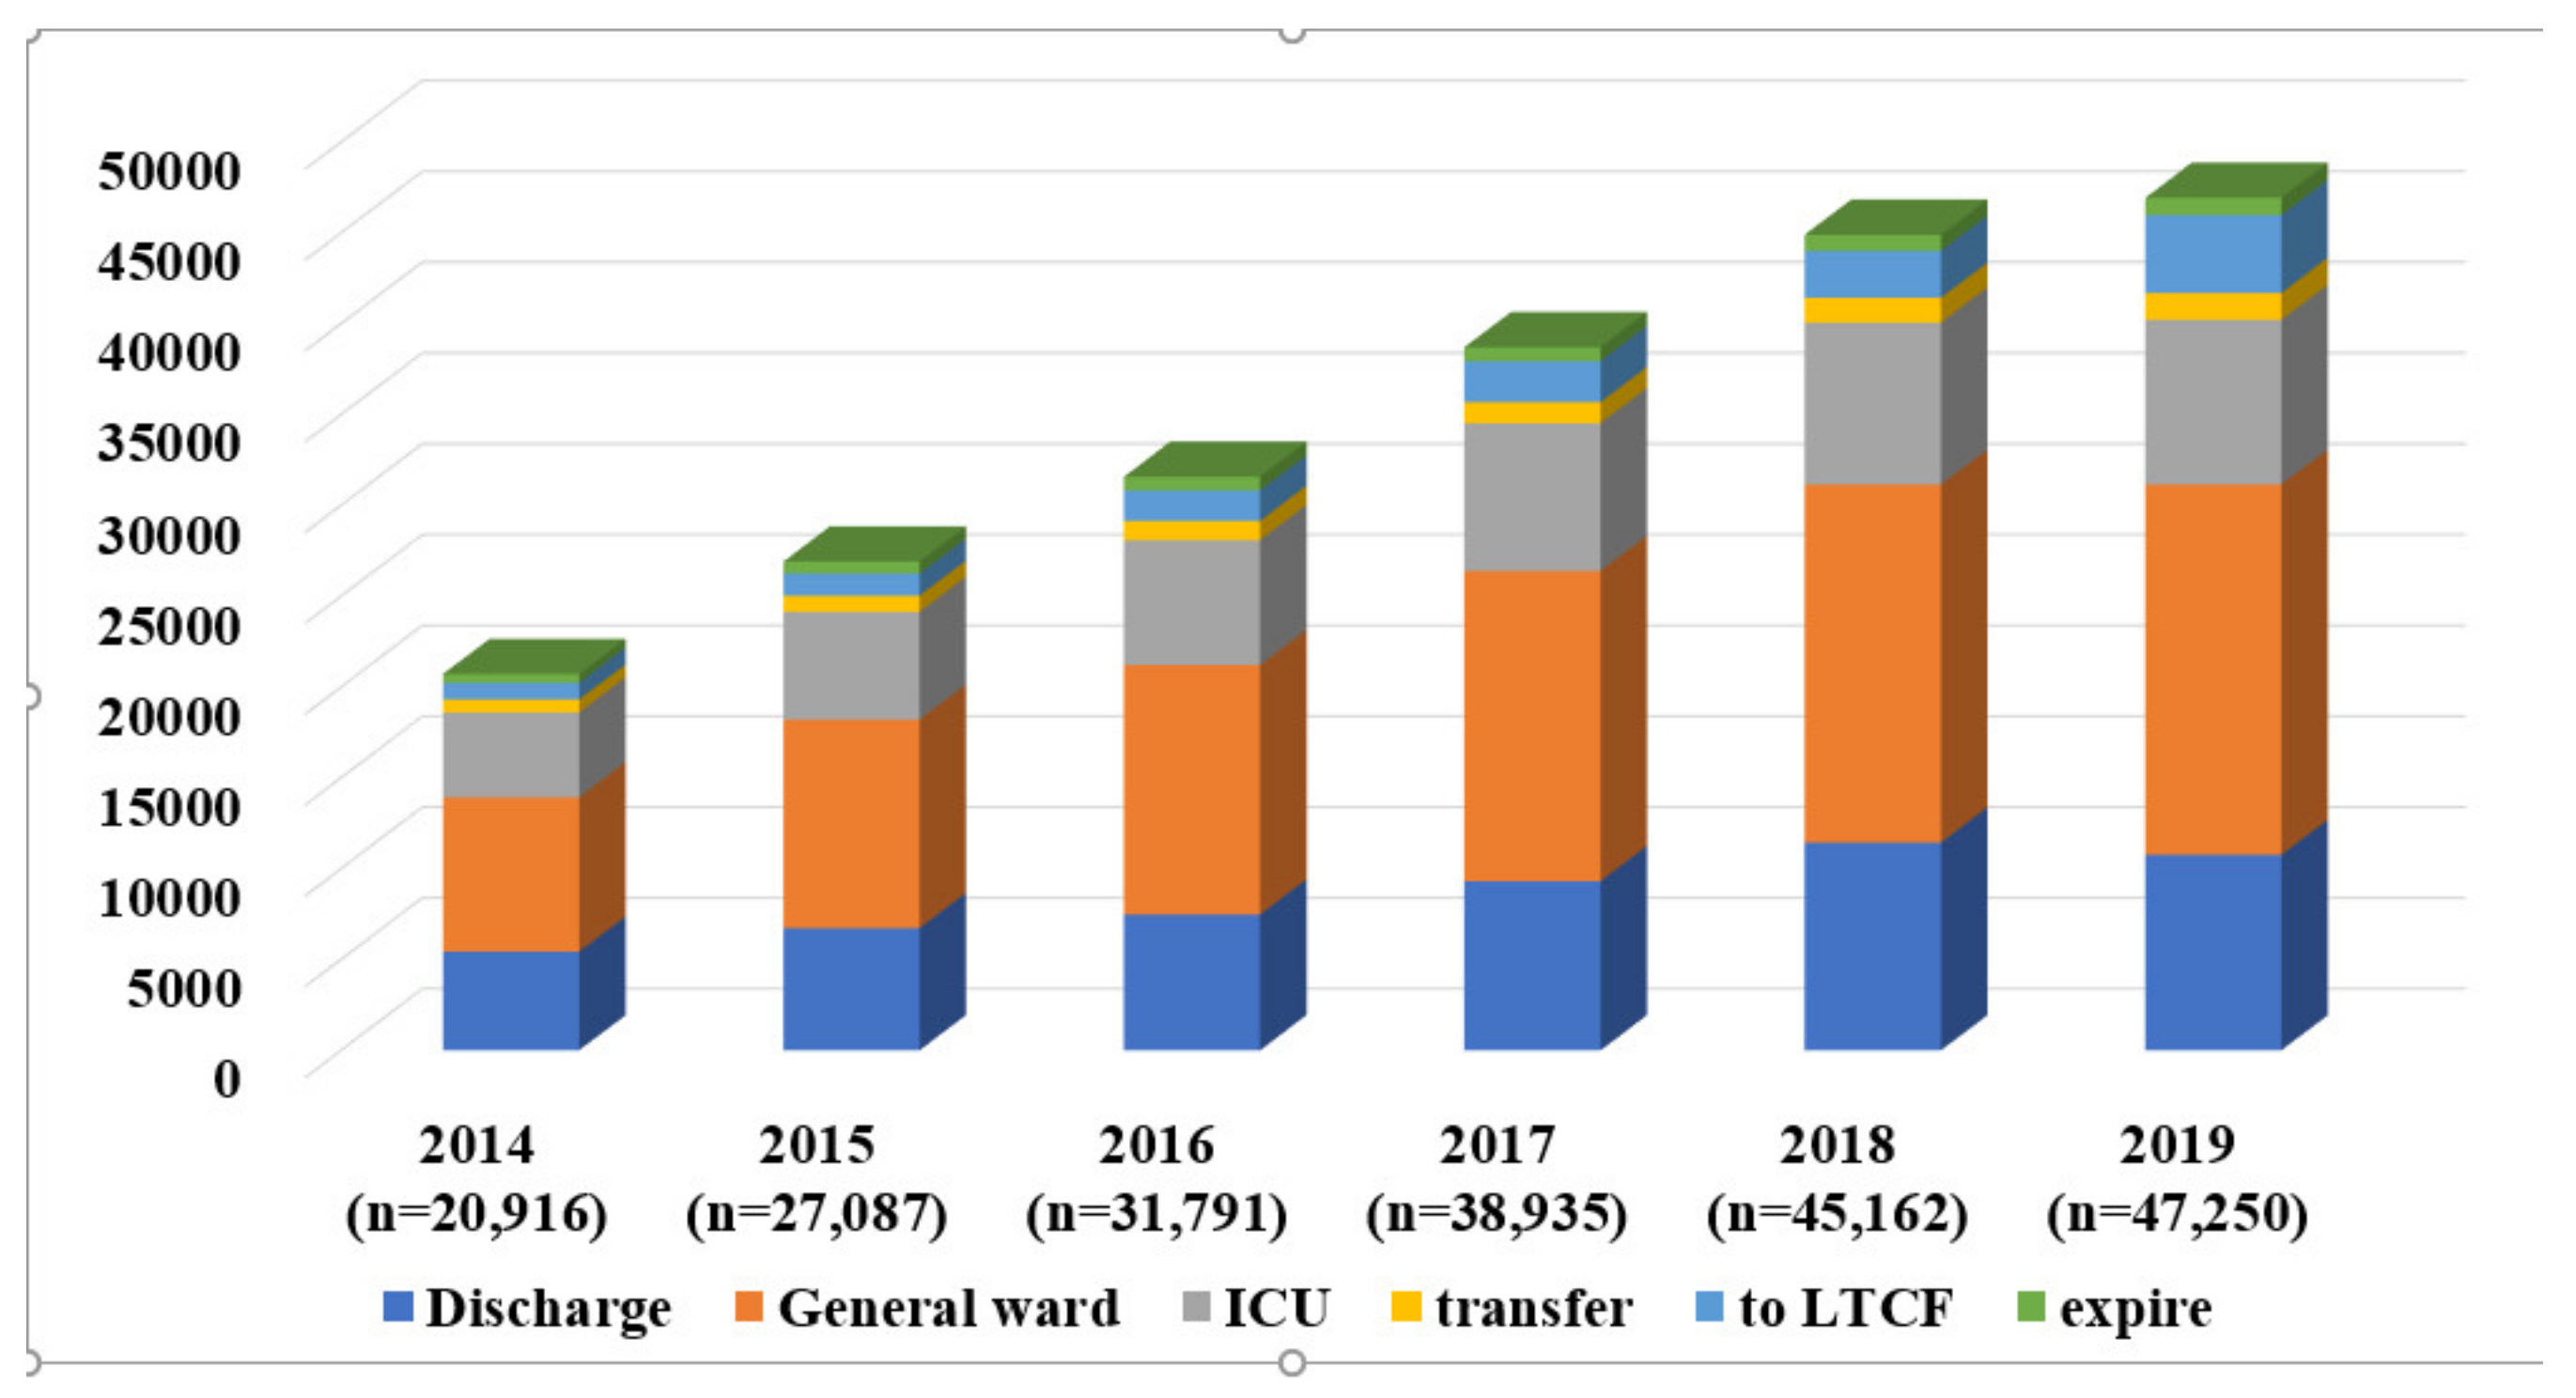
| Discharge | 3,227,175 | (53.8) | 51,176 | (24.2) | 3,278,351 | (52.8) | |
| Admission to GW | 1,949,871 | (32.5) | 90,879 | (43.0) | 2,040,750 | (32.9) | |
| Admission to ICU | 503,300 | (8.4) | 43,626 | (20.7) | 546,926 | (8.8) | |
| Transfer to others | 173,317 | (2.9) | 6642 | (3.1) | 179,959 | (2.9) | |
| Transfer to long-term-care hospital | 11,758 | (0.2) | 12,952 | (6.1) | 24,710 | (0.4) | |
| Expire | 118,742 | (2.0) | 4488 | (2.1) | 123,230 | (2.0) | |
| Unclassified | 14,391 | (0.2) | 1378 | (0.7) | 15,769 | (0.3) | |
| Discharged | Admitted to Ward | Admitted ICU | Transfer | Return to LTCH | Death | Total | p-Value | ||||||||
|---|---|---|---|---|---|---|---|---|---|---|---|---|---|---|---|
| n | % | n | % | n | % | n | % | n | % | n | % | n | % | ||
| 51,176 | (24.4) | 90,879 | (43.3) | 43,626 | (20.8) | 6642 | (3.2) | 12,952 | (6.2) | 4488 | (2.1) | 209,763 | (100.0) | ||
| Age (years, mean ± SD) | 79.55 ± 7.17 | 79.75 ± 6.94 | 79.61 ± 6.89 | 79.57 ± 7.02 | 80.05 ± 7.22 | 80.33 ± 7.03 | 79.71 ± 7.01 | 0.00 | |||||||
| Age groups | 0.00 | ||||||||||||||
| 65–74 years | 12,747 | (24.9) | 20,872 | (23.0) | 10,195 | (23.4) | 1593 | (24.0) | 3001 | (23.2) | 945 | (21.1) | 49,353 | (23.5) | |
| 75–84 years | 25,432 | (49.7) | 46,897 | (51.6) | 22,786 | (52.2) | 3397 | (51.1) | 6341 | (49.0) | 2240 | (49.9) | 107,093 | (51.1) | |
| ≥85 years | 12,997 | (25.4) | 23,110 | (25.4) | 10,645 | (24.4) | 1652 | (24.9) | 3610 | (27.9) | 1303 | (29.0) | 53,317 | (25.4) | |
| Sex (male) [n (%)] | 20,724 | (40.5) | 38,687 | (42.6) | 19,261 | (44.2) | 2982 | (44.9) | 5486 | (42.4) | 2107 | (46.9) | 89,247 | (42.5) | 0.00 |
| Level of ED | 0.00 | ||||||||||||||
| Regional emergency medical center | 19,652 | (38.4) | 33,609 | (37.0) | 15,879 | (36.4) | 2019 | (30.4) | 5362 | (41.4) | 1719 | (38.3) | 78,240 | (37.3) | |
| Local emergency medical center | 31,478 | (61.5) | 57,156 | (62.9) | 27,667 | (63.4) | 4593 | (69.2) | 7570 | (58.4) | 2766 | (61.6) | 131,230 | (62.6) | |
| Local emergency medical institution | 46 | (0.1) | 114 | (0.1) | 80 | (0.2) | 30 | (0.5) | 20 | (0.2) | 3 | (0.1) | 293 | (0.1) | |
| Area of residence | 0.00 | ||||||||||||||
| Not from LTCHs | From LTCHs | |||||
|---|---|---|---|---|---|---|
| General Ward | ICU | p-Value | General Ward | ICU | p-Value | |
| 1,949,871 | 503,300 | 90,879 (43.0) | 43,626 (20.7) | |||
| 2014 | 245,577 | 69,097 | 8495 | 4670 | ||
| 2015 | 255,837 | 69,657 | 11,471 | 5941 | ||
| 2016 | 278,646 | 75,426 | 13,736 | 6884 | ||
| 2017 | 319,336 | 84,812 | 17,073 | 8147 | ||
| 2018 | 394,265 | 97,180 | 19,712 | 8918 | ||
| 2019 | 456,210 | 107,128 | 20,392 | 9066 | ||
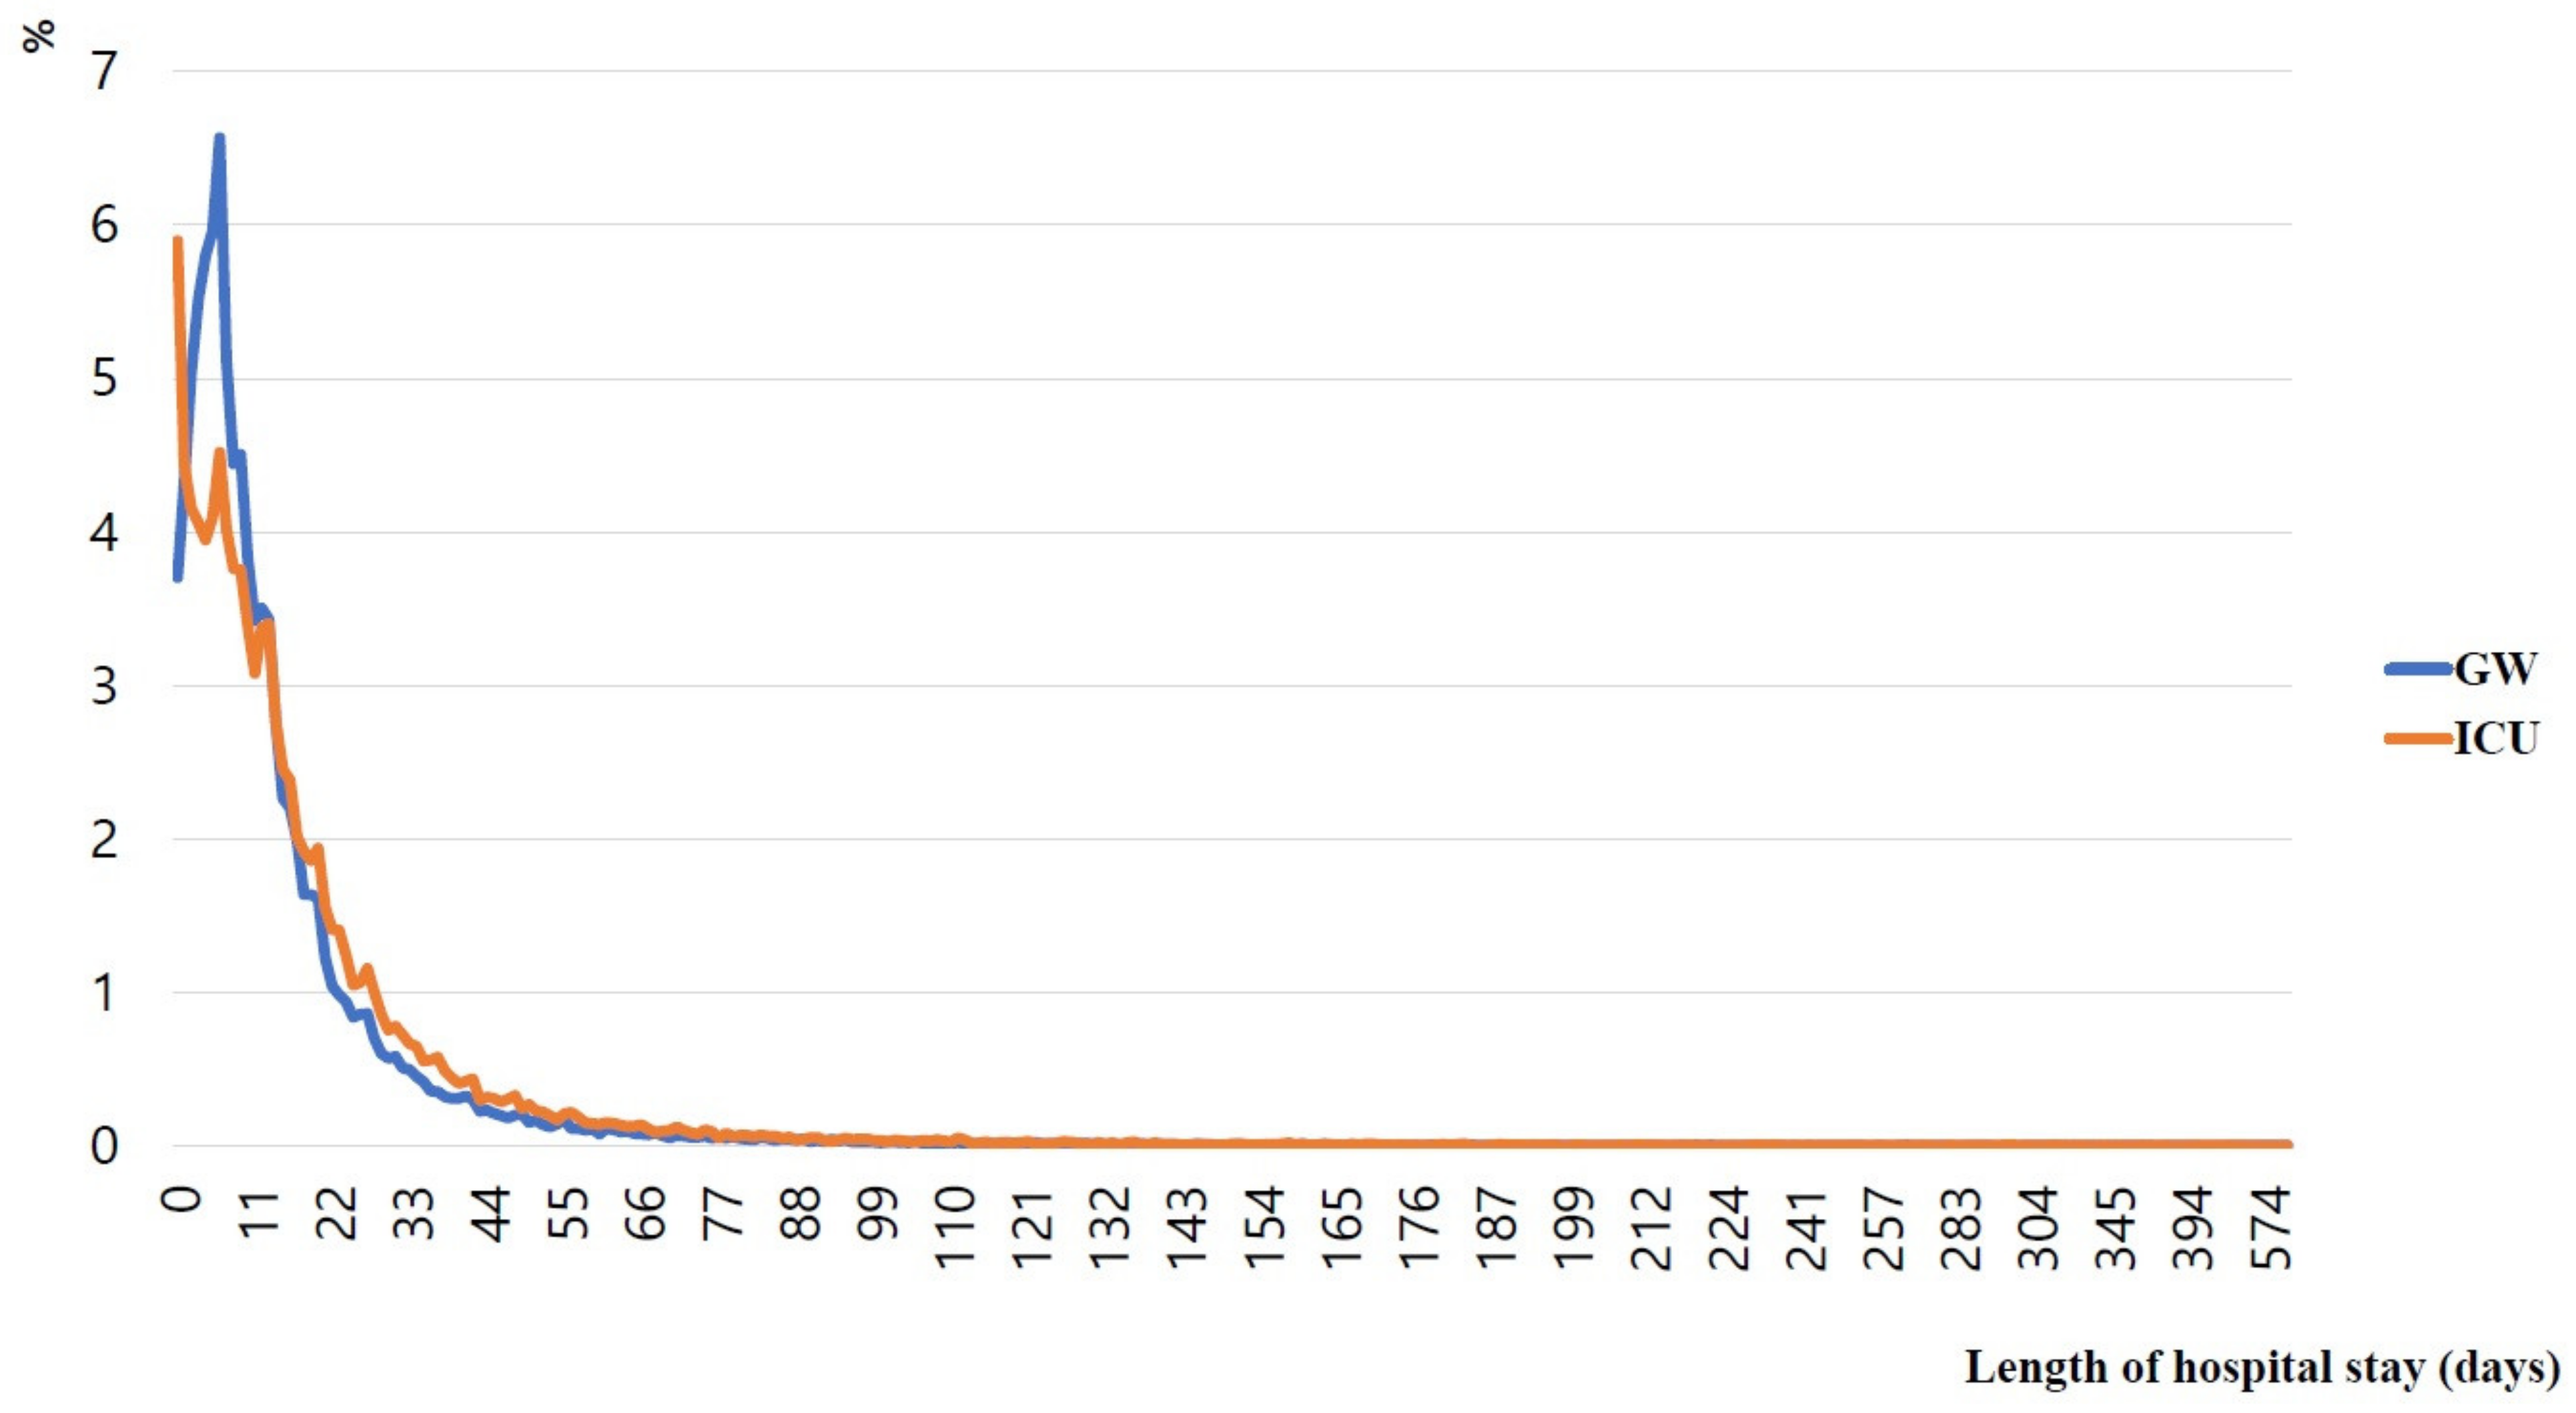
| Length of stay (hours, mean ± SD) | 261.23 ± 360.16 | 375.95 ± 514.52 | 0.000 | 365.76 ± 476.72 | 443.36 ± 565.36 | 0.000 |
| Length of stay (hours, IQR) | 161.84–214.16 | 224.50–333.10 | 233.67–305.79 | 286.72–407.52 | ||
| Outcome after admission | n(%) | n(%) | 0.000 | n(%) | n(%) | 0.000 |
| Discharged | 1,628,854 (86.1) | 315,600 (64.8) | 43,920 (49.6) | 13,542 (31.9) | ||
| Transfer to others | 109,702 (5.8) | 57,152 (11.7) | 9538 (10.8) | 5132 (12.1) | ||
| Transfer to LTCH | 44,870 (2.4) | 30,040 (6.2) | 23,248 (26.2) | 12,667 (29.9) | ||
| Death | 109,273 (5.8) | 84,167 (17.3) | 11,894 (13.4) | 11,050 (26.1) | ||
| Discharged | Admitted to GW | Admitted ICU | Transfer | Return to LTCH | |||||||||||
|---|---|---|---|---|---|---|---|---|---|---|---|---|---|---|---|
| 51,176 | 90,879 | 43,626 | 6642 | 12,952 | |||||||||||
| n | (%) | n | (%) | n | (%) | n | (%) | n | (%) | ||||||
| 1 | Dyspnea | 4455 | (8.7) | Dyspnea | 18,212 | (20.0) | Dyspnea | 13,420 | (30.8) | Dyspnea | 1520 | (22.9) | Dyspnea | 1860 | (14.4) |
| 2 | Fever | 3753 | (7.3) | Fever | 17,787 | (19.6) | Fever | 5731 | (13.1) | Fever | 1020 | (15.4) | Fever | 1512 | (11.7) |
| 3 | Care of catheter | 2786 | (5.4) | GI bleeding | 6475 | (7.1) | Mental status changes | 3936 | (9.0) | Mental status changes | 541 | (8.1) | Abdominal pain | 740 | (5.7) |
| 4 | Abdominal pain | 2747 | (5.4) | Abdominal pain | 6169 | (6.8) | GI bleeding | 2925 | (6.7) | Abdominal pain | 475 | (7.2) | GI bleeding | 700 | (5.4) |
| 5 | General weakness | 1971 | (3.9) | General weakness | 4473 | (4.9) | Hypotension | 1957 | (4.5) | GI bleeding | 290 | (4.4) | General weakness | 599 | (4.6) |
| 6 | Hematuria | 1863 | (3.6) | Mental status changes | 2166 | (2.4) | General weakness | 1539 | (3.5) | General weakness | 260 | (3.9) | Mental status changes | 585 | (4.5) |
| 7 | Chest pain | 1586 | (3.1) | Hypotension | 1723 | (1.9) | Abdominal pain | 1510 | (3.5) | Hypotension | 221 | (3.3) | Hematuria | 367 | (2.8) |
| 8 | GI bleeding | 1439 | (2.8) | Hematuria | 1401 | (1.5) | Chest pain | 1157 | (2.7) | Hematuria | 101 | (1.5) | Hypotension | 295 | (2.3) |
| 9 | Dizziness | 967 | (1.9) | Chest pain | 1134 | (1.2) | Seizure | 606 | (1.4) | Chest pain | 69 | (1.0) | Care of catheter | 277 | (2.1) |
| 10 | Dysarthria | 644 | (1.3) | Diarrhea | 1166 | (1.3) | Left hemiparesis | 352 | (0.8) | Seizures | 63 | (0.9) | Chest pain | 211 | (1.6) |
| Severe Illness Diagnosis Group | Discharged | Admitted to Ward | Admitted to ICU | Transfer | Return to LTCH | Death | ||||||
|---|---|---|---|---|---|---|---|---|---|---|---|---|
| n | % | n | % | n | % | n | % | n | % | n | % | |
| Acute myocardial infraction | 75 | (0.15) | 232 | (0.26) | 831 | (1.90) | 71 | (1.07) | 25 | 75 | (1.67) | |
| Cerebral infarct | 1216 | (2.38) | 3083 | (3.39) | 2109 | (4.83) | 192 | (2.89) | 322 | (2.49) | 16 | (0.36) |
| Intracranial hemorrhage | 177 | (0.35) | 237 | (0.26) | 755 | (1.73) | 153 | (2.30) | 90 | (0.69) | 31 | (0.69) |
| Aortic dissection | 22 | (0.04) | 22 | (0.02) | 61 | (0.14) | 20 | (0.30) | 10 | (0.08) | 16 | (0.36) |
| Biliary diseases | 405 | (0.79) | 2356 | (2.59) | 407 | (0.93) | 152 | (2.29) | 85 | (0.66) | 13 | (0.29) |
| Surgical diseases | 1431 | (2.80) | 5857 | (6.44) | 3182 | (7.29) | 326 | (4.91) | 536 | (4.14) | 176 | (3.92) |
| Gastrointestinal bleeding/foreign bodies | 53 | (0.10) | 345 | (0.38) | 173 | (0.40) | 10 | (0.15) | 18 | (0.14) | 4 | (0.09) |
| Tracheobronchial bleeding/foreign bodies | 116 | (0.23) | 319 | (0.35) | 105 | (0.24) | 24 | (0.36) | 35 | (0.27) | 8 | (0.18) |
| Status epilepticus | 17 | (0.03) | 70 | (0.08) | 178 | (0.41) | 8 | (0.12) | 5 | (0.04) | 3 | (0.07) |
| Meningitis | 11 | (0.02) | 63 | (0.07) | 41 | (0.09) | 5 | (0.08) | 1 | (0.01) | 0 | (0.00) |
| Sepsis | 122 | (0.24) | 1429 | (1.57) | 2465 | (5.65) | 173 | (2.60) | 80 | (0.62) | 224 | (4.99) |
| Diabetic coma | 10 | (0.02) | 45 | (0.05) | 84 | (0.19) | 4 | (0.06) | 4 | (0.03) | 7 | (0.16) |
| PTE/DVT | 175 | (0.34) | 678 | (0.75) | 476 | (1.09) | 33 | (0.50) | 58 | (0.45) | 21 | (0.47) |
| Arrhythmia | 356 | (0.70) | 570 | (0.63) | 482 | (1.10) | 41 | (0.62) | 89 | (0.69) | 24 | (0.53) |
| ARDS/pulmonary edema | 115 | (0.22) | 1079 | (1.19) | 1020 | (2.34) | 67 | (1.01) | 55 | (0.42) | 90 | (2.01) |
| DIC | 0 | (0.00) | 3 | (0.00) | 9 | (0.02) | 3 | (0.05) | 1 | (0.01) | 1 | (0.02) |
| Intussusception/intestinal obstruction | 59 | (0.12) | 385 | (0.42) | 121 | (0.28) | 33 | (0.50) | 16 | (0.12) | 9 | (0.20) |
| Acute kidney injury | 233 | (0.46) | 1536 | (1.69) | 1038 | (2.38) | 89 | (1.34) | 105 | (0.81) | 46 | (1.02) |
| Post resuscitation state | 24 | (0.05) | 40 | (0.04) | 440 | (1.01) | 37 | (0.56) | 38 | (0.29) | 800 | (17.83) |
| Urological emergencies | 28 | (0.05) | 27 | (0.03) | 2 | (0.00) | 2 | (0.03) | 8 | (0.06) | 0 | (0.00) |
| Preventable Visit | Non-Preventable Visit | |||
|---|---|---|---|---|
| n | % | n | % | |
| 50,354 | 77,577 | |||
| Foley catheterization | 20,311 | (40.3) | 1979 | (2.6) |
| Placement of central venous catheter | 6358 | (12.6) | 30,647 | (39.5) |
| Nasogastric tube insertion | 4597 | (9.1) | 873 | (1.1) |
| Esophagogastroduodenoscopy | 2979 | (5.9) | 343 | (0.4) |
| Artificial ventilation | 2349 | (4.7) | 1600 | (2.1) |
| Invasive arterial blood pressure | 2316 | (4.6) | 23 | (0.0) |
| Transfusion | 1626 | (3.2) | 3103 | (4.0) |
| Tracheal intubation | 1581 | (3.1) | 116 | (0.1) |
| Hemodialysis | 1392 | (2.8) | 244 | (0.3) |
| Drug retention enema | 1287 | (2.6) | 5449 | (7.0) |
| Gastrostomy | 937 | (1.9) | 57 | (0.1) |
| Percutaneous transluminal angioplasty/others | 607 | (1.2) | 2273 | (2.9) |
| Thoracentesis | 515 | (1.0) | 3 | (0.0) |
| Pericardiocentesis | 389 | (0.8) | 22 | (0.0) |
| Upper gastrointestinal endoscopic bleeding control | 352 | (0.7) | 6 | (0.0) |
| Magnetic resonance imaging-brain | 351 | (0.7) | 2389 | (3.1) |
| Lumbar puncture | 321 | (0.6) | 809 | (1.0) |
| Percutaneous cholecystostomy | 314 | (0.6) | 4618 | (6.0) |
| Simple suture | 299 | (0.6) | 1087 | (1.4) |
| Cystostomy | 296 | (0.6) | 1154 | (1.5) |
| Closed thoracostomy | 288 | (0.6) | 776 | (1.0) |
| Percutaneous gastrostomy | 285 | (0.6) | 296 | (0.4) |
| Percutaneous transhepatic biliary drainage | 169 | (0.3) | 124 | (0.2) |
| Cardiopulmonary resuscitation | 110 | (0.2) | 722 | (0.9) |
| Invasive tracheostomy | 55 | (0.1) | 9 | (0.0) |
| Colonoscopic bleeding control | 51 | (0.1) | 21 | (0.0) |
| Decision to suspend life-sustaining treatment | 45 | (0.1) | 0 | (0.0) |
| Continuous hemodialysis | 43 | (0.1) | 10,278 | (13.2) |
| Endoscopic retrograde cholangiopancreatography | 40 | (0.1) | 671 | (0.9) |
| Endoscopic biliary or pancreatic drainage | 40 | (0.1) | 104 | (0.1) |
| Endoscopic treatment of esophageal or gastric variceal ligation | 37 | (0.1) | 43 | (0.1) |
| Percutaneous dilatational tracheostomy | 6 | (0.0) | 2 | (0.0) |
| Transtracheal catheter insertion and ventilation | 4 | (0.0) | 7533 | (9.7) |
| Endoscopic treatment of esophageal or gastric varices (Sclerotherapy) | 2 | (0.0) | 196 | (0.3) |
| Endoscopic treatment of upper gastrointestinal perforation | 1 | (0.0) | 3 | (0.0) |
| Dialysate exchange or catheter irrigation—conventional continuous ambulatory peritoneal dialysis | 1 | (0.0) | 3 | (0.0) |
| Break-in for chronic peritoneal dialysis | 0 | (0.0) | 1 | (0.0) |
Publisher’s Note: MDPI stays neutral with regard to jurisdictional claims in published maps and institutional affiliations. |
© 2022 by the authors. Licensee MDPI, Basel, Switzerland. This article is an open access article distributed under the terms and conditions of the Creative Commons Attribution (CC BY) license (https://creativecommons.org/licenses/by/4.0/).
Share and Cite
Yun, S.Y.; Lim, J.Y.; Kim, E.; Oh, J.; Lee, D.H. Epidemiology and Clinical Characteristics of Older Patients Transferred from Long-Term-Care Hospitals (LTCHs) to Emergency Departments by a Comparison with Non-LTCHs in South Korea: A Cross-Sectional Observational Study. Int. J. Environ. Res. Public Health 2022, 19, 8879. https://doi.org/10.3390/ijerph19148879
Yun SY, Lim JY, Kim E, Oh J, Lee DH. Epidemiology and Clinical Characteristics of Older Patients Transferred from Long-Term-Care Hospitals (LTCHs) to Emergency Departments by a Comparison with Non-LTCHs in South Korea: A Cross-Sectional Observational Study. International Journal of Environmental Research and Public Health. 2022; 19(14):8879. https://doi.org/10.3390/ijerph19148879
Chicago/Turabian StyleYun, Soon Young, Ji Yeon Lim, Eun Kim, Jongseok Oh, and Duk Hee Lee. 2022. "Epidemiology and Clinical Characteristics of Older Patients Transferred from Long-Term-Care Hospitals (LTCHs) to Emergency Departments by a Comparison with Non-LTCHs in South Korea: A Cross-Sectional Observational Study" International Journal of Environmental Research and Public Health 19, no. 14: 8879. https://doi.org/10.3390/ijerph19148879