Article

Associations between Physical Activity Level and Health Services Use in Spanish Adults

by
Ángel Denche-Zamorano
1,
María Mendoza-Muñoz
2,3,*,
Jorge Carlos-Vivas
4,*,
Laura Muñoz-Bermejo
5,
Jorge Rojo-Ramos
5,
Frano Giakoni-Ramírez
6,
Andrés Godoy-Cumillaf
7 and
Sabina Barrios-Fernandez
5
1
Health Economy Motricity and Education (HEME), Faculty of Sport Sciences, University of Extremadura, 10003 Caceres, Spain
2
Research Group on Physical and Health Literacy and Health-Related Quality of Life (PHYQOL), Faculty of Sport Sciences, University of Extremadura, 10003 Caceres, Spain
3
Departamento de Desporto e Saúde, Escola de Saúde e Desenvolvimento Humano, Universidade de Évora, 7004-516 Evora, Portugal
4
Promoting a Healthy Society Research Group (PHeSO), Faculty of Sport Sciences, University of Extremadura, 10003 Caceres, Spain
5
Social Impact and Innovation in Health (InHEALTH), University of Extremadura, 10003 Caceres, Spain
6
Faculty of Education and Social Sciences, Universidad Andres Bello, Las Condes 7550000, Chile
7
Grupo de Investigación en Educación Física, Salud y Calidad de Vida, Facultad de Educación, Universidad Autónoma de Chile, Temuco 4810101, Chile
*
Authors to whom correspondence should be addressed.
Int. J. Environ. Res. Public Health 2022, 19(14), 8867; https://doi.org/10.3390/ijerph19148867
Submission received: 14 June 2022 / Revised: 15 July 2022 / Accepted: 18 July 2022 / Published: 21 July 2022

Abstract

:
One of the main concerns of governments and organisations worldwide is the cost and burden of health services, with sedentary lifestyles being a significant impacting factor, and physical activity is one of the potential solutions. Therefore, this study aims to analyse the possible associations between the physical activity level, hospitalisation prevalence, and the use and number of visits to emergency services in the Spanish population, examining potential differences between sex and age groups. This is a cross-sectional study based on data from the Spanish National Health Survey 2017 (ENSE 2017), the last one before the COVID-19 pandemic, with 17,199 participants. A descriptive analysis was performed using median and interquartile range (continuous variables) and absolute and relative frequencies (ordinal variables). Intergroup differences were analysed with non-parametric tests: chi-square and z-test for independent proportions (categorical variables), and Kruskal–Wallis and Mann–Whitney U (continuous variables). Spearman’s rho was used to study correlations between variables. A multiple binary regression analysis was performed to predict hospitalisations. Hospitalisations and emergency services use showed a dependence relation with the physical activity level (p < 0.001): those who performed moderate and/or vigorous physical activity used those services less than sedentary individuals and those whose only activity was walking. Thus, associations could be drawn between the hospitalisation prevalence, the use and number of visits to emergency departments, and the physical activity level in the Spanish population aged 18–69 years in the pre-pandemic period.

1. Introduction

In recent decades, the burdens and costs of public health services have been increasing, and they are expected to rise further [1,2] as a result of several health determinants, such as population ageing [3,4], sedentary habits [5,6] and an expected increase in the prevalence of non-communicable diseases [7,8]. Additionally, the effects of the COVID-19 pandemic [9,10] must be added to this equation. Healthcare costs are one of the main concerns of governments and organisations worldwide and present one of the most significant challenges to sustainability for health policymakers, managers, and researchers [11]. In Spain, health expenditure represents around 9% of the Gross Domestic Product (GDP), 1% below the European average; in 2017, healthcare costs represented an average of 2371 € per citizen, compared to 2884 € in Europe [12]. This contrasts with the United States, where health expenditure rises to 16% of GDP [13]. Part of this expenditure is due to hospitalisations and the use of emergency services; in Spain, there are four million hospitalisations per year, with an average cost of 4746 euros per hospitalisation, and the use of emergency services represents a cost of 31 million euros [14].
Physical activity is defined as any bodily movement produced by skeletal muscles that require energy expenditure [15] and is related to different health benefits: better weight control [16,17], glycemic control [18,19], pain management [20,21], and psychiatric symptomatology [21,22,23,24], as well as lower risk of certain types of cancer [25], among others. It is therefore conclusive that exercise promotes better health-related quality of life [26,27]. The World Health Organization (WHO) Guidelines on Physical Activity and Sedentary Behavior recommend performing 150–300 min of moderate physical activity per week, 75–150 min at a vigorous intensity, or a combination of both [28]. However, according to the Spanish General Secretary for Health Information [29], more than one-third (35.3%) of the population aged 15–69 years do not achieve these recommendations. Non-compliance with these recommendations is more frequent in women (37%) than in men (33.5%), and less physical activity is performed as age increases. Thus, it is reported that among those 15–24 years old, almost 34% engage in vigorous physical activity, while this percentage drops to 17.5% among those 55–69 years old. Moreover, among those 15–24 years old, almost 28% present a low physical activity level, a proportion that rises to nearly 38% among those 55–69 years old, increasing the risk of potential adverse health consequences [30,31]. As the WHO states, sedentary behaviours are defined as any waking behaviour characterised by an energy expenditure of 1.5 METs or less while sitting, reclining, or lying down, while physical inactivity is understood as performing less physical activity level than recommended. This can lead to adverse health consequences and increase the use of health services [32,33,34]. Therefore, increasing physical activity could generate substantial economic gains for the global economy [35].
An active lifestyle throughout life is a protective factor for some older peoples’ more prevalent health problems. Physical activity is one of the active ageing components. Some positive effects include reducing the impact of chronic and mental illnesses, pain, falls, fractures, and mortality risk factors [36], which could help reduce the costs of health service use [37,38]. By contrast, a sedentary lifestyle [39] and physical inactivity are associated with premature and pathological ageing, and with a variety of chronic conditions [40], which may result in increased demand for health services [41]. Thus, establishing physical activity programmes for adolescents, adults, and the elderly could lead to lower health service use, reducing health expenditure [42,43,44].
A study found that the COVID-19 lockdown resulted in decreased physical activity levels, with men (sex), individuals with primary and secondary studies (educational level), and the unemployed (employment status) showing the highest reductions [45]. Moreover, there was a significant decrease in moderate physical activity in Spanish adults with chronic conditions and a significant decline in vigorous physical activity in men with chronic diseases and multimorbidity [46]. Furthermore, the COVID-19 pandemic has influenced the Spanish adult population’s eating and sleeping habits, physical activity, and sedentary behaviour [45,46,47].
Therefore, this research aimed to study the associations between the physical activity level and the hospitalisation prevalence and the number of visits to the emergency services in members of the Spanish population between 18 and 69 years of age, considering sex and age group.

2. Materials and Methods

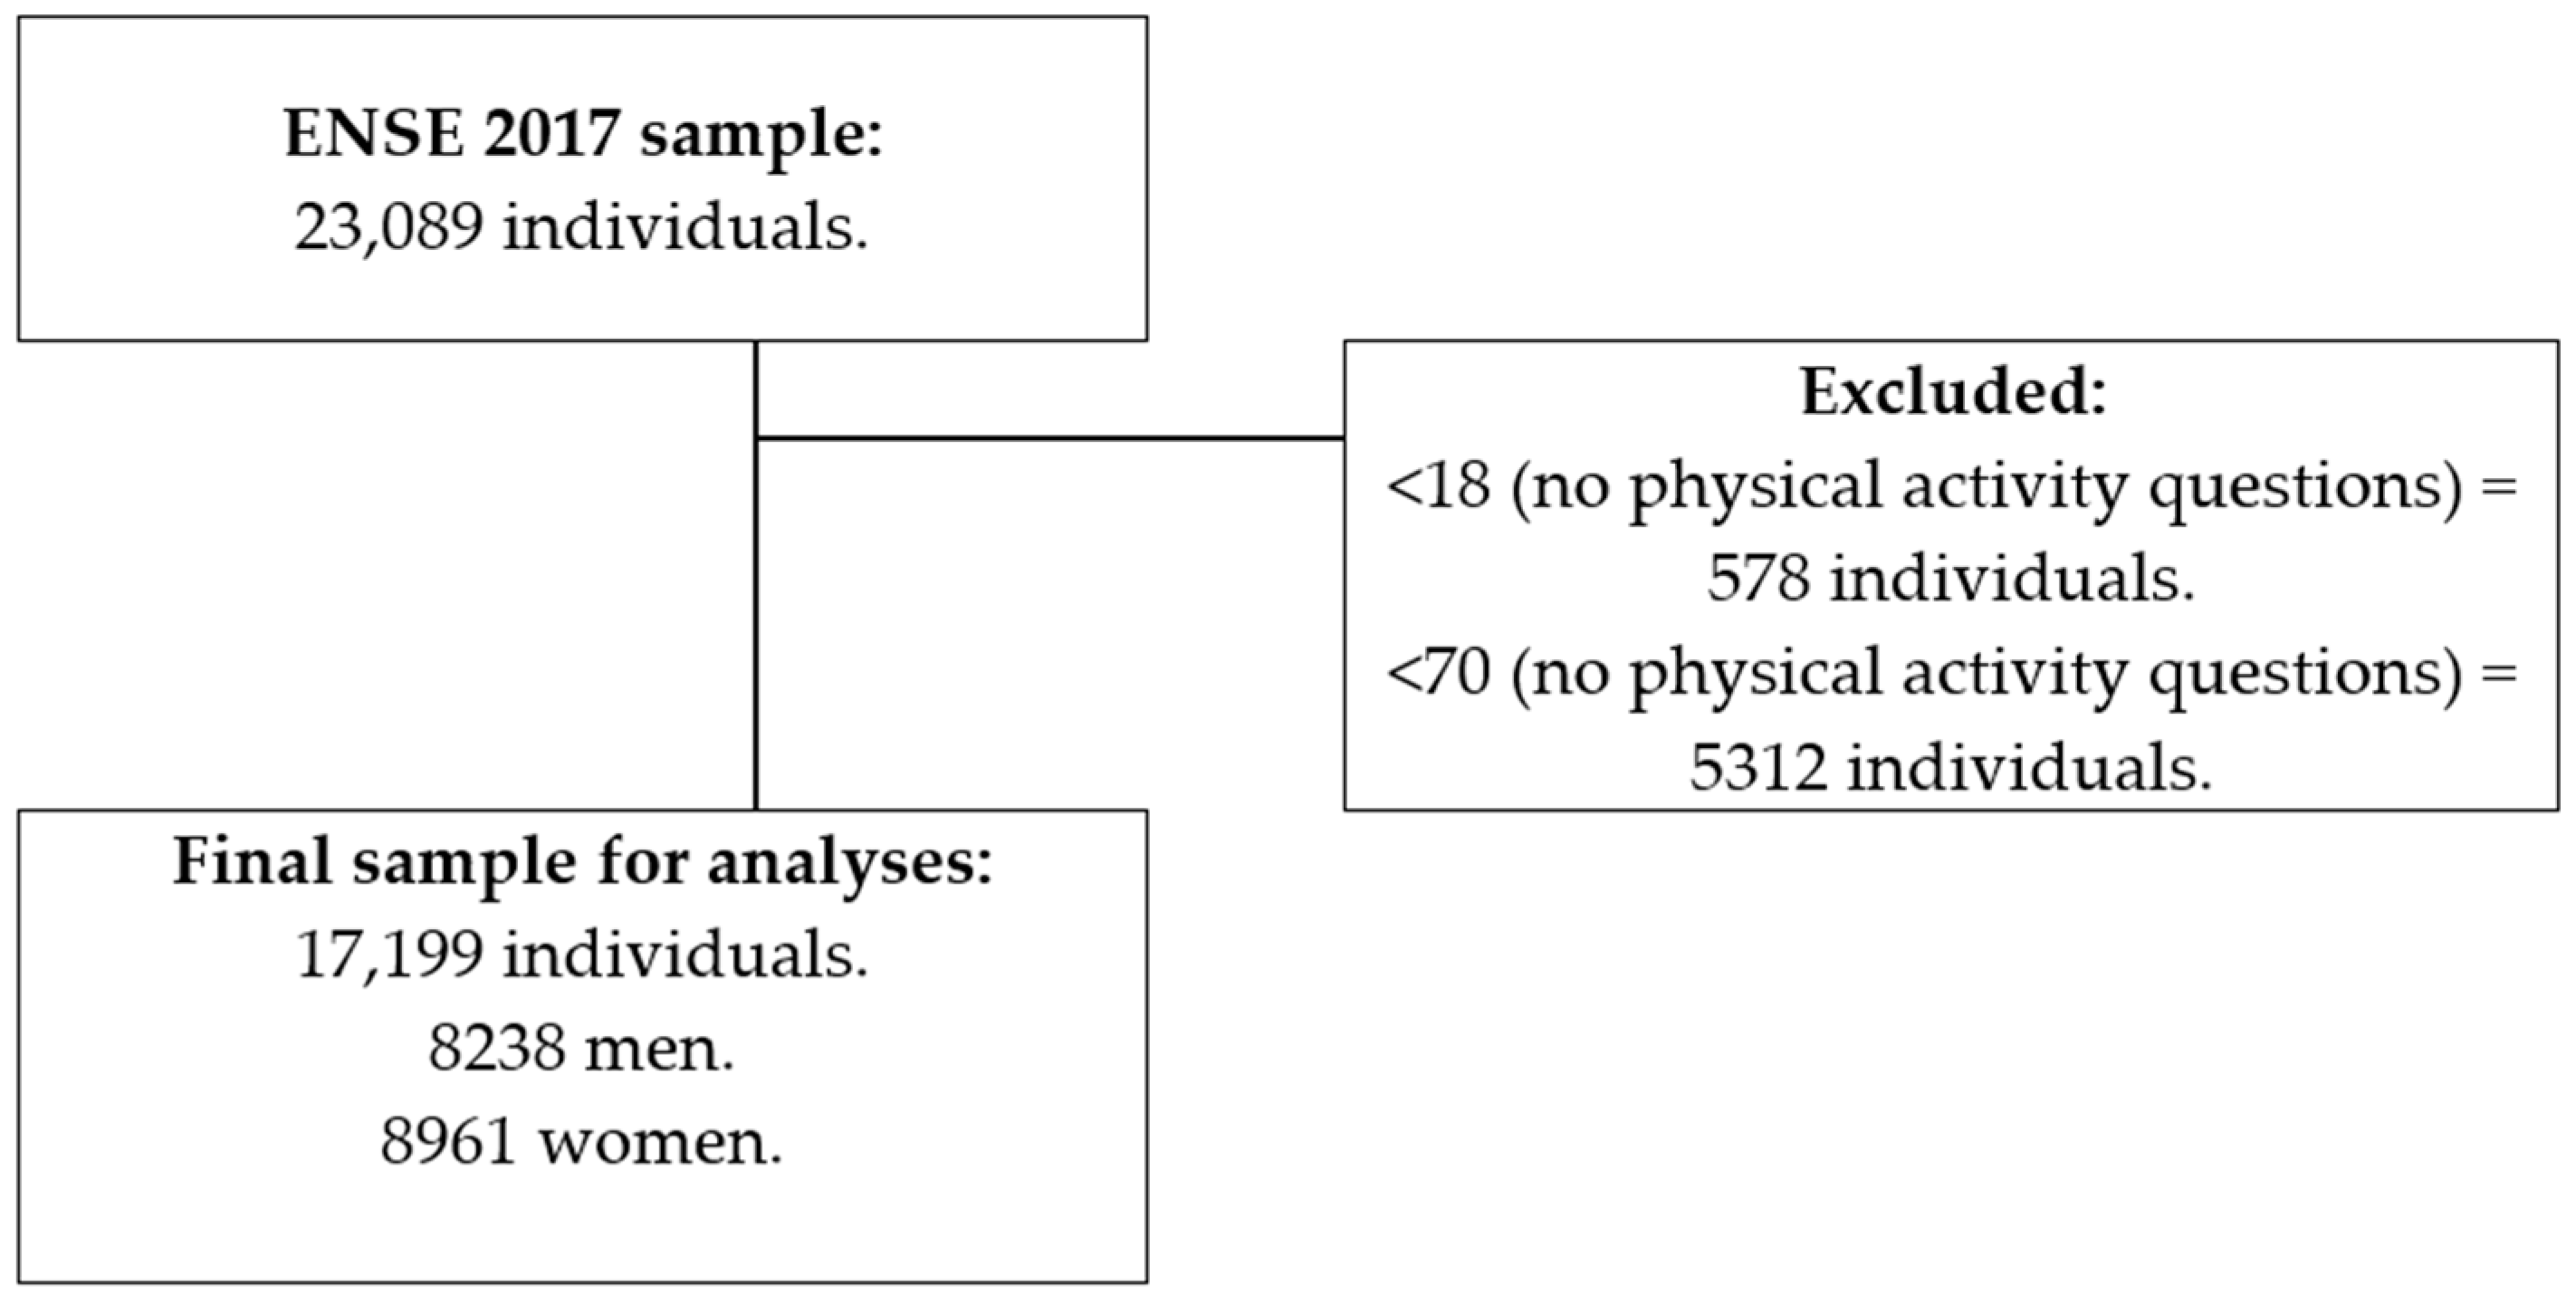
2.1. Desing and Participants

A descriptive correlational study was conducted using data obtained from the Adult Questionnaire from the ENSE 2017 [47]. This survey is developed by the Ministry of Health, Consumption and Social Welfare and the National Institute of Statistics every five years. Their objectives include identifying health-related factors that enable the planning, evaluation, and readjustment of health policies to make them as effective and efficient as possible. The last ENSE was conducted in 2017, before the COVID-2019 pandemic. The results of the survey will allow for the establishment of a comparative framework, with the following survey expected to be completed in 2023, in a post-pandemic context.
The ENSE 2017 interviewed 23,089 individuals using a random stratified three-phase sampling system [48], including 10,595 men and 12,494 women over 15 years of age, residing in Spain. The inclusion criterion included being between 18 and 69 years. Participants under 18 (578 individuals) and over 70 (5312 individuals) were excluded, as they were not questioned about their physical activity level. Finally, the sample for this research was composed of 17,199 individuals (8238 men and 8961 women) as shown in Figure 1.

2.2. Measures and Variables

Below are the ENSE 17 sections where data were collected and the ad hoc variables constructed for this study.
Age: the numerical value was extracted from the ENSE 2017 to characterise the sample and create the age groups variable, which included young people (18–34 years), young adults (35–49 years), older adults (50–64 years) and older (65–69 years).
Sex: males and females were considered in the ENSE 17; they were used in this study to characterise the sample and construct subgroups by sex.
Physical Activity Index (PAI): created with the answers to the Spanish version of the International Physical Activity Questionnaire (IPAQ) [49] and computed by applying factors to the responses provided to items P. 113, P. 114, P. 115, and P. 116; and whose formula and factors have been used in previous research [50]. For the analyses that included this variable, 58 participants were excluded because they answered “don’t know”, or did not answer (NS/NC) to some items p. 113–117.
Physical Activity Level: derived from the PAI. It consists of six levels, two levels with people who had a PAI = 0, and four levels with people who had a PAI > 0. People with PAI = 0 were grouped into two levels, according to the answers given to item Q. 117 (“now think about how much time you spent walking in the last seven days”), discriminating between physically inactive (did not walk) and walkers (those whose only physical activity was walking). The six physical activity levels were: Inactive (PAI = 0; to the ENSE 17 question Q. 117 (“now think about how much time you spent walking in the last seven days”, they answered “no day more than ten consecutive minutes”)); Walkers (PAI = 0; to Q. 117, they answered that they walked at least one day a week, more than ten consecutive minutes); Low (PAI = 1–15, representing the population 75th percentile); Medium (PAI = 16–30, 90th percentile); High (PAI between 31–45, 95th percentile); and Very high (PAI > 45, above the 95th percentile).
Hospitalisation prevalence: data were extracted from question 66, “during the last 12 months, did you need to be admitted as a patient for at least one night excluding childbirth or caesarean section?” The available response options were “yes” or “no”.
Use of emergency services: data were extracted from question 78, “during the last 12 months, have you had to use any emergency services for any problem or illness?” The available response options were “yes” or “no”.
Number of visits to emergency services: data were obtained from question 79, “and in total, how many times did you have to use an emergency service in the last 12 months?” with the response options being the total number of visits or “don’t know/no answer”. Ten participants were excluded from the analyses with this variable because they answered “NS/NC”, and two participants were excluded because they had visited emergency services 50 and 200 times, respectively, being extreme values.

2.3. Ethical Concerns

According to Regulation 2016/679 of the European Parliament and of the Council of 27 April 2016 on the protection of individuals about the processing of personal data and the free movement of personal data and derogating from Directive 95/46/EC [51], anonymous files for public use are not considered confidential. Therefore, approval by a bioethics committee is not required.

2.4. Statistical Analysis

Statistical analyses were carried out with the Statistical Package for the Social Sciences software version 25 (IBM SPSS, Armonk, NY, USA). A descriptive analysis was performed using the median and the interquartile range, with mean and standard deviation (continuous variables) and absolute and relative frequencies (ordinal variables). A Chi-Square test was performed to analyse the dependence relationships between the PAL and the rest of the categorical variables of interest. In these, a pairwise z-test of independent proportions was carried out to analyse potential differences in inter-group proportions (ordinal variables). The Kruskal–Wallis’s and Mann–Whitney’s U-test (continuous variables) were employed to explore the dependence between variables and intergroup differences, respectively. Spearman’s rho was used to analyse the correlations between variables. A multiple binary logistic binary model was used to study the effects of predictor variables (age, PAL, and use of emergency services) on hospitalisations. Two-sided p-values ≤ 0.05 were considered statistically significant.

3. Results

Table 1 presents the sociodemographic characteristics of the sample; it includes information on the hospitalisation prevalence, use and number of visits to emergency services within the last year, and the physical activity level in the Spanish population aged 18–69 years, according to the ENSE 2017. Concerning sex differences, women reported a higher number of hospitalisations, higher use of emergency services, and lower physical activity levels than men.
Table 2 shows the dependency ratios of hospitalisation prevalence according to age groups, both in the total population and by sex. As seen, the hospitalisation proportions (at least once in the 12 months) increase with age.
In the same line, dependency ratios were found between the hospitalisation prevalence and the physical activity level in the general population and the two age groups (Table 3), with more hospitalisations as the physical activity levels decreased, and higher use in women compared to men.
Table 4 reports the associations between the hospitalization prevalence and the physical activity level by age group, including dependency between these variables. Those who only did walking (“walkers”) showed lower hospitalization proportions than those in the “Inactive” in all cases.
Table 5 shows the associations between the use of emergency services in the 12 months preceding the survey and the physical activity level by age group, including dependency between these variables. In all the age groups, women used the emergency services more than men.
In Table 6, associations between the use of emergency services and the physical activity level in the Spanish population by sex can be found. Dependency relationships were found between both variables in the general population as well as in the men’s and women’s groups. Women with lower physical activity levels used emergency services more, while those with higher levels used them less than their male counterparts.
Table 7 displays the Associations between the use of emergency services and physical activity level. Dependence relationships were found between the prevalence of use of emergency services and physical activity level in every age group.
Table 8 shows the association between the number of visits to the emergency services according to physical activity level and sex. Women visited emergency services more than men in all cases, but the use of emergency services decreased as the physical activity level increased both in men and women.
The analysis of correlations revealed weak correlations between the physical activity level and (1) the hospitalisation prevalence (rho: −0.086. p < 0.001), (2) the use of emergency services (rho = −0.085. p < 0.001) and (3) the number of visits emergency services (rho = −0.091. p < 0.001).
Finally, after performing a binary logistic regression analysis about hospitalisations as shown in Table 9. Those who were younger, women, people who had not used emergency services, and those with active lifestyles showed a lower risk of being hospitalised. Thus, the logistic regression model explained 14.1% (Nagelkerke R2) of the variance in hospitalization.

4. Discussion

4.1. Main Findings and Theoretical Implications

The main purpose of this research was to examine the associations between the physical activity level and the use of health services by those between 18 and 69 years of age in the Spanish population during the last pre-pandemic period using the ENSE 2017 data [52]. The main contributions were the discovery of associations in the general population, in both sexes and the different age groups, between the different variables. A dependency ratio was found between the physical activity level and (1) the hospitalization prevalence and (2) the use of emergency services, discovering that belonging to the “Inactive” group was related to a higher hospitalisation prevalence and use of emergency services compared with those who only did walking (“Walkers”).
Regarding the hospitalisation prevalence, no differences between the sexes were found, although there was an increase as age groups increased. In the general population, the hospitalisation prevalence ranged from 4.6% in young people to 12.2% in older people. In men, the percentage points increased more than three times between younger and older age groups (4.1% vs. 13.5%), a difference of 11.4 percentage points. In women, the differences were more than twice as large between younger and older (5.0% vs. 11.1%). Likewise, dependency ratios were found between the hospitalisation prevalence and physical activity level in the general population and both sexes. In the inactive group, the hospitalisation prevalence was 11.6%, 7.8 percentage points higher than the “High” and “Very high” groups, with similar rates in both sexes. Between “Inactive” and “Walkers”, a 4-percentage point difference in favour of “Walkers” was found, being 3.5 points in men and 4.3 points in women. Daily activity in adults and older adults predicts fewer future hospitalisations, reducing the length of hospital stays and the number of admissions in a previous study [53].
Moreover, dependency ratios were also found in the general population and the sex groups in emergency services use. In the general population, young people had the highest prevalence of emergency services use (35.0%), with older people (24.7%) reporting the lowest use. Prevalence in young men was 30.9%, versus 23.9% in adults and 24.7% in older adults. In the women’s group, the prevalence was 38.6 in younger women, 27.9 in adults, and 29.0% in older women, with differences of 7.7, 4, and 4.3 percentage points more than men of the same age. Dependency ratios were also found between the use of emergency services and the physical activity level in the general population, as well as in the men and women groups, with a 16.4 percentage point difference between the “Inactive” and “Very high” levels, a 14.6-point difference in men and a 16.1-point difference in women. Between those categorised as “Inactive” and “Walkers”, a 9.6 percentage-point difference was found in prevalence in the general population, 8.7 in men and 10.6 in women. These associations were confirmed in all age groups, decreasing as the physical activity levels increased. In the elderly, the prevalence of emergency services use dropped from 41.1% in the “Inactive” to 15.4% in the “High” physical activity level group. Differences of 15–20 percentage points were reported between the “Inactive” and the “Very high” physical activity level groups in young, adults, and older people. Usage differences between the “Inactive” and “Walkers” groups widened as age increased, from 5.1 percentage points in young people to 12.1 in adults and 13.8 in older individuals. Concerning the number of visits to emergency departments in the 12 months before the 2017 ENSE, significant differences were found between “Inactive” and “Walkers”, and between these and the rest of the groups, in the general population and the sex groups. The mean number of visits in men went from 0.66 in “Inactive” to 0.28 in the “Very high” physical activity level. In women, the mean number of visits was 0.99 in “Inactive” compared to 0.44 in “Medium” physical activity level. A US study found that adults who engaged in regular physical activity used more preventive and consultative services and significantly fewer inpatient, emergency, home health care, and prescription drug services [38]. Some studies suggest that sex is linked to the use of health services, being that women use them more often [54,55,56].
Thus, 28.9% of the Spanish population used emergency services in the 12 months before the ENSE 2017, representing a 26.5% prevalence in men and 31.1% in women. Possible explanations for this difference are multifactorial: women often experience a poorer self-perception of their health status, so they show more significant concern about suspicious symptomatology [57]; gender-related differences [58]; willingness to receive and follow medical advice [59]; they present higher prevalence and degree of pain due to hormonal, biological and contextual causes [60]; and poorer mental health [61], among others. On the other hand, age is also related to the higher use of health services, including outpatient and inpatient care for chronic diseases, due, among other reasons, to sedentary lifestyles [62]. Other studies have found associations between age and higher use of medicines, laboratory examinations, and visits to health centres, hospitals, and emergency services [63,64].

4.2. Practical Implications

The importance of this study relies on the analyses of the associations between the physical activity level and the use of health services in the Spanish population during the last period before the COVID-19 pandemic, which could serve as a frame of reference for future research examining post-pandemic periods, as the ENSE is addressed every 5 years. Furthermore, by the negative consequences caused by the pandemic on the daily habits of the Spanish population concerning physical activity and sedentary behaviour, this study can serve as a framework to study the post-pandemic situation and verify whether the use of medical services by the Spanish population increases [45,46,65].
Given these data, the associations found showed that the inactive population generally uses more health services compared with those who at least walked. Additionally, those who only walked used more health services than those who were more active. Moreover, the results indicated that the number of visits to emergency services was higher in the inactive group than in the groups who walked or performed moderate and/or vigorous physical activity. Although various research recommends performing medium to high physical activity to improve their health benefits [37,38], our study design does not allow us to establish cause-effect relations.

4.3. Limitations and Future Lines

The most important limitation is that this type of study design does not allow us to establish cause-effect relations, thus future lines should include longitudinal studies; therefore, it would be recommended that the survey should retain all the analysed variables. Another limitation is that the differences between moderate and vigorous physical activity couldn’t be analysed, which should be considered in future research. Another limitation is the lack of participants’ medical histories, physical activity objectives, and physiological data, including follow-ups; a methodological improvement that could be implemented could be to perform a 24-h compositional analysis, including devices to quantify physical activity intensity or other measures to overcome some of the limitations of survey-based studies.

5. Conclusions

This study found associations between the hospitalisation prevalence, the use and number of visits to emergency departments, and the physical activity level in the Spanish population aged 18–69 years in the pre-pandemic period, analysed by sex and age groups.
These results need to be confirmed with longitudinal studies in order to recommend the PA programs or “sports prescription” implementation as a cost-effective alternative to reduce health expenditure.

Author Contributions

Conceptualisation, L.M.-B., M.M.-M. and J.R.-R.; methodology, J.C.-V. and Á.D.-Z.; formal analysis, Á.D.-Z.; writing—original draft preparation, S.B.-F. and J.C.-V.; writing—review and editing, L.M.-B., M.M.-M. and J.R.-R.; visualisation, F.G.-R. and A.G.-C.; supervision, Á.D.-Z. and S.B.-F.; funding acquisition, F.G.-R. and A.G.-C. All authors have read and agreed to the published version of the manuscript.

Funding

The author Á.D.-Z. (FPU20/04201) was supported by a grant from the Spanish Ministry of Education, Culture, and Sport. Grants FPU20/04201 funded by MCIN/AEI/10.13039/501100011033 and, as appropriate, by “European Social Fund Investing in your future” or by “European Union NextGenerationEU/PRTR”. The author M.M.-M. was supported by a grant from the Universities Ministry and the European Union (NextGenerationUE) (MS-12).

Institutional Review Board Statement

Not applicable.

Informed Consent Statement

Not applicable.

Data Availability Statement

Datasets will be available under reasonable request.

Conflicts of Interest

The authors declare no conflict of interest.

References

  1. Dieleman, J.L.; Sadat, N.; Chang, A.Y.; Fullman, N.; Abbafati, C.; Acharya, P.; Adou, A.K.; Ahmad Kiadaliri, A.; Alam, K.; Alizadeh-Navaei, R.; et al. Trends in future health financing and coverage: Future health spending and universal health coverage in 188 countries, 2016–2040. Lancet 2018, 391, 1783–1798. [Google Scholar] [CrossRef] [Green Version]
  2. Keehan, S.P.; Cuckler, G.A.; Poisal, J.A.; Sisko, A.M.; Smith, S.D.; Madison, A.J.; Rennie, K.E.; Fiore, J.A.; Hardesty, J.C. National Health Expenditure Projections, 2019–2028: Expected Rebound in Prices Drives Rising Spending Growth: National health expenditure projections for the period 2019–2028. Health Aff. 2020, 39, 704–714. [Google Scholar] [CrossRef] [PubMed]
  3. Harris, A.; Sharma, A. Estimating the future health and aged care expenditure in Australia with changes in morbidity. PLoS ONE 2018, 13, e0201697. [Google Scholar] [CrossRef] [PubMed]
  4. Lopreite, M.; Mauro, M. The effects of population ageing on health care expenditure: A Bayesian VAR analysis using data from Italy. Health Policy 2017, 121, 663–674. [Google Scholar] [CrossRef] [PubMed]
  5. Carlson, S.A.; Fulton, J.E.; Pratt, M.; Yang, Z.; Adams, E.K. Inadequate Physical Activity and Health Care Expenditures in the United States. Prog. Cardiovasc. Dis. 2015, 57, 315–323. [Google Scholar] [CrossRef] [Green Version]
  6. Nguyen, P.; Le, L.K.-D.; Ananthapavan, J.; Gao, L.; Dunstan, D.W.; Moodie, M. Economics of sedentary behaviour: A systematic review of cost of illness, cost-effectiveness, and return on investment studies. Prev. Med. 2022, 156, 106964. [Google Scholar] [CrossRef]
  7. Muka, T.; Imo, D.; Jaspers, L.; Colpani, V.; Chaker, L.; van der Lee, S.J.; Mendis, S.; Chowdhury, R.; Bramer, W.M.; Falla, A.; et al. The global impact of non-communicable diseases on healthcare spending and national income: A systematic review. Eur. J. Epidemiol. 2015, 30, 251–277. [Google Scholar] [CrossRef]
  8. Kazibwe, J.; Tran, P.B.; Annerstedt, K.S. The household financial burden of non-communicable diseases in low- and middle-income countries: A systematic review. Health Res. Policy Syst. 2021, 19, 96. [Google Scholar] [CrossRef]
  9. Hartman, M.; Martin, A.B.; Washington, B.; Catlin, A.; The National Health Expenditure Accounts Team. National Health Care Spending In 2020: Growth Driven by Federal Spending in Response to the COVID-19 Pandemic: National Health Expenditures study examines US health care spending in 2020. Health Aff. 2022, 41, 13–25. [Google Scholar] [CrossRef]
  10. Carrera-Hueso, F.J.; Álvarez-Arroyo, L.; Poquet-Jornet, J.E.; Vázquez-Ferreiro, P.; Martínez-Gonzalbez, R.; El-Qutob, D.; Ramón-Barrios, M.A.; Martínez-Martínez, F.; Poveda-Andrés, J.L.; Crespo-Palomo, C. Hospitalization budget impact during the COVID-19 pandemic in Spain. Health Econ. Rev. 2021, 11, 43. [Google Scholar] [CrossRef]
  11. Shrank, W.H.; DeParle, N.-A.; Gottlieb, S.; Jain, S.H.; Orszag, P.; Powers, B.W.; Wilensky, G.R. Health Costs and Financing: Challenges and Strategies for a New Administration: Commentary recommends health cost, financing, and other priorities for a new US administration. Health Aff. 2021, 40, 235–242. [Google Scholar] [CrossRef] [PubMed]
  12. OECD and European Observatory on Health Systems and Policies State of Health in the EU. España Perf. Sanit. Nac. 2019, 2019, 507–552.
  13. Valdrés López, A.; Bruna Barranco, I.; Martínez Giménez, L.; López Zapater, B.; Maestre Aguilar, R. Análisis del sistema sanitario de Estados Unidos de América, salud y negocio. Rev. Sanit. Investig. 2021, 2, 2660–7085. [Google Scholar]
  14. Ministerio de Sanidad. Consumo y Bienestar Social Principales Datos del Sistema Nacional de Salud; Ministerio de Sanidad: Madrid, Spain, 2021. [Google Scholar]
  15. Thivel, D.; Tremblay, A.; Genin, P.M.; Panahi, S.; Rivière, D.; Duclos, M. Physical Activity, Inactivity, and Sedentary Behaviors: Definitions and Implications in Occupational Health. Front. Public Health 2018, 6, 288. [Google Scholar] [CrossRef]
  16. Jakicic, J.M.; Rogers, R.J.; Davis, K.K.; Collins, K.A. Role of physical activity and exercise in treating patients with overweight and obesity. Clin. Chem. 2018, 64, 99–107. [Google Scholar] [CrossRef] [PubMed]
  17. Jakicic, J.M.; Powell, K.E.; Campbell, W.W.; Dipietro, L.; Pate, R.R.; Pescatello, L.S.; Collins, K.A.; Bloodgood, B.; Piercy, K.L. Physical Activity and the Prevention of Weight Gain in Adults: A Systematic Review. Med. Sci. Sports Exerc. 2019, 51, 1262–1269. [Google Scholar] [CrossRef]
  18. van Dijk, J.-W.; van Loon, L.J.C. Exercise Strategies to Optimize Glycemic Control in Type 2 Diabetes: A Continuing Glucose Monitoring Perspective. Diabetes Spectr. 2015, 28, 24–31. [Google Scholar] [CrossRef] [Green Version]
  19. Amanat, S.; Ghahri, S.; Dianatinasab, A.; Fararouei, M.; Dianatinasab, M. Exercise and Type 2 Diabetes. In Physical Exercise for Human Health; Advances in Experimental Medicine and Biology Book Series; Springer: Singapore, 2020; Volume 1228, pp. 91–105. [Google Scholar]
  20. O’Neill, A.; O’Sullivan, K.; McCreesh, K. Lower levels of physical activity are associated with pain progression in older adults, a longitudinal study. Eur. J. Pain 2021, 25, 1462–1471. [Google Scholar] [CrossRef]
  21. Lima, L.V.; Abner, T.S.S.; Sluka, K.A. Does exercise increase or decrease pain? Central mechanisms underlying these two phenomena: Exercise pain and analgesia. J. Physiol. 2017, 595, 4141–4150. [Google Scholar] [CrossRef] [Green Version]
  22. Hu, M.X.; Turner, D.; Generaal, E.; Bos, D.; Ikram, M.K.; Ikram, M.A.; Cuijpers, P.; Penninx, B.W.J.H. Exercise interventions for the prevention of depression: A systematic review of meta-analyses. BMC Public Health 2020, 20, 1255. [Google Scholar] [CrossRef]
  23. Heissel, A.; Zech, P.; Rapp, M.A.; Schuch, F.B.; Lawrence, J.B.; Kangas, M.; Heinzel, S. Effects of exercise on depression and anxiety in persons living with HIV: A meta-analysis. J. Psychosom. Res. 2019, 126, 109823. [Google Scholar] [CrossRef] [PubMed]
  24. Wang, L.; Sun, Y.; Zhan, J.; Wu, Z.; Zhang, P.; Wen, X.; Ge, S.; Han, X.; Lu, L. Effects of Exercise Therapy on Anxiety and Depression in Patients with Coronary Heart Disease: A Meta-Analysis of a Randomized Controlled Study. Front. Cardiovasc. Med. 2021, 8, 730155. [Google Scholar] [CrossRef] [PubMed]
  25. Mctiernan, A.; Friedenreich, C.M.; Katzmarzyk, P.T.; Powell, K.E.; Macko, R.; Buchner, D.; Pescatello, L.S.; Bloodgood, B.; Tennant, B.; Vaux-Bjerke, A.; et al. Physical Activity in Cancer Prevention and Survival: A Systematic Review. Med. Sci. Sports Exerc. 2019, 51, 1252–1261. [Google Scholar] [CrossRef]
  26. Koolhaas, C.M.; Dhana, K.; Rooij, F.J.A.; Schoufour, J.D.; Hofman, A.; Franco, O.H. Physical activity types and health-related quality of life among middle-aged and elderly adults: The Rotterdam Study. J. Nutr. Health Aging 2018, 22, 246–253. [Google Scholar] [CrossRef] [PubMed]
  27. Anokye, N.K.; Trueman, P.; Green, C.; Pavey, T.G.; Taylor, R.S. Physical activity and health related quality of life. BMC Public Health 2012, 12, 624. [Google Scholar] [CrossRef] [Green Version]
  28. Bull, F.C.; Al-Ansari, S.S.; Biddle, S.; Borodulin, K.; Buman, M.P.; Cardon, G.; Carty, C.; Chaput, J.-P.; Chastin, S.; Chou, R.; et al. World Health Organization 2020 guidelines on physical activity and sedentary behaviour. Br. J. Sports Med. 2020, 54, 1451–1462. [Google Scholar] [CrossRef]
  29. Secretaría General de Información Sanitaria. Serie informes monográficos 2: Actividad física, descanso y sueño. In Encuesta Nacional de Salud de España 2017; Gobierno de España: Madrid, Spain, 2019. [Google Scholar]
  30. Moeini, B.; Rezapur-Shahkolai, F.; Bashirian, S.; Doosti-Irani, A.; Afshari, M.; Geravandi, A. Effect of interventions based on regular physical activity on weight management in adolescents: A systematic review and a meta-analysis. Syst. Rev. 2021, 10, 52. [Google Scholar] [CrossRef]
  31. Takagi, D.; Nishida, Y.; Fujita, D. Age-associated changes in the level of physical activity in elderly adults. J. Phys. Ther. Sci. 2015, 27, 3685–3687. [Google Scholar] [CrossRef] [Green Version]
  32. Sari, N. Physical inactivity and its impact on healthcare utilization. Health Econ. 2009, 18, 885–901. [Google Scholar] [CrossRef]
  33. Arocha Rodulfo, J.I. Sedentarism, a disease from xxi century. Clínica E Investig. En Arterioscler. 2019, 31, 233–240. [Google Scholar] [CrossRef]
  34. León-Latre, M.; Moreno-Franco, B.; Andrés-Esteban, E.M.; Ledesma, M.; Laclaustra, M.; Alcalde, V.; Peñalvo, J.L.; Ordovás, J.M.; Casasnovas, J.A. Sedentary Lifestyle and Its Relation to Cardiovascular Risk Factors, Insulin Resistance and Inflammatory Profile. Rev. Esp. Cardiol. Engl. Ed. 2014, 67, 449–455. [Google Scholar] [CrossRef] [PubMed]
  35. Hafner, M.; Yerushalmi, E.; Stepanek, M.; Phillips, W.; Pollard, J.; Deshpande, A.; Whitmore, M.; Millard, F.; Subel, S.; van Stolk, C. Estimating the global economic benefits of physically active populations over 30 years (2020–2050). Br. J. Sports Med. 2020, 54, 1482–1487. [Google Scholar] [CrossRef] [PubMed]
  36. Langhammer, B.; Bergland, A.; Rydwik, E. The Importance of Physical Activity Exercise among Older People. BioMed Res. Int. 2018, 2018, 7856823. [Google Scholar] [CrossRef] [PubMed]
  37. Bueno, D.R.; Marucci, M.d.F.N.; Codogno, J.S.; Roediger, M.d.A. Os custos da inatividade física no mundo: Estudo de revisão. Cienc. Saude Coletiva 2016, 21, 1001–1010. [Google Scholar] [CrossRef] [Green Version]
  38. Kang, S.; Xiang, X. Physical activity and health services utilization and costs among U.S. adults. Prev. Med. 2017, 96, 101–105. [Google Scholar] [CrossRef]
  39. Wullems, J.A.; Verschueren, S.M.P.; Degens, H.; Morse, C.I.; Onambélé, G.L. A review of the assessment and prevalence of sedentarism in older adults, its physiology/health impact and non-exercise mobility counter-measures. Biogerontology 2016, 17, 547–565. [Google Scholar] [CrossRef] [Green Version]
  40. Cunningham, C.; O’ Sullivan, R.; Caserotti, P.; Tully, M.A. Consequences of physical inactivity in older adults: A systematic review of reviews and meta-analyses. Scand. J. Med. Sci. Sports 2020, 30, 816–827. [Google Scholar] [CrossRef]
  41. Dogra, S.; Ashe, M.C.; Biddle, S.J.H.; Brown, W.J.; Buman, M.P.; Chastin, S.; Gardiner, P.A.; Inoue, S.; Jefferis, B.J.; Oka, K.; et al. Sedentary time in older men and women: An international consensus statement and research priorities. Br. J. Sports Med. 2017, 51, 1526–1532. [Google Scholar] [CrossRef]
  42. Gebel, K.; Ding, D.; Chey, T.; Stamatakis, E.; Brown, W.J.; Bauman, A.E. Effect of moderate to vigorous physical activity on all-cause mortality in middle-aged and older Australians. JAMA Intern. Med. 2015, 175, 970–977. [Google Scholar] [CrossRef]
  43. Su, C.-L.; Wang, L.; Ho, C.-C.; Nfor, O.N.; Hsu, S.-Y.; Lee, C.-T.; Ko, P.-C.; Lin, Y.-T.; Liaw, Y.-P. Physical activity is associated with lower health care costs among Taiwanese individuals with diabetes mellitus. Medicine 2020, 99, e19613. [Google Scholar] [CrossRef]
  44. Towne, S.D.; Li, Y.; Lee, S.; Smith, M.L.; Han, G.; Quinn, C.; Du, Y.; Benden, M.; Ory, M.G. Physical activity and associated medical cost savings among at-risk older adults participating a community-based health & wellness program. PLoS ONE 2018, 13, e0198239. [Google Scholar] [CrossRef]
  45. Aragón-Vela, J.; Delgado-Floody, P.; Guzmán-Guzmán, I.P.; Salas-Sánchez, J.; Martínez-Redondo, M.; Lucena Zurita, M.; Herrador Sánchez, J.; Cardona Linares, A.J.; Consuegra González, P.J.; Santos E Campos, M.A.; et al. Effect of COVID-19 confinement on physical activity patterns in relation to sociodemographic parameters in Spanish population. J. Sports Med. Phys. Fit. 2021, 62, 830–837. [Google Scholar] [CrossRef] [PubMed]
  46. López-Sánchez, G.F.; López-Bueno, R.; Gil-Salmerón, A.; Zauder, R.; Skalska, M.; Jastrzębska, J.; Jastrzębski, Z.; Schuch, F.B.; Grabovac, I.; Tully, M.A.; et al. Comparison of physical activity levels in Spanish adults with chronic conditions before and during COVID-19 quarantine. Eur. J. Public Health 2021, 31, 161–166. [Google Scholar] [CrossRef]
  47. Ministerio de Sanidad. Consumo y Bienestar Social Cuestionario de Adultos. In Encuesta Nacional de Salud de España 2017; Gobierno de España: Madrid, Spain, 2019. [Google Scholar]
  48. Sanidad Consumo, M.; Social, B. Encuesta Nacional de Salud 2017 ENSE 2017 Metodología. Encuesta Nac. Salud 2017, 64, 1381–1395. [Google Scholar]
  49. Craig, C.L.; Marshall, A.L.; SjöStröM, M.; Bauman, A.E.; Booth, M.L.; Ainsworth, B.E.; Pratt, M.; Ekelund, U.; Yngve, A.; Sallis, J.F.; et al. International Physical Activity Questionnaire: 12-Country Reliability and Validity. Med. Sci. Sports Exerc. 2003, 35, 1381–1395. [Google Scholar] [CrossRef] [Green Version]
  50. Denche-Zamorano, Á.; Franco-García, J.M.; Carlos-Vivas, J.; Mendoza-Muñoz, M.; Pereira-Payo, D.; Pastor-Cisneros, R.; Merellano-Navarro, E.; Adsuar, J.C. Increased Risks of Mental Disorders: Youth with Inactive Physical Activity. Healthcare 2022, 10, 237. [Google Scholar] [CrossRef]
  51. European Parliament and of the Council Regulation (EU) 2016/679 of the of 27 April 2016 on the Protection of Natural Persons with Regard to the Processing of Personal Data and on the Free Movement of such Data, and Repealing Directive 95/46/EC (General Data Protection Regulation); Official Journal of the European Union: Luxembourg, 2016.
  52. Ministerio de Sanidad. Consumo y Bienestar Social, Gobierno de España Encuesta Nacional de Salud; Ministerio de Sanidad: Madrid, Spain, 2017. [Google Scholar]
  53. Luben, R.; Hayat, S.; Wareham, N.; Pharoah, P.; Khaw, K.-T. Usual physical activity and subsequent hospital usage over 20 years in a general population: The EPIC-Norfolk cohort. BMC Geriatr. 2020, 20, 165. [Google Scholar] [CrossRef]
  54. Bertakis, K.D.; Azari, R.; Helms, L.J.; Callahan, E.J.; Robbins, J.A. Gender differences in the utilization of health care services. J. Fam. Pract. 2000, 49, 147–152. [Google Scholar]
  55. Hunt, K.; Adamson, J.; Hewitt, C.; Nazareth, I. Do women consult more than men? A review of gender and consultation for back pain and headache. J. Health Serv. Res. Policy 2011, 16, 108–117. [Google Scholar] [CrossRef] [Green Version]
  56. Redondo-Sendino, Á.; Guallar-Castillón, P.; Banegas, J.R.; Rodríguez-Artalejo, F. Gender differences in the utilization of health-care services among the older adult population of Spain. BMC Public Health 2006, 6, 155. [Google Scholar] [CrossRef] [Green Version]
  57. Parra-Rizo, M.A. Diferencias de género en la percepción de salud en personas mayores de 60 años físicamente activas = Gender differences in the perception of health in physically active people over 60 years of age. Rev. Española Comun. Salud 2017, 8, 219–227. [Google Scholar] [CrossRef]
  58. Gomes, R.; Do Nascimento, E.F.; De Araújo, F.C. Por que os homens buscam menos os serviços de saúde do que as mulheres? As explicações de homens com baixa escolaridade e homens com ensino superior. Cad. Saude Publica 2007, 23, 565–574. [Google Scholar] [CrossRef] [PubMed] [Green Version]
  59. Deeks, A.; Lombard, C.; Michelmore, J.; Teede, H. The effects of gender and age on health related behaviors. BMC Public Health 2009, 9, 213. [Google Scholar] [CrossRef] [PubMed] [Green Version]
  60. Templeton, K.J. Sex and Gender Issues in Pain Management. J. Bone Jt. Surg. 2020, 102, 32–35. [Google Scholar] [CrossRef]
  61. Bacigalupe, A.; Cabezas, A.; Bueno, M.B.; Martín, U. Gender as a determinant of mental health and its medicalization. Gac. Sanit. 2020, 34, 61–67. [Google Scholar] [CrossRef] [PubMed]
  62. Caner, A.; Cilasun, S.M. Health Care Services and the Elderly: Utilization and Satisfaction in the Aftermath of the Turkish Health Transformation Program. Gerontol. Geriatr. Med. 2019, 5, 233372141882286. [Google Scholar] [CrossRef] [PubMed]
  63. Nie, J.X.; Wang, L.; Tracy, C.S.; Moineddin, R.; Upshur, R.E. Health care service utilization among the elderly: Findings from the Study to Understand the Chronic Condition Experience of the Elderly and the Disabled (SUCCEED project). J. Eval. Clin. Pract. 2008, 14, 1044–1049. [Google Scholar] [CrossRef]
  64. Kalseth, J.; Halvorsen, T. Health and care service utilisation and cost over the life-span: A descriptive analysis of population data. BMC Health Serv. Res. 2020, 20, 435. [Google Scholar] [CrossRef]
  65. Amini, H.; Habibi, S.; Islamoglu, A.H.; Isanejad, E.; Uz, C.; Daniyari, H. COVID-19 pandemic-induced physical inactivity: The necessity of updating the Global Action Plan on Physical Activity 2018-2030. Environ. Health Prev. Med. 2021, 26, 32. [Google Scholar] [CrossRef]
Figure 1. Chart outlining the study sample’s eligibility criteria.
Ijerph 19 08867 g001
Table 1. Sociodemographic characteristics of the sample.
Age (Years)Men = 8238Women = 8961Total = 17,199p
Median (IQR)47 (20)47 (21)47 (21)0.467
Mean (SD)46.7 (13.2)46.9 (13.3)46.8 (13.2)-
Age Group (years)Men n (%)Women n (%)Total n (%)p *
18–341573 (19.1) a1743 (19.5) a3316 (19.3)0.227
35–493007 (36.5) a3188 (35.6) a6195 (36.0)
50–642874 (34.9) a3103 (34.6) a5977 (34.8)
65–69784 (9.5) a927 (10.3) a1711 (9.9)
HospitalizationMen = 8238 n (%)Women = 8961 n (%)Total = 17,199 n (%)p *
Yes601 (7.3) a615 (6.9) a1216 (7.1)0.269
No7637 (92.7) a8346 (93.1) a15,983 (92.9)
Use of Emergency ServicesMen = 8238 n (%)Women = 8961 n (%)Total = 17,199 n (%)p *
Yes2181 (26.5) a2784 (31.1) b4965 (28.9)<0.001
No6057 (73.5) a6177 (68.9) b12,234 (71.1)
Visits to Emergency ServicesMen = 8234Women = 8953Total = 17,187p
Median (IQR)0 (1)0 (1)0 (1)<0.001
Mean (SD)0.42 (1.02)0.60 (1.44)0.51 (1.27)-
CI (95%)0.40–0.440.57–0.630.49–0.53-
PALMen = 8199 n (%)Women = 8942 n (%)Total = 17,141 n (%)p *
Inactive (PAI = 0)1156 (14.1)1326 (14.8)2482 (14.5)<0.001
Walkers (PAI = 0)3335 (40.7)4566 (51.1)7901 (46.1)
Low (PAI = 1–15)1077 (13.1)1262 (14.1)2339 (13.6)
Medium PAI = 16–30)1273 (15.5)1076 (12.0)2349 (13.7)
High (PAI = 31–45)877 (10.7)476 (5.3)1353 (7.9)
Very High (PAI > 45)481 (5.9)236 (2.6)717 (4.2)
IQR: interquartile range; SD: standard deviation n: participants; %: percentage; PAL: Physical Activity Level, PAI: Physical Activity Index; only considers vigorous and moderate physical activity. Scores between 0 and 67.5; Inactive: PAI = 0; reports not walking at least one day a week for more than 10 min at a time; Walkers PAI = 0; reports walking at least one day a week for more than 10 min at a time; Low: PAI = 1–15; Medium: PAI = 16–30; High: PAI = 31–45; Very high: PAI > 45; p: p-value from Mann–Whitney U test; p *: p-value from Chi-square test; a, b: Pairwise z-test for independent proportions, each subscript represents a subset, whose column proportions differ significantly at the 0.05 level; CI: Confidence interval at 0.05 level of significance.
Table 2. Age group relations and the hospitalisation prevalence in the general Spanish population aged 18–69 years, compared by sex, according to the ENSE 2017.
Men (n = 8238)Women (n = 8961)Total (n = 17,199)
Age Group (Years)YesNopYesNopYesNop
18–34
(n = 3316)
64 (4.1) a1509 (95.9) b<0.00187 (5.0) a1656 (95.0) b<0.001151 (4.6) a3165 (95.4) b<0.001
35–49
(n = 6195)
170 (5.7) a2837 (94.3) b176 (5.5) a3012 (94.5) b346 (5.6) a5849 (94.4) b
50–64
(n = 5977)
261 (9.1) a2613 (90.9) b249 (8.0) a2854 (92.0) b510 (8.5) a5467 (91.5) b
65–69
(n = 1711)
106 (13.5) a678 (86.5) b103 (11.1) a824 (88.9) b209 (12.2) a1502 (87.8) b
Total
(n = 17,199)
601 (7.3)7637 (92.7) 615 (6.9)8346 (93.1) 1216 (7.1)15,983 (92.9)
Values presented in absolute and relative frequencies; n: number of participants; Yes: hospitalised at least once in the last 12 months; No: not hospitalised in the previous 12 months; p: p-value from chi-square test; a, b: Pairwise z-test for independent proportions. Each subscript corresponds to a subset whose column proportions do not differ from each other at the 0.05 level.
Table 3. Associations between the hospitalisation prevalence and physical activity level in the general Spanish population aged 18–69 years compared by sex, according to the ENSE 2017.
Men (n = 8199)Women (n = 8942)Total (n = 17,141)
PALYesNopYesNopYesNop
Inactive
n = 2482
137 (11.9) a1019 (88.1) b0.001150 (11.3) a1176 (88.7) b<0.001287 (11.6) a2195 (88.4) b<0.001
Walkers
n = 7901
281 (8.4) a3054 (91.6) b320 (7.0) a4246 (93.0) a601 (7.6) a7300 (92.4) b
Low
n = 2339
58 (5.4) a1019 (94.6) b67 (5.3) a1195 (94.7) b125 (5.3) a2214 (94.7) b
Medium
n = 2349
73 (5.7) a1200 (94.3) b50 (4.6) a1026 (95.4) b123 (5.2) a2226 (94.8) b
High
n = 1353
32 (3.6) a845 (96.4) b19 (4.0) a457 (96.0) b51 (3.8) a1302 (96.2) b
Very High
n = 717
18 (3.7) a463 (96.3) b9 (3.8) a227 (96.2) b27 (3.8) a690 (96.2) b
Total
n = 17,141
599 (7.3)7600 (92.7) 615 (6.9)8327 (93.1) 1214 (7.1)15,927 (92.9)
Values presented in absolute and relative frequencies; n: number of participants; PAL (Physical Activity Level) PAI: Physical Activity Index; only considers vigorous and moderate physical activity. Scores between 0 and 67.5; Inactive: PAI = 0; reports not walking at least one day a week for more than 10 min at a time; Walkers PAI = 0; reports walking at least one day a week for more than 10 min at a time; Low: PAI = 1–15; Medium: PAI = 16–30; High: PAI = 31–45; Very high: PAI > 45; Yes: hospitalised at least once in the last 12 months; No: not hospitalised in the last 12 months; p: p-value from chi-square test; a, b: Pairwise z-test for independent proportions. Each subscript corresponds to a subset whose column proportions do not differ from each other at the 0.05 level.
Table 4. Associations between the hospitalisation prevalence and physical activity level in the general Spanish population aged 18–69 years compared by age, according to the ENSE 2017.
18–34 Years (n = 3297)35–49 Years (n = 6177)50–64 Years (n = 5956)65–69 Years (n = 1711)Total (n = 17,141)
PALYes
n (%)
No
n (%)
pYes
n (%)
No
n (%)
pYes
n (%)
No
n (%)
pYes
n (%)
No
n (%)
pYes
n (%)
No
n (%)
p
Inactive
n = 2485
33 (7.8) a388 (92.2) b0.00279 (8.4) a856 (91.6) b<0.001127 (14.5) a751 (85.5) b<0.00148 (19.4) a200 (80.6) b0.002287 (11.6) a2195 (88.4) b<0.001
Walkers
n = 7910
61 (5.0) a1158 (95.0) a158 (6.2) a2407 (93.8) a263 (8.4) a2861 (91.6) a119 (12.0) a874 (88.0) a601 (7.6) a7300 (92.4) b
Low
n = 2342
22 (4.6) a456 (95.4) a38 (3.9) a932 (96.1) b52 (7.5) a644 (92.5) a13 (6.7) a182 (93.3) b125 (5.3) a2214 (94.7) b
Medium
n = 2353
18 (3.4) a512 (96.6) a43 (4.9) a838 (95.1) a39 (5.2) a704 (94.8) b23 (11.8) a172 (88.2) a123 (5.2) a2226 (94.8) b
High
n = 1355
14 (3.2) a427 (96.8) a21 (3.8) a533 (96.2) a12 (3.9) a294 (96.1) b4 (7.7) a48 (92.3) a51 (3.8) a1302 (96.2) b
Very High
n = 734
3 (1.4) a205 (98.6) b7 (2.6) a265 (97.4) b15 (7.2) a194 (92.8) a2 (7.1) a26 (92.9) a27 (3.8) a690 (96.2) b
Total
n = 17,141
151 (4.6)3146 (95.4) 346 (5.6)5831 (94.4) 508 (8.5)5448 (91.5) 209 (12.2)1502 (87.8) 1214 (7.1)15,927 (92.9)
Values presented in absolute and relative frequencies; n: number of participants; %: percentage; PAL (Physical Activity Level); PAI: Physical Activity Index; only consider vigorous and moderate physical activity. Scores between 0 and 67.5; Inactive: PAI = 0; reports not walking at least one day a week for more than 10 min at a time; Walkers PAI = 0; reports walking at least one day a week for more than 10 min at a time; Low: PAI = 1–15; Medium: PAI = 16–30; High: PAI = 31–45; Very high: PAI > 45; Yes: hospitalised at least once in the last 12 months; No: not hospitalised in the last 12 months; p: p-value from chi-square test; a, b: Pairwise z-test for independent proportions. Each subscript corresponds to a subset whose column proportions do not differ from each other at the 0.05 level.
Table 5. Associations between the use of emergency services in the general Spanish population aged 18–69 years, compared by age, according to the ENSE 2017.
Men (n = 8238)Women (n = 8961)Total (n = 17,199)
Age GroupsYes
n (%)
No
n (%)
pYes
n (%)
No
n (%)
pYes
n (%)
No
n (%)
p
18–34 years (n = 3316)486 (30.9) a1087 (69.1) b<0.001673 (38.6) a1070 (61.4) b<0.0011159 (35.0) a2157 (65.0) b<0.001
35–49 years (n = 6195)813 (27.0) a2194 (73.0) a977 (30.6) a2211 (69.4) a1790 (28.9) a4405 (71.1) a
50–64 years (n = 5977)688 (23.9) a2186 (76.1) b865 (27.9) a2238 (72.1) b1553 (26.0) a4424 (74.0) b
65–69 years (n = 1711)194 (24.7) a590 (75.3) a269 (29.0) a658 (71.0) a463 (27.1) a1248 (72.9) a
Total (n = 17,199)2181 (26.5)6057 (73.5) 2784 (31.1)6177 (68.9) 4965 (28.8)12,234 (71.2)
Values presented in absolute and relative frequencies; n: number of participants; %: Percentage; Yes: used emergency services at least once in the last 12 months; No: did not use emergency services at least once in the last 12 months; p: p-value from chi-square test; a, b: Pairwise z-test for independent proportions. Each subscript corresponds to a subset whose column proportions do not differ from each other at the 0.05 level.
Table 6. Associations between the use of emergency services and physical activity level in the general Spanish population aged 18–69 years compared by sex, according to the ENSE 2017.
Men (n = 8199)Women (n = 8942)Total (n = 17,141)
PALYes
n (%)
No
n (%)
pYes
n (%)
No
n (%)
pYes
n (%)
No
n (%)
p
Inactive
n = 2482
407 (35.2) a749 (64.8) b0.002550 (41.5) a776 (58.5) b<0.001957 (38.6) a1525 (61.4) b<0.001
Walkers
n = 7901
883 (26.5) a2452 (73.5) a1409 (30.9) a3157 (69.1) a2292 (29.0) a5609 (71.0) a
Low
n = 2339
244 (22.7) a833 (77.3) b353 (28.0) a909 (72.0) b597 (25.5) a1742 (74.5) b
Medium
n = 2349
315 (24.7) a958 (75.3) a285 (26.5) a791 (73.5) b600 (25.5) a1749 (74.5) b
High
n = 1353
227 (25.9) a650 (74.1) a127 (26.7) a349 (73.3) b354 (26.2) a999 (73.8) b
Very High
n = 717
99 (20.6) a382 (79.4) b60 (25.4) a176 (74.6) a159 (22.2) a558 (77.8) b
Total
n = 17,141
2175 (26.5)6024 (73.5) 2784 (31.1)6158 (68.9) 4959 (28.9)12,182 (71.1)
Values presented in absolute and relative frequencies; n: number of participants; %: Percentage; PAL: Physical Activity Level); PAI: Physical Activity Index; only considers vigorous and moderate physical activity. Scores between 0 and 67.5; Inactive: PAI = 0; reports not walking at least one day a week for more than 10 min at a time; Walkers PAI = 0; reports walking at least one day a week for more than 10 min at a time; Low: PAI = 1–15; Medium: PAI = 16–30; High: PAI = 31–45; Very high: PAI > 45; Yes: used emergency services at least once in the last 12 months; No: did not use emergency services at least once in the last 12 months; p: p-value from chi-square test; a, b: Pairwise z-test for independent proportions. Each subscript corresponds to a subset whose column proportions do not differ from each other at the 0.05 level.
Table 7. Associations between the use of emergency services and physical activity level in the general Spanish population aged 18–69 years compared by age, according to the ENSE 2017.
18–34 Years (n = 3297)35–49 Years (n = 6177)50–64 Years (n = 5956)65–69 Years (n = 1711)Total (n = 17,141)
PALYes
n (%)
No
n (%)
pYes
n (%)
No
n (%)
pYes
n (%)
No
n (%)
pYes
n (%)
No
n (%)
pYes
n (%)
No
n (%)
p
Inactive
n = 2482
178 (42.3) a243 (57.7) b0.001343 (36.7) a592 (63.3) b<0.001334 (38.0) a544 (62.0) b<0.001102 (41.1) a146 (58.9) b0.001957 (38.6) a1525 (61.4) b<0.001
Walkers
n = 7901
454 (37.2) a765 (62.8) b758 (29.6) a1807 (70.4) a809 (25.9) a2315 (74.1) a271 (27.3) a722 (72.7) a2292 (29.0) a5609 (71.0) a
Low
n = 2339
149 (31.2) a329 (68.8) a265 (27.3) a705 (72.7) b139 (20.0) a557 (80.0) b44 (22.6) a151 (77.4) a597 (25.5) a1742 (74.5) b
Medium
n = 2349
178 (33.6) a352 (66.4) a229 (26.0) a652 (74.0) b161 (21.7) a582 (78.3) b32 (16.4) a163 (83.6) b600 (25.5) a1749 (74.5) b
High
n = 1353
144 (32.7) a297 (67.3) a134 (24.2) a420 (75.8) b68 (22.2) a238 (77.8) a8 (15.4) a44 (84.6) a354 (26.2) a999 (73.8) b
Very High
n = 717
54 (26.0) a154 (74.0) b60 (22.1) a212 (77.9) b39 (18.7) a170 (81.3) b6 (21.4) a22 (78.6) a159 (22.2) a558 (74.8) b
Total
n = 17,141
1157 (35.1)2140 (64.9) 1789 (29.0)4388 (71.0) 1550 (26.0)4406 (74.0) 463 (27.1)1248 (72.9) 4959 (28.9)12,182 (71.1)
Values presented in absolute and relative frequencies; n: number of participants; % Percentage; PAL (Physical Activity Level); PAI: Physical Activity Index; only considers vigorous and moderate physical activity. Scores between 0 and 67.5; Inactive: PAI = 0; reports not walking at least one day a week for more than 10 min at a time; Walkers PAI = 0; reports walking at least one day a week for more than 10 min at a time; Low: PAI = 1–15; Medium: PAI = 16–30; High: PAI = 31–45; Very high: PAI > 45; Yes: used emergency services at least once in the last 12 months; No: did not use emergency services at least once in the last 12 months; p: p-value from chi-square test; a, b: Pairwise z-test for independent proportions. Each subscript corresponds to a subset whose column proportions do not differ from each other at the 0.05 level.
Table 8. Associations between the number of visits to emergency services and physical activity level in the general Spanish population aged 18–69 years compared by sex, according to the ENSE 2017.
Men
PALnMean(SD)CI (95%)Med(IQR)pp *
Inactive11560.66(1.39)0.58–0.740(1)<0.001a
Walkers33330.43(1.06)0.39–0.460(1)b
Low10760.34(0.91)0.29–0.400(0)c
Medium12730.35(0.83)0.31–0.400(0)bc
High8770.37(0.79)0.32–0.420(1)bc
Very High4810.28(0.65)0.23–0.340(0)c
Women
PALnMean(SD)CI (95%)Med(IQR)pp *
Inactive13220.99(2.22)0.87–1.110(1)<0.001a
Walkers45620.58(1.34)0.54–0.610(1)b
Low12620.46(1.08)0.40–0.520(1)c
Medium10760.44(1.09)0.37–0.500(1)c
High4760.47(1.04)0.37–0.560(1)b
Very High2360.51(1.30)0.35–0.680(1)b
Total
PALnMean(SD)CI (95%)Med(IQR)pp *
Inactive24780.84(1.89)0.76–0.910(1)<0.001a
Walkers78950.51(1.23)0.49–0.540(1)b
Low23380.41(1.00)0.37–0.450(1)c
Medium23490.39(0.96)0.35–0.430(1)c
High13530.41(0.89)0.36–0.450(1)c
Very High7170.36(0.92)0.29–0.430(0)c
PAL: Physical Activity Level; PAI: Physical Activity Index; only considers vigorous and moderate physical activity. Scores between 0 and 67.5; Inactive: PAI = 0; reports not walking at least one day a week for more than 10 min at a time; Walkers PAI = 0; reports walking at least one day a week for more than 10 min at a time; Low: PAI = 1–15; Medium: PAI = 16–30; High: PAI = 31–45; Very high: PAI > 45; n: participants; SD: standard deviation; CI: confidence interval; Med: Median; IQR: interquartile range; p: value from Kruskal-Wallis test; p *: p-value from Mann–Whitney U test; a–c: different subscripts denote significant intergroup differences at the 0.05 level using the Mann–Whitney U-test.
Table 9. Logarithmic binary regression model for the hospitalisation risk factor.
BSEWaldDfSigExp(B)95% CI for EXP(B)
LowerUpper
Years0.0310.003154.8161<0.0011.0321.0271.037
Inactive 56.1345<0.001
Walkers−0.3500.07919.4731<0.0010.7050.6030.823
Low−0.5610.11523.6981<0.0010.5710.4550.715
Medium−0.5930.11626.1911<0.0010.5530.4400.694
High−0.8480.16127.7991<0.0010.4280.3130.587
Very High−0.8260.21115.2941<0.0010.4380.2890.662
Sex−0.2030.06210.5261<0.0010.8170.7230.923
Urgencies−1.7040.064704.8941<0.0010.1820.1600.206
Constant−2.6680.146333.7641<0.0010.069
B: Understandarized beta; SE: Standard error of the regression; Wald: Wald Chi-Squared Test; Df: Degrees of freedom; Sig: Statistical significance; Exp: Exponential regression; CI: Confidence Interval. Inactive: PAI = 0; reports not walking at least one day a week for more than 10 min at a time; Walkers PAI = 0; reports walking at least one day a week for more than 10 min at a time; Low: PAI = 1–15; Medium: PAI = 16–30; High: PAI = 31–45; Very high: Sex: men or women; PAI > 45; Yes: used emergency services at least once in the last 12 months. Yes: used emergency services at least once in the last 12 months; No: did not use emergency services at least once in the last 12 months.
Publisher’s Note: MDPI stays neutral with regard to jurisdictional claims in published maps and institutional affiliations.

