
Indoor Air Quality in Tujia Dwellings in Hunan, China: Field Tests, Numerical Simulations, and Mitigation Strategies


Abstract
:1. Introduction
2. Methodology
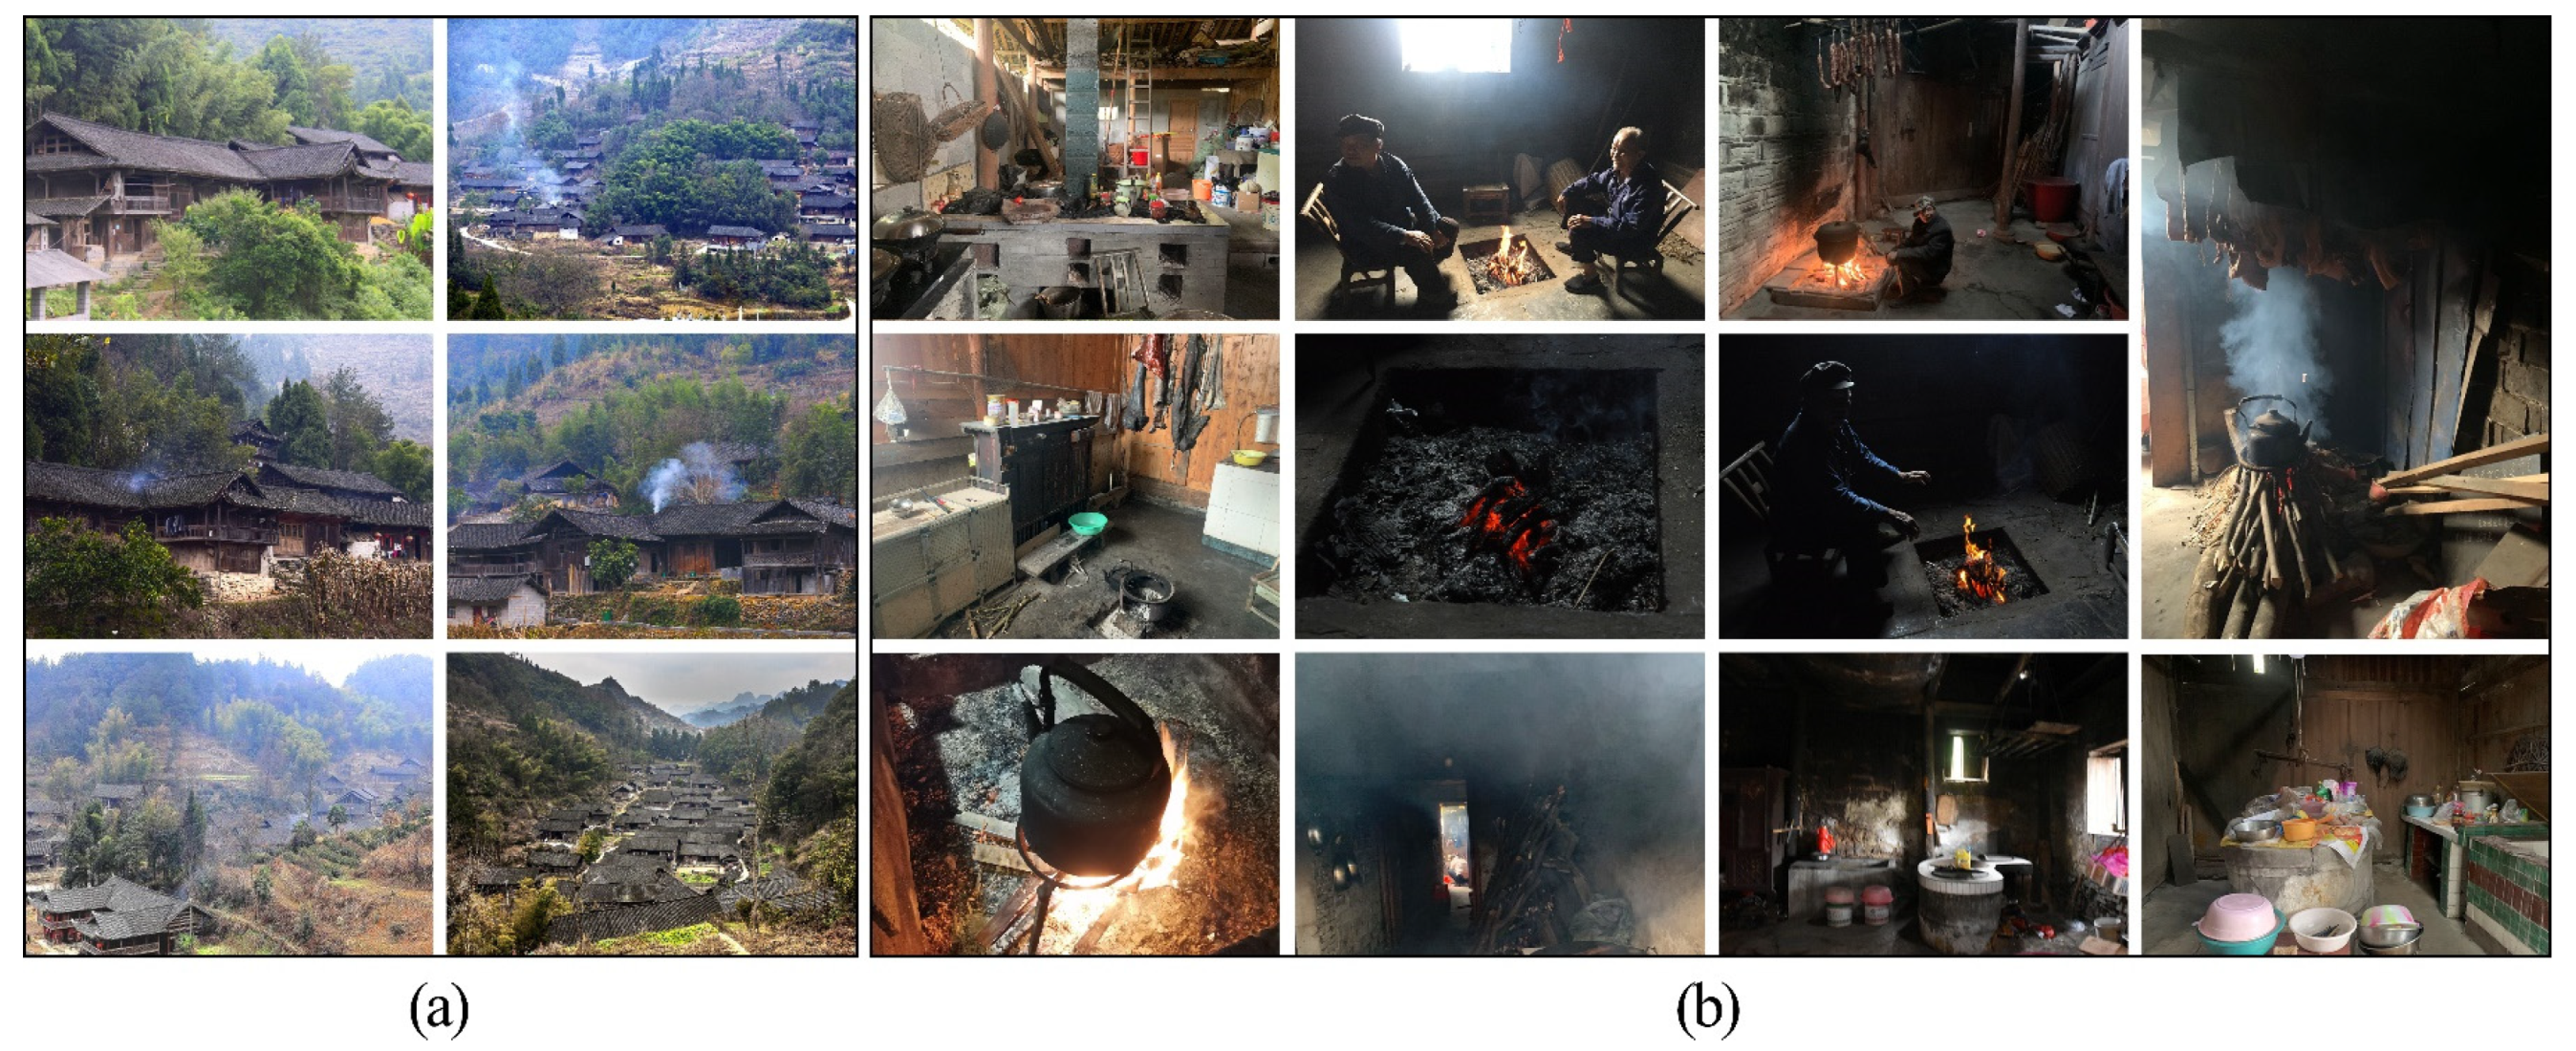
2.1. Sampling Site
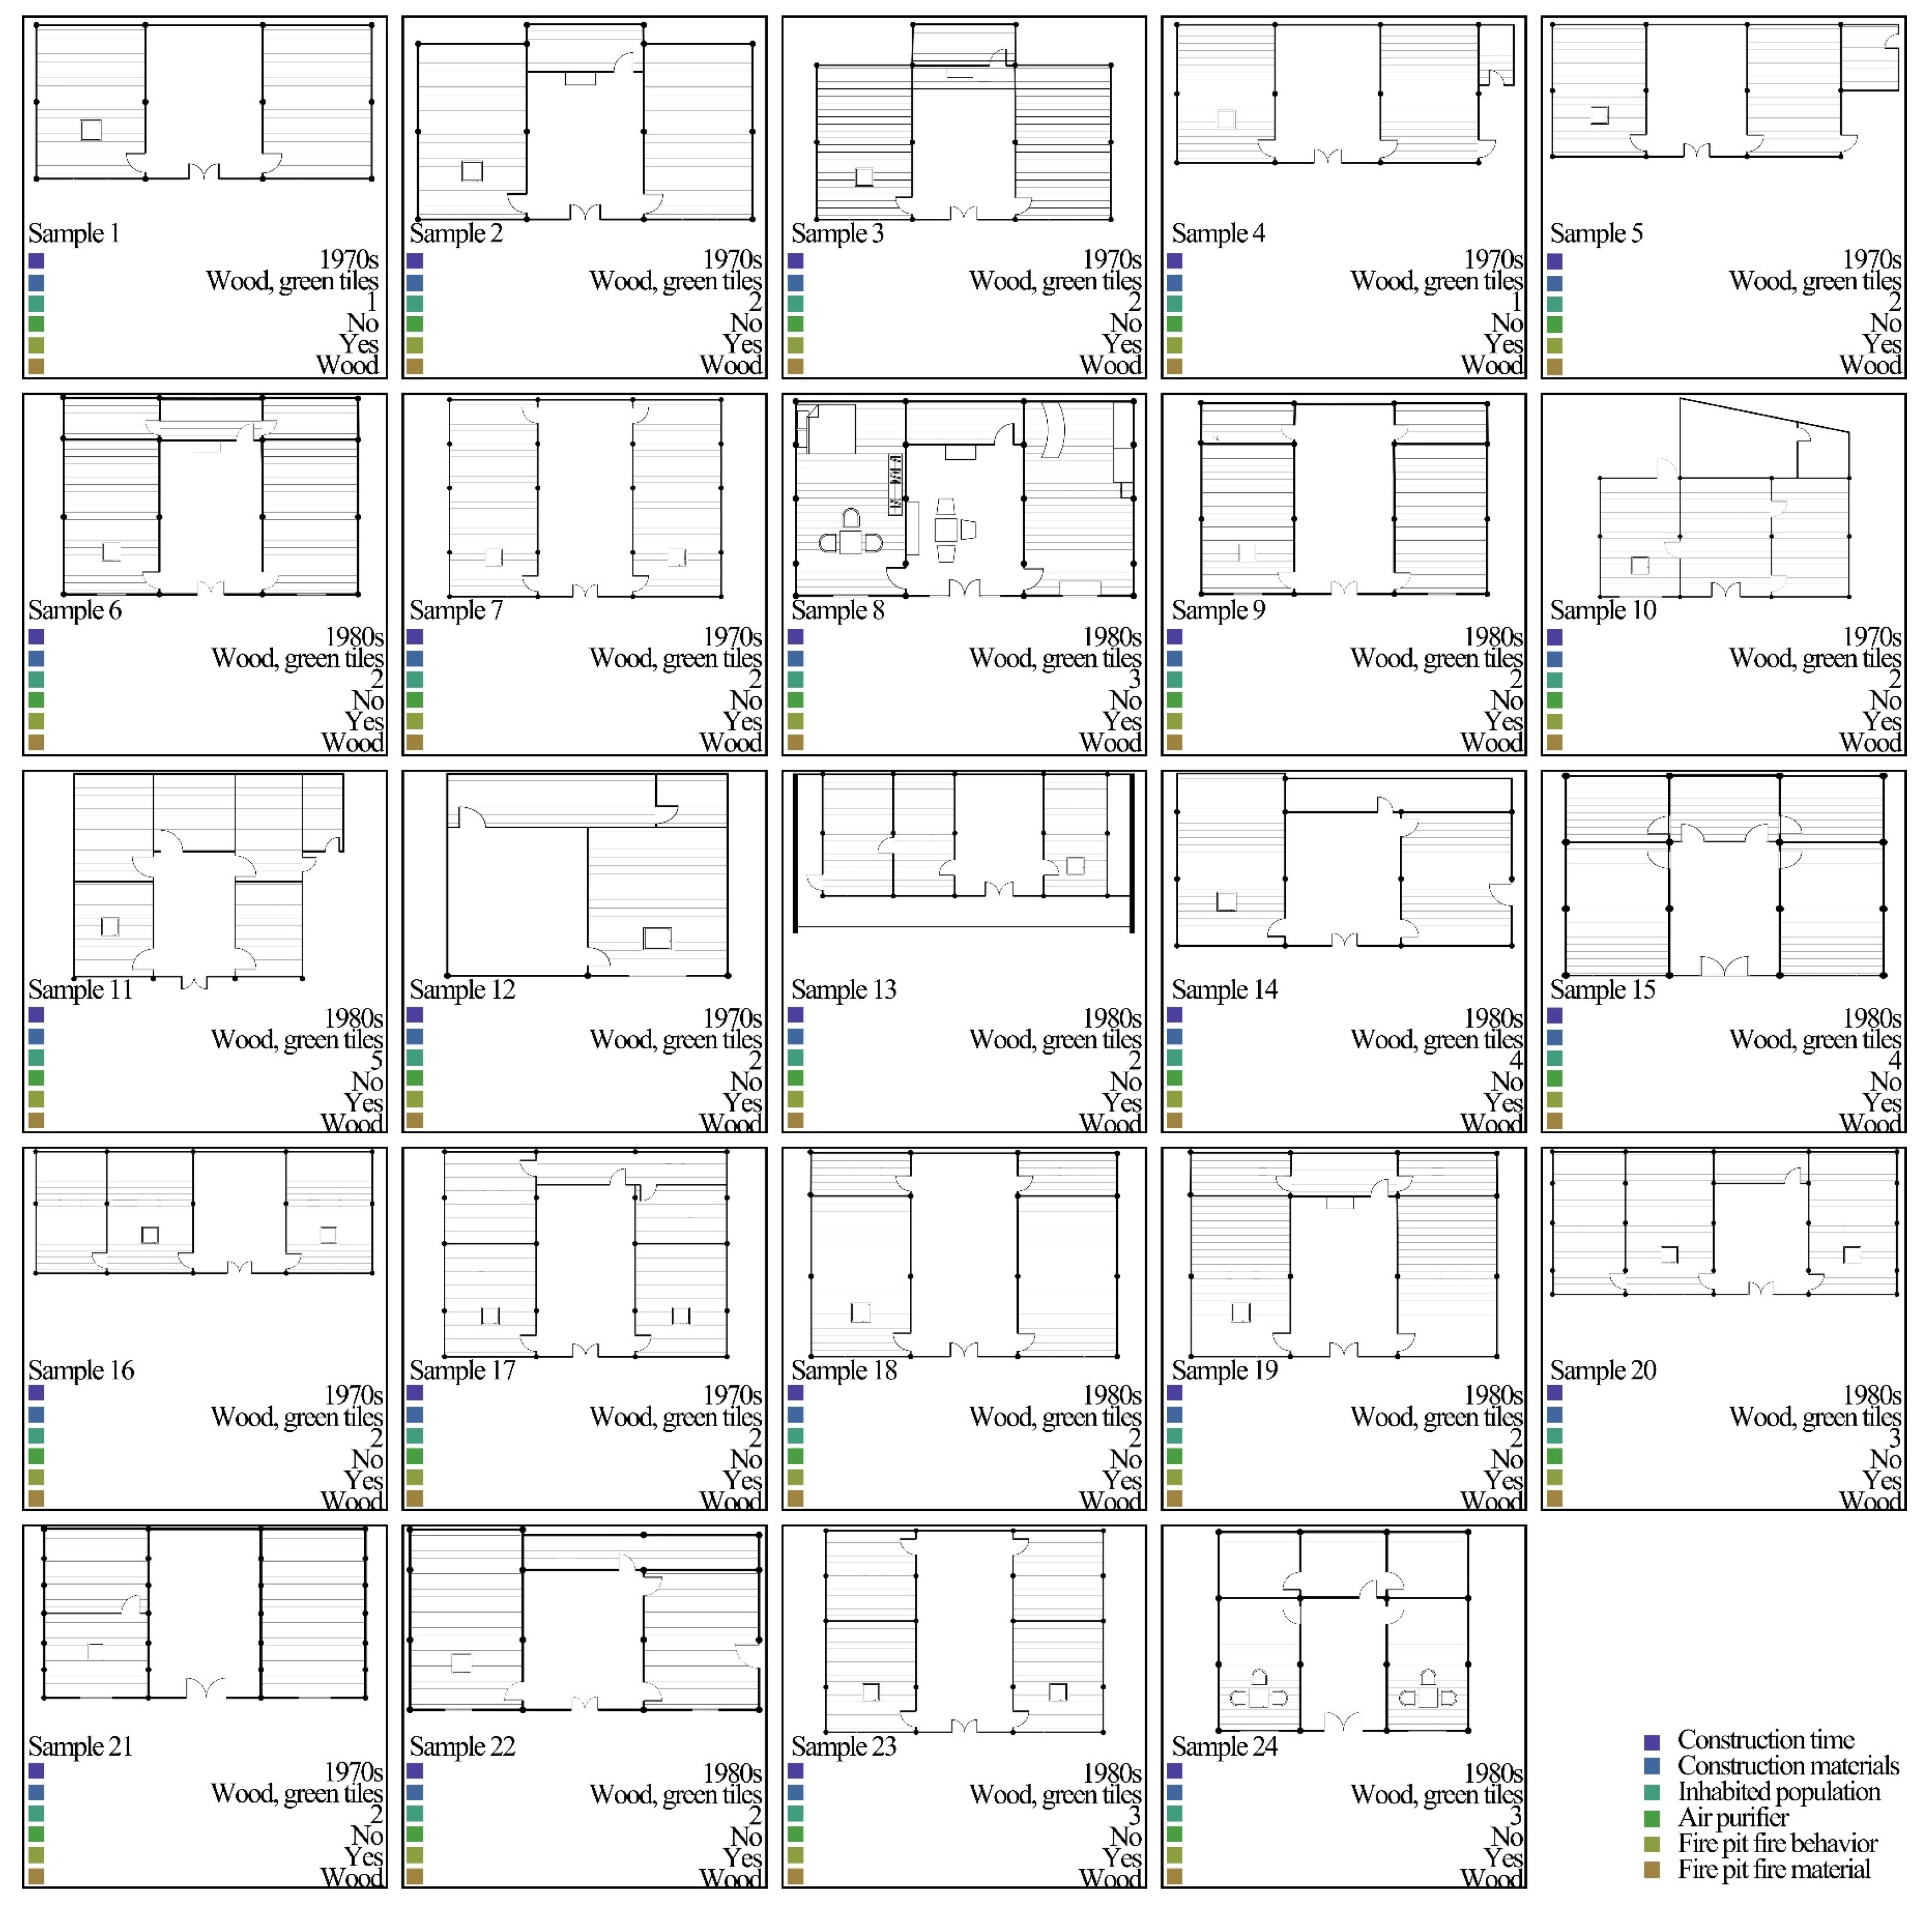
2.2. Questionnaire Survey
2.3. Field Measurements
2.4. Data Analysis
2.5. Indoor-Pollutant-Spreading Software Simulations
2.5.1. Simulation Methods
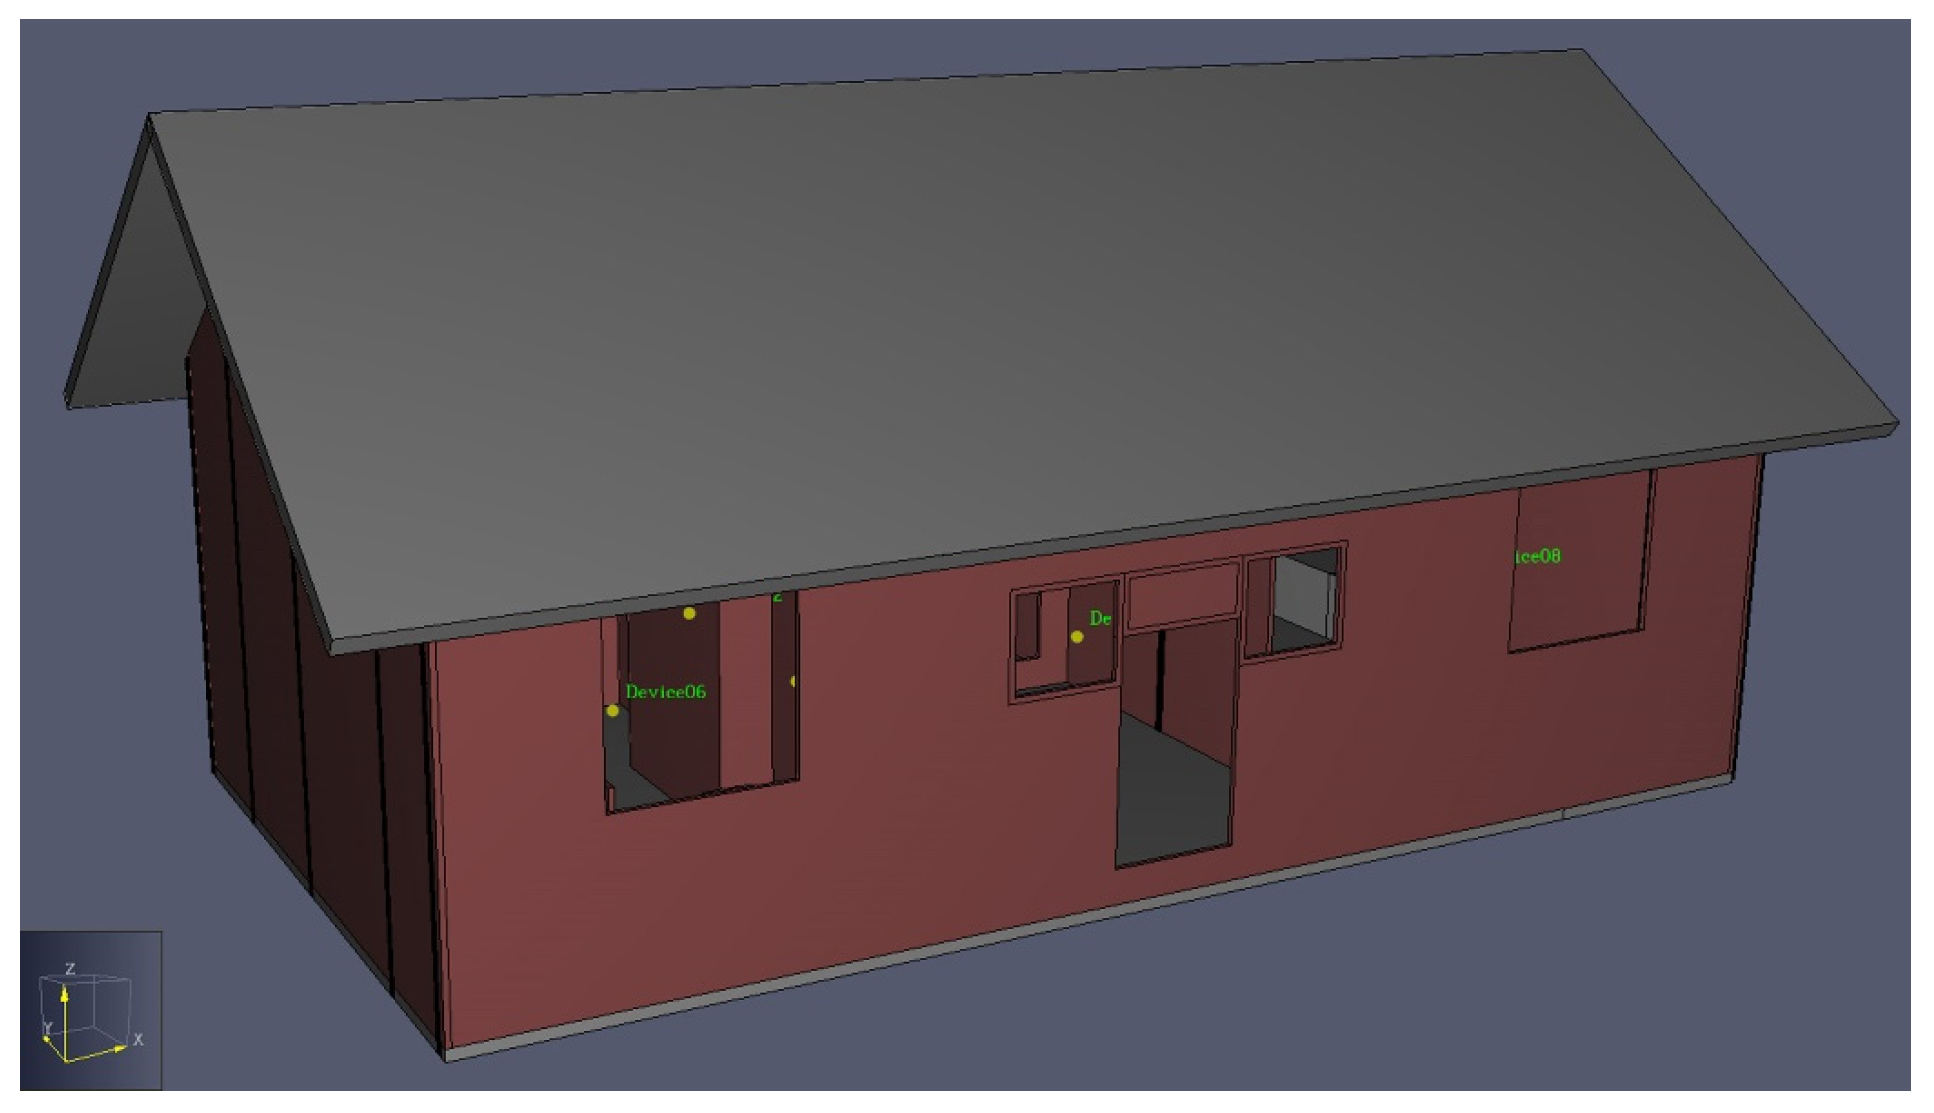
2.5.2. Model Building and Parameter Selection
Simulation Model
Parameter Setting
2.6. Pollutant Control Strategies
2.6.1. Passive Smoke Collector
2.6.2. Window Size
2.6.3. Windowsill Height
3. Results
3.1. Questionnaire Survey Result
3.2. Field Measurements Result
3.2.1. HCHO
3.2.2. CO2
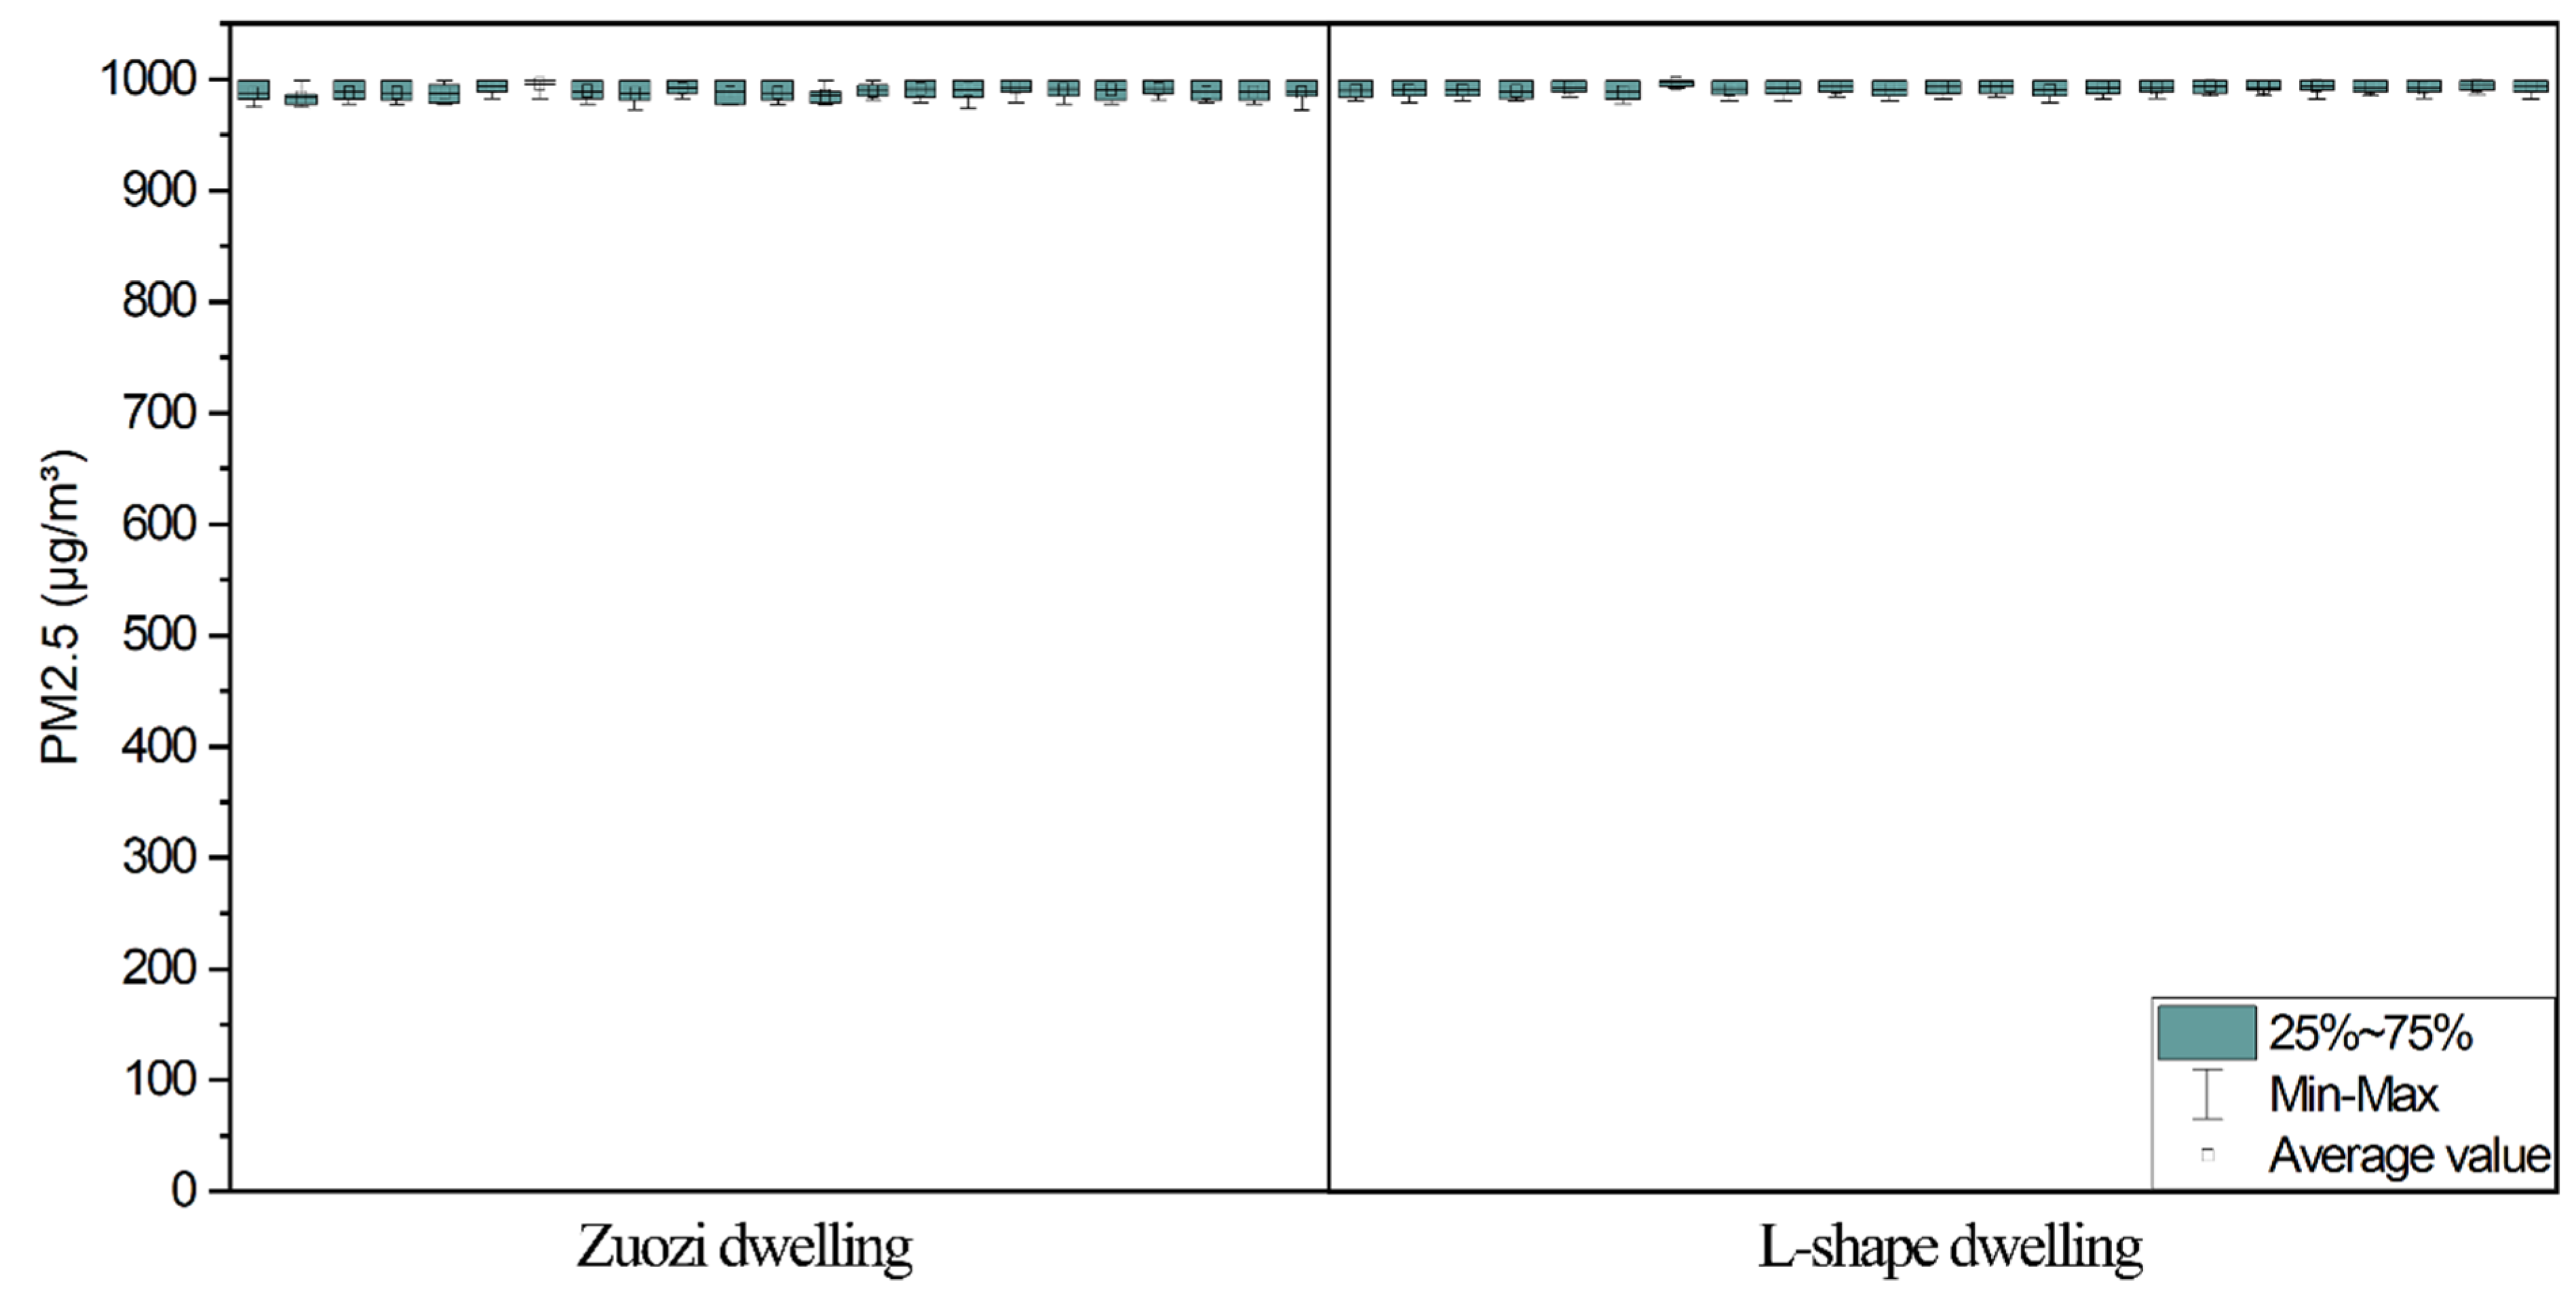
3.2.3. PM2.5
3.2.4. PM10
3.3. Software Simulation Results
4. Pollutant Control Strategies
4.1. Passive Smoke Collector
4.2. Window Size
4.3. Windowsill Height
5. Discussion
6. Conclusions
- The questionnaire research results revealed that 34.17% of people participating in the research were over 60 years old, and the indoor air quality of senior citizens’ dwellings should be investigated. Solid fuels are the main source of energy for cooking and heating and are as the source of indoor pollutants in Hunan Tujia dwellings. The percentage of people opening windows all day is 74.28%, whereas more than 80% of people never use APs. Nearly 55.1% of people stay indoors for 8–16 h daily. Firepits and kitchens are rooms with the worst indoor-air-quality-assessment environment. Indoor pollutants in Hunan Tujia dwellings should be controlled in order to mitigate their effect on elderly people.
- The values of the corner house, main bedroom, hall, and second bedroom of the L-shaped dwelling were 3, 3, 3, and 3 for CO2, 2, 2, 2, and 1 for PM2.5 and 2, 2, 3, and 1 for PM10, respectively. The CO2 concentrations in the fireplace room, bedroom, hall, and kitchen of the Zuozi dwelling were 2, 2, 3, and 3, respectively; the corrected PM2.5 concentrations were 2, 2, 2, and 1, respectively; and the corrected PM10 concentrations were 2, 2, 2, and 1, respectively. The overall indoor air quality of the western Hunan Tujia dwellings was average. In newly renovated dwellings, more attention should be paid to indoor HCHO concentrations to avoid serious health threats.
- The simulation results indicated that the area above the firepit was the most dominant smoke distribution area, which is consistent with the monitoring results. We recommend the use of passive smoke collectors and adjustment of the window size and windowsill height to reduce pollutant concentrations. The simulation results of indoor pollutants with passive smoke collectors showed that the mean CO2 concentrations in the retrofitted bedroom, firepit, parlor, and kitchen reduced by 43.96%, 43.52%, 83%, and 118.12%, respectively, compared with that in the conventional rooms. The simulation results of firepit pollutants with different window sizes showed that the larger the window size was, the lesser the indoor air pollutants caused by firepit fire behavior. The window size of 900 mm × 900 mm should be appropriately increased to 1200 mm × 1200 mm, which does not damage the local traditional dwelling style and reduces the risk of indoor air pollution caused by firepits. The secondary windows can be opened to reduce the concentration of indoor pollutants during the fire. In addition, the windowsill height can be adjusted to improve indoor air quality.
Author Contributions
Funding
Institutional Review Board Statement
Informed Consent Statement
Data Availability Statement
Acknowledgments
Conflicts of Interest
Appendix A


References
- European Commission. Indoor Air Pollution: New EU Research Reveals Higher Risks than Previously Thought; Joint Research Center: Brussels, Belgium, 2003. [Google Scholar]
- Wichmann, J.; Lind, T.; Nilsson, M.-M.; Bellander, T. PM2.5, soot and NO2 indoor–outdoor relationships at homes, pre-schools and schools in Stockholm, Sweden. Atmos Environ. 2010, 44, 4536–4544. [Google Scholar] [CrossRef]
- Lelieveld, J.; Klingmüller, K.; Pozzer, A.; Pöschl, U.; Fnais, M.; Daiber, A.; Münzel, T. Cardiovascular disease burden from ambient air pollution in Europe reassessed using novel hazard ratio functions. Eur. Heart J. 2019, 40, 1590–1596. [Google Scholar] [CrossRef] [PubMed] [Green Version]
- Ostro, B.; Spadaro, J.V.; Gumy, S.; Mudu, P.; Awe, Y.; Forastiere, F.; Peters, A. Assessing the recent estimates of the global burden of disease for ambient air pollution: Methodological changes and implications for low- and middle-income countries. Environ. Res. 2018, 166, 713–725. [Google Scholar] [CrossRef] [PubMed]
- Farsani, M.H.; Shirmardi, M.; Alavi, N.; Maleki, H.; Sorooshian, A.; Babaei, A.; Asgharnia, H.; Marzouni, M.B.; Goudarzi, G. Evaluation of the relationship between PM10 concentrations and heavy metals during normal and dusty days in Ahvaz, Iran. Aeolian Res. 2018, 33, 12–22. [Google Scholar] [CrossRef]
- Soleimani, Z.; Goudarzi, G.; Sorooshian, A.; Marzouni, M.B.; Maleki, H. Impact of Middle Eastern dust storms on indoor and outdoor composition of bioaerosol. Atmos. Environ. 2016, 138, 135–143. [Google Scholar] [CrossRef]
- Surendra, K.C.; Takara, D.; Hashimoto, A.G.; Khanal, S.K. Biogas as a sustainable energy source for developing countries: Opportunities and challenges. Renew. Sustain. Energy Rev. 2014, 31, 846–859. [Google Scholar] [CrossRef]
- Chen, Y.; Ebenstein, A.; Greenstone, M.; Li, H. Evidence on the impact of sustained exposure to air pollution on life expectancy from China’s Huai River policy. Proc. Natl. Acad. Sci. USA 2013, 110, 12936–12941. [Google Scholar] [CrossRef]
- Rohde, R.A.; Muller, R.A. Air Pollution in China: Mapping of Concentrations and Sources. PLoS ONE 2015, 10, e0135749. [Google Scholar] [CrossRef]
- Moses, L.; Morrissey, K.; Sharpe, R.A.; Taylor, T. Exposure to Indoor Mouldy Odour Increases the Risk of Asthma in Older Adults Living in Social Housing. Int. J. Environ. Res. Public Health 2019, 16, 2600. [Google Scholar] [CrossRef] [Green Version]
- Chen, Y.; Shen, H.; Smith, K.R.; Guan, D.; Chen, Y.; Shen, G.; Liu, J.; Cheng, H.; Zeng, E.Y.; Tao, S. Estimating household air pollution exposures and health impacts from space heating in rural China. Environ. Int. 2018, 119, 117–124. [Google Scholar] [CrossRef] [Green Version]
- Ali, M.U.; Yu, Y.; Yousaf, B.; Munir, M.A.M.; Ullah, S.; Zheng, C.; Kuang, X.; Wong, M.H. Health impacts of indoor air pollution from household solid fuel on children and women. J. Hazard. Mater. 2021, 416, 126127. [Google Scholar] [CrossRef] [PubMed]
- Luo, Y.; Zhong, Y.; Pang, L.; Zhao, Y.; Liang, R.; Zheng, X. The effects of indoor air pollution from solid fuel use on cognitive function among middle-aged and older population in China. Sci. Total Environ. 2021, 754, 142460. [Google Scholar] [CrossRef] [PubMed]
- Shih, C.-Y. Ethnicity as Policy Expedience: Clan Confucianism in Ethnic Tujia-Miao Yongshun. Asian Ethn. 2001, 2, 73–88. [Google Scholar] [CrossRef]
- Wang, F. “Rejoicing in Waters” Cases. In Geo-Architecture and Landscape in China’s Geographic and Historic Context; Springer: Singapore, 2016; pp. 145–178. [Google Scholar]
- Liu, X.; Shen, G.; Chen, L.; Qian, Z.; Zhang, N.; Chen, Y.; Chen, Y.; Cao, J.; Cheng, H.; Du, W.; et al. Spatially Resolved Emission Factors to Reduce Uncertainties in Air Pollutant Emission Estimates from the Residential Sector. Environ. Sci. Technol. 2021, 55, 4483–4493. [Google Scholar] [CrossRef] [PubMed]
- Du, W.; Wang, J.; Zhang, S.; Fu, N.; Yang, F.; Wang, G.; Wang, Z.; Mao, K.; Shen, G.; Qi, M.; et al. Impacts of Chinese spring festival on household PM2.5 pollution and blood pressure of rural residents. Indoor Air 2021, 31, 1072–1083. [Google Scholar] [CrossRef] [PubMed]
- Johnson, M.A.; Garland, C.R.; Jagoe, K.; Edwards, R.; Ndemere, J.; Weyant, C.; Patel, A.; Kithinji, J.; Wasirwa, E.; Nguyen, T.; et al. In-Home Emissions Performance of Cookstoves in Asia and Africa. Atmosphere 2019, 10, 290. [Google Scholar] [CrossRef] [Green Version]
- Yuan, X.; Mu, R.; Zuo, J.; Wang, Q. Economic Development, Energy Consumption, and Air Pollution: A Critical Assessment in China. Hum. Ecol. Risk Assess. Int. J. 2015, 21, 781–798. [Google Scholar] [CrossRef]
- Singh, N.; Singh, S.; Mall, R. Urban ecology and human health: Implications of urban heat island, air pollution and climate change nexus. In Urban Ecology; Verma, P., Singh, P., Singh, R., Raghubanshi, A.S., Eds.; Elsevier: Amsterdam, The Netherlands, 2020; pp. 317–334. [Google Scholar]
- Zulauf, N.; Dröge, J.; Klingelhöfer, D.; Braun, M.; Oremek, G.M.; Groneberg, D.A. Indoor Air Pollution in Cars: An Update on Novel Insights. Int. J. Environ. Res. Public Health 2019, 16, 2441. [Google Scholar] [CrossRef] [Green Version]
- Barnes, B.R. Behavioural Change, Indoor Air Pollution and Child Respiratory Health in Developing Countries: A Review. Int. J. Environ. Res. Public Health 2014, 11, 4607–4618. [Google Scholar] [CrossRef] [Green Version]
- Edwards, R.; Hubbard, A.; Khalakdina, A.; Pennise, D.; Smith, K.R. Design considerations for field studies of changes in indoor air pollution due to improved stoves. Energy Sustain. Dev. 2007, 11, 71–81. [Google Scholar] [CrossRef]
- Huboyo, H.S.; Tohno, S.; Lestari, P.; Mizohata, A.; Okumura, M. Characteristics of indoor air pollution in rural mountainous and rural coastal communities in Indonesia. Atmos. Environ. 2014, 82, 343–350. [Google Scholar] [CrossRef]
- Smith, K.R.; Dutta, K.; Chengappa, C.; Gusain, P.; Berrueta, O.M.A.V.; Edwards, R.; Bailis, R.; Shields, K.N. Monitoring and evaluation of improved biomass cookstove programs for indoor air quality and stove performance: Conclusions from the Household Energy and Health Project. Energy Sustain. Dev. 2007, 11, 5–18. [Google Scholar] [CrossRef]
- De la Sota, C.; Lumbreras, J.; Pérez, N.; Ealo, M.; Kane, M.; Youm, I.; Viana, M. Indoor air pollution from biomass cookstoves in rural Senegal. Energy Sustain. Dev. 2018, 43, 224–234. [Google Scholar] [CrossRef]
- Seo, S.-H.; Jung, K.-S.; Park, M.-K.; Kwon, H.-O.; Choi, S.-D. Indoor air pollution of polycyclic aromatic hydrocarbons emitted by computers. Build. Environ. 2022, 218, 109107. [Google Scholar] [CrossRef]
- Zhang, H.; Xia, Y.; Cao, L.; Chang, Q.; Zhao, Y. Associations between long term exposures to outdoor air pollution and indoor solid fuel use and depression in China. J. Environ. Manag. 2022, 302, 113982. [Google Scholar] [CrossRef] [PubMed]
- Zhu, Y.; Diao, M.; Li, J. Examining indoor air pollution in a large-scale integrated transportation hub in Shanghai. Transp. Res. Part D Transp. Environ. 2021, 97, 102947. [Google Scholar] [CrossRef]
- Dubey, S.; Rohra, H.; Taneja, A. Assessing effectiveness of air purifiers (HEPA) for controlling indoor particulate pollution. Heliyon 2021, 7, e07976. [Google Scholar] [CrossRef]
- Dionova, B.W.; Mohammed, M.; Al-Zubaidi, S.; Yusuf, E. Environment indoor air quality assessment using fuzzy inference system. ICT Express 2020, 6, 185–194. [Google Scholar] [CrossRef]
- Chen, Y.-H.; Tu, Y.-P.; Sung, S.-Y.; Weng, W.-C.; Huang, H.-L.; Tsai, Y.I. A comprehensive analysis of the intervention of a fresh air ventilation system on indoor air quality in classrooms. Atmos. Pollut. Res. 2022, 13, 101373. [Google Scholar] [CrossRef]
- Xie, R.; Xu, Y.; Yang, J.; Zhang, S. Indoor air quality investigation of a badminton hall in humid season through objective and subjective approaches. Sci. Total Environ. 2021, 771, 145390. [Google Scholar] [CrossRef]
- Cheng, Z.; Lei, N.; Bu, Z.; Sun, H.; Li, B.; Lin, B. Investigations of indoor air quality for office buildings in different climate zones of China by subjective survey and field measurement. Build. Environ. 2022, 214, 108899. [Google Scholar] [CrossRef]
- He, X.; Zhou, G.; Ma, Y.; Li, L.; Fu, S.; Liu, S.; Liu, C.; He, Y.; Su, Z.; Liu, J.; et al. Winter vacation, indoor air pollution and respiratory health among rural college students: A case study in Gansu Province, China. Build. Environ. 2021, 188, 107481. [Google Scholar] [CrossRef]
- Cai, C.; Sun, Z.; Weschler, L.B.; Li, T.; Xu, W.; Zhang, Y. Indoor air quality in schools in Beijing: Field tests, problems and recommendations. Build. Environ. 2021, 205, 108179. [Google Scholar] [CrossRef]
- Tong, Z.; Chen, Y.; Malkawi, A.; Adamkiewicz, G.; Spengler, J.D. Quantifying the impact of traffic-related air pollution on the indoor air quality of a naturally ventilated building. Environ. Int. 2016, 89, 138–146. [Google Scholar] [CrossRef] [PubMed]
- Ruan, T.; Rim, D. Indoor air pollution in office buildings in mega-cities: Effects of filtration efficiency and outdoor air ventilation rates. Sustain. Cities Soc. 2019, 49, 101609. [Google Scholar] [CrossRef]
- Sun, Y.; Wang, P.; Zhang, Q.; Ma, H.; Hou, J.; Kong, X. Indoor Air Pollution and Human Perception in Public Buildings in Tianjin, China. Procedia Eng. 2015, 121, 552–557. [Google Scholar] [CrossRef] [Green Version]
- Mannan, M.; Al-Ghamdi, S.G. Indoor air quality in buildings: A comprehensive review on the factors influencing air pollution in residential and commercial structure. Int. J. Environ. Res. Public Health 2021, 18, 3276. [Google Scholar] [CrossRef]
- Azuma, K.; Ikeda, K.; Kagi, N.; Yanagi, U.; Osawa, H. Physicochemical risk factors for building-related symptoms in air-conditioned office buildings: Ambient particles and combined exposure to indoor air pollutants. Sci. Total Environ. 2018, 616, 1649–1655. [Google Scholar] [CrossRef]
- Annesi-Maesano, I.; Baiz, N.; Banerjee, S.; Rudnai, P.; Rive, S. Indoor Air Quality and Sources in Schools and Related Health Effects. J. Toxicol. Environ. Health Part B 2013, 16, 491–550. [Google Scholar] [CrossRef]
- Blondeau, P.; Iordache, V.; Poupard, O.; Genin, D.; Allard, F. Relationship between outdoor and indoor air quality in eight French schools. Indoor Air 2005, 15, 2–12. [Google Scholar] [CrossRef]
- Madureira, J.; Paciência, I.; Rufo, J.; Ramos, E.; Barros, H.; Teixeira, J.P.; de Oliveira Fernandes, E. Indoor air quality in schools and its relationship with children’s respiratory symptoms. Atmos. Environ. 2015, 118, 145–156. [Google Scholar] [CrossRef] [Green Version]
- Bennett, J.; Davy, P.; Trompetter, B.; Wang, Y.; Pierse, N.; Boulic, M.; Phipps, R.; Howden-Chapman, P. Sources of indoor air pollution at a New Zealand urban primary school: A case study. Atmos. Pollut. Res. 2019, 10, 435–444. [Google Scholar] [CrossRef]
- Klinmalee, A.; Srimongkol, K.; Oanh, N.T.K. Indoor air pollution levels in public buildings in Thailand and exposure assessment. Environ. Monit. Assess. 2009, 156, 581–594. [Google Scholar] [CrossRef]
- Tran, V.V.; Park, D.; Lee, Y.-C. Indoor air pollution, related human diseases, and recent trends in the control and improvement of indoor air quality. Int. J. Environ. Res. Public Health 2020, 17, 2927. [Google Scholar] [CrossRef] [PubMed] [Green Version]
- Cincinelli, A.; Martellini, T. Indoor Air Quality and Health. Int. J. Environ. Res. Public Health 2017, 14, 1286. [Google Scholar] [CrossRef] [PubMed] [Green Version]
- Guo, P.; Yokoyama, K.; Piao, F.; Sakai, K.; Khalequzzaman; Kamijima, M.; Nakajima, T.; Kitamura, F. Sick Building Syndrome by Indoor Air Pollution in Dalian, China. Int. J. Environ. Res. Public Health 2013, 10, 1489–1504. [Google Scholar] [CrossRef] [PubMed] [Green Version]
- Li, W.-M.; Lee, S.C.; Chan, L.Y. Indoor air quality at nine shopping malls in Hong Kong. Sci. Total Environ. 2001, 273, 27–40. [Google Scholar] [CrossRef]
- Shang, Y.; Li, B.; Baldwin, A.; Ding, Y.; Yu, W.; Cheng, L. Investigation of indoor air quality in shopping malls during summer in Western China using subjective survey and field measurement. Build. Environ. 2016, 108, 1–11. [Google Scholar] [CrossRef]
- Huai, C.; Xie, J.; Liu, F.; Du, J.; Chow, D.H.; Liu, J. Experimental and Numerical Analysis of Fire Risk in Historic Chinese Temples: A Case in Beijing. Int. J. Arch. Herit. 2021, 1–15. [Google Scholar] [CrossRef]
- Liao, C.; Akimoto, M.; Bivolarova, M.P.; Sekhar, C.; Laverge, J.; Fan, X.; Lan, L.; Wargocki, P. A survey of bedroom ventilation types and the subjective sleep quality associated with them in Danish housing. Sci. Total Environ. 2021, 798, 149209. [Google Scholar] [CrossRef]
- Afacan, Y.; Demirkan, H. The influence of sustainable design features on indoor environmental quality satisfaction in Turkish dwellings. Arch. Sci. Rev. 2016, 59, 229–238. [Google Scholar] [CrossRef] [Green Version]
- JGJ/T177-2009; Industrial Standard of the People’s Republic of China: Standard for Energy Efficiency Test of Public Buildings. Ministry of Housing and Urban-Rural Development of the People’s Republic of China, China Architecture & Building Press: Beijing, China, 2010.
- Hong, T. A close look at the China Design Standard for Energy Efficiency of Public Buildings. Energy Build. 2009, 41, 426–435. [Google Scholar] [CrossRef]
- MOHURD. Announcement on Publishing National Standard ‘Code for Design of Residential Buildings for the Elderly 2016. Available online: https://www.mohurd.gov.cn/gongkai/fdzdgknr/tzgg/201702/20170227_231094.html (accessed on 6 July 2022).
- Zhang, S.-C.; Wang, H.; Liu, Z.; Zeng, S.; Jin, Y.; Baležentis, T. A comprehensive evaluation of the community environment adaptability for elderly people based on the improved TOPSIS. Information 2019, 10, 389. [Google Scholar] [CrossRef] [Green Version]
- Chau, C.; Hui, W.; Tse, M. Evaluation of health benefits for improving indoor air quality in workplace. Environ. Int. 2007, 33, 186–198. [Google Scholar] [CrossRef]
- Cerón Bretón, J.G.; Cerón Bretón, R.M.; Martínez Morales, S.; Kahl, J.D.W.; Guarnaccia, C.; Lara Severino, R.d.C.; Rangel Marrón, M.; Ramírez Lara, E.; Espinosa Fuentes, M.d.l.L.; Uc Chi, M.P.; et al. Health Risk Assessment of the Levels of BTEX in Ambient Air of One Urban Site Located in Leon, Guanajuato, Mexico during Two Climatic Seasons. Atmosphere 2020, 11, 165. [Google Scholar] [CrossRef] [Green Version]
- Mokhtari, M.; Jafari, N.; Mohammadi, A.; Hajizadeh, Y.; Ghanbari, R.; Nemati, S.; Abdolahnejad, A. Temporal and spatial trends of airborne asbestos fiber concentrations in the urban areas of Yazd, Iran. Int. J. Environ. Sci. Technol. 2019, 16, 2657–2666. [Google Scholar] [CrossRef]
- Nandan, A.; Siddiqui, N.A.; Kumar, P. Estimation of indoor air pollutant during photocopy/printing operation: A computational fluid dynamics (CFD)-based study. Environ. Geochem. Health 2020, 42, 3543–3573. [Google Scholar] [CrossRef]
- Mocho, P.; Desauziers, V.; Plaisance, H.; Sauvat, N. Improvement of the performance of a simple box model using CFD modeling to predict indoor air formaldehyde concentration. Build. Environ. 2017, 124, 450–459. [Google Scholar] [CrossRef]
- Xu, L.; Zheng, W.; Xu, F. Case research on kitchen fire of ancient buildings under water spray effect. Case Stud. Therm. Eng. 2022, 31, 101772. [Google Scholar] [CrossRef]
- Cai, N.; Chow, W.-K. (Eds.) Numerical studies on heat release rate in a room fire burning wood and liquid fuel. Build Simul. 2014, 7, 511–524. [Google Scholar] [CrossRef]
- McGrattan, K.; Hostikka, S.; McDermott, R.; Floyd, J.; Weinschenk, C.; Overholt, K. Fire dynamics simulator technical reference guide volume 1: Mathematical model. NIST Spec. Publ. 2013, 1018, 175. [Google Scholar]
- Xu, L.; Zheng, W. Numerical simulation on the influence of low air pressure upon smoke spread and fire alarm process. Case Stud. Therm. Eng. 2021, 26, 101004. [Google Scholar] [CrossRef]
- Rovira, J.; Roig, N.; Nadal, M.; Schuhmacher, M.; Domingo, J.L. Human health risks of formaldehyde indoor levels: An issue of concern. J. Environ. Sci. Health Part A 2016, 51, 357–363. [Google Scholar] [CrossRef] [PubMed] [Green Version]


| Comment | Question |
|---|---|
| Basic information | Gender, age, illness history |
| Odours | Oil and smoke odour, Stuffy odour, mould odour, pungent odour |
| Open window behaviour | Open windows all day, open windows occasionally, never open windows |
| Air purifier use | Never, barely use, often use, daily use |
| Daily staying hours | <8 h, 8–12 h, 12–16 h, >16 h |
| Cooking and heating energy source | Solid fuels (such as wood, charcoal, and coal), natural gas fuels, electricity |
| Indoor air quality evaluation | very bad, bad, moderate, good, very good |
| Instrument | Parameter | Accuracy | Measuring Range | Resolution |
|---|---|---|---|---|
| AZ-77597 Carbon dioxide analyser | CO2 | ±30 ppm or ±5% (0~5000 ppm) | 0~5000 ppm | 1 ppm |
| BR-SMART128S Air quality instrument | PM2.5, PM10 | ±20 μg/m3 | 0~999 μg/m3 | 1 μg/m3 |
| Formaldehyde | ±30 μg/m3 | 0~3000 μg/m3 | 1 μg/m3 |
| Pollutant | CO2 | PM2.5 | PM10 | HCHO |
|---|---|---|---|---|
| Average value standard | 1000 ppm | 100 μg/m3 | 150 μg/m3 | 150 μg/m3 |
| CO2 | PM2.5 | PM10 | Air Quality Level | Assigning Value |
|---|---|---|---|---|
| 350~450 | 0~35 μg/m3 | 0~50 μg/m3 | Best | X1 = 5 |
| 500~750 ppm | 35~75 μg/m3 | 50~150 μg/m3 | Better | X1 = 4 |
| 750~1500 ppm | 75~300 μg/m3 | 150~460 μg/m3 | Normal | X1 = 3 |
| 1500~2500 ppm | 300~500 μg/m3 | 460~600 μg/m3 | Worse | X1 = 2 |
| >2500 ppm | >500 μg/m3 | >600 μg/m3 | Worst | X1 = 1 |
Publisher’s Note: MDPI stays neutral with regard to jurisdictional claims in published maps and institutional affiliations. |
© 2022 by the authors. Licensee MDPI, Basel, Switzerland. This article is an open access article distributed under the terms and conditions of the Creative Commons Attribution (CC BY) license (https://creativecommons.org/licenses/by/4.0/).
Share and Cite
Zhang, F.; Shi, L.; Liu, S.; Shi, J.; Cheng, M. Indoor Air Quality in Tujia Dwellings in Hunan, China: Field Tests, Numerical Simulations, and Mitigation Strategies. Int. J. Environ. Res. Public Health 2022, 19, 8396. https://doi.org/10.3390/ijerph19148396
Zhang F, Shi L, Liu S, Shi J, Cheng M. Indoor Air Quality in Tujia Dwellings in Hunan, China: Field Tests, Numerical Simulations, and Mitigation Strategies. International Journal of Environmental Research and Public Health. 2022; 19(14):8396. https://doi.org/10.3390/ijerph19148396
Chicago/Turabian StyleZhang, Fupeng, Lei Shi, Simian Liu, Jiaqi Shi, and Mengfei Cheng. 2022. "Indoor Air Quality in Tujia Dwellings in Hunan, China: Field Tests, Numerical Simulations, and Mitigation Strategies" International Journal of Environmental Research and Public Health 19, no. 14: 8396. https://doi.org/10.3390/ijerph19148396