Article

Does the Application of ICTs Improve the Efficiency of Agricultural Carbon Reduction? Evidence from Broadband Adoption in Rural China

1
School of Management and Economics, Jiangxi Agricultural University, Nanchang 330045, China
2
Institute of Rural Development, Jiangxi Agricultural University, Nanchang 330045, China
3
College of Economics and Management, Zhejiang A&F University, Hangzhou 311300, China
4
Research Academy for Rural Revitalization of Zhejiang Province, Zhejiang A&F University, Hangzhou 311300, China
*
Authors to whom correspondence should be addressed.
Int. J. Environ. Res. Public Health 2022, 19(13), 7844; https://doi.org/10.3390/ijerph19137844
Submission received: 10 May 2022 / Revised: 13 June 2022 / Accepted: 22 June 2022 / Published: 26 June 2022
(This article belongs to the Special Issue Livelihoods Resilience and Sustainable Rural Development)

Abstract

:
Based on the Environmental Kuznets Curve (EKC) hypothesis, this paper examines whether rural broadband adoption affects agricultural carbon reduction efficiency (ACRE), using panel data from 30 Chinese provinces from 2011 to 2019. This paper achieves a measurement of ACRE by taking the carbon sink of agricultural as one of the desired outputs and using a Slacks-Based Measure (SBM) model and the global Malmquist–Luenberger (GML) index. The results show that: (1) Rural broadband adoption has a positive effect on ACRE. The relationship between the income of rural residents and ACRE was an inverted U-shaped, which confirms the EKC hypothesis. (2) Land transfer has a significant promoting effect on the relationship between rural broadband adoption and ACRE. When the land transfer rate is high, the positive effect of broadband adoption is obvious. (3) The positive effect of broadband adoption on ACRE was more obvious when farmers invested more in production equipment, that is to say, it has a significant positive moderating effect. As farmers in many developing countries suffer from increasingly frequent and severe extreme weather events, we believe that the results of this study also have implications for the implementation of agricultural carbon reduction and smart agricultural equipment roll-out in many countries.

1. Introduction

The sustainable development of agricultural systems has become a more urgent issue in the context of global challenges such as the COVID-19 pandemic and food insecurity. Climate change has substantial impacts on water balance, affecting the surrounding industries, agriculture, and other economic sectors [1,2]. Carbon dioxide (CO2) is the main gas causing climate change and the greenhouse effect [3]. Therefore, reducing CO2 emissions and promoting sustainable agriculture have become major goals for global development. In the past, due to a large population and limited arable land, China’s agricultural industry focused strongly on extensive farming. China’s high-input, high-consumption, and high-pollution agricultural development model has resulted in significant pressure on resources and the environment, threatening the sustainability of agriculture [4]. In order to overcome these challenges, it is essential to implement timely strategies for improving the efficiency of agricultural carbon reduction [5,6]. The progress of digital technology provides a new way of breaking through the bottleneck of current agricultural development and finding a green development strategy. Integrating data and information elements into agricultural systems can help optimize factor allocation and facilitate the efficient and coordinated development of agricultural systems [7,8]. Digital agriculture in many developed countries is based on the concept of green and sustainable development. For example, according to the precipitation, soil fertility, and climate, Australia ensures efficient and green agricultural production through agricultural information monitoring and agricultural decision support systems [9]. Germany’s large agricultural machinery equipped with information technology can carry out all kinds of farm operations, such as precise sowing, fertilization, weeding, and harvesting. The adoption of these technologies can achieve quantitative fertilization and spraying in different places within the same plot to ensure the efficient utilization of chemicals and fertilizer while avoiding environmental pollution [10]. As a developing country, China, like many developed countries, vigorously develops digital agriculture and actively promotes the application of information and communication technologies (ICTs) in green agriculture. At present, with the vigorous implementation of the “Digital Villages” strategy, the supply of ICTs in rural areas is increasing rapidly. According to the Communication Industry Statistical Bulletin, by the end of December 2019, the net increase in rural broadband users was 17.36 million, which was 14.8% higher than the previous year. This growth rate was 6.3 percentage points higher compared to urban broadband users in the same year. Furthermore, digital technology is spreading rapidly into agriculture. Agricultural informatization has become an important power source to promote the high-quality development of China’s agriculture. Therefore, embedding ICTs as external technology and studying their impact on agricultural carbon reduction efficiency (ACRE) is key to testing the actual effect of the “Digital Villages” project in China.
Three core issues are being discussed in existing literature on agricultural carbon reduction and its relationship with ICTs. The first core issue is of updating the measurement index and method for ACRE. Carbon reduction efficiency (CRE) is a popular concept in industrial and urban economies and is often used to measure the gap between the actual CO2 emissions generated by manufacturing or other human activities and the optimal CO2 emissions [11,12]. According to this concept, ACRE is defined as the ratio of the theoretical minimum CO2 emissions of agricultural production activities to the actual CO2 emissions under fixed input-output conditions. ACRE directly reflects the effect of regional agricultural CO2 emissions and indirectly reflects the potential of regional agricultural CO2 emissions. The literature on ACRE measurement is mainly divided into three parts: One is the selection of the measurement model, another is the selection of measurement index, and the final one is the selection of measurement indicators. First, for model selection, the Solow residual, Algebraic Index, and Stochastic Frontier Approach (SFA) can only fit the production process of one kind of output. In contrast, the Data Envelopment Analysis (DEA) method does not need to set a specific form of production function, but the traditional DEA model has one distinct limitation: non-effective units can only rely on radial improvement to reach the frontier; that is, increasing or decreasing the input and output in the same proportion. In order to overcome this limitation of the traditional DEA model, Tone [13] proposed the Slacks-Based Measure (SBM) model, which involved the addition of undesirable outputs, such that the output and input can be adjusted in non-radial directions by non-effective units. Second, regarding the choice of index, there are three main kinds of productivity index: the Malmquist non-parametric linear programming algorithm; the Luenberger productivity index further developed by Chambers et al. [14]; and the modified version by Chung and Fare [15] which included undesired output in the Malmquist–Luenberger index. Unfortunately, these indexes all have problems of intransitivity and infeasible solutions. A study by Oh [16] showed that the method of global reference can solve these problems, and the GML (Global Malmquist–Luenberger) index, constructed by global reference, can measure ACRE more accurately. Third, in terms of the input indicators, these mainly include agricultural labor force, farmland, machinery, chemical fertilizer, pesticides, irrigation, and other indicators. Desired output refers to agricultural output while undesired output indicates agricultural CO2 emissions [17,18,19].
The second core issue is the identification of the main factors driving agricultural carbon reduction. At present, the literature mainly focuses on the sources of agricultural CO2 emissions and changes in food demand. First, regarding CO2 emissions, micro measures to combat this issue focus on changes in land use type and the return of grassland and farmland to forest [20], as well as chemical application and residue, agricultural waste treatment, and livestock and poultry manure management [21,22]. Agricultural production structure and regional economic development are considered to have a positive impact on agricultural CO2 emissions reduction at the macro level [23]. It was confirmed that agroecological efficiency was also affected by the agricultural industrial structure characterized by the proportion of the sown area of food crops to the total sown area of crops. Chen et al. [24] found Kuznets Curve characteristics between agricultural industrial agglomeration and agricultural carbon efficiency. Second, with respect to food demand, strategies may include adjusting the diet structure, reducing the proportion of meat intake, replacing animal protein with plant protein, and reducing food loss and waste [25,26]. Empirical studies have found that the price mechanism and the promotion and education of healthy eating and on-demand consumption can effectively change consumers’ behavioral preferences and influence the structure and quantity of food demand [27,28], thus promoting agricultural carbon reduction.
The third core issue is the relationship between ICTs and agricultural carbon reduction (sustainable agriculture). In practice and theory, it is indisputable that ICTs directly affect the productivity of agriculture [29,30]. In the field of agricultural informatization, ICTs are expected to enhance the abilities of farmers, with the use of diverse tools to obtain all kinds of information. For example, mobile messaging applications can support instant access to market information, weather data, production advice, and financial services-related information [31]. By observing the development of green agriculture in Serbia and all EU countries, some scholars believed that the use of precision agriculture, automatic management technology systems, and geographic information systems hage led to the rational use of inputs, thus reducing the adverse impact on the environment [32]. However, others hold different views. Big data can improve the economic and environmental performance of agriculture but may threaten the sustainability of agri-food systems, especially by exacerbating the gap between small-scale and large-scale farming [33]. Precision agriculture supported by broadband internet is widely considered to have more environmental benefits than drawbacks. For example, compared with traditional agriculture, the environmental benefits of precision agriculture include the possibility of reducing agricultural greenhouse gas emissions [34,35]. Unfortunately, the policy-related mechanisms of technology adoption required for green agriculture are rarely explored.
The above three core issues for research and progress have important theoretical value and policy implications for analyzing the impact of ICTs on ACRE. Indeed, broadband is the main infrastructure for carrying information, and household broadband penetration within a region is often used to represent ICTs development level [36,37,38]. Our paper defines broadband adoption as an ICTs application. As China’s rural broadband access becomes increasingly common and more individuals routinely go online, it provides a good foundation for the operation of agricultural informatization production equipment. Moreover, under the role of information technology, facility agriculture can better realize the precision management of farmland. This can be attributed to the increased accessibility to precision agriculture that is provided by broadband adoption. The research status in this field is as follows. (1) Apart from a few studies [32,39], most studies on agricultural carbon reduction do not consider broadband adoption as an external factor. (2) In terms of research methods, in the studies that considered broadband to reduce carbon emissions, the analysis method were mainly observation and comparison, rather than econometric model analysis. Based on existing research, since agricultural production acts as a carbon sink [40,41], measurement accuracy can be improved by taking the carbon sequestration of agricultural production as one of the indicators of expected output. (3) Few scholars have discussed the moderating effect of land transfer and farmers’ investment in production equipment on ACRE in the context of rural broadband adoption.
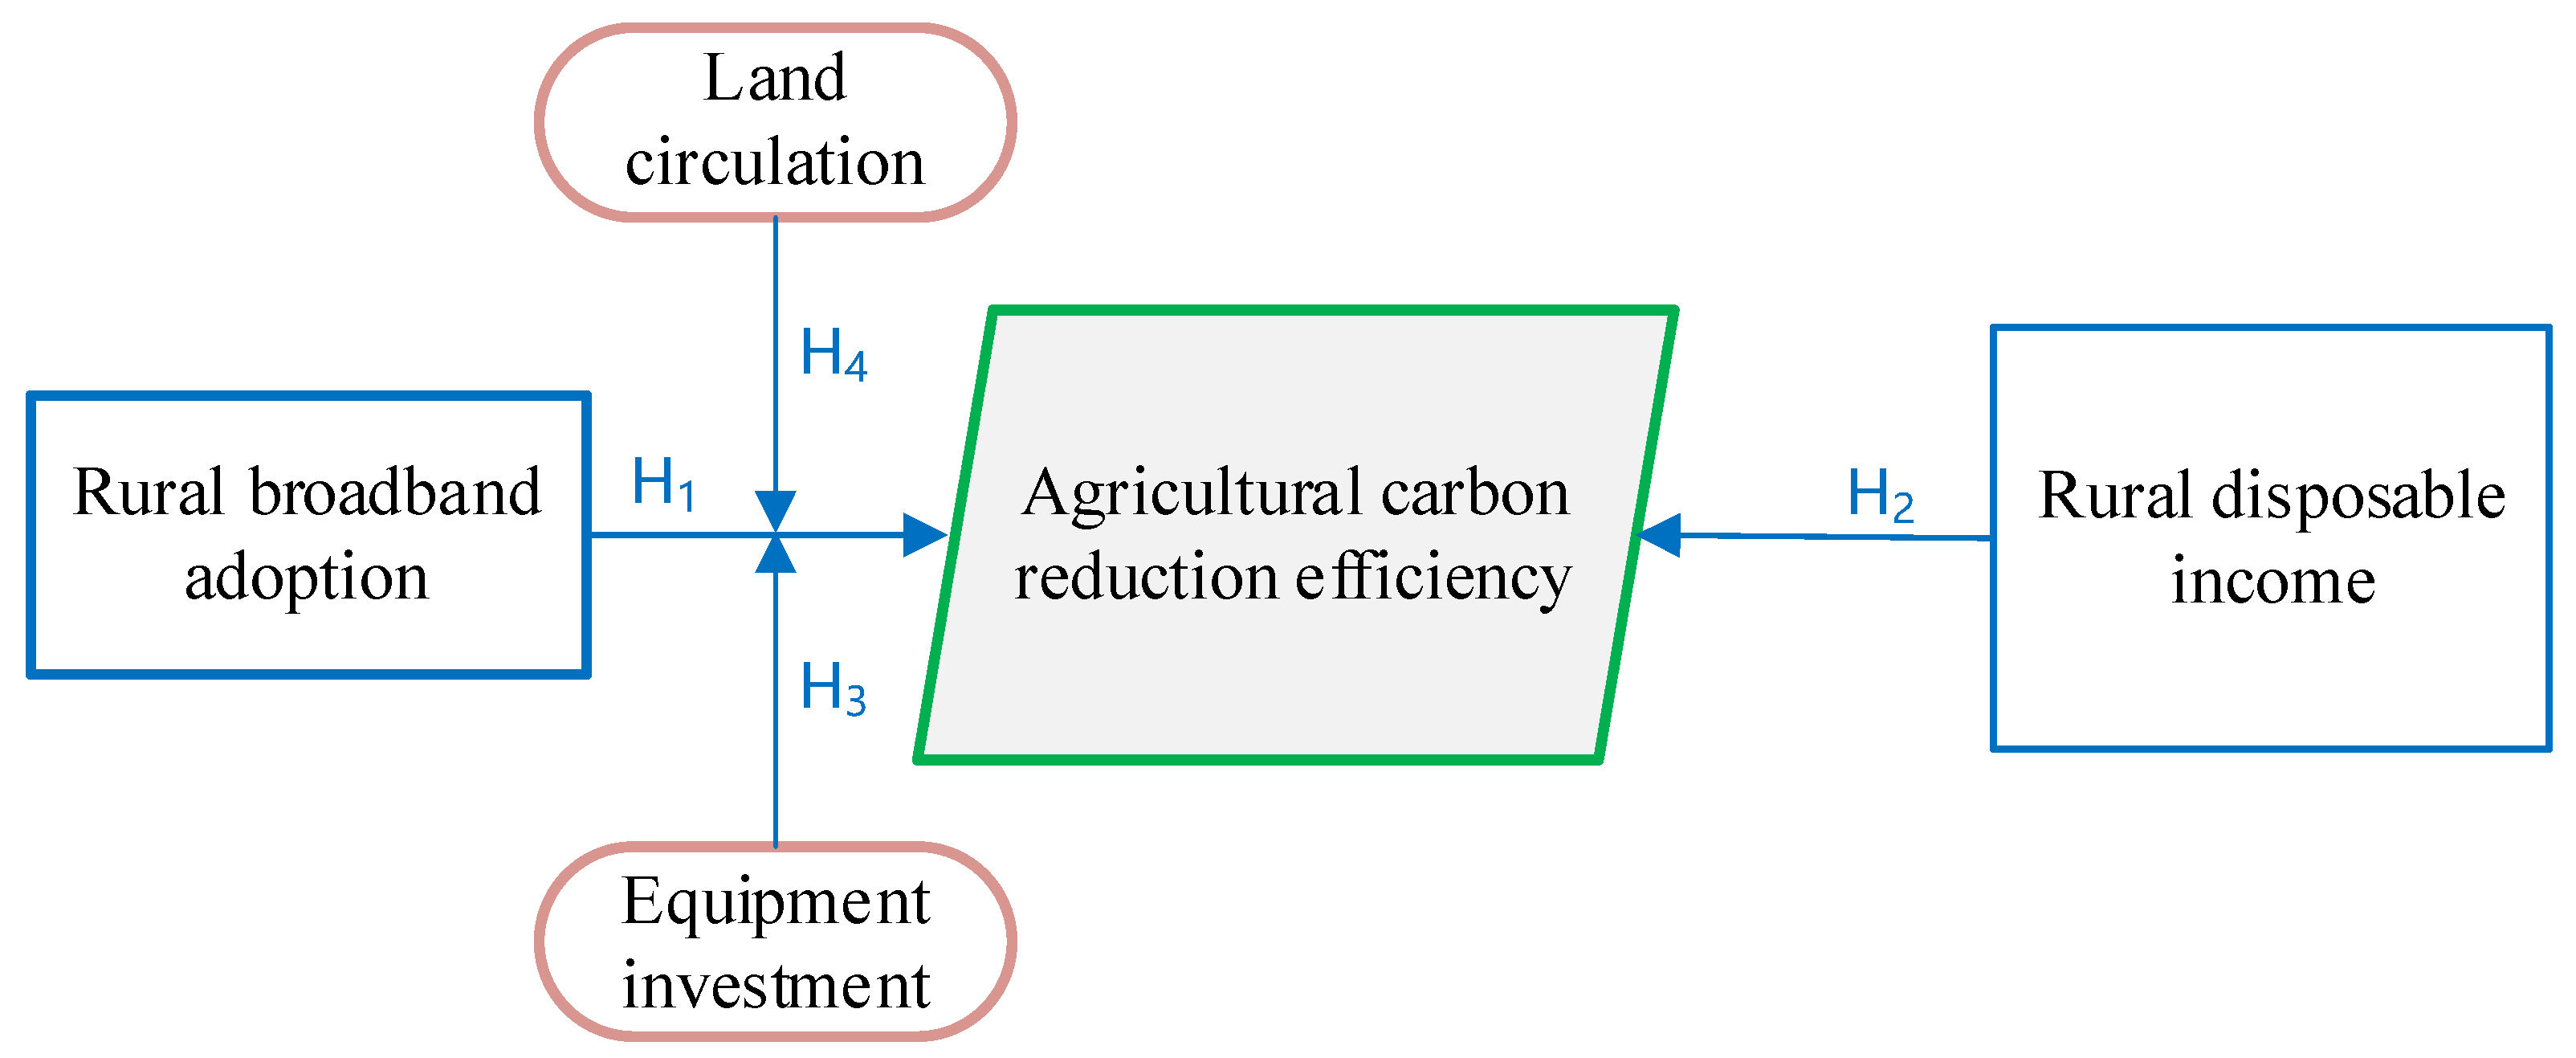
This paper argues that there is currently a lack of discussion on the mechanism by which rural broadband adoption affects agricultural carbon reduction, which may dilute its importance in agricultural sustainability. Therefore, in the context of China’s “Digital Villages” project and carbon reduction strategy, this paper uses provincial panel data and econometric modeling from 2011 to 2019 to verify the impact and moderating effect of ICT application on ACRE. The results show that in accordance with the environmental Kuznets Curve (EKC) hypothesis, rural broadband adoption has a positive effect on ACRE. In addition, we also find that higher rates of broadband access are associated with greater improvements in ACRE through increased land transfer rates. With the improvement of informatization, farmers’ investment in production equipment also plays a positive role in ACRE.
Compared with previous studies, the main contributions of this paper are as follows. (1) It confirms the positive impact of rural broadband adoption on ACRE, complementing existing evidence on the influencing factors of ACRE. (2) This paper analyzes the moderating effect of land transfer and farmers’ investment in production equipment on ACRE in the context of rural broadband adoption, and the conclusion has a certain reference value for the promotion of land transfer and smart agricultural equipment decision-making. (3) Our paper takes the carbon sink of agricultural production as one of the desired outputs and uses SBM modeling and the GML index method to measure ACRE more comprehensively.
This paper is organized as follows. After the Introduction, Section 2 is the theoretical analysis and research hypothesis. Then, we describe the research object, data sources, and method in Section 3. Section 4 presents our empirical results and carries out a series of robustness and endogeneity tests. Section 5 concludes the paper.

2. Theoretical Analysis and Hypotheses

This study analyzes the EKC hypothesis considering the role of broadband adoption. The nexuses between rural broadband adoption and agricultural carbon reduction are complex. The micro-mechanism of broadband adoption influencing agricultural CO2 emission reduction is divided into two strands. The first strand is direct effects. The ultimate goal of new technologies is reflected in the long-term sustainability of agriculture, and broadband adoption provide a foundation for precision agriculture. The use of precision-agriculture-applied automated management technology systems and geographic information systems has led to increased yields, while also reducing the adverse impact on the environment [32]. Environmental benefits of precision agriculture compared to traditional agriculture include the potential to reduce waste from fertilizer and pesticide application, save water [42,43], and mitigate agricultural greenhouse gas emissions [34]. Unfortunately, precision agriculture can only be adopted by farmers who have access to broadband due to the technological requirements [44]. In previous studies, Wang et al. [45] and Ma and Zheng [46] found a significant correlation between Internet use and farmers’ environmental behavior of reducing fertilizers and pesticides.
The second strand is the propagation effect. Residents trust public positive information the most and trust private negative information the least [47]. The spread of positive information, such as environmental protection, has been accelerated by the popularization of broadband adoption. This has promoted the awareness of low-carbon consumption in daily life. The development of broadband has allowed people to quickly access information related to environmental pollution causes and hazards [48]. Smart phones commonly used by farmers can not only improve environmental awareness and regulate farmers’ behavior, but also make more farmers aware of the perceived threat of environmental degradation [49]. In summary, we propose the following hypotheses:
Hypotheses 1 (H1).
Rural broadband adoption directly promotes the improvement of ACRE.
The EKC hypothesis illustrates that rising income contributes to pollution but after up to a point, after which pollution decreases. However, pollution changes with income due to scale, composition, and technique effects [50,51]. Some scholars focus on the non-linear effects of economy and income on agricultural CO2 emissions. Based on the estimation of agricultural CO2 emissions in China from 1991 to 2018, the EKC model is used to conclude that economic and income growth is the main driving factor of agricultural CO2 emissions [52]. In summary, we propose the following hypotheses:
Hypotheses 2 (H2).
The income of rural residents has a non-linear effect on ACRE.
Theoretically, the mismatch of production materials directly inhibits output and distorts the input decisions of micro subjects, resulting in the loss of environmental welfare [53]. Under the micro-scale efficiency driving mechanism, the development of land transfer market will increase land use to reduce agricultural yield losses [54]. Existing studies have shown that compared with small farmers, big farms with strong operational capacity, rich production experience and a high level of professionalism are more likely to accept and adopt low-carbon agricultural technologies [55]. As we know, land transfer promotes the large-scale management of cultivated land, and then changes the land use, thus regulating agricultural CO2 emissions
The widespread development of broadband adaption around 2010 enabled precision agriculture to develop web services resulting in information equipment such as spraying drones and soil temperature sensors [44]. Several barriers exist to adopting precision agriculture technologies, aside from broadband access. These include technical issues for the equipment itself, disconnect or lack of compatibility between the precision agriculture equipment and the farm operation, concerns regarding the misuse of agricultural data, managing the large amounts of data precision agriculture provides, lack of user-friendly designs and interfaces, and high costs of implementation [56]. Hence, we propose the following hypothesis:
Hypotheses 3 (H3).
Land transfer plays a positive moderating role between broadband adoption and ACRE.
Hypotheses 4 (H4).
The investment of farmers in production equipment plays a positive moderating role between broadband adoption and ACRE.
Based on the above research hypothesis, the theoretical analysis framework of this study is obtained (Figure 1).

3. Materials and Methods

3.1. Data and Samples

In order to investigate the direct impact of rural broadband adoption on ACRE and its related moderating effect, this paper uses panel data of 30 provinces (excluding Tibet, Hong Kong, Macao, and Taiwan) from 2011 to 2019. First, the dependent variable is ACRE, which is measured using input and output data. Second, the core independent variable is the rural broadband adoption ratio (Broadband). Finally, the control variables and moderator variables include rural disposable income (Income), rural disposable income squared (Income square), operation scale (Scale), agricultural economic status (Status), industrial added value (Industrialization), the ratio of disaster (Damage), land transfer (Ltr), and equipment investment (Equipment). The above data mainly come from the China Rural Statistical Yearbook, China Statistical Yearbook, China Agricultural Machinery Industry statistical Yearbook, and China Environmental Statistical Yearbook.

3.2. Variables

3.2.1. Dependent Variable

By definition, ACRE should be measured according to the actual level of agricultural carbon emissions and the theoretical optimal CO2 emissions. Based on existing research methods, this paper adopts the SBM model and GML (Global Malmquist–Luenberger) index method to calculate ACRE [57,58,59,60,61]. The measurement index system for the ACRE is as follows (Table 1). Labor input, land input, machinery input, fertilizer input, irrigation input, and electricity input are applied as input indicators. Referring to Liu et al. [23], the total output value of agriculture, forestry, animal husbandry and fishery, and the CO2 sink of agricultural production are taken as desirable outputs, and the undesirable output is CO2 emissions generated in the process of agricultural planting.
The reasons for choosing this approach are as follows. First, the GML index method can simulate multiple inputs and outputs simultaneously to accurately measure ACRE. Second, the SBM model can measure efficiency from multiple angles, evaluate the impact of non-zero input and non-zero output relaxation, and comprehensively measure ACRE. Finally, in view of the above advantages, the SBM model and GML index method are suitable for estimating the efficiency of agricultural carbon emissions reduction.
Referring to Meng and Qu [62], according to the global comparison strategy, each province in each year is regarded as a decision-making unit (DMU). Suppose each province has m inputs, r 1 desirable outputs, and r 2 undesirable outputs. Then, under VRS (Variable Returns to Scale), the general form of the SBM model can be constructed as follows:
min   ρ = 1 m ( i = 1 m x ¯ x i k ) 1 r 1 + r 2 ( w = 1 r 1 y ¯ w y w k + w = 1 r 2 p ¯ u p u k s . t . { x ¯ i j = 1 , k n x i j λ j , i = 1 , 2 , , m ; y ¯ w j = 1 , k n y w j λ j , i = 1 , 2 , , r 1 ; p ¯ u j = 1 , k n p u j λ j , i = 1 , 2 , , r 2 ; λ j 0 , x ¯ i x i k , y ¯ w y w k , p ¯ u p u k ; j = 1 , 2 , , n ( j k )
In Equation (1), ρ is the objective function. x i j , y w j , and p u j are the relaxation variable of input, desirable output, and undesirable output, respectively, and λ is their weight. According to the definition of agricultural CO2 emissions reduction (the ratio of possible minimum carbon emission from agricultural production to actual carbon emission under fixed input and fixed economic output), based on the calculation of the SBM model, the GML index is determined as follows:
G M L k t , t + 1 = 1 + D G ( x k t , y k t , p k t ) 1 + D G ( x k t + 1 , y k t + 1 , p k t + 1 ) = 1 + D t ( x k t , y k t , p k t ) 1 + D t + 1 ( x k t + 1 , y k t + 1 , p k t + 1 ) × [ 1 + D G ( x k t , y k t , p k t ) 1 + D t ( x k t , y k t , p k t ) × 1 + D t + 1 ( x k t + 1 , y k t + 1 , p k t + 1 ) 1 + D G ( x k t + 1 , y k t + 1 , p k t + 1 ) ] = E C k t , t + 1 × T C k t , t + 1
In Equation (2), G M L k t , t + 1 represents the two stages of the change in CO2 reduction efficiency in each province. D G represents a global directional distance function dependent on production possibilities. E C k t , t + 1 represents the change in technical efficiency; T C k t , t + 1 represents the technical progress index. A smaller GML value indicates a greater deviation between the actual agricultural CO2 emissions and the minimum possible CO2 emissions, and therefore implies greater redundancy in agricultural carbon emissions and lower efficiency of carbon emissions reduction.

3.2.2. Main Independent Variable

In the Introduction, the impact of ICT application on agricultural carbon reduction was described in detail. Broadband penetration, as a measure of ICT development, is usually measured by the proportion of broadband connections available [38,63] Therefore, this paper uses the proportion of actual rural broadband users out of the total regional users to measure rural broadband adoption as the main independent variable, expressed by Broadband. In the robustness test, the penetration rate of household computers in rural households, i.e., the ownership of household computers per 100 households, is selected for reference Zhang [64] and is represented by Computer. This variable is selected because rural households need Internet terminal equipment to install fixed broadband.

3.2.3. Other Variables

The factors affecting ACRE are complex, so we also added control variables. Some previous studies have focused on the non-linear effects of the economy and income on agricultural CO2 emissions. The EKC model estimates that economic growth is the main driving factor of agricultural CO2 emissions in China from 1991 to 2018 [52]. Hence, we choose rural per capita disposable income and income squared as control variables. Previous studies found that the extent of input of agricultural CO2 sources (such as fertilizers and chemicals) showed an obvious U-shaped trend with increasing farmland size [65]. Therefore, the sowing area is divided by the total labor force of the planting industry to construct the control variable Scale. Industrial agglomeration is closely related to economic development [66,67,68]. Therefore, this paper uses an agricultural location quotient to measure agricultural economic status, which is assigned to the variable Status. With increasing industrial agglomeration and industrialization, rural production and living equipment will be effectively improved, providing material conditions and product markets for agriculture and promoting high-quality development of the agricultural economy. Therefore, in this paper, the industrial added value of each region is used to measure the degree of industrialization of the region, with the variable being Industrialization. In addition, rural economic development is often affected by natural disasters [69]. Agricultural production performance is closely related to environmental quality. Any natural disasters can be devastating to farmers’ morale and may affect technological progress and efficiency [70], thus affecting the efficiency of agricultural carbon emissions reduction. Therefore, the degree of disaster measured by the affected crop area in each region is included as a control variable, Damage. Finally, moderating variables are chosen. Theoretically, mismatches in production materials directly inhibit output and distort the input decisions of micro subjects, resulting in loss of environmental welfare [53]. Therefore, this paper chooses farmer household land circulation and farmer household production equipment investment as the moderating variables, represented by Ltr and Equipment, respectively. Table 2 defines the variables used in the econometric model of this study. Except for proportional variables, all other variables were determined based on the data from 2010.

3.3. Econometric Model

This paper constructed the following econometric model to analyze the impact of broadband adoption on agricultural carbon emissions reduction efficiency by referring to Tang et al. [71].
A C R E i t = β 0 + β 1 B r o a d b a n d i t + β 2 X i t + λ i + μ i + ε i t
In Equation (3), A C R E i t represents agricultural CO2 reduction efficiency in each province per year, and B r o a d b a n d i t represents the rural broadband use in province i as a proportion of time t. λ i is the fixed effects, μ i is the time-fixed effects, and ε i t is the random perturbation terms.
In order to analyze the moderating effect, this paper adds two moderating variables, land transfer (Ltr) and equipment investment (Equipment), based on the above benchmark model. The specific model is constructed as follows:
A C R E i t = β 0 + β 1 B r o a d b a n d i t + β 2 L c r i t + β 3 B r o a d b a n d i t · L c r i t + β 4 X i t + λ i + μ i + ε i t
A C R E i t = β 0 + β 1 B r o a d b a n d i t + β 2 E q u i p m e n t i t + β 3 B r o a d b a n d i t · E q u i p m e n t i t + β 4 X i t + λ i + μ i + ε i t
Equations (4) and (5) are the measurement models of Ltr and Equipment, respectively. Other variables are consistent with the benchmark model of Equation (3).

4. Results

4.1. Descriptive Statistics

Descriptive statistical results of variables are shown in Table 3. The maximum and minimum values of ACRE were 1.2 and 0.77, respectively. This shows that there is a certain gap in the efficiency of agricultural carbon emissions reduction in all provinces of China. The average broadband adoption rate was 22% and the minimum was 8.3%. According to the Communication Industry Statistical Bulletin, the proportion of fixed broadband access users in 2019 was 30%, an increase of 1.2 percentage points from the end of the previous year. Therefore, there remains much room for improvement in rural broadband access. The minimum number of computers per 100 households in rural areas was about 4 and the maximum number was about 75. This indicates a certain regional gap in the terminal application of rural broadband.
In Figure 2, there are four labels: (a), (b), (c), and (d). First, label (a) shows the rural broadband adoption rate of 30 provinces in 2011, 2015, and 2019. Over time, the broadband adoption rate demonstrated a divergent outward rise. Second, labels (b) to (d) show the spatial distribution of ACER in 2011, 2015, and 2019. In the spatial map, darker colors indicate higher ARCE and lighter colors indicate lower ARCE. The pattern of ARCE values across regions shows a gradual shift of high ACRE from the eastern and central regions to the central and western regions. In 2011, the regions with high ARCE were mainly the developed eastern coastal provinces and the large agricultural provinces in central China. Compared with 2011, ARCE in the central region represented by Jiangxi and Hunan and the western region represented by Yunnan and Sichuan was significantly higher than the national average in 2019, while that in the eastern coastal region was significantly lower than the national average. The main reason for the increase in carbon emission levels in western China is the rapid increase in high-carbon agricultural production activities in western China, and the relative decrease in eastern China. This is fitting because China has vigorously implemented the “Broadband Village” pilot project in western and central China since 2014. Specific provinces involved include Yunnan, Sichuan, Chongqing, Jiangxi, and Hunan.

4.2. Rural Broadband Adoption and ACRE

The purpose of this study was to investigate the impact of broadband adoption on agricultural carbon reduction efficiency. Table 4 shows the estimated effects of broadband adoption on ACRE and reports the core conclusions of this paper. Model (1) controls the individual dummy variables of provinces. The influence coefficient of the core independent variable (Broadband) was 0.201 and significant at 5%. Income had a significant negative impact on ACRE, that is, within a certain range of income, the income of rural residents significantly reduces the ACRE. However, Income squared had a significant positive impact on ACRE, such that when income exceeded a certain range, the increase in the income of rural residents was conducive to improving ACRE. This confirms the U-shaped relationship between rural residents’ income and ACRE, consistent with the EKC hypothesis. At the same time, this result preliminarily verifies H1 and H2. Broadband adoption significantly promotes ACRE. Models (2) and (3) report the results after adding other control variables. It can be seen that Broadband had the same positive impact on agricultural carbon emission reduction efficiency as the previous model, and it is significant at 5%. This indicates that the results in Table 4 have high stability and further verify H1. This may be because broadband adoption improve ACRE by promoting technological innovation, alleviating the distortion of industrial structure, and improving the efficiency of resource allocation [72]. In this paper, this is mainly mediated by direct effects and propagation effects. First, broadband adoption influence the rational use of inputs of factors through precision agriculture, thus reducing their adverse impact on the environment [32]. Second, regulating human environmental behavior through propagation effects contributes to significantly reducing CO2 emissions [73]. Therefore, broadband adoption can promote green agricultural production and achieve a significant improvement in ACRE. In terms of the positive impact of broadband adoption on the agricultural environment, our results were consistent with those by Ma and Zheng [46].
In addition, the scale of operation significantly affected ACRE. Possible reasons are as follows. First, the transfer of surplus agricultural labor concentrates cultivated land in the hands of the operators, causing a scale effect. This improves agricultural output, which is conducive to improving the enthusiasm of farmers for production standardization. Second, it provides intensive space for the large-scale socialization of agricultural services. Fragmented farmland is not conducive to increasing the scale of services, while larger scale production promotes cost reductions for green agricultural services. Agricultural economic status had a significant negative effect on ACRE. The reasons may be as follows. Areas with high agricultural economic status are the main grain-producing areas. With the goal of ensuring grain output, the concentrated input leads to pollution. Compared with non-major grain-producing areas, agricultural production activities in major grain-producing areas are more concentrated, and agricultural non-point source pollution per unit space increases with increasing production scale, resulting in greater environmental pollution. The degree of industrialization also had a significant effect on ACRE. This may be due to the crowding out of agriculture by industry to some extent. The development of industry requires the expansion of land in a large area, causing huge resource pressure for the development of agriculture. The frequency of natural disasters also negatively impacted ACRE. This may be explained by direct effects on the expected output and an impaired ability of agricultural activity to sequester carbon. Natural disasters may also negatively affect the motivation of farmers, including for green agricultural production. Therefore, considering agricultural development and ecological environmental protection under the goal of food security is a mainstream pursuit for current agricultural development.

4.3. Robustness Check

In order to verify the accuracy of the conclusion, it is necessary to test the robustness of the conclusion and replace the main independent variables. The computer penetration rate of rural residents (number of computers per 100 persons in rural areas) was used to replace the ratio of broadband adoption. Table 5 reports the impact of rural computer penetration on ACRE. The influence coefficient of computer penetration rate on ACRE is positive and significant at the 10% level. Therefore, the robustness test verifies that a larger rate of broadband adoption is associated with a more beneficial ACRE.

4.4. Endogeneity Problem

The core of this study is the nexus between broadband adoption and ACRE. However, an underlying endogeneity problem may occur. On one hand, there may be a reverse causality. If ACRE is higher in one province, it will have a spillover effect on the rest of the country, leading to a larger proportion of broadband adoption in other provinces. On the other hand, there may be some missing variables or measurement errors. These problems all lead to the underlying endogeneity problem. In order to alleviate and solve this problem, this paper uses the independent variable of a single lagged period and the heteroscedasticity-based recognition strategy for further estimation.

4.4.1. Independent Variable of One Lag Period

Referring to Yu et al. [74], this paper uses independent variables lagged by one period to solve the endogenous problems caused by mutual causality. The lagging broadband adoption has a close relationship with the current period and is not affected by the efficiency of ACRE in the current period. Therefore, we use lagged first-stage broadband adoption as an instrumental variable to solve the endogenous problem caused by the reverse causality effect. The results in Table 6 show that the coefficient of ACRE is positive when broadband adoption lags by a period. Compared with the baseline results in Table 4, the estimated coefficient for broadband adoption varies from 0.111 to 0.074 and is significant at the 5% level. This further demonstrates the robustness of our results. That is, broadband adoption plays an important role in promoting ACRE.

4.4.2. Recognition Strategy Based on Heteroscedasticity

To solve the endogenous problem, the heteroscedasticity-based recognition strategy from Lewbel [75] is adopted in this paper. This method uses the high-order moments of the data to generate a set of internal instrumental variables to improve the estimation validity, especially when the external validity of the instrumental variables is difficult to guarantee. According to Lewbel [75], recognition is achieved under two assumptions. First, the first-stage regression is performed on the benchmark econometric model, and the error obtained is heteroscedastic, which can be confirmed by the Breusch heteroscedasticity test. Second, there are covariates of the first-order and second-order errors that are independent of the conditional covariance. Table 7 reports the results of the instrumental variables. The results show that the F statistic of the first stage is greater than 10, indicating that there is no weak tool problem in the instrumental variables selected in this paper. The p-value of the Sargen-Baseman test statistic is greater than 0.05, which shows that all instrumental variables are exogenous and valid. Based on the above tests, it is concluded that the influence coefficient of broadband adoption on ACRE is 0.563, which is significant at the level of 5%. These results again demonstrate that the adoption of broadband can promote ACRE.

4.5. Further Analysis

Through the robustness and endogeneity analyses above, the relationship between rural broadband adoption and agricultural carbon emission reduction efficiency has been verified. However, existing studies have shown that compared with small farmers, land transfer operators are more likely to accept and adopt low-carbon agricultural technologies [55]. Information technology allows agricultural facilities to better realize the precision management of farmland to achieve carbon emissions reduction. Sun and Kim [76] found that ICTs effectively reduced CO2 intensity and spatial heterogeneity. Therefore, this paper further analyzes the moderating effects of land transfer (Ltr) and equipment investment (Equipment) on ACRE under the effect of broadband adoption, including further analysis of possible heterogeneity.

4.5.1. Moderating Effects

Table 8 reports the regression results of the two moderating effects. It can be seen from Model (8) that the influence coefficient of the interaction term (Broadband•Ltr) is greater than zero and achieves statistical significance at the 10% level. This means that a higher proportion of broadband adoption results in improved ARCE by increasing land transfer rate. This conclusion verifies H3. A possible explanation for this phenomenon is that land transfer promotes the possibility of scaling up operation, causing a scale effect and improving agricultural output. This is conducive to improving the enthusiasm of farmers for production standardization and also increasing investment in green technology to provide an economic basis for promoting green agricultural production.
The moderating effect of farmers’ investment is reported in model (9). The interaction (Broadband•Equipment) has an impact factor greater than zero and passes the significance test at 10%. Therefore, improvements in informatization level support greater farmers’ investment in production equipment, thus increasing ACRE. This conclusion verifies H4. This can be attributed to the increased accessibility to precision agriculture that is provided by broadband adoption. While equipment investment with low-level informatization cannot realize precision agriculture and therefore result in increased CO2 emissions, the adoption of broadband in rural areas facilitates greater precision agriculture, supporting yield growth and the rational use of inputs. Thus, precision agriculture supported by broadband adoption minimizes the adverse impact on the environment.

4.5.2. Heterogeneity Analysis

As previously described by Ma et al. [77], the provinces studied in this paper were grouped into three regions: western, central, and eastern. The results of spatial heterogeneity analysis are reported in Table 9. In eastern and central, broadband adoption has a positive effect on ACRE, but there was no significant effect in the west. Therefore, the western region is already making full use of the benefits brought by broadband infrastructure to expand the application of ICTs in agricultural and rural areas.

5. Conclusions

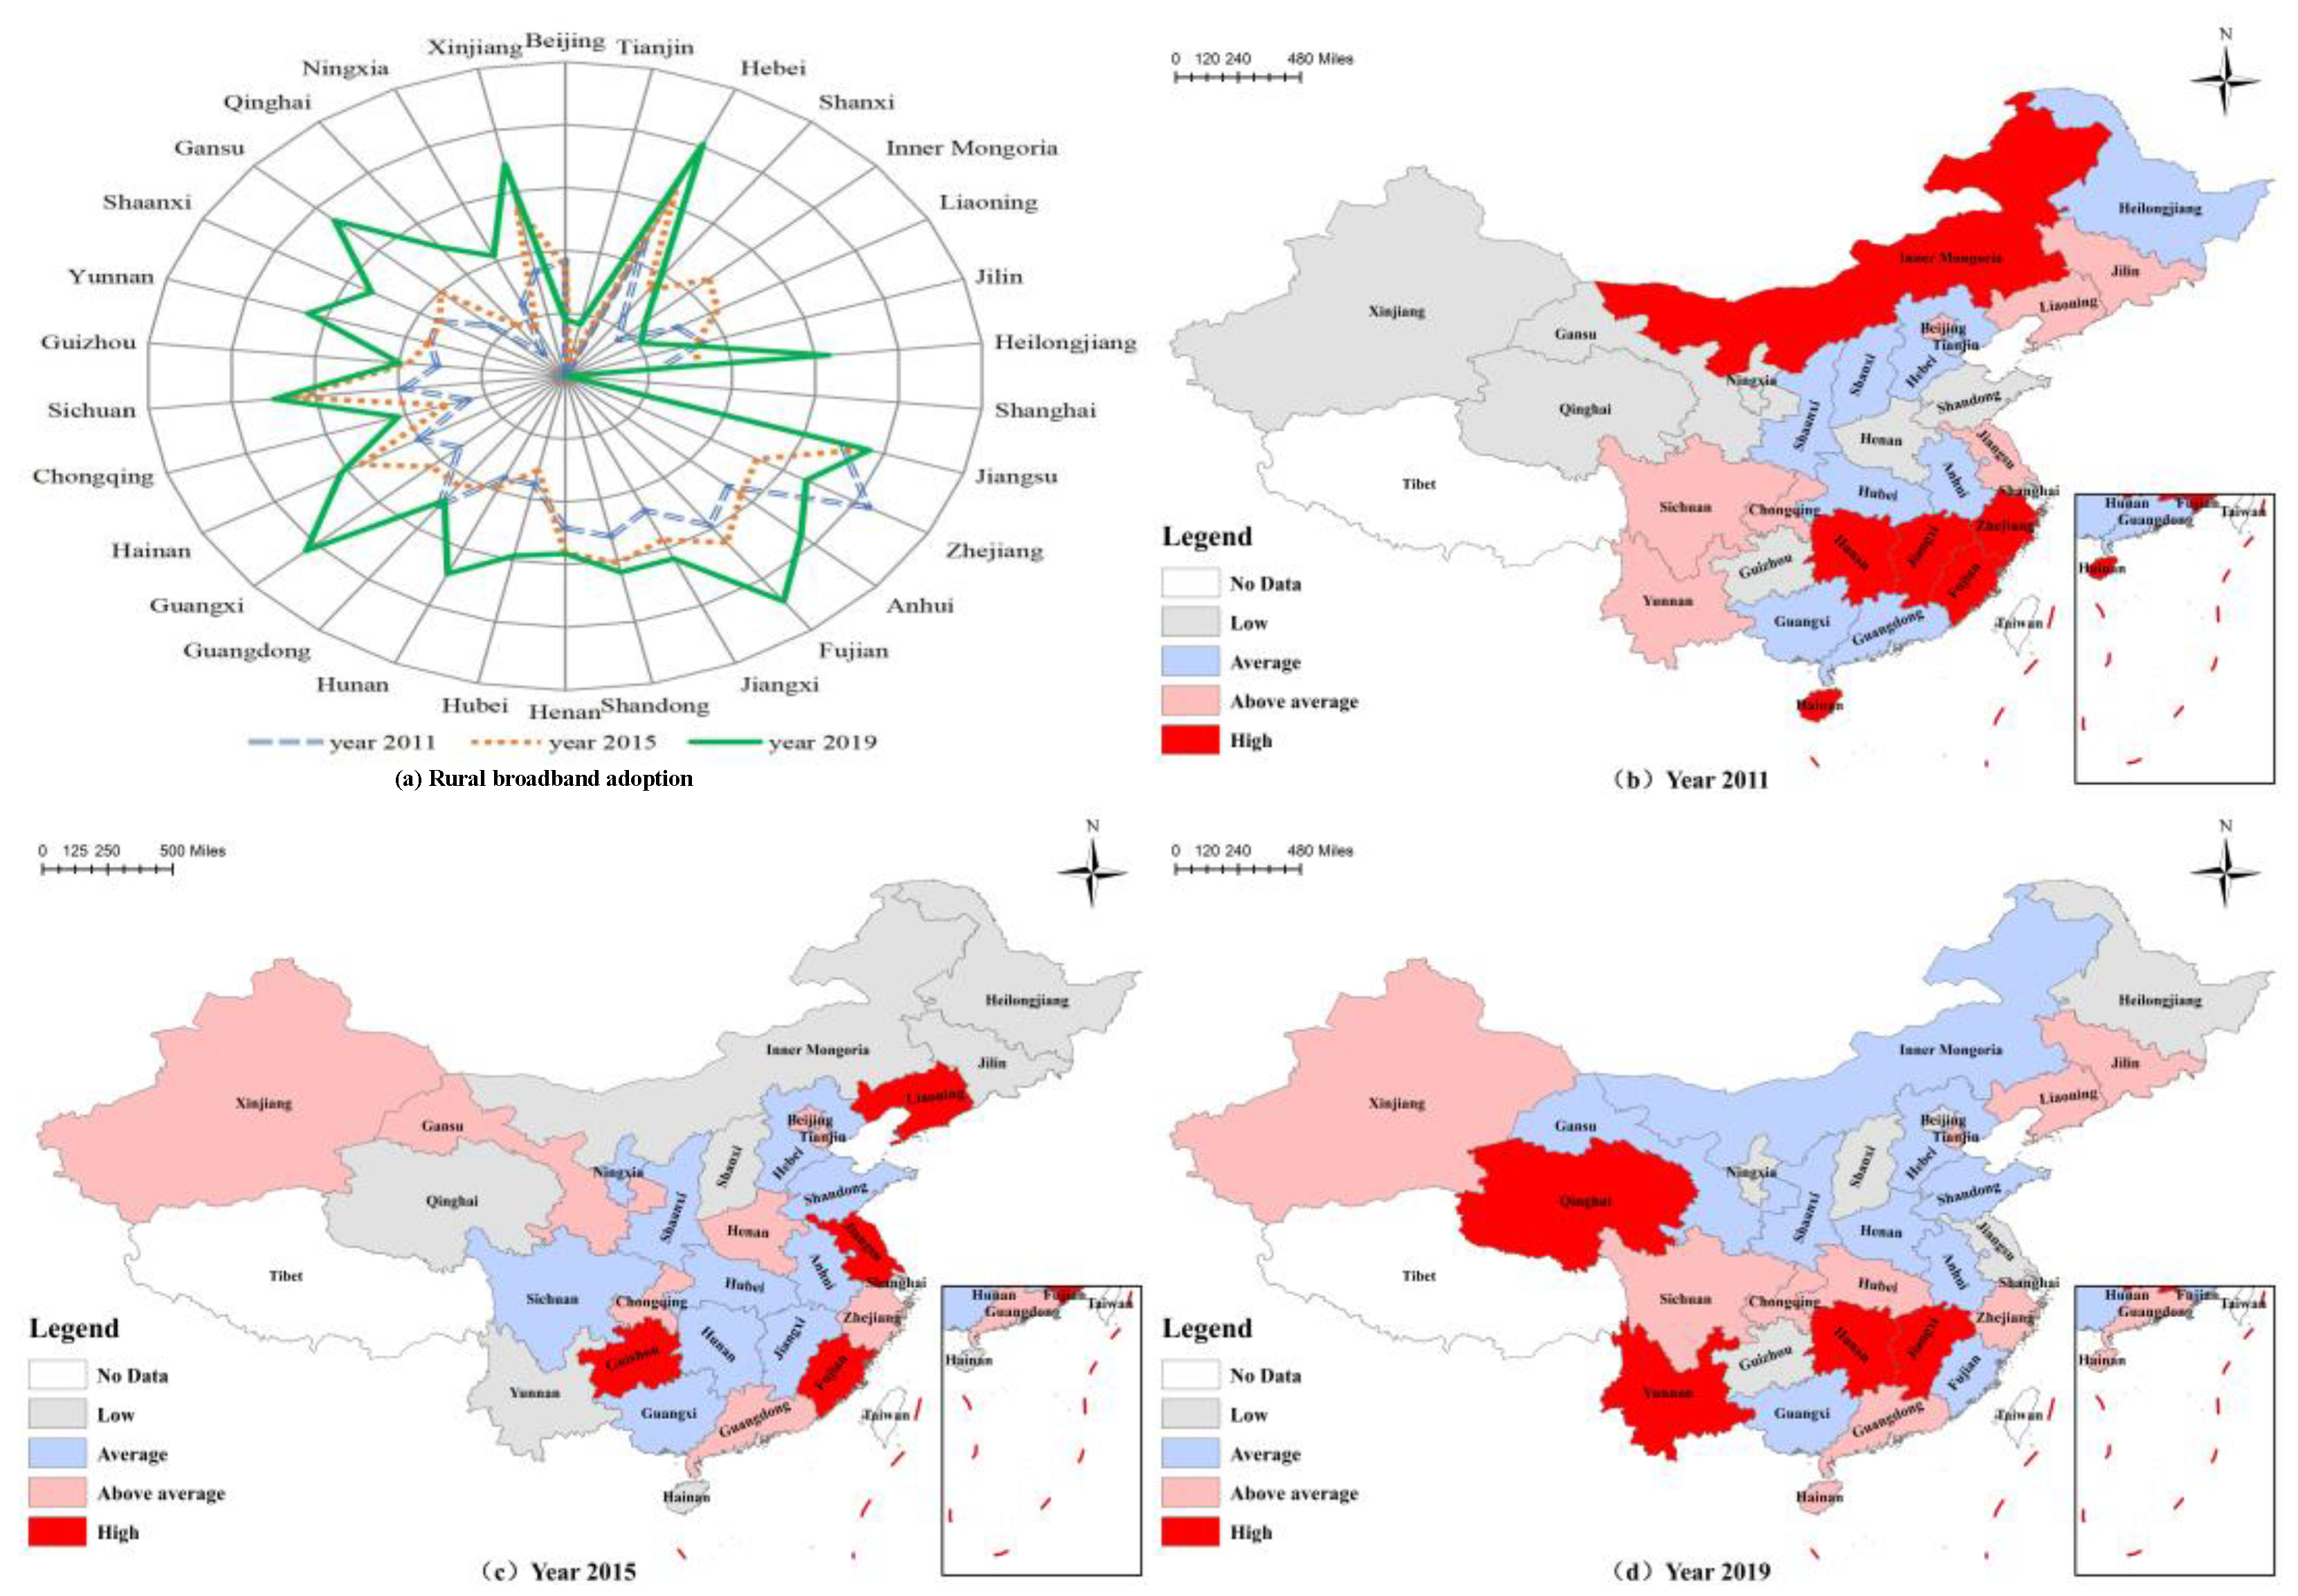
This study investigated the impact of rural broadband penetration on ACRE. Our provincial-level panel data demonstrated that the maximum and minimum values of ACRE were 1.2 and 0.77, indicating that there is a certain gap in the efficiency of agricultural carbon emissions reduction in all provinces of China. Further, the average broadband adoption rate was 22% and the minimum was 8.3%. Therefore, there remains much room for improvement in rural broadband access. In addition, the pattern of ARCE values across regions shows a gradual shift of high ACRE from the eastern and central regions to the central and western regions, which is similar to the results of He et al. and Yan et al. [78,79]. The main reason is that the agricultural production activities with high carbon emissions in the western region increased rapidly, while those in the eastern region decreased in comparison.
By looking into the direct impact of rural broadband adoption on ACRE and its related moderating effect, this study has generated a rich set of empirical findings. Firstly, based on the EKC hypothesis and considering the role of broadband adoption, our econometric results confirm the hypothesis that rural broadband adoption has a positive role in promoting agricultural carbon emissions reduction, supporting that which was reported in the literature [32,45,46]. Then, through further analysis of the mediation effect of land transfer and farmers’ investment in production equipment on ACRE, we found that the positive effect of broadband adoption on ACRE was more obvious when land transfer rates are high. This conclusion verifies the hypothesis that land transfer reduces the distortion degree of the factor market and has a regulating effect on ACRE. When farmers invest more in production equipment, the positive effect of broadband adoption is obvious. Finally, there was spatial heterogeneity between rural broadband adoption and ACRE. In eastern and central China, broadband adoption had a positive effect on ACRE, while in western China, broadband adoption had no significant effect. In particular, the SBM model and GML index method were used to measure ACRE, and the carbon sink of agricultural production was taken as one of the expected outputs, which was often ignored in previous studies.
The above empirical findings have several policy implications. (1) China is vigorously implementing the “Digital Villages” strategy, and a significant quantity of broadband infrastructure investment is gradually meeting the requirements of rural production and life. Therefore, future work will expand the application of ICTs at the production end of rural areas, advocate the use of broadband to connect farmers with green production and management and improve the efficiency of resource utilization. (2) The government should consider environmental externalities when formulating income redistribution policies. Transferring the surplus rural labor force can increase the income of rural families and enhance awareness of rural environmental protection, to realize the “win-win” of environmental protection and economic development. (3) Improving the land transfer rate is beneficial to increase the investment of green technology. At the same time, governments should continue to increase investment in intelligent agricultural production equipment. On the basis of the existing broadband infrastructure in rural areas, we should vigorously promote the use of information agricultural production equipment that is suitable for agricultural production, convenient for farmers, low cost, and simple to operate. (4) Rural broadband construction has lagged behind urban areas for a long time [80], so extra focus should be given to the promotion of household broadband penetration in developing areas. These areas can make good use of the Internet to improve energy efficiency and reduce the use of straw and coal in rural areas to reduce CO2 emissions.
Finally, it should be acknowledged that this work has some limitations. First, due to the lack of relevant data, our study only used broadband penetration to measure the application of ICTs development. To be more comprehensive, the application of ICTs development is measured in terms of infrastructure construction and utilization of ICTs. Therefore, in the following research, we will add indicators such as “network speed” and “Internet usage duration” to construct a comprehensive measurement of ICTs level. Second, this study investigated the impact of the application of ICTs on ACRE from a macro regional perspective. To further analyze the impact of the application of ICTs on the behavior of enterprises and farmers from a micro perspective, more representative samples should be used in future assessments of micro subjects’ behavior.

Author Contributions

P.R. contributed to the study design, data analysis, manuscript draft writing and manuscript revision. X.L. contributed to data curation and formal analysis. S.Z. contributed to the manuscript revision and supervision. X.K. and X.Z. contributed to the data collection. F.X. contributed to the project administration and manuscript revision. All authors have read and agreed to the published version of the manuscript.

Funding

This research was funded by the National Natural Science Foundation of China (Grant No. 42161053, 41701622 and 71840013), the Scientific Research Development Fund Project of Zhejiang A&F University (2022FR014), the Graduate Innovation Special Fund project of Jiangxi Province (Grant No. YC2021-B086) and Jiangxi Province Selenium-rich Agriculture Special Project 2021 (JXFXZD-2021-02).

Institutional Review Board Statement

Not applicable.

Informed Consent Statement

Informed consent was obtained from all subjects involved in the study.

Data Availability Statement

The study did not report any data.

Conflicts of Interest

The authors declare no conflict of interest.

References

  1. Zhou, X.; Huang, G.; Piwowar, J.; Fan, Y.; Wang, X.; Li, Z.; Cheng, G. Hydrologic impacts of ensemble RCMs-projected climate changes in the Athabasca River Basin, Canada. J. Hydrometeorol. 2018, 19, 1953–1973. [Google Scholar] [CrossRef] [Green Version]
  2. Zhou, X.; Huang, G.; Li, Y.; Lin, Q.; Yan, D.; He, X. Dynamical downscaling of Temperature Variations over the Canadian Prairie Provinces under Climate Change. Remote Sens. 2021, 13, 4350. [Google Scholar] [CrossRef]
  3. World Bank. Growth and CO2 Emissions: How Do Different Countries Fare? Environment Department: Washington, DC, USA, 2007; Available online: https://www.uncclearn.org/wp-content/uploads/library/wb05.pdf (accessed on 27 April 2020).
  4. Lu, L.; Cheng, H.; Pu, X.; Wang, J.; Cheng, Q.; Liu, X. Identifying organic matter sources using isotopic ratios in a watershed impacted by intensive agricultural activities in Northeast China. Agric. Ecosyst. Environ. 2016, 222, 48–59. [Google Scholar] [CrossRef]
  5. Kumbhakar, S.C.; Denny, M.; Fuss, M. Estimation and decomposition of productivity change when production is not efficient: A paneldata approach. Econom. Rev. 2000, 19, 312–320. [Google Scholar] [CrossRef]
  6. Wang, H.; Cui, H.; Zhao, Q. Effect of green technology innovation on green total factor productivity in China: Evidence from spatial durbin model analysis. J. Clean. Prod. 2021, 288, 125624. [Google Scholar] [CrossRef]
  7. Zhu, X.K.; Hu, R.F.; Zhang, C.; Shi, G.M. Does Internet use improve technical efficiency? Evidence from apple production in China. Technol. Forecast. Soc. Chang. 2021, 166, 120662. [Google Scholar] [CrossRef]
  8. Zhang, Y.; Wang, L.; Duan, Y.Q. Agricultural information dissemination using ICTs: A review and analysis of information dissemination models in China. Inf. Processing Agric. 2016, 3, 17–29. [Google Scholar] [CrossRef] [Green Version]
  9. Leonard, E.; Rainbow, R.; Trindall, J.; Baker, I.; Barry, S.; Darragh, L.; Andrew George, R.D.; Heath, R.; Jakku, E.; Laurie, A.; et al. Accelerating Precision Agriculture to Decision Agriculture: Enabling Digital Griculture in Australia; Cotton Research and Development Corporation: Narrabri, Australia, 2017.
  10. ARIEAC (Agricultural and Rural Informatization Expert Advisory Committee). China Digital Rural Development Report. 2020. Available online: http://www.cqxumu.com/upload/2020/11/637423294227055808.pdf (accessed on 13 October 2021).
  11. Cheng, Y.; Lv, K.; Wang, J.; Xu, H. Energy efficiency, carbon dioxide emission efficiency and related abatement costs in regional china: A synthesis of input-output analysis and DEA. Energy Effic. 2018, 12, 863–877. [Google Scholar] [CrossRef]
  12. Liang, D.; Tian, Z.; Ren, F.; Pan, J. Installed hydropower capacity and carbon emission reduction efficiency based on the ebm method in china. Front. Energy Res. 2020, 8, 82. [Google Scholar] [CrossRef]
  13. Tone, K. A slacks-based measure of efficiency in data envelopment analysis. Eur. J. Oper. Res. 2001, 130, 498–509. [Google Scholar] [CrossRef] [Green Version]
  14. Chambers, R.G.; Chung, Y.; Färe, R. Benefit and distance functions. J. Econ. Theory 1996, 70, 407–419. [Google Scholar] [CrossRef]
  15. Chung, Y.H.; Fare, R. Productivity and undesirable outputs: A directional distance function approach. Microeconomics 1997, 51, 229–240. [Google Scholar] [CrossRef] [Green Version]
  16. Oh, D.H. A global Malmquist-Luenberger productivity index. J. Prod. Anal. 2010, 34, 183–197. [Google Scholar] [CrossRef]
  17. Yang, H.; Wang, X.; Peng, B. Agriculture carbon-emission reduction and changing factors behind agricultural eco-efficiency growth in China. J. Clean. Prod. 2021, 334, 130193. [Google Scholar] [CrossRef]
  18. Li, M.; Wang, J. Spatial-temporal distribution characteristics and driving mechanism of green total factor productivity in China’s logistics industry. Pol. J. Environ. Stud. 2020, 30, 201–213. [Google Scholar] [CrossRef]
  19. Guo, B.; He, D.; Zhao, X.; Zhang, Z.; Dong, Y. Analysis on the spatiotemporal patterns and driving mechanisms of China’s agricultural production efficiency from 2000 to 2015. Phys. Chem. Earth Parts A/B/C 2020, 120, 102909–102916. [Google Scholar] [CrossRef]
  20. Humpenoder, F.; Popp, A.; Dietrich, J.; Klein, D.L.; Lotze-Campen, H.; Bonsch, M.; Bodirsky, B.L.; Weindl, I.; Stevanovic, M.; Müller, C. Investigating afforestation and bioenergy CCS as climate change mitigation strategies. Environ. Res. Lett. 2014, 9, 064029. [Google Scholar] [CrossRef]
  21. Zhang, X.; Davidson, E.; Mauzerall, D.; Searchinger, T.D.; Dumas, P.; Shen, Y. Managing nitrogen for sustainable development. Nature 2015, 528, 51. [Google Scholar] [CrossRef] [Green Version]
  22. Zhang, W.F.; Cao, G.X.; Li, X.L.; Zhang, H.; Wang, C.; Liu, Q.; Chen, X.; Cui, Z.; Shen, J.; Jiang, R.; et al. Closing yield gaps in China by empowering smallholder farmers. Nature 2016, 537, 671–674. [Google Scholar] [CrossRef]
  23. Liu, D.D.; Zhu, X.Y.; Wang, Y.F. China’s agricultural green total factor productivity based on carbon emission: An analysis of evolution trend and influencing factors. J. Clean. Prod. 2020, 278, 123692. [Google Scholar] [CrossRef]
  24. Chen, L.; Zhang, J.; Ke, H. Different spatial impacts of agricultural industrial agglomerations on carbon efficiency: Mechanism, spatial effects and groups differences. J. Chin. Agricult. Univ. 2018, 23, 224–236. (In Chinese) [Google Scholar] [CrossRef]
  25. Stevanović, M.; Popp, A.; Bodirsky, B.; Humpenöder, F.; Müller, C.; Weindl, I.; Dietrich, J.P.; Lotze-Campen, H.; Kreidenweis, U.; Rolinski, S.; et al. Mitigation Strategies for Greenhouse Gas Emissions from Agriculture and Land-Use Change: Consequences for Food Prices. Environ. Sci. Technol. 2016, 51, 365–374. [Google Scholar] [CrossRef] [PubMed]
  26. Bodirsky, B.; Popp, A.; Lotze-Campen, H.; Dietrich, J.P.; Rolinski, S.; Weindl, I.; Schmitz, C.; Müller, C.; Bonsch, M.; Humpenöder, F.; et al. Reactive nitrogen requirements to feed the world in 2050 and potential to mitigate nitrogen pollution. Nat. Commun. 2014, 5, 4858. [Google Scholar] [CrossRef] [Green Version]
  27. Shewmake, S.; Okrent, A.; Thabrew, L.; Vandenbergh, M. Predicting consumer demand responses to carbon labels. Ecol. Econ. 2015, 119, 168–180. [Google Scholar] [CrossRef]
  28. Briggs, A.; Kehlbacher, A.; Tiffin, R.; Garnett, T.; Rayner, M.; Scarborough, P. Assessing the impact on chronic disease of incorporating the societal cost of greenhouse gases into the price of food: An econometric and comparative risk assessment modelling study. BMJ Open 2013, 3, e003543. [Google Scholar] [CrossRef] [PubMed] [Green Version]
  29. Munthali, N.; Leeuwis, C.; van Paassen, A.; Lie, R.; Asare, R.; van Lammeren, R.; Schut, M. Innovation intermediation in a digital age: Comparing public and private new-ICT platforms for agricultural extension in Ghana. NJAS-Wagen J. Life Sci. 2018, 86, 64–76. [Google Scholar] [CrossRef]
  30. Imran, M.; Ali, A.; Ashfaq, M.; Hassan, S.; Culas, R.; Ma, C. Impact of climate smart agriculture (CSA) through sustainable irrigation management on Resource use efficiency: A sustainable production alternative for cotton. Land Use Pol. 2019, 88, 165–178. [Google Scholar] [CrossRef]
  31. Qiang, C.Z.; Kuek, S.C.; Dymond, A.; Esselaar, S. Mobile Applications for Agriculture and Rural Development; World Bank Other Operational Studies: Washington, DC, USA, 2012; pp. 61–88. Available online: http://documents.worldbank.org/curated/en/167301467999716265/pdf/96226-REVISED-WP-PUBLIC-Box391469B-Mobile-Applications-for-ARD-v8S-Complete.pdf (accessed on 21 May 2021).
  32. Jurjević, A.; Bogievi, I.; Oki, D.; Matkovski, B. Information technology as a factor of sustainable development of Serbian agriculture. Strateg. Manag. 2019, 24, 41–46. [Google Scholar] [CrossRef]
  33. Lioutas, E.; Charatsari, C. Big data in agriculture: Does the new oil lead to sustainability? Geoforum 2020, 109, 1–3. [Google Scholar] [CrossRef]
  34. Manlove, J.; Shew, A.; Obembe, O. Arkansas producers value upload speed more than download speed for precision agriculture applications. Comput. Electron. Agric. 2021, 190, 106432. [Google Scholar] [CrossRef]
  35. Akerman, A.; Gaarder, I.; Mogstad, M. The Skill Complementarity of Broadband Internet. Q. J. Econ. 2015, 130, 1781–1824. [Google Scholar] [CrossRef] [Green Version]
  36. Fabling, R.; Grimes, A. Picking up Speed: Does Ultrafast Broadband Increase Firm Productivity? Inf. Econ. Policy 2021, 57, 100937. [Google Scholar] [CrossRef]
  37. Rao, P.; Xie, F.; Zhu, S.; Ning, C.; Liu, X. Effect of Broadband Infrastructure on Rural Household CO2 Emissions in China: A Quasi-Natural Experiment of a “Broadband Village”. Front. Environ. Sci. 2022, 10, 818134. [Google Scholar] [CrossRef]
  38. Sanders, C.E.; Gibson, K.E.; Lamm, A.J. Rural broadband and precision agriculture: A frame analysis of United States Federal policy outreach under the Biden administration. Sustainability 2022, 14, 460. [Google Scholar] [CrossRef]
  39. Wan, D.; Ma, M.K.; Peng, N.; Luo, X.; Chen, W.; Cai, P.; Wu, L.; Pan, H.; Chen, J.; Yu, G.; et al. Effects of long-term fertilization on calcium-associated soil organic carbon: Implications for C sequestration in agricultural soils. Sci. Total Environ. 2021, 772, 145037. [Google Scholar] [CrossRef] [PubMed]
  40. Wang, Y.C.; Tao, F.L.; Chen, Y.; Yin, L.C. Interactive impacts of climate change and agricultural management on soil organic carbon sequestration potential of cropland in China over the coming decades. Sci. Total Environ. 2022, 817, 153018. [Google Scholar] [CrossRef]
  41. Garske, B.; Bau, A.; Ekardt, F. Digitalization and AI in European Agriculture: A Strategy for Achieving Climate and Biodiversity Targets? Sustainability 2021, 13, 4652. [Google Scholar] [CrossRef]
  42. van Evert, F.; Gaitán-Cremaschi, D.; Fountas, S.; Kempenaar, C. Can Precision Agriculture Increase the Profitability and Sustainability of the Production of Potatoes and Olives? Sustainability 2017, 9, 1863. [Google Scholar] [CrossRef] [Green Version]
  43. Balafoutis, A.; Beck, B.; Fountas, S.; Vangeyte, J.; Van Der Wal, T.; Soto, I.; Gómez-Barbero, M.; Barnes, A.; Eory, V. Precision agriculture technologies positively contributing to GHG emissions Mitigation, farm productivity and economics. Sustainability 2017, 9, 1339. [Google Scholar] [CrossRef] [Green Version]
  44. Lieder, S.; Schröter-Schlaack, C. Smart Farming Technologies in Arable Farming: Towards a Holistic Assessment of Opportunities and Risks. Sustainability 2021, 13, 6783. [Google Scholar] [CrossRef]
  45. Wang, Q.; Zhang, W.; Tseng, M.L.; Sun, Y.; Zhang, Y. Intention in use recyclable express packaging in consumers’ behavior: An empirical study. Res. Conserv. Recycl. 2021, 164, 105115. [Google Scholar] [CrossRef]
  46. Ma, W.; Zheng, H. Heterogeneous impacts of information technology adoption on pesticide and fertiliser expenditures: Evidence from wheat farmers in China. Aust. J. Agric. Resour. Econ. 2021, 59, 1–21. [Google Scholar] [CrossRef]
  47. Xu, D.D.; Zhou, W.F.; Deng, X.; Ma, Z.X.; Yong, Z.L.; Qin, C. Information credibility, disaster risk perception and evacuation willingness of rural households in China. Nat. Hazards 2020, 103, 2865–2882. [Google Scholar] [CrossRef]
  48. Jiang, Z.H.; Han, J.; Liu, W.Z.; Chen, Z.; Li, N.; Wang, S.Y.; Xiao, Z.; Chang, L. Energy internet—A new driving force for sustainable urban development. Energy Procedia 2018, 152, 1206–1211. [Google Scholar] [CrossRef]
  49. Li, F.D.; Yang, P.; Zhang, K.J.; Yin, Y.S.; Zhang, Y.N.; Yin, C. The influence of smartphone use on conservation agricultural practice: Evidence from the extension of rice-green manure rotation system in China. Sci. Total Environ. 2022, 813, 152555. [Google Scholar] [CrossRef]
  50. Grossman, G.M.; Krueger, A.B. Environmental impacts of a north American free trade agreement. CEPR Discuss. Pap. 1992, 8, 223–250. [Google Scholar] [CrossRef]
  51. Grossman, G.M.; Krueger, A.B. Economic growth and the environment. Nber Work. Pap. 1995, 110, 353–377. [Google Scholar] [CrossRef] [Green Version]
  52. Deng, J.L.; Li, T. The impact of socio-economic institutional change on agricultural carbon dioxide emission reduction in China. PLoS ONE 2021, 16, e0251816. [Google Scholar] [CrossRef]
  53. Song, B.; Mu, Y.Y.; Hou, L.L. Study on the effect of farm households’ specialization on low-carbon agriculture: Evidence from vegetable growers in Beijing, China. J. Nat. Resour. 2016, 31, 468–476. (In Chinese) [Google Scholar]
  54. Fei, R.; Lin, Z.; Chunga, J. How land transfer affects agricultural land use efficiency: Evidence from China’s agricultural sector. Land Use Pol. 2021, 103, 105300. [Google Scholar] [CrossRef]
  55. Bao, X.; Xing, X. Evaluation of green logistics system of solid waste at ports based on analytic hierarchy process. Environ. Eng. Manag. J. 2019, 18, 2491–2499. Available online: http://www.eemj.icpm.tuiasi.ro/pdfs/vol18/full/no11/17_253_Bao_19.pdf (accessed on 16 January 2022). [CrossRef]
  56. Lee, C.L.; Strong, R.; Dooley, K.E. Analyzing precision agriculture adoption across the globe: A systematic review of scholarship from 1999–2020. Sustainability 2021, 13, 10295. [Google Scholar] [CrossRef]
  57. Tone, K. Dealing with Undesirable Outputs in DEA: A Slacks-Based Measure (SBM) Approach. Presentation at NAPW III. Toronto, Canada. 2004, pp. 44–45. Available online: www.orsj.or.jp/~archive/pdf/a_s/2004_044.pdf (accessed on 3 December 2021).
  58. Pastor, J.T.; Lovell, C. A global malmquist productivity index. Econ. Lett. 2005, 88, 266–271. [Google Scholar] [CrossRef]
  59. Liu, Z.K.; Xin, L. Has China’s belt and road initiative promoted its green total factor productivity—Evidence from primary provinces along the route. Energy Pol. 2019, 129, 360–369. [Google Scholar] [CrossRef]
  60. Cheng, J.; Yi, J.; Dai, S.; Xiong, Y. Can low-carbon city construction facilitate green growth? Evidence from China’s pilot low-carbon city initiative. J. Clean. Prod. 2019, 231, 1158–1170. [Google Scholar] [CrossRef]
  61. Li, D.S.; Zhang, Z.Q.; Fu, L.; Guo, S.D. Regional differences in PM2.5 emission reduction efficiency and their influencing mechanism in Chinese cities. China Popul. Resour. Environ. 2021, 31, 74–85. (In Chinese) [Google Scholar] [CrossRef]
  62. Meng, M.; Qu, D. Understanding the green energy efficiencies of provinces in China: A Super-SBM and GML analysis. Energy 2022, 239, 121912. [Google Scholar] [CrossRef]
  63. Koutroumpis, P. The economic impact of broadband on growth: A simultaneous approach. Telecommun. Policy 2009, 33, 471–485. [Google Scholar] [CrossRef]
  64. Zhang, J. How rural broadband popularization affects rural high-quality development: Theoretical mechanism and empirical identification. Financ. Trade Res. 2020, 31, 13. (In Chinese) [Google Scholar] [CrossRef]
  65. Zhang, C.Y.; Chang, Q.; Huo, X.X. Can the moderate-scale management really reduce the production costs of agricultural products?—An empirical analysis based on 661 Shaanxi apple farmers. J. Agrotech. Econ. 2018, 10, 26–35. (In Chinese) [Google Scholar] [CrossRef]
  66. Lin, B.; Chen, Z. Does factor market distortion inhibit the green total factor productivity in China? J. Clean. Prod. 2018, 197, 25–33. [Google Scholar] [CrossRef]
  67. Guo, Y.; Tong, L.; Mei, L. The effect of industrial agglomeration on green development efficiency in Northeast China since the revitalization. J. Clean. Prod. 2020, 258, 120584. [Google Scholar] [CrossRef]
  68. Yuan, H.; Feng, Y.; Lee, C.C.; Cen, Y. How does manufacturing agglomeration affect green economic efficiency? Energy Econ. 2020, 92, 104944. [Google Scholar] [CrossRef]
  69. Khanal, U.; Wilson, C.; Rahman, S.; Lee, B.L.; Hoang, V.N. Smallholder farmers’ adaptation to climate change and its potential contribution to UN’s sustainable development goals of zero hunger and no poverty. J. Clean. Prod. 2021, 281, 124999. [Google Scholar] [CrossRef]
  70. Suresh, K.; Khanal, U.; Wilson, C.; Managi, S.; Quayle, A.; Santhirakumar, S. An economic analysis of agricultural adaptation to climate change impacts in Sri Lanka: An endogenous switching regression analysis. Land Use Pol. 2021, 109, 105601. [Google Scholar] [CrossRef]
  71. Tang, K.; Gong, C.; Wang, D. Reduction potential, shadow prices, and pollution costs of agricultural pollutants in China. Sci. Total Environ. 2016, 541, 42–50. [Google Scholar] [CrossRef]
  72. Xu, Q.; Zhong, M.R.; Cao, M.Y. Does digital investment affect carbon efficiency? Spatial effect and mechanism discussion. Sci. Total Environ. 2022, 827, 154321. [Google Scholar] [CrossRef]
  73. Nakatani, R. Total factor productivity enablers in the ICT industry: A cross-country firm-level analysis. Telecommun. Policy 2021, 45, 102188. [Google Scholar] [CrossRef]
  74. Yu, D.; Li, X.; Yu, J.; Li, H. The impact of the spatial agglomeration of foreign direct investment on green total factor productivity of Chinese cities. J. Environ. Manag. 2021, 290, 112666. [Google Scholar] [CrossRef]
  75. Lewbel, A. Using heteroscedasticity to identify and estimate mismeasured and endogenous regressor models. J. Bus. Econ. Stat. 2012, 30, 67–80. [Google Scholar] [CrossRef]
  76. Sun, H.Y.; Kim, G. The composite impact of ICT industry on lowering carbon intensity: From the perspective of regional heterogeneity. Technol. Soc. 2021, 66, 101661. [Google Scholar] [CrossRef]
  77. Ma, W.; Wei, F.; Zhang, J.; Karthe, D.; Opp, C. Green water appropriation of the cropland ecosystem in china. Sci. Total Environ. 2022, 806, 150597. [Google Scholar] [CrossRef]
  78. He, Y.Q.; Chen, R.; Wu, H.Y.; Xu, J.; Song, Y. Spatial dynamics of agricultural carbon emissions in China and the related driving factors. China J. Eco-Agric. 2018, 26, 1269–1282. (In Chinese) [Google Scholar]
  79. Yan, T.W.; Tian, Y.; Zhang, J.B.; Wang, Y. Research on inflection point change and spatial and temporal variation of China’s agricultural carbon emissions. China Popul. Resour. Envion. 2014, 24, 1–8. (In Chinese) [Google Scholar]
  80. Liu, C.; Wang, L. Who is left behind? Exploring the characteristics of China’s broadband non-adopting families. Telecommun. Policy 2021, 45, 102187. [Google Scholar] [CrossRef]
Figure 1. Theoretical model of this study.
Ijerph 19 07844 g001
Figure 2. Spatial distribution of provincial rural broadband adaption and ACRE. Notes: There are four labels: (ad).
Ijerph 19 07844 g002
Table 1. Agricultural carbon reduction efficiency measurement index system.
TypeIndicator AbbreviationsIndicator Index
Input indicatorsLabor inputNumber of First-born Employees (10,000 persons)
Land inputAgricultural Sown Area (1000 Ha)
Mechanical inputTotal power of agricultural machinery (10,000 kW)
Fertilizer inputApplication amount of agricultural chemical fertilizer (10,000 tons)
Pesticide inputPesticide usage (10,000 tons)
Plastic film inputPlastic film usage (10,000 tons)
Irrigation inputEffective irrigation Area (1000 Ha)
Output indicatorsDesirable outputGross output value of Agriculture, Forestry, Animal Husbandry and Fishery (100 million Yuan)
Agricultural carbon sink (10,000 tons)
Undesirable outputAgricultural CO2 Emissions (10,000 tons)
Table 2. Variables definition.
Variable NameSymbolVariable Definition
Agricultural carbon reduction efficiencyACREAccumulated value of carbon reduction efficiency of regional agriculture
Rural broadband adoptionBroadbandRatio of regional rural broadband users to regional total users
Rural household computer penetration rateComputerRural household computer penetration rate, that is, per 100 households computer ownership (sets/100 persons)
rural disposable incomeIncomeNatural logarithm of rural per capita disposable income
rural disposable income squareIncome squareNatural logarithm of rural per capita disposable income square
Operation scaleScaleSown area/total labor in planting industry (hectares/person)
Agricultural economic statusStatusLocation quotient: The ratio of the agricultural output value to the national agricultural output value divided by the ratio of the gross product of the province to the national gross product
Industrial added valueIndustrializationNatural logarithm of industrial added value
Ratio of disasterDamageRatio of disaster area to sown area
Land transferLtrRatio of circulation area to household contracted arable land area
Equipment investmentEquipmentRatio of production equipment investment to fixed assets investment of rural households
Table 3. Descriptive statistics.
Variable SymbolNMeanSDMinMax
ACRE2701.000.060.771.20
Broadband2700.220.100.080.44
Computer27025.3314.454.0474.70
income2709.300.418.3010
income square270877.6068108
Scale2704.202.400.5315
Status2701.200.680.044.10
Industrialization2708.800.976.2011
Damage2700.150.120.0060.62
Ltr2700.310.160.030.87
Equipment2700.160.130.0030.68
Note: 1. See Table 2 for definitions of the Explained variables; 2. One USD was about 6.65 Chinese yuan as of December 2010.
Table 4. Rural broadband adoption and agricultural carbon reduction efficiency.
(1)(2)(3)
ACREACREACRE
Broadband0.201 **0.111 **0.210 **
(2.30)(2.30)(2.42)
Income−0.889 ***−0.608 ***−1.101 ***
(−2.87)(−3.12)(−3.62)
income square0.047 ***0.032 ***0.057 ***
(2.84)(3.01)(3.51)
Scale 0.004 **0.012
(2.35)(1.20)
Status −0.020 ***−0.003
(−3.69)(−0.25)
Industrialization −0.005−0.014
(−1.39)(−0.70)
Damage −0.101 *−0.137 *
(−1.81)(−1.73)
_Cons5.163 ***3.979 ***6.358 ***
(3.61)(4.46)(4.69)
N270270270
Province FEYESNOYES
Year FENONOYES
R-squared0.0330.1270.085
Note: 1. See Table 2 for definitions of the variables; 2. *** p < 0.01, ** p < 0.05, and * p < 0.1; 3. Robust t-statistics in parentheses.
Table 5. Robustness analysis: Replacing the main independent variable.
(4)
ACRE
Computer0.011 *
(1.92)
Other control variablesControl
_Cons3.196 *
(1.87)
N270
Province FEYes
Year FENO
R-squared0.054
Note: 1. See Table 2 for definitions of the variables and other control variables; 2. *** p < 0.01, ** p < 0.05, and * p < 0.1; 3. Robust t-statistics in parentheses.
Table 6. Endogeneity problem: The independent variable lag for one period.
(5)(6)
ACREACRE
Broadband0.074 *0.093 *
(1.78)(1.69)
income−0.683 ***−1.055 **
(−3.23)(−2.45)
income square0.035 ***0.054 **
(3.09)(2.31)
Scale0.004 **0.015
(2.51)(1.12)
Status−0.020 ***0.028
(−4.40)(1.40)
Industrialization−0.003−0.012
(−0.76)(−0.48)
Damage−0.105 *−0.146
(−1.67)(−1.59)
_Cons4.339 ***6.168 ***
(4.48)(3.17)
N240240
Province FEYesNo
Year FENoNo
R-squared0.0610.021
Note: 1. See Table 2 for definitions of the variables; 2. *** p < 0.01, ** p < 0.05, and * p < 0.1; 3. Robust t-statistics in parentheses.
Table 7. Endogenous treatment: Lewbel [75].
(7)
ACRE
Broadband0.563 **
(2.20)
Other control variablesControl
_Cons0.901 ***
(6.04)
N270
Province FEYes
Year FEYes
R-squared0.792
First-Stage F-Statistic12.399
Sargan Statistic16.380
p-value0.063
Note: 1. See Table 2 for definitions of the variables; 2. *** p < 0.01, ** p < 0.05, and * p < 0.1; 3. Robust t-statistics in parentheses.
Table 8. Moderating effect results.
(8) (9)
ACRE ACRE
Broadband0.124 **Broadband0.181 **
(2.13) (1.85)
Ltr0.019Equipment−0.096 **
(0.92) (−2.47)
Broadband•Ltr0.387 *Broadband•Equipment0.475 *
(2.01) (1.68)
income−0.810 ***income−0.637 ***
(−3.72) (−3.02)
income square0.025 ***income square0.024 ***
(2.71) (2.95)
Scale0.002Scale0.007
(1.16) (0.75)
Status−0.003Status0.001
(−0.21) (0.47)
Industrialization−0.017Industrialization−0.006
(−0.81) (−1.32)
Damage−0.074 *Damage−0.149 *
(−1.76) (−1.98)
_Cons5.916 ***_Cons6.036 ***
(4.32) (3.92)
N270N270
Province FEYesProvince FEYes
Year FEYesYear FEYes
R-squared0.059R-squared0.137
Note: 1. See Table 2 for definitions of the variables; 2. ***p < 0.01, **p < 0.05, and *p < 0.1; 3. Robust t-statistics in parentheses.
Table 9. Heterogeneity analysis results.
(Western)(Central)(Eastern)
ACREACREACRE
Broadband0.1970.089 *0.115 *
(1.09)(1.81)(1.74)
Other control variablesControlControlControl
_Cons3.9364.663 ***8.188 *
(1.51)(2.91)(1.84)
N8110881
Province FENoNoNo
Year FEYesYesYes
R-squared0.2210.0570.047
Note: 1. See Table 2 for definitions of the variables; 2. *** p < 0.01, ** p < 0.05, and * p < 0.1; 3. Robust t-statistics in parentheses.
Publisher’s Note: MDPI stays neutral with regard to jurisdictional claims in published maps and institutional affiliations.

