
Spatial Inequalities and Influencing Factors of Self-Rated Health and Perceived Environmental Hazards in a Metropolis: A Case Study of Zhengzhou City, China

Abstract
:1. Introduction
2. Materials and Methods
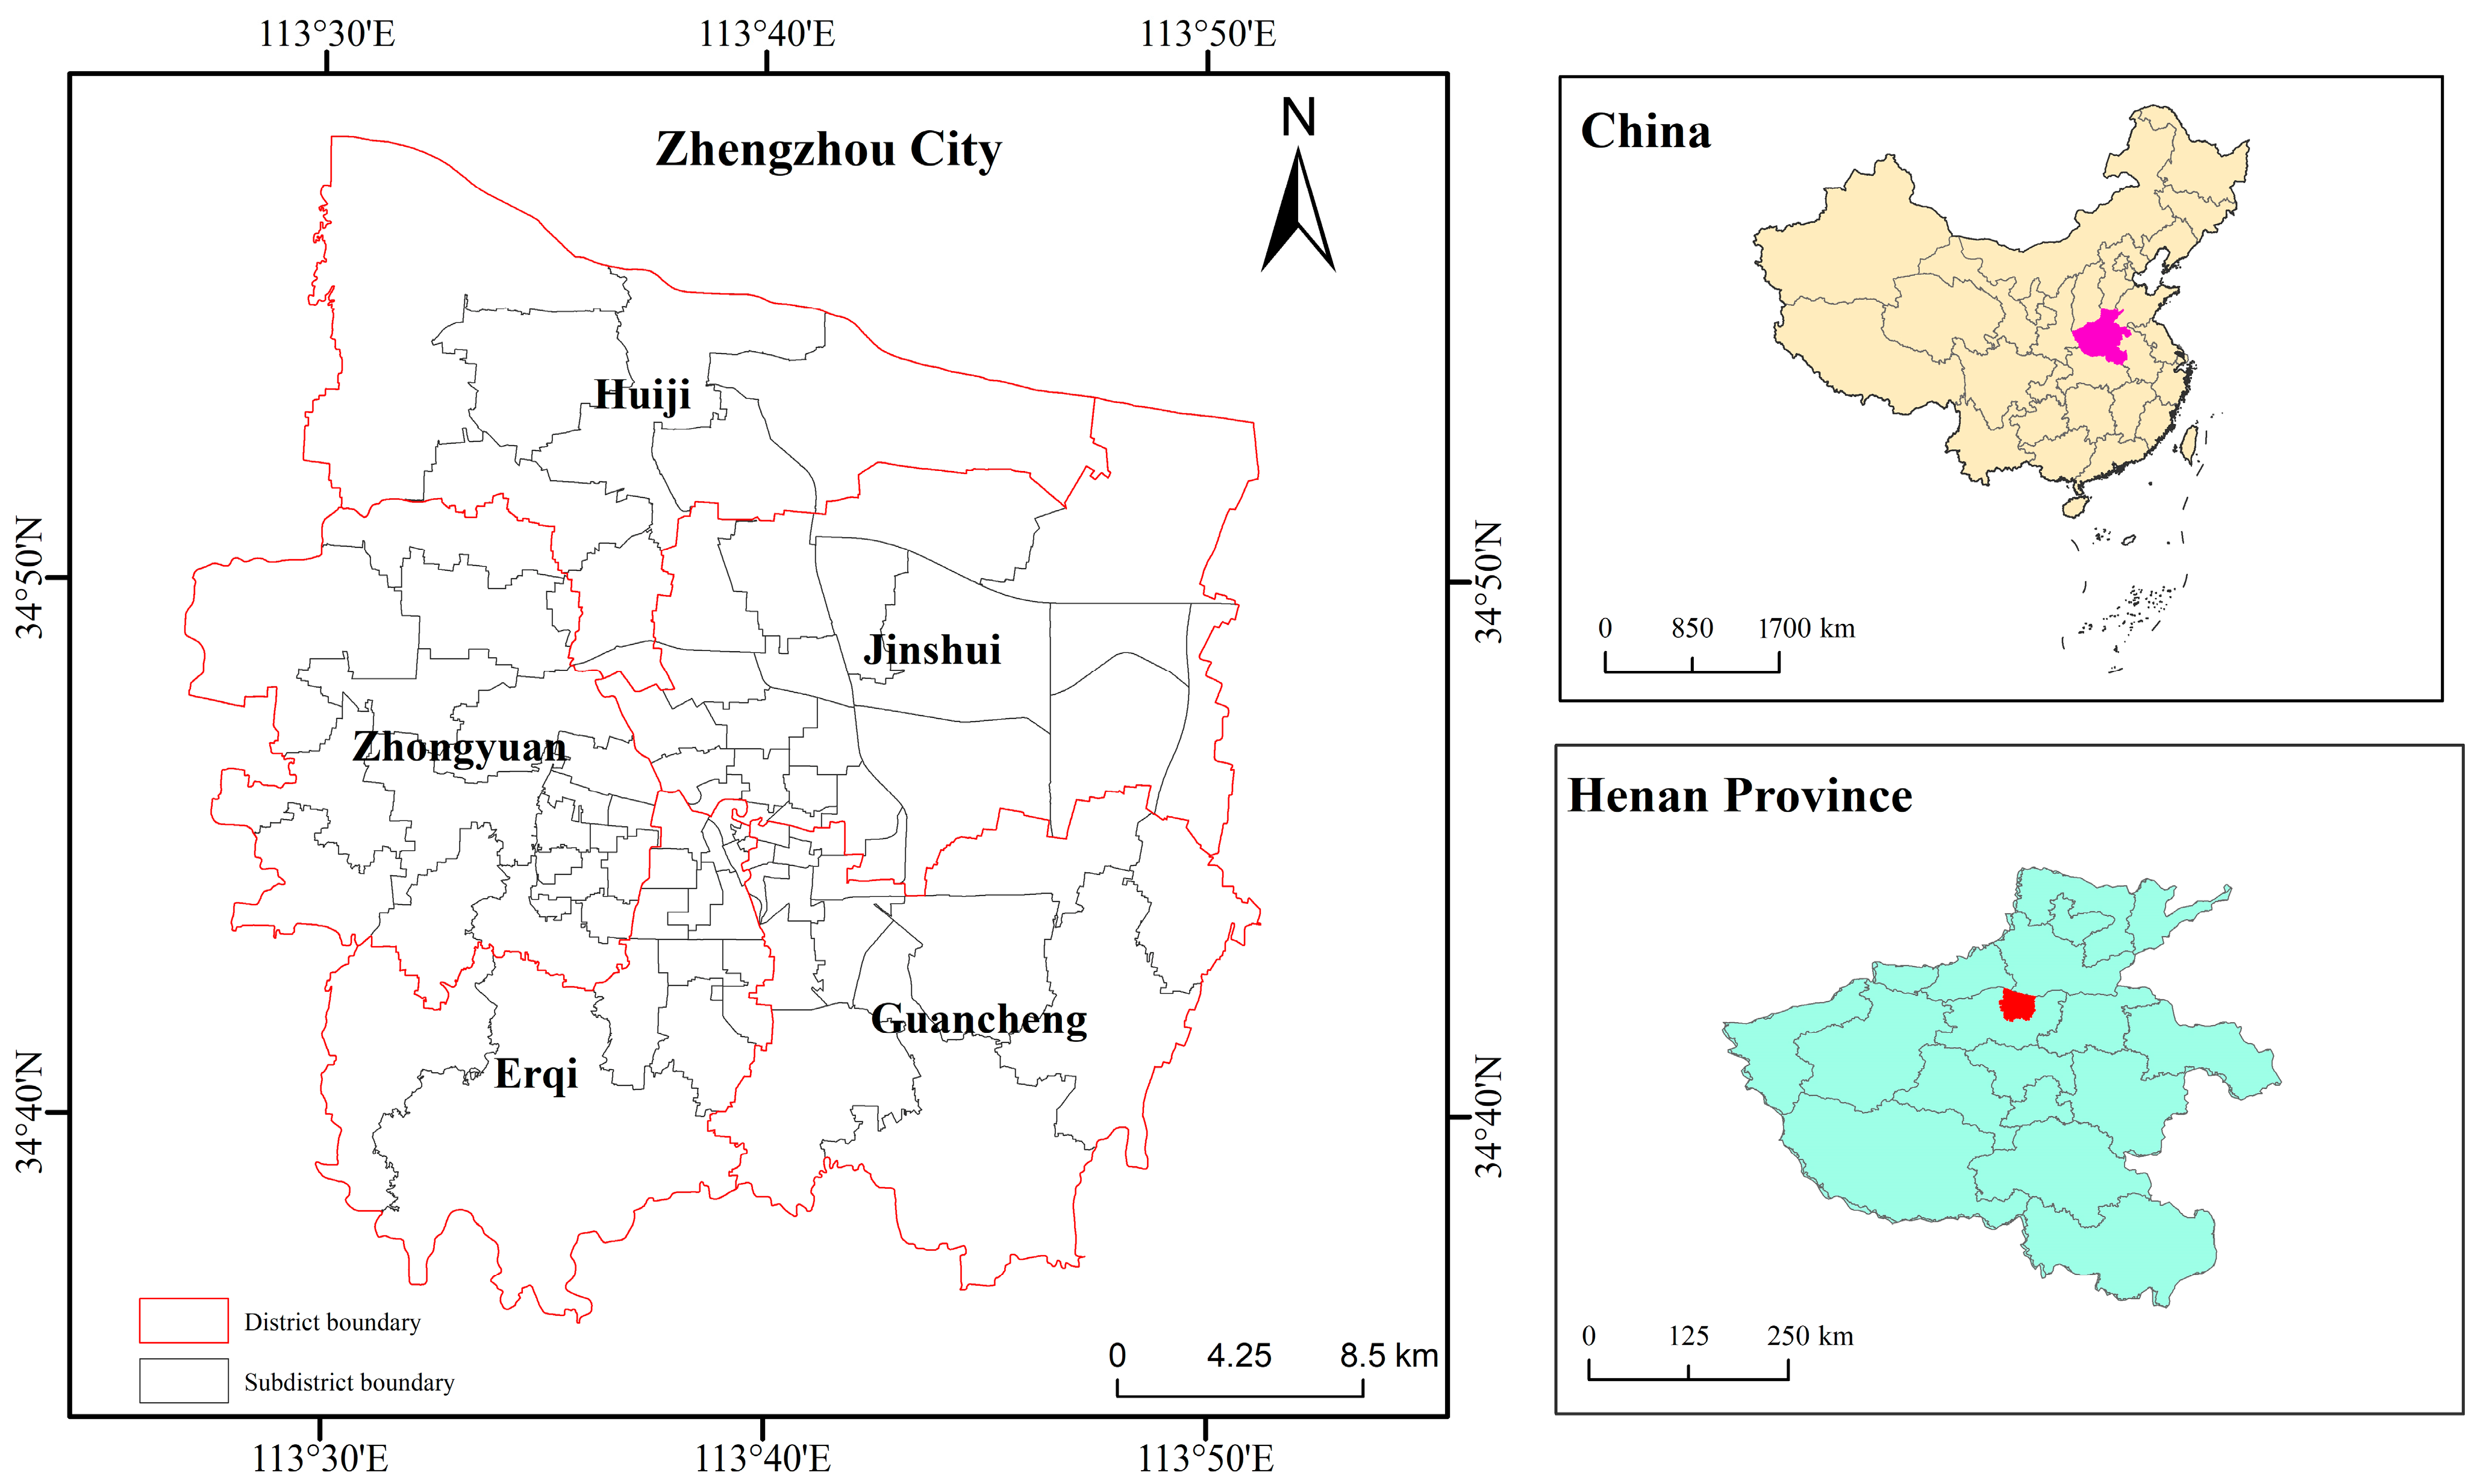
2.1. Study Area
2.2. Data Sources
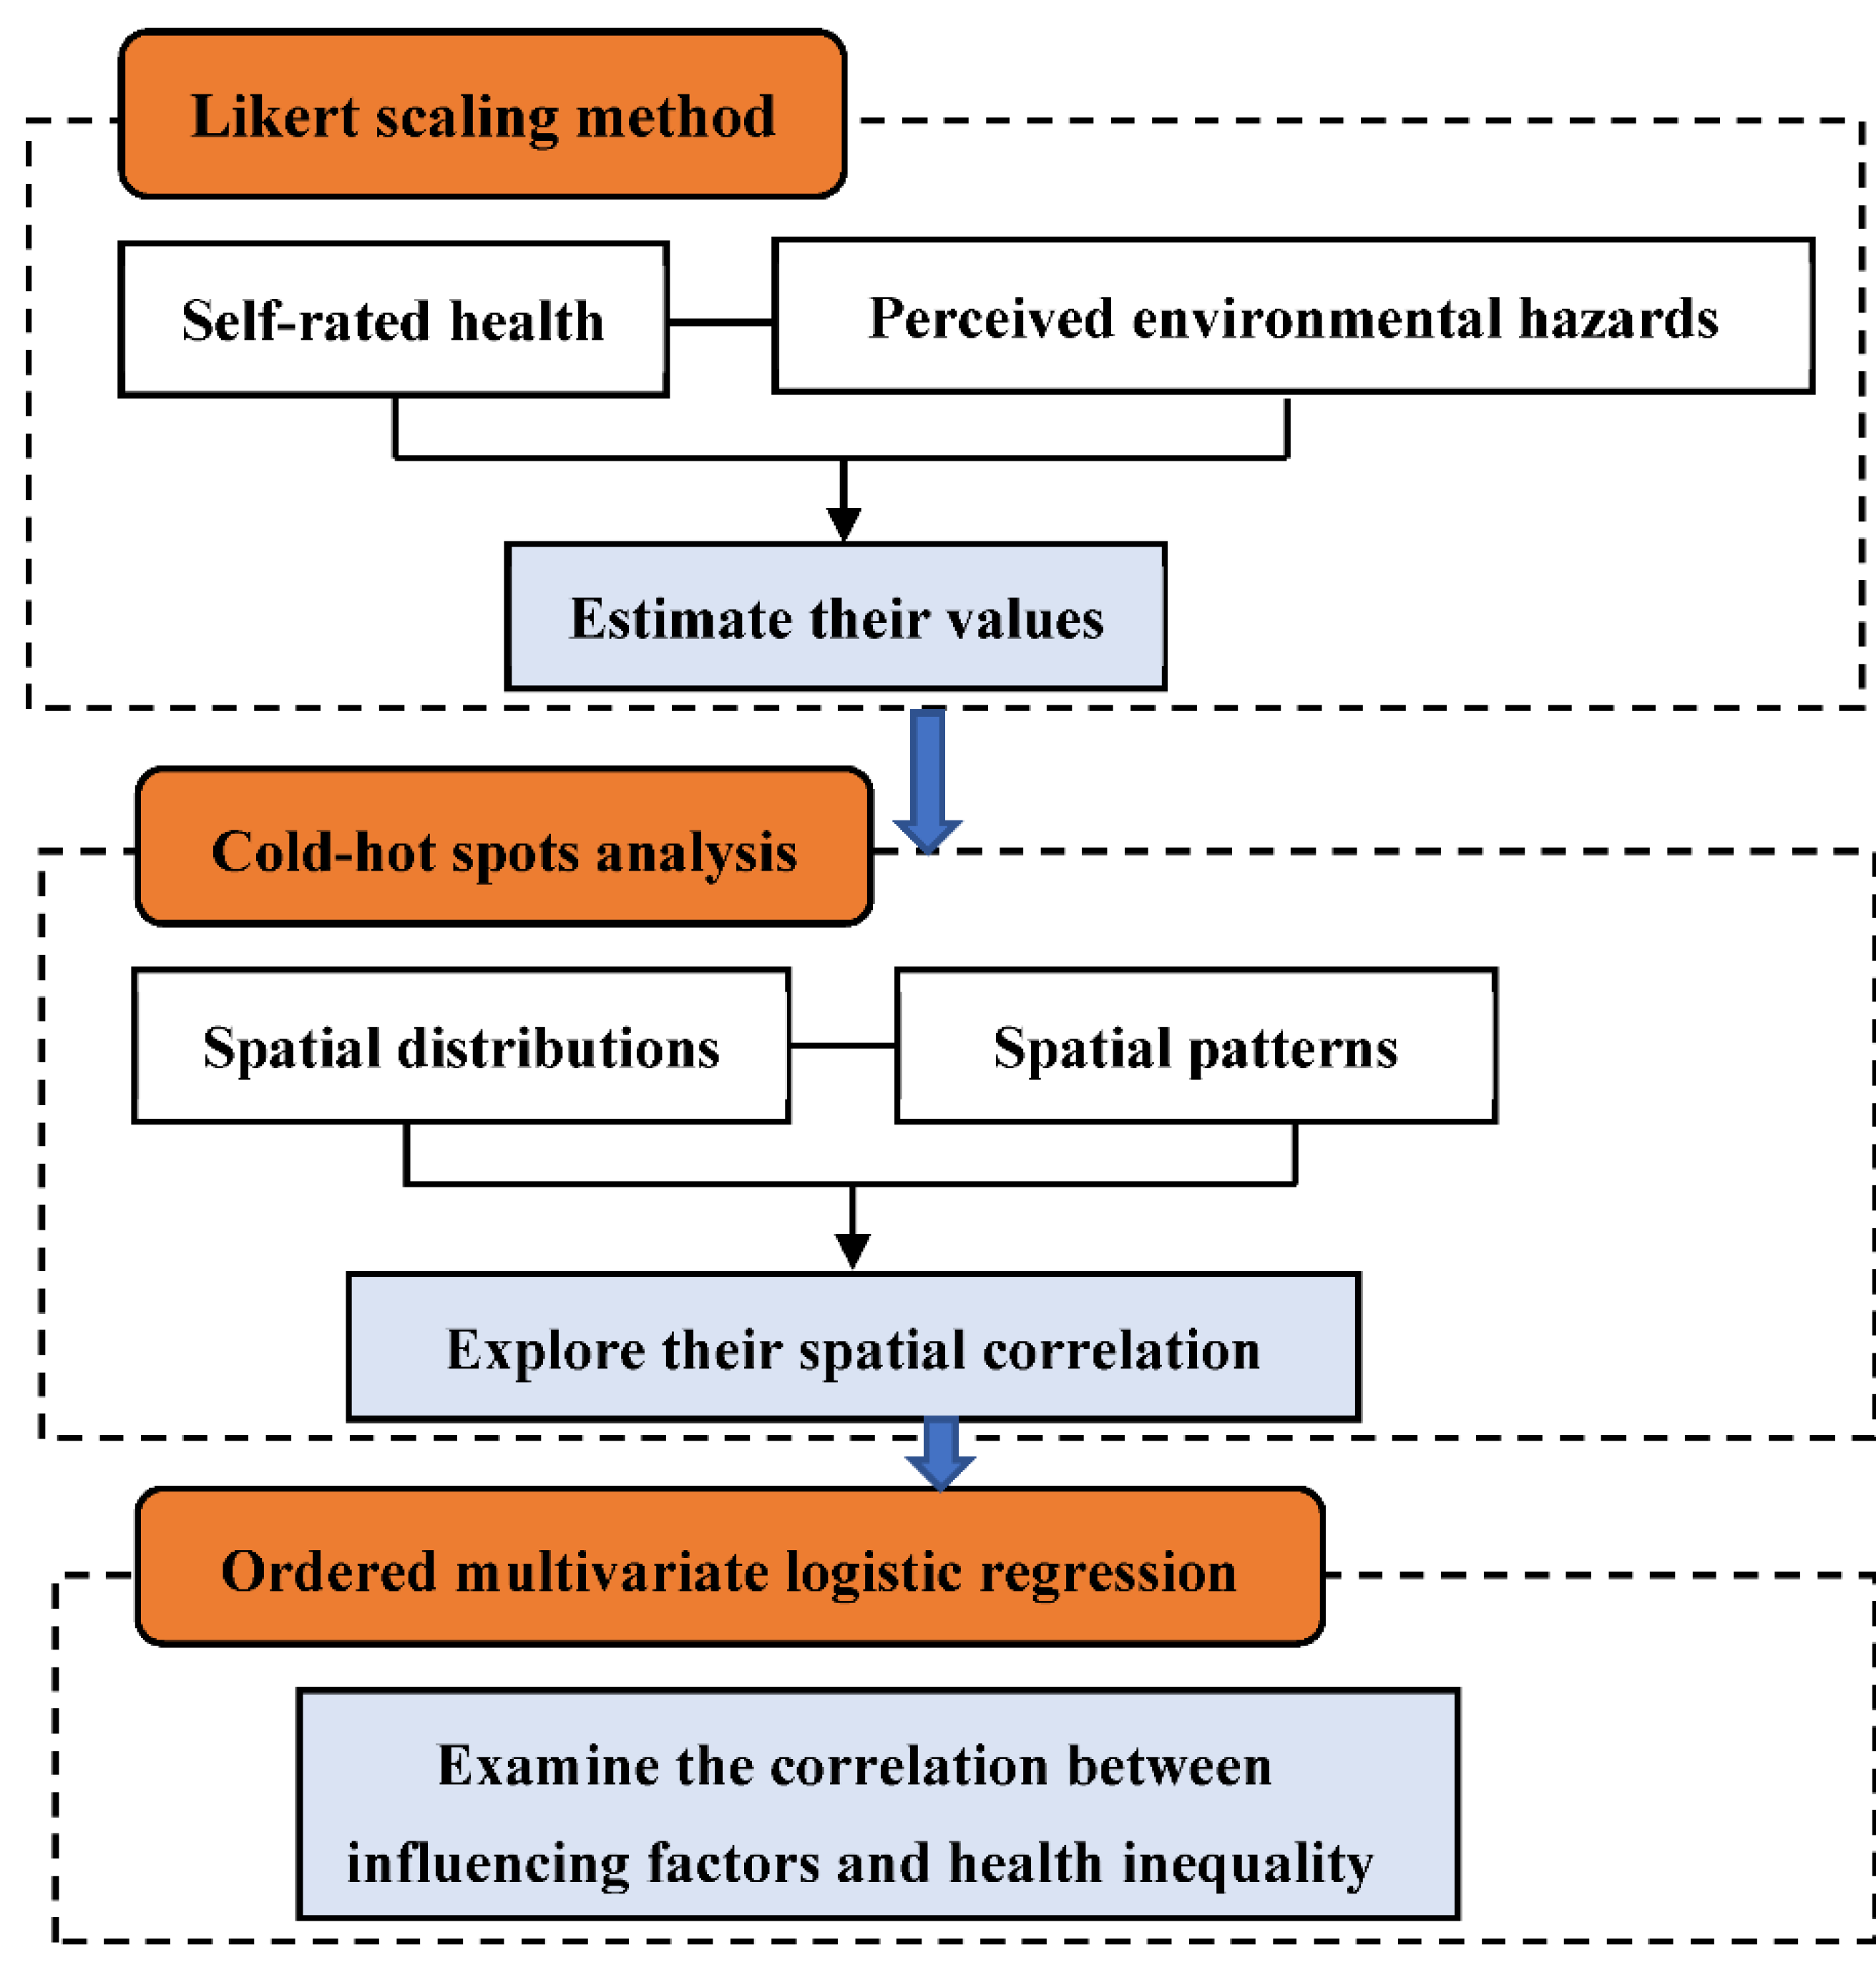
2.3. Methods
2.3.1. Likert Scaling
2.3.2. Cold–Hot Spot Analysis
2.3.3. Ordered Multivariate Logistic Regression Model
3. Results
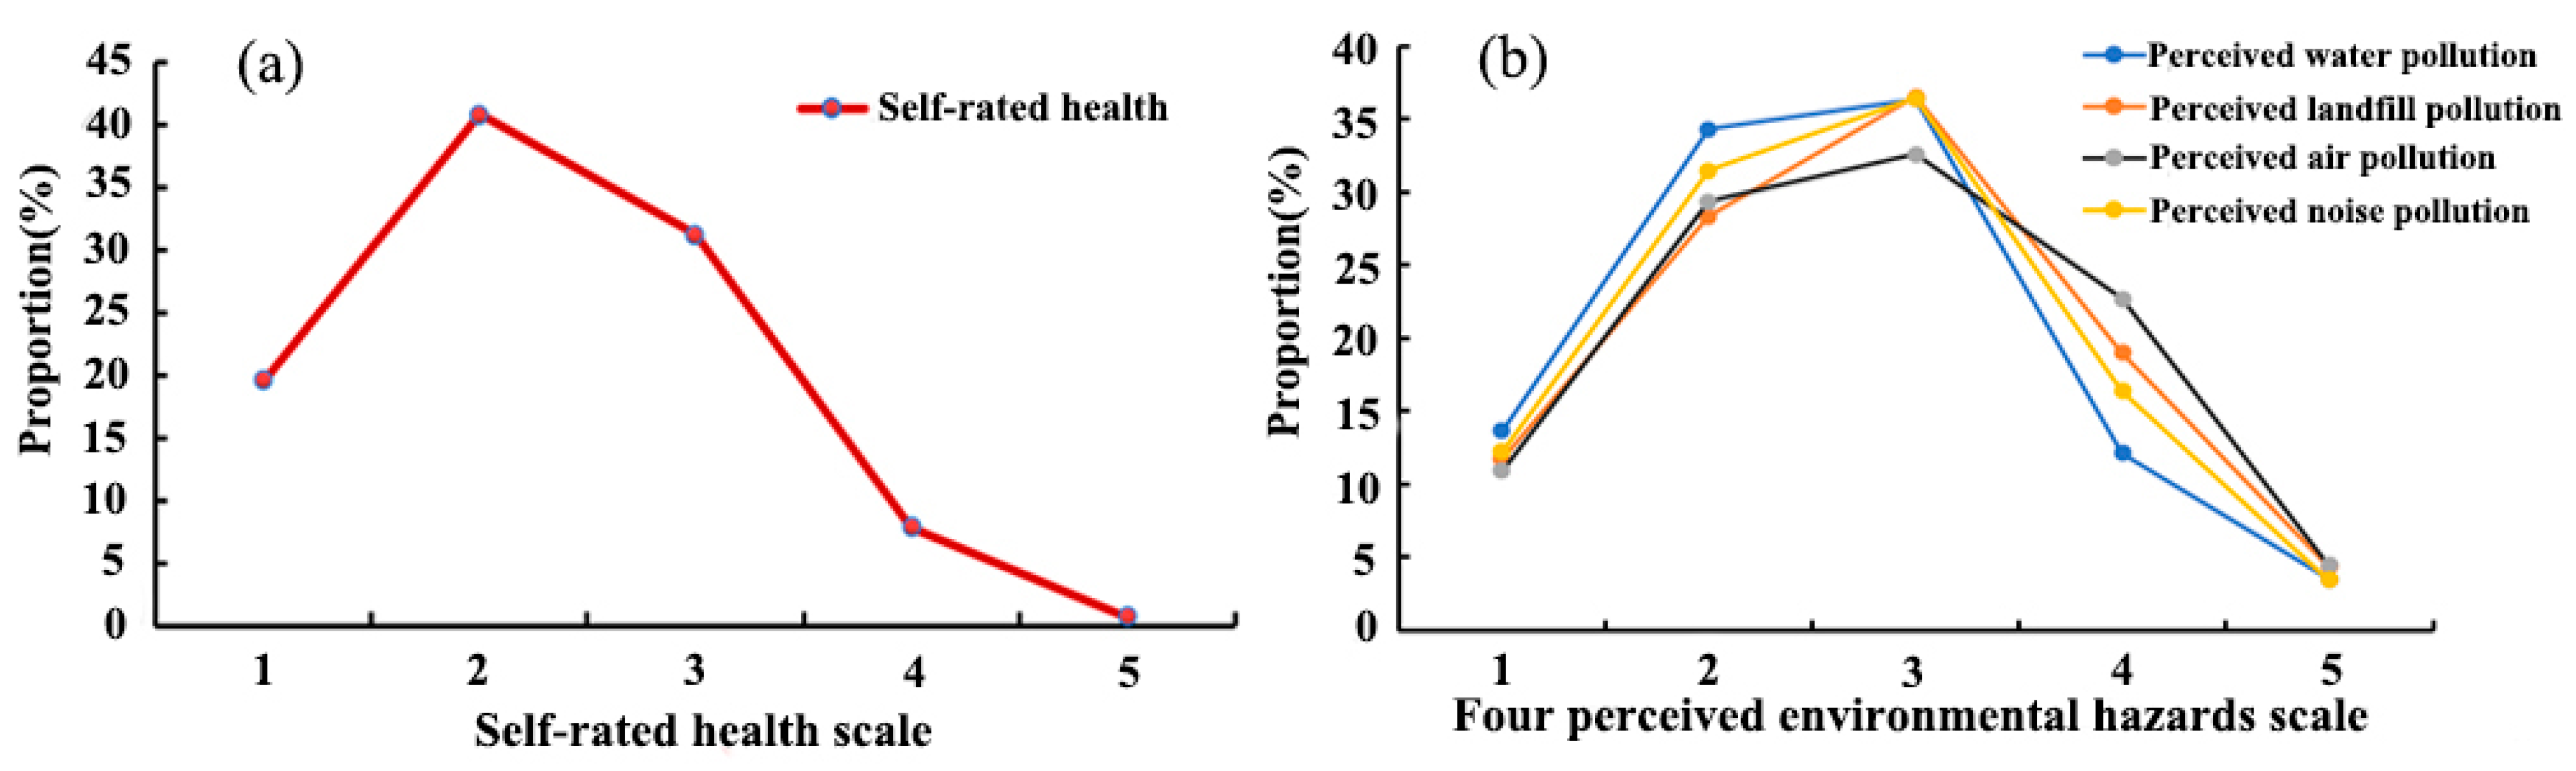
3.1. The Assessment of Self-Rated Health and Environmental Hazards
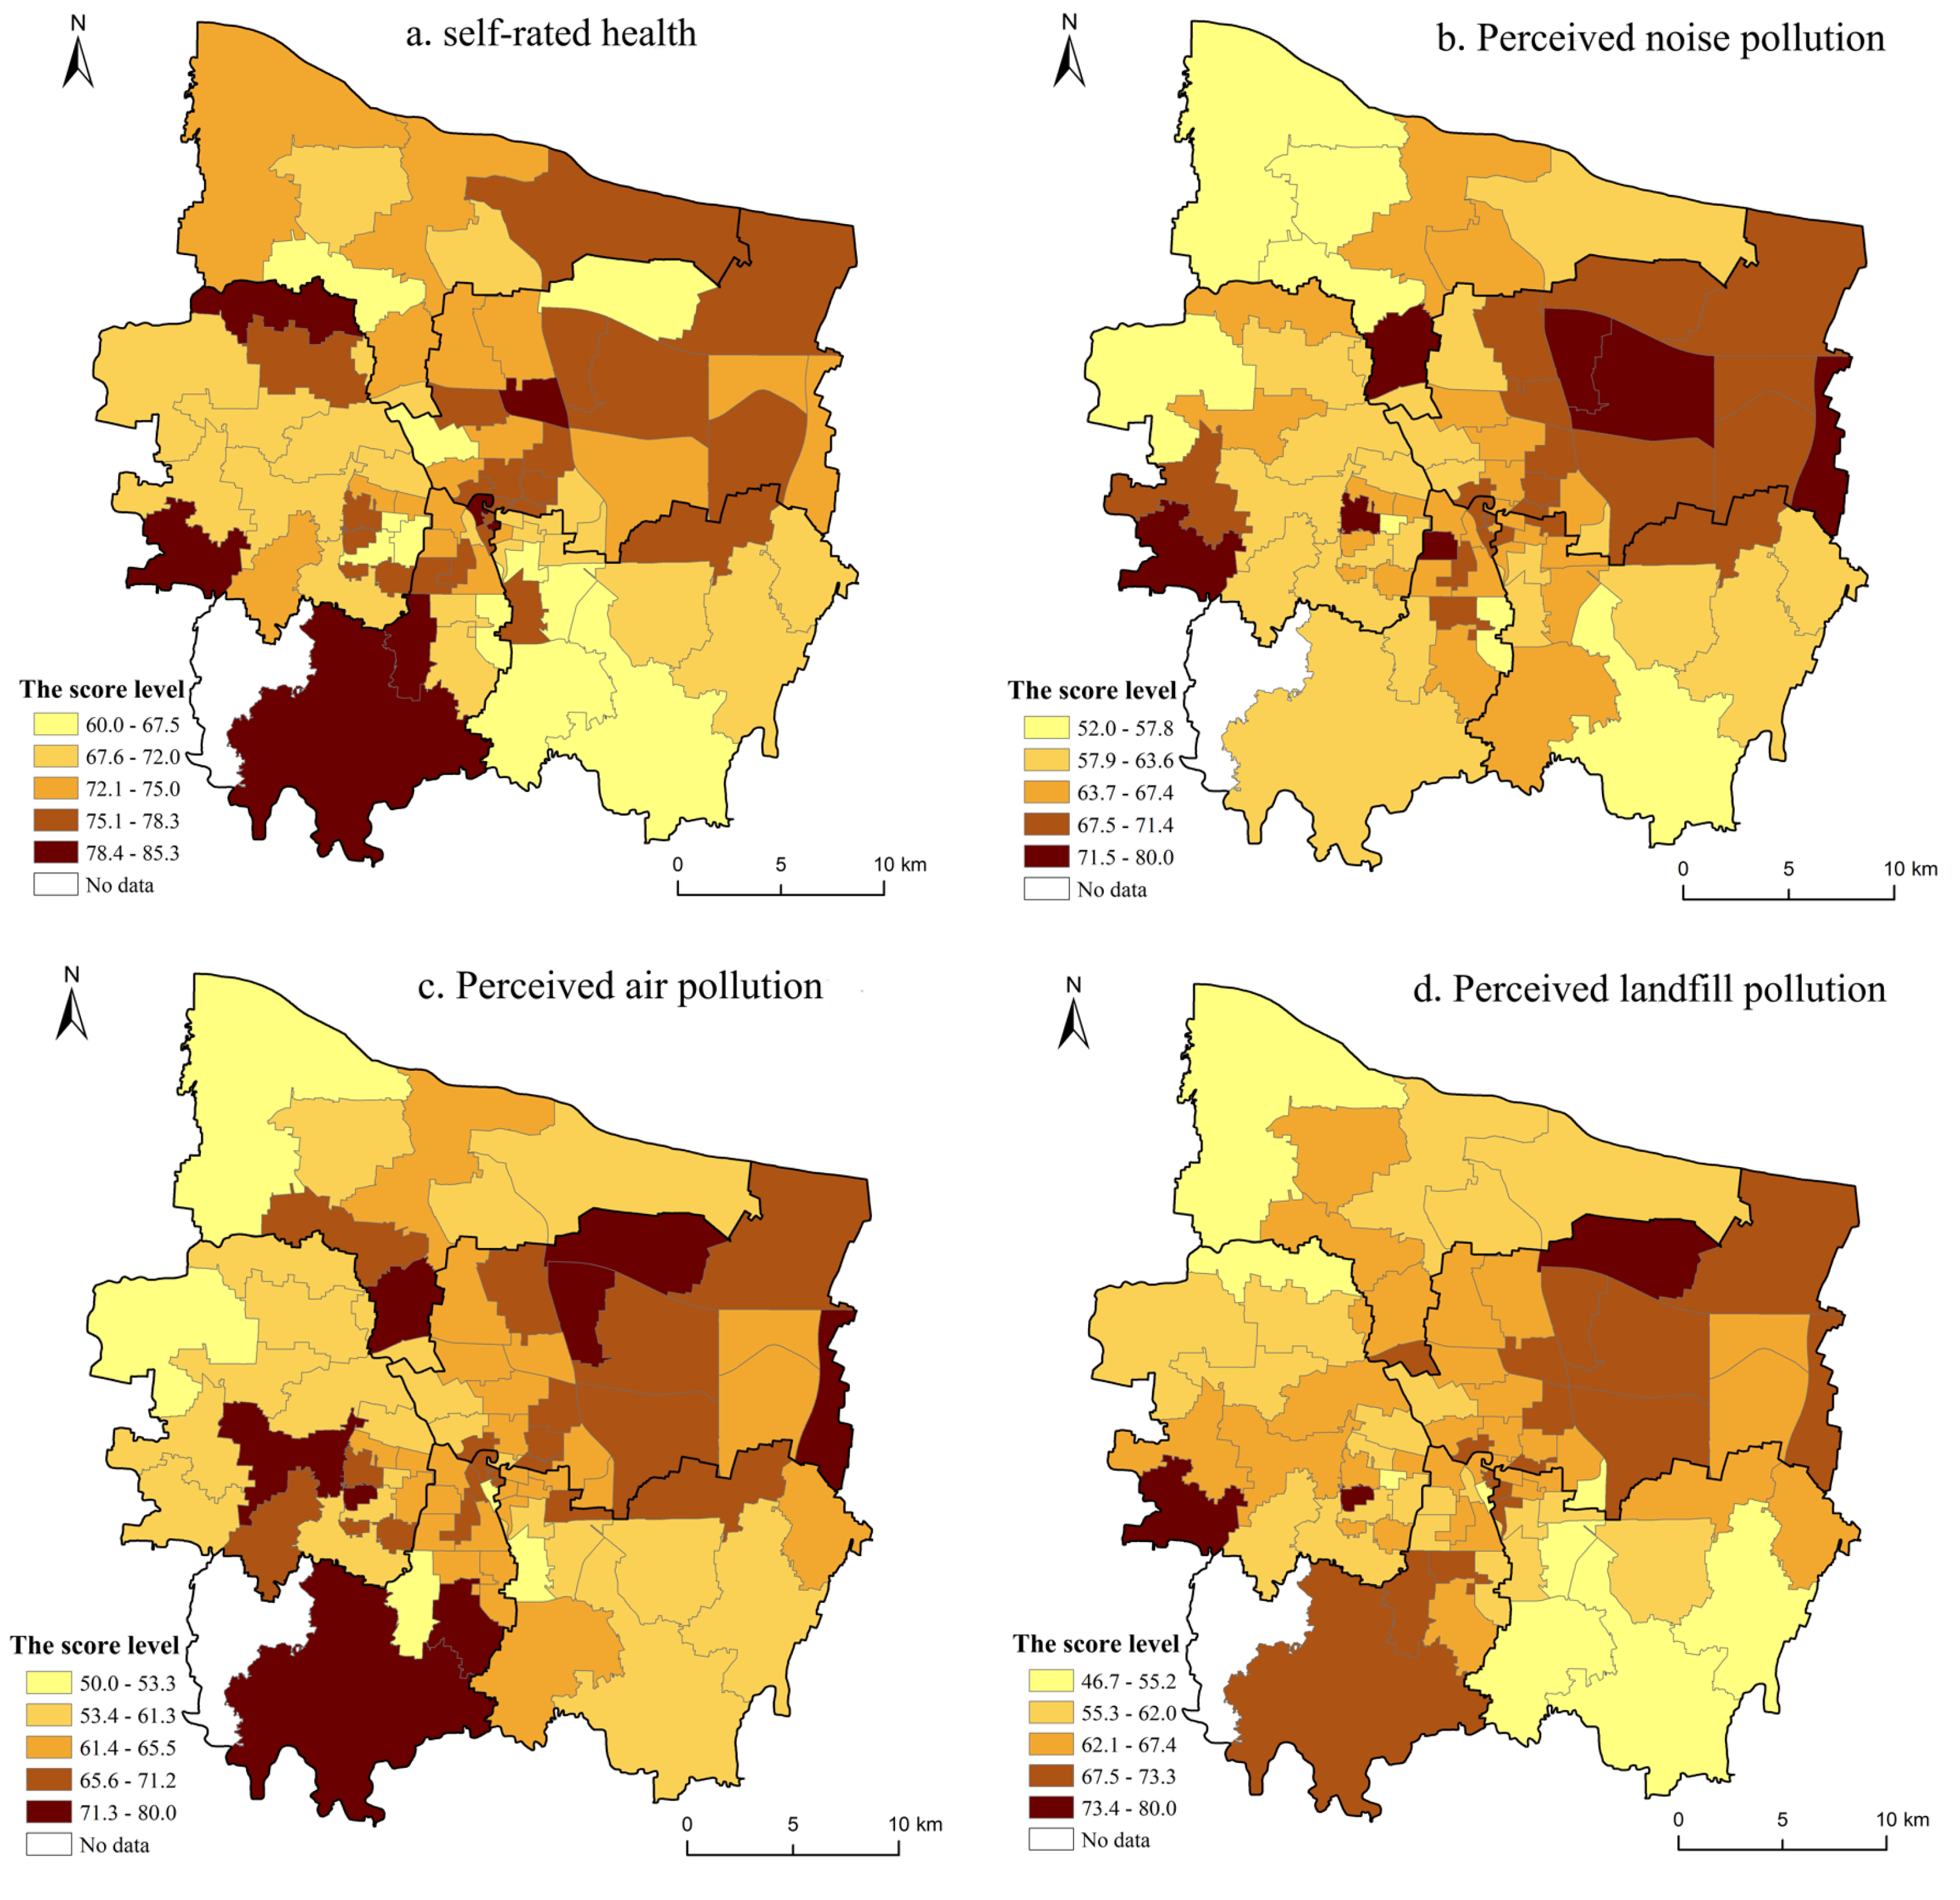
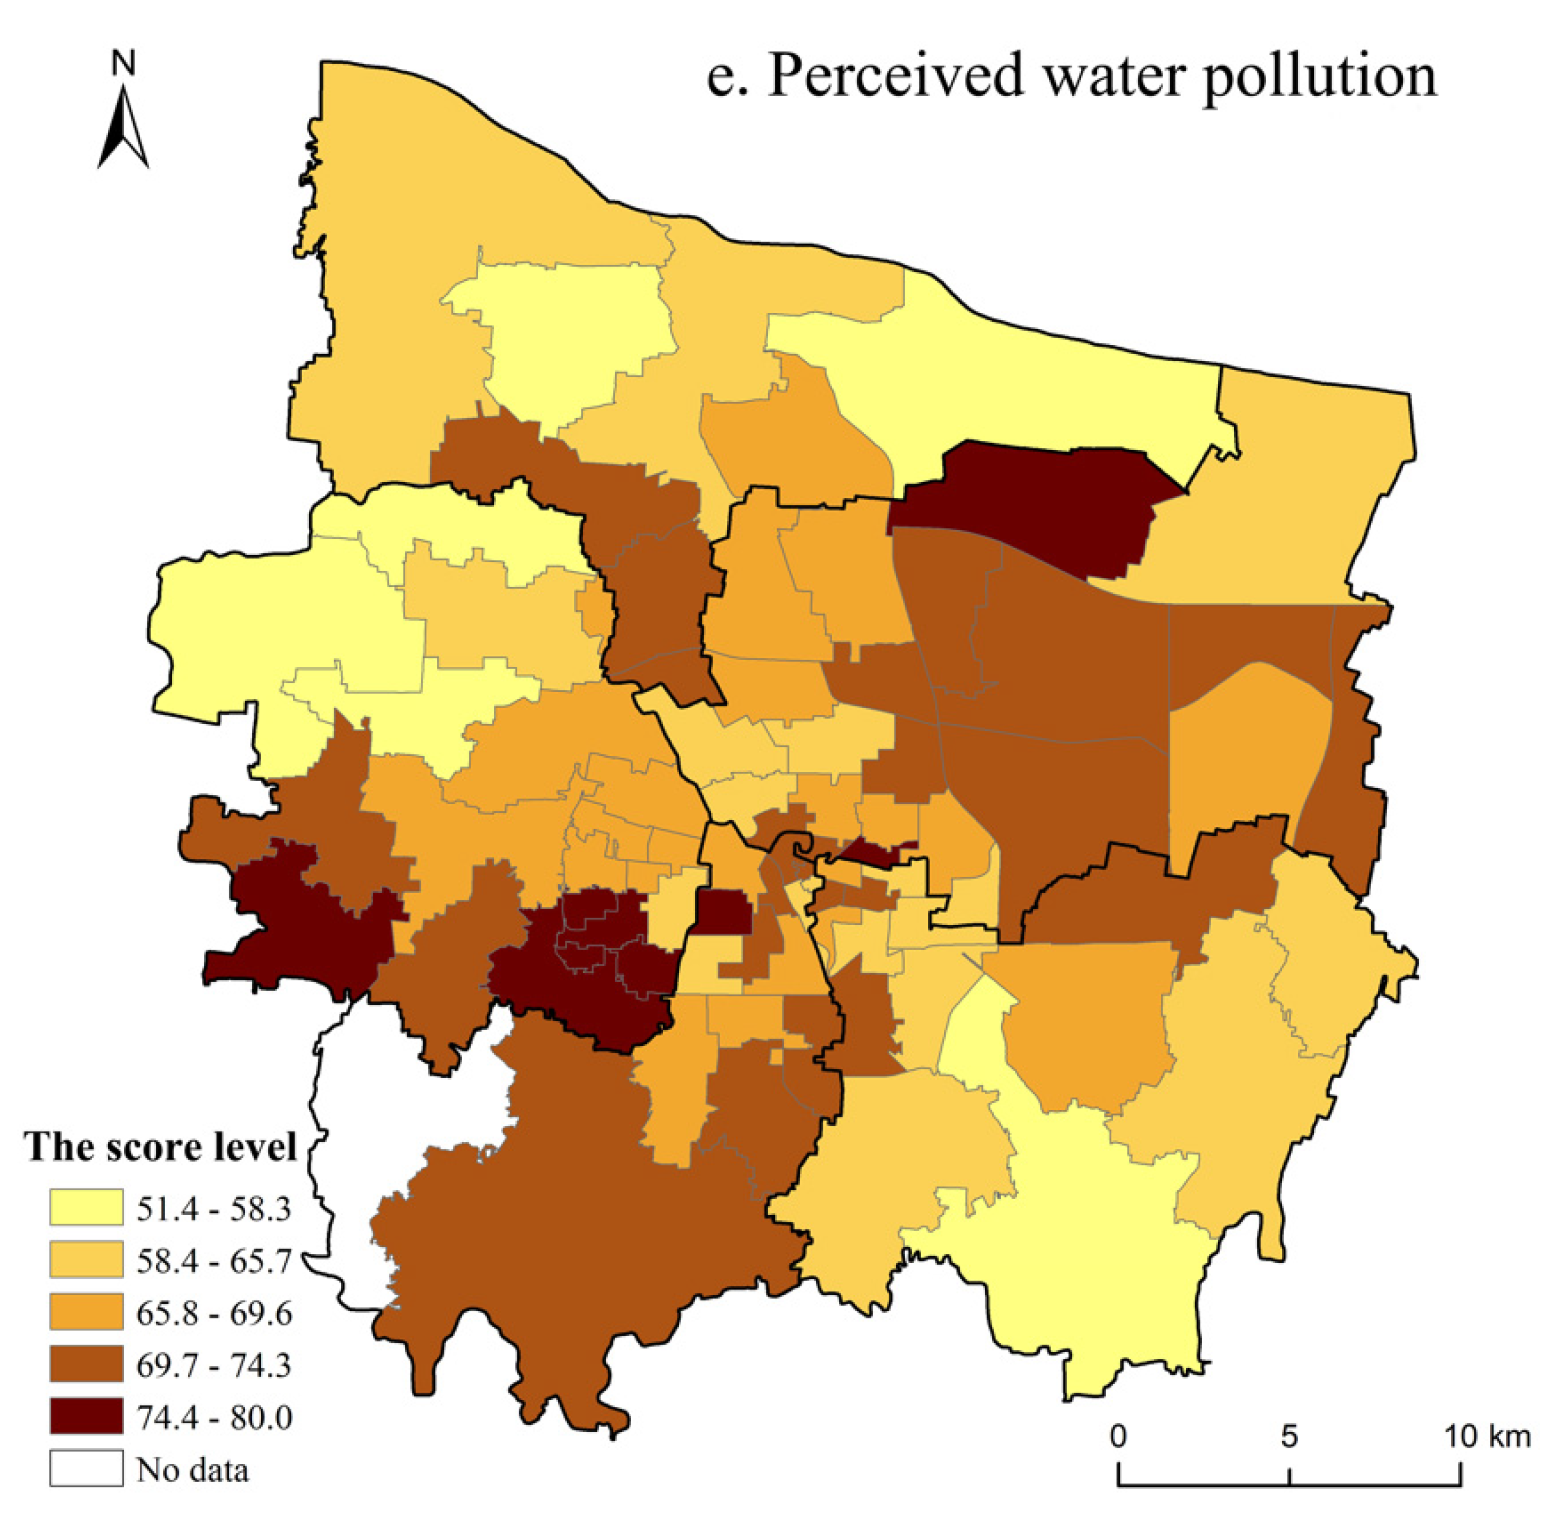
3.2. Spatial Distribution Characteristics of Self-Rated Health and Environmental Hazards
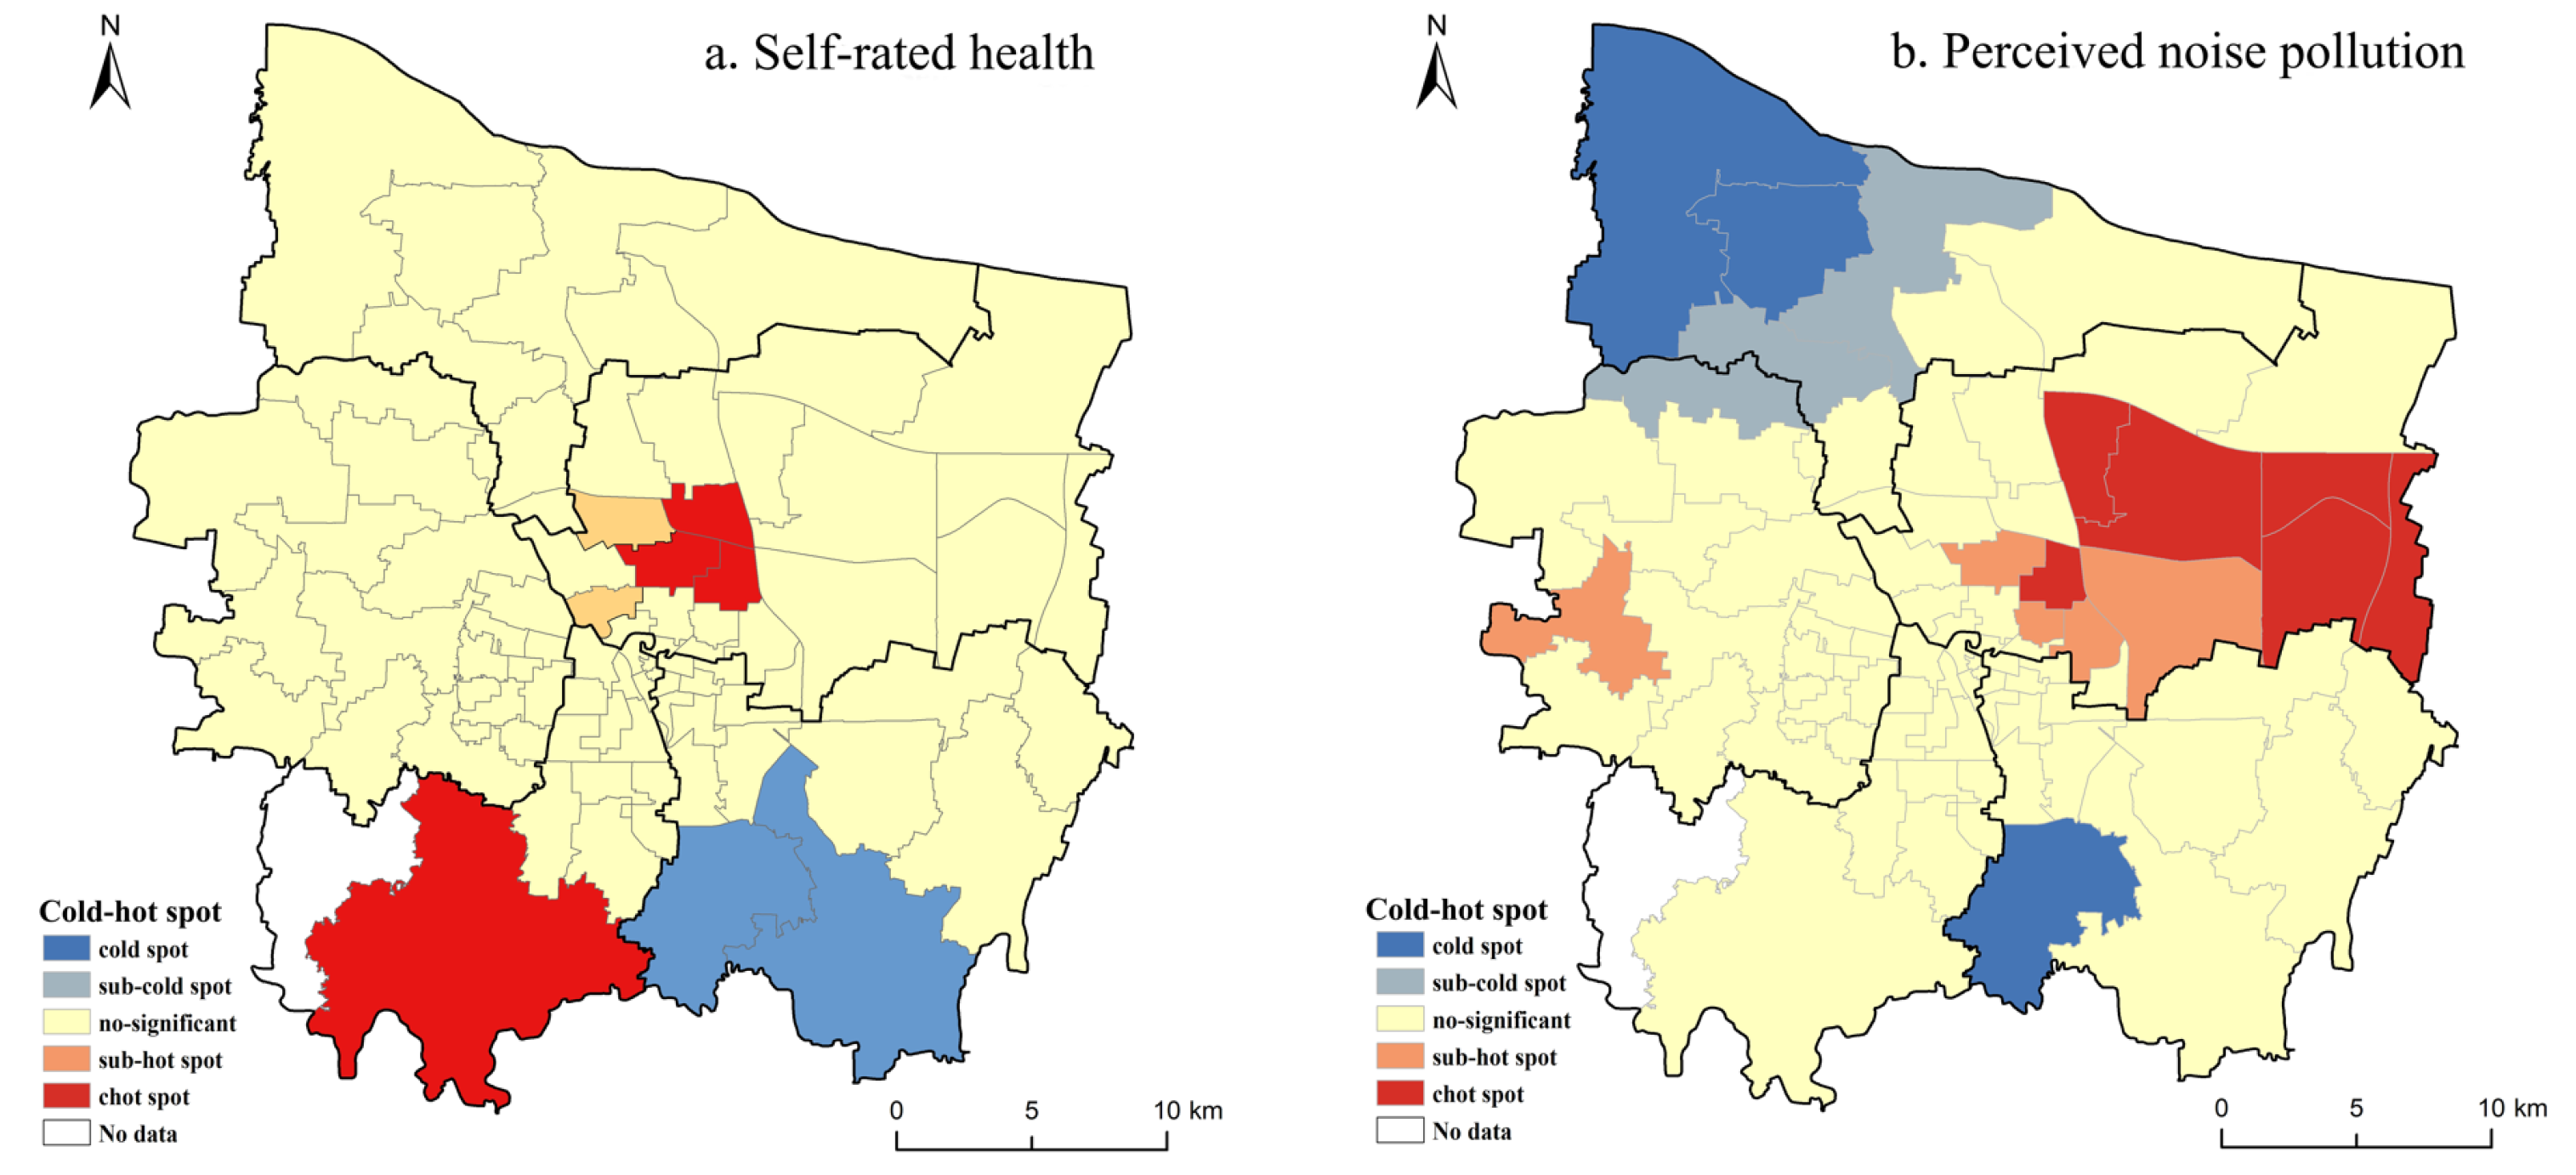
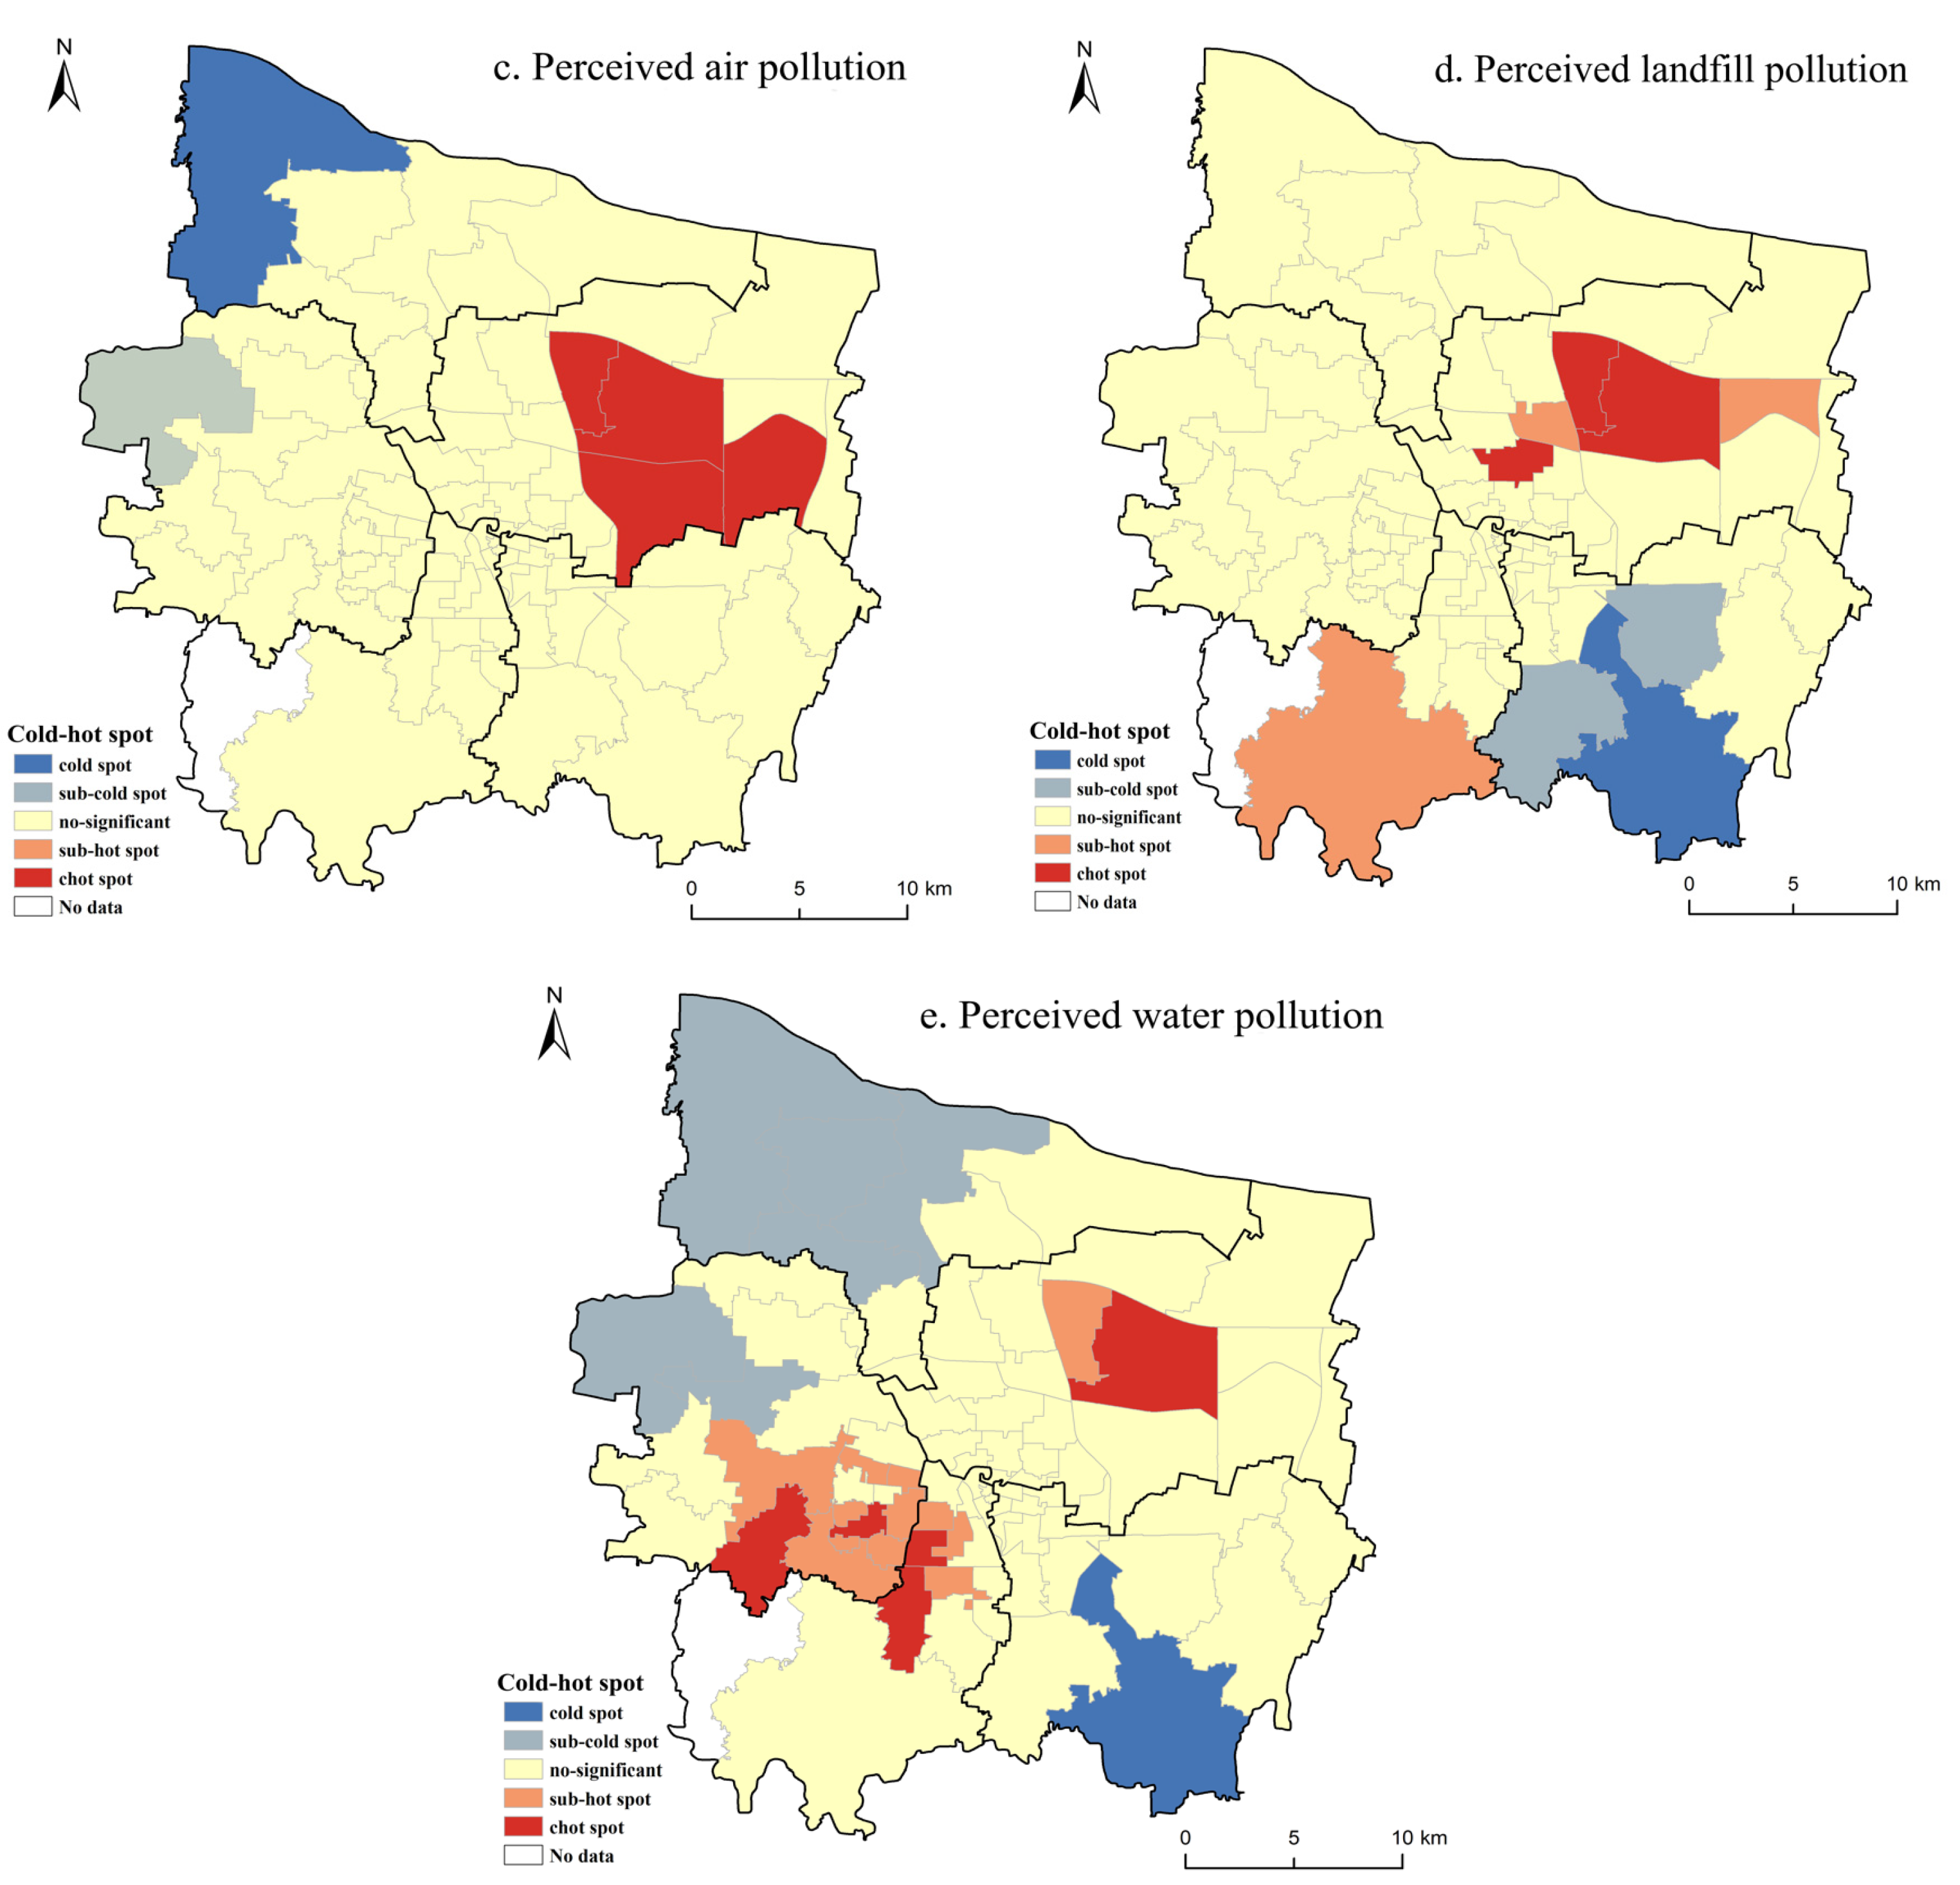
3.3. Cold–Hot Spot Analysis
4. Factors Influencing Health Inequality
4.1. Self-Rated Health and Sociodemographic Characteristics
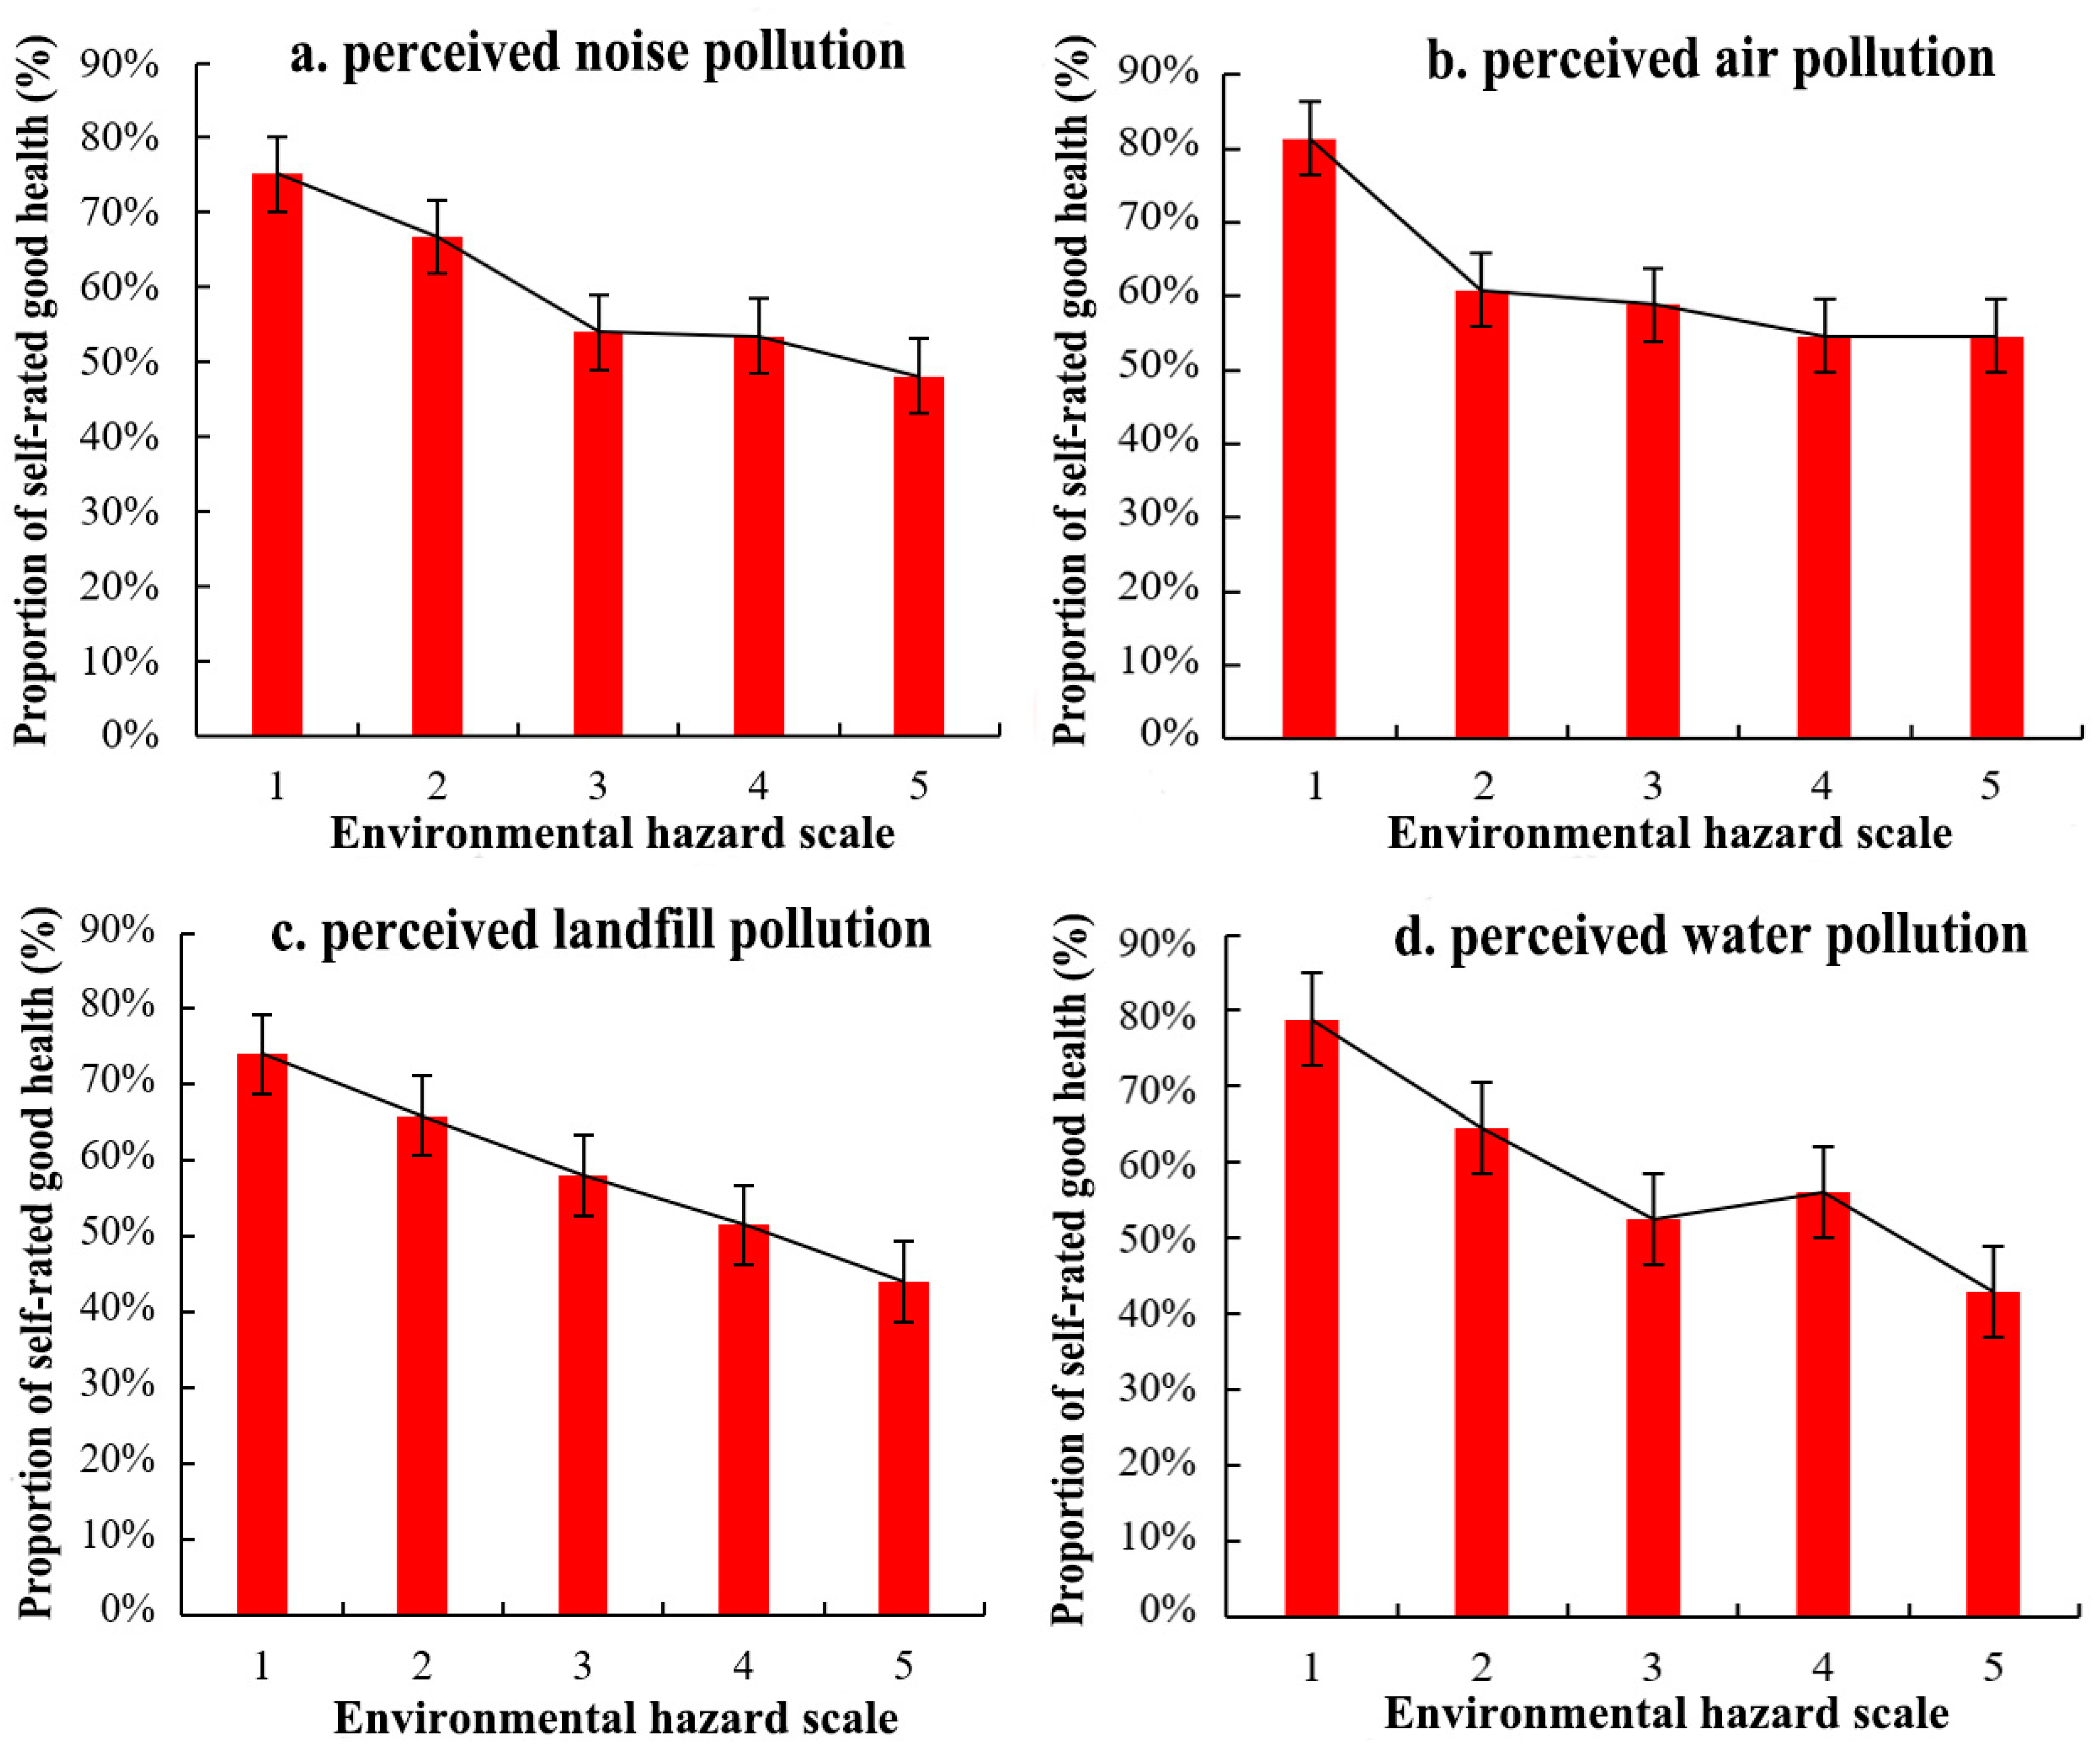
4.2. Self-Rated Health and Perceived Environmental Hazards
4.3. Self-Rated Health and Geographical Contextual Effect
5. Discussion
5.1. Geographical Distributions of Self-Rated Health and Perceived Environmental Hazards
5.2. Strengths and Limitations
5.3. Implications
6. Conclusions
Author Contributions
Funding
Institutional Review Board Statement
Informed Consent Statement
Data Availability Statement
Conflicts of Interest
References
- Zhao, H.; Liu, Y.; Gu, T.; Zheng, H.; Wang, Z.; Yang, D. Identifying Spatiotemporal Heterogeneity of PM2.5 Concentrations and the Key Influencing Factors in the Middle and Lower Reaches of the Yellow River. Remote Sens. 2022, 14, 2643. [Google Scholar] [CrossRef]
- Zhang, L.; Zhou, S.; Kwan, M.-P.; Chen, F.; Lin, R. Impacts of Individual Daily Greenspace Exposure on Health Based on Individual Activity Space and Structural Equation Modeling. Int. J. Environ. Res. Public Health 2018, 15, 2323. [Google Scholar] [CrossRef] [PubMed] [Green Version]
- Zhao, H.; Zhang, H.; Miao, C.; Ye, X.; Min, M. Linking Heat Source–Sink Landscape Patterns with Analysis of Urban Heat Islands: Study on the Fast-Growing Zhengzhou City in Central China. Remote Sens. 2018, 10, 1268. [Google Scholar] [CrossRef] [Green Version]
- Lederbogen, F.; Kirsch, P.; Haddad, L.; Streit, F.; Tost, H.; Schuch, P.; Wüst, S.; Pruessner, J.C.; Rietschel, M.; Deuschle, M.; et al. City living and urban upbringing affect neural social stress processing in humans. Nature 2011, 474, 498. [Google Scholar] [CrossRef]
- World Health Organization (WHO). Quantification of the Disease Burden Attributable to Environmental Risk Factors: China Country Profile; WHO: Geneva, Switzerland, 2009. [Google Scholar]
- Lim, S.S.; Vos, T.; Flaxman, A.D.; Danaei, G.; Shibuya, K.; Adair-Rohani, H.; AlMazroa, M.A.; Amann, M.; Anderson, H.R.; Andrews, K.G.; et al. A comparative risk assessment of burden of disease and injury attributable to 67 risk factors and risk factor clusters in 21 regions, 1999–2010: A systematic analysis for the Global Burden of Disease Study 2010. Lancet 2012, 380, 2224–2260. [Google Scholar] [CrossRef] [Green Version]
- Yang, J.; Yang, Y.; Sun, D.; Jin, C.; Xiao, X. Influence of urban morphological characteristics on thermal environment. Sustain. Cities Soc. 2021, 72, 103045. [Google Scholar] [CrossRef]
- Zhang, J.; Mauzerall, D.; Zhu, T.; Liang, S.; Ezzati, M.; Remais, J. Environmental health in China: Progress towards clean air and safe water. Lancet 2010, 375, 1110–1119. [Google Scholar] [CrossRef] [Green Version]
- Gong, P.; Liang, S.; Carlton, E.J.; Jiang, Q.; Wu, J.; Wang, L.; Remais, J.V. Urbanization and health in China. Lancet 2012, 379, 843–852. [Google Scholar] [CrossRef]
- Ren, Z.B.; Zhao, H.B.; Fu, Y.; Xiao, L.; Dong, Y.L. Effects of urban street trees on human thermal comfort and physiological indices: A case study in Changchun city, China. J. For. Res. 2022, 33, 911–922. [Google Scholar] [CrossRef]
- Ren, J.Y.; Yang, J.; Zhang, Y.Q.; Xiao, X.M.; Xia, J.H.; Li, X.M.; Wang, S.H. Exploring thermal comfort of urban buildings based on local climate zones. J. Clean. Prod. 2022, 340, 130744. [Google Scholar] [CrossRef]
- Arcaya, M.; Brewster, M.; Zigler, C.; Subramanian, S.V. Area variations in health: A spatial multilevel modelling approach. Health Place 2012, 18, 824–831. [Google Scholar] [CrossRef] [PubMed] [Green Version]
- Baeten, S.; Ourti, T.V.; Doorslaer, E.V. Rising inequalities in income and health in China: Who is left behind? J. Health Econ. 2013, 32, 1214–1229. [Google Scholar] [CrossRef] [Green Version]
- Bakkeli, N.Z. Income inequality and health in China: A panel data analysis. Soc. Sci. Med. 2016, 157, 39–47. [Google Scholar] [CrossRef] [PubMed]
- Pope, C.A., III; Burnett, R.T.; Thun, M.J.; Calle, E.E.; Krewski, D.; Ito, K.; Thurston, G.D. Lung cancer, cardiopulmonary mortality, and long-term exposure to fine particulate air pollution. JAMA 2002, 287, 1132–1141. [Google Scholar] [CrossRef] [PubMed] [Green Version]
- Reynolds, P.; Behren, J.V.; Gunier, R.B.; Goldberg, D.E.; Hertz, A.; Smith, D.F. Childhood cancer incidence rates and hazardous air pollutants in California: An exploratory analysis. Environ. Health Perspect. 2003, 111, 663–668. [Google Scholar] [CrossRef] [Green Version]
- Hart, J.E.; Garshick, E.; Smith, T.J.; Davis, M.E.; Laden, F. Ischaemic heart disease mortality and years of work in trucking industry workers. Occup. Environ. Med. 2013, 70, 523–528. [Google Scholar] [CrossRef] [Green Version]
- Yang, L.; Li, H.; Li, Y.; Wang, H.; Tan, J. Progress of medical geography and environmental health studies. Prog. Geogr. 2010, 29, 31–44. [Google Scholar]
- Yang, Y.; Lu, X.; Li, D. Research progress of environmental health risk assessment in China. J. Environ. Health 2014, 31, 357–363. [Google Scholar]
- Mitchell, G.; Dorling, D. An environmental justice analysis of British air quality. Environ. Plan. A 2003, 35, 909–929. [Google Scholar] [CrossRef] [Green Version]
- Namdeo, A.; Stringer, C. Investigating the relationship between air pollution, health and social deprivation in Leeds, UK. Environ. Int. 2008, 34, 585–591. [Google Scholar] [CrossRef]
- Pearce, J.R.; Kingham, S. Environmental inequalities in New Zealand: A national study of air pollution and environmental justice. Geoforum 2008, 39, 980–993. [Google Scholar] [CrossRef]
- Mitchell, G.; Norman, P.; Mullin, K. Who benefits from environmental policy? An environmental justice analysis of air quality change in Britain, 2001–2011. Environ. Res. Lett. 2015, 10, 105009. [Google Scholar] [CrossRef]
- Pearce, J.R.; Richardson, E.A.; Mitchell, R.J.; Shortt, N.K. Environmental justice and health: The implication of the socio-spatial distribution of multiple environmental deprivation for health inequalities in the United Kingdom. Trans. Inst. Br. Geogr. 2010, 35, 522–539. [Google Scholar] [CrossRef] [Green Version]
- Ma, J.; Mitchell, G.; Dong, G.; Zhang, W. Inequality in Beijing: A spatial multilevel analysis of perceived environmental hazard and self-rated health. Ann. Am. Assoc. Geogr. 2017, 107, 109–129. [Google Scholar] [CrossRef] [Green Version]
- Ma, J.; Chai, Y.; Fu, T. Progress of research on the health impact of people’s space-time behavior and environmental pollution exposure. Prog. Geogr. 2017, 36, 1260–1269. [Google Scholar]
- Feng, Z.; Wang, W.; Jones, K.; Li, Y. An exploratory multilevel analysis of income, income inequality and self-rated health of the elderly in China. Soc. Sci. Med. 2012, 75, 2481–2492. [Google Scholar] [CrossRef] [Green Version]
- Chen, J.; Chen, S.; Landry, P.F. Migration, environmental hazards, and health outcomes in China. Soc. Sci. Med. 2013, 80, 85–95. [Google Scholar] [CrossRef]
- Zhou, M.; He, G.; Fan, M.; Wang, Z.; Liu, Y.; Ma, J.; Ma, Z.; Liu, J.; Liu, Y.; Wang, L.; et al. Smog episodes, fine particulate pollution and mortality in China. Environ. Res. 2015, 136, 396–404. [Google Scholar] [CrossRef]
- Lu, F.; Xu, D.; Cheng, Y.; Dong, S.; Guo, C.; Jiang, X.; Zheng, X. Systematic review and meta-analysis of the adverse health effects of ambient PM2.5 and PM10 pollution in the Chinese population. Environ. Res. 2015, 136, 196–204. [Google Scholar] [CrossRef]
- Zhao, X.; Zhang, S.; Fan, C. Environmental externality and inequality in China: Current status and future choices. Environ. Pollut. 2014, 190, 176–179. [Google Scholar] [CrossRef]
- Holdaway, J. Environment and health in China: An introduction to an emerging research field. J. Contemp. China 2010, 19, 1–22. [Google Scholar] [CrossRef]
- Payne-Sturges, D.; Gee, G.C. National environmental health measures for minority and low-income populations: Tracking social disparity in environmental health. Environ. Res. 2006, 102, 154–171. [Google Scholar] [CrossRef] [PubMed]
- Peek, M.K.; Cutchin, M.P.; Freeman, D.; Stowe, R.P.; Goodwin, J.S. Environmental hazards and stress: Evidence from the Texas City Stress and Health Study. J. Epidemiol. Community Health 2009, 63, 792–798. [Google Scholar] [CrossRef] [PubMed]
- Chakraborty, J.; Maantay, J.A.; Brender, J.D. Disproportionate proximity to environmental health hazards: Methods, models and measurement. Am. J. Public Health 2011, 101, S27–S36. [Google Scholar] [CrossRef] [PubMed]
- Corsi, D.J.; Subramanian, S.V.; McKee, M.; Li, W.; Swaminathan, S.; Lopez-Jaramillo, P.; Avezum, A.; Lear, S.A.; Dagenais, G.; Rangarajan, S.; et al. Environmental profile of a community’s health (EPOCH): An ecometric assessment of measures of the community environment based on individual perception. PLoS ONE 2012, 7, e44410. [Google Scholar] [CrossRef]
- Gu, L.J.; Zeng, J.X. The impacts of socioeconomic and environmental factors on self- rated health status among different income groups in China. Geogr. Res. 2017, 36, 1257–1270. [Google Scholar]
- Getis, A.; Ord, J. The analysis of spatial association by distance statistics. Geogr. Anal. 1992, 24, 3189–3206. [Google Scholar] [CrossRef]
- Wulder, M.; Boots, B. Local spatial autocorrelation characteristics of remotely sensed imagery assessed with the Getis statistic. Int. J. Remote Sens. 1998, 19, 2223–2231. [Google Scholar] [CrossRef]
- Shui, W.; Xu, X.; Wei, Y. Influencing factors of community participation in tourism development. J. Geogr. Reg. Plan. 2012, 7, 207–211. [Google Scholar]
- Shui, W.; Chen, Z.; Deng, J.; Li, Y.; Wang, Q.; Wang, W.; Chen, Y. Evaluation of urban high temperature vulnerability of coupling adaptability in Fuzhou, China. Acta Geogr. Sin. 2017, 72, 830–849. [Google Scholar]
- Gilbert, N. A natural high: Exposure to nature makes people happy and could cut mental health inequalities between rich and poor. Nature 2016, 531, S56–S57. [Google Scholar] [CrossRef] [PubMed] [Green Version]
- Shrestha, R.; Flacke, J.; Martinez, J.; Van Maarseveen, M. Environmental health related socio-spatial inequalities: Identifying “hotspots” of environmental burdens and social vulnerability. Int. J. Environ. Res. Public Health 2016, 137, 691. [Google Scholar] [CrossRef] [Green Version]
- Huang, B.S.; Huang, C.Y.; Feng, Z.Q.; Pearce, J.R.; Zhao, H.S.; Pan, Z.H.; Liu, Y. Association between residential greenness and general health among older adults in rural and urban areas in China. Urban For. Urban Green. 2021, 59, 126907. [Google Scholar] [CrossRef]
- Wang, R.Y.; Feng, Z.Q.; Pearce, J.R.; Zhou, S.H.; Zhang, L.; Liu, Y. Dynamic greenspace exposure and residents’ mental health in Guangzhou, China: From over-head to eye-level perspective, from quantity to quality. Landsc. Urban Plan. 2021, 215, 104230. [Google Scholar] [CrossRef]
- Dahlgren, G.; Whitehead, M. Policies and Strategies to Promote Social Equity in Health; Institute for Future Studies: Stockholm, Sweden, 1991. [Google Scholar]
- Raddatz, L.; Mennis, J. Environmental justice in Hamburg, Germany. Prof. Geogr. 2013, 65, 495–511. [Google Scholar] [CrossRef]
- Ministry of Environmental Protection (MEP). The 12th Five-Year Plan for the Environmental Health Work of National Environmental Protection; Ministry of Environmental Protection of the People’s Republic of China: Beijing, China, 2011.
- Elliott, S.; Cole, D.; Krueger, P.; Voorberg, N.; Wakefield, S. The power of perception: Health risk attributed to air pollution in an urban industrial neighborhood. Risk Anal. 1999, 19, 621–634. [Google Scholar] [CrossRef]
- Lora-Wainwright, A. Dying for Development: Pollution, Illness and the Limits of Citizens’ Agency in China. China Q. 2013, 214, 243–254. [Google Scholar] [CrossRef] [Green Version]
- Zhang, L.; He, G.; Mol, A.; Lu, Y. Public perceptions of environmental risk in China. J. Risk Res. 2013, 16, 195–209. [Google Scholar] [CrossRef] [Green Version]
- Ministry of Environmental Protection (MEP). The China Environment Bulletion; Ministry of Environmental Protection of the People’s Republic of China: Beijing, China, 2016.


| Variables | Variable Description and Proportion (%) |
|---|---|
| Age | 18–29 (26.52%); 30–39 (31.39%); 40–49 (23.82%); 50–59 (7.63%); ≥60 (10.65%) |
| Gender | Male (56.65%); Female (49.35%) |
| Marital status | Married (77.12%); Unmarried (21.94%); Others (0.94%) |
| Education | Primary (4.76%); Secondary (14.21%); Tertiary (78.58%); Postgraduate (2.45%) |
| Monthly income (RMB) | <1400 (0.05%); 1401–2000 (5.05%); 2001–3000 (24.6%); 3001–6000 (36.62%); ≥6000 (33.68%) |
| Residence status (hukou) | Local resident (80.17%); Migrant (19.83%) |
| Housing type | Commodity housing (64.29%); Rented housing (32.69%); Danwei housing (3.02%) |
| Variable | Model 1 | Model 2 | Model 3 | |||
|---|---|---|---|---|---|---|
| Estimate | t-Value | Estimate | t-Value | Estimate | t-Value | |
| Gender (Contrast: Male) | ||||||
| Female | −0.12077 | −1.9774 ** | −0.13947 | −2.27109 ** | −0.15128 | −2.40575 *** |
| Age (Contrast: 18–29) | ||||||
| 30−39 | −0.0441 | −0.4179 | −0.08685 | −0.81673 | −0.12214 | −1.11503 |
| 40−49 | −0.08983 | −0.7652 | −0.06144 | −0.51945 | −0.06615 | −0.54683 |
| 50−59 | 0.02916 | 0.1954 | 0.00164 | 0.01087 | −0.04484 | −0.29049 |
| ≥60 | −0.0191 | −0.1319 | −0.03996 | −0.27367 | −0.06954 | −0.46445 |
| Education (Contrast: Primary) | ||||||
| Secondary | −0.29171 | −1.7941 ** | −0.39079 | −2.38616 *** | −0.42781 | −2.56082 *** |
| Tertiary | −0.53459 | −3.4963 *** | −0.58486 | −3.7998 *** | −0.60226 | −3.81043 *** |
| Postgraduate | −0.91998 | −3.7491 *** | −0.93109 | −3.76829 *** | −0.87297 | −3.45236 *** |
| Marital status (Contrast: Married) | ||||||
| Unmarried | −0.12725 | −1.1775 | −0.18276 | −1.67121 ** | −0.20967 | −1.86258 ** |
| Others | 0.80207 | 2.4182 *** | 0.7871 | 2.3532 ** | 0.654995 | 1.93277 ** |
| Residence status (Contrast: Local resident) | ||||||
| Migrant | −0.11696 | −1.1261 | −0.09181 | −0.87303 | −0.14167 | −1.31027 * |
| Monthly income (Contrast: <1400 RMB) | ||||||
| 1401−2000 | −2.58694 | −2.2399 ** | −2.75676 | −2.34506 | −2.79142 | −2.34479 ** |
| 2001−3000 | −2.98865 | −2.5973 *** | −3.15074 | −2.6879 *** | −3.20708 | −2.69903 *** |
| 3001−6000 | −2.90663 | −2.5283 *** | −3.05599 | −2.60787 | −3.1501 | −2.65216 *** |
| >6000 | −2.78342 | −2.4211 *** | −2.90936 | −2.4825 *** | −3.01443 | −2.53742 *** |
| Walking distance to the nearest hospital (Contrast: <1 km) | ||||||
| 1−3 km | −0.0443 | −0.6757 | −0.05878 | −0.89005 | −0.09188 | −1.34569 * |
| ≥3 km | −0.31986 | −2.2543 ** | −0.36723 | −2.55879 *** | −0.37193 | −2.4985 *** |
| Greening coverage (Contrast: Verygood) | ||||||
| Good | 0.64887 | 6.7276 *** | 0.33796 | 3.25761 *** | 0.357945 | 3.38118 *** |
| Fair | 1.22326 | 11.5627 *** | 0.78936 | 6.83316 *** | 0.790332 | 6.70318 *** |
| Bad | 1.41848 | 9.9129 *** | 0.93469 | 6.08199 *** | 0.903472 | 5.76069 *** |
| Very bad | 0.54758 | 1.3017 * | 0.29634 | 0.68471 | 0.378306 | 0.85676 |
| Housing type (Contrast: Commodity housing) | ||||||
| Rented housing | −0.09131 | −0.9317 | −0.11341 | −1.14072 | −0.11477 | −1.13111 |
| Danwei housing | −0.0773 | −0.4006 | −0.1645 | −0.84956 | −0.22403 | −1.13063 |
| Housing area (Contrast: Housing area < 100 m2) | ||||||
| Housing area ≥ 100 m2 | −0.51824 | −6.7257 *** | −0.51184 | −6.60108 *** | −0.50503 | −6.27832 *** |
| Urban waterlogging (Contrast: very good) | ||||||
| good | −0.09806 | −1.0205 | −0.16669 | −1.62373 * | −0.17909 | −1.69718 ** |
| Fair | 0.15536 | 1.5962 * | 0.03447 | 0.33777 | 0.006172 | 0.05892 |
| bad | 0.54859 | 4.8724 *** | 0.25674 | 2.0679 ** | 0.237911 | 1.8784 ** |
| Very bad | 0.61814 | 3.2046 *** | 0.35968 | 1.71195 ** | 0.324823 | 1.51901 * |
| Water pollution (Contrast: Very low) | ||||||
| Low | 0.34993 | 3.16219 *** | 0.36494 | 3.23853 *** | ||
| Fair | 0.56717 | 5.00739 *** | 0.571593 | 4.9426 *** | ||
| High | 0.29573 | 2.02868 ** | 0.321115 | 2.16455 ** | ||
| Very high | 0.45921 | 2.07983 ** | 0.564549 | 2.48986 *** | ||
| Landfill pollution (Contrast: Very low) | ||||||
| Low | 0.18769 | 1.65067 ** | 0.183207 | 1.57489 * | ||
| Fair | 0.31574 | 2.83984 *** | 0.306699 | 2.69744 *** | ||
| High | 0.49848 | 3.77843 *** | 0.444475 | 3.29695 *** | ||
| Very high | 0.52889 | 2.55582 *** | 0.515924 | 2.44589 *** | ||
| Air pollution (Contrast: Very low) | ||||||
| Low | 0.37653 | 3.27875 *** | 0.399906 | 3.40899 *** | ||
| Fair | 0.34572 | 3.02955 *** | 0.394031 | 3.37957 *** | ||
| High | 0.24951 | 1.94122 ** | 0.286432 | 2.18339 ** | ||
| Very high | 0.03808 | 0.19984 | 0.111245 | 0.57333 | ||
| Noise pollution (Contrast: Very low) | ||||||
| Low | 0.24434 | 2.217 ** | 0.252614 | 2.24819 ** | ||
| Fair | 0.4766 | 4.21765 *** | 0.490912 | 4.27303 *** | ||
| High | 0.5428 | 4.06375 *** | 0.554227 | 4.07914 *** | ||
| Very high | 0.36328 | 1.70501 ** | 0.422682 | 1.94788 ** | ||
| Subdistrict (Jiedao) (Contrast: Sanguanmiao Subdistrict) | ||||||
| Chengdonglu Subdistrict | 1.00996 | 2.75323 *** | ||||
| Huayuankou town | −0.9158 | −1.76298 ** | ||||
| Dongdajie Subdistrict | 0.828687 | 2.34175 ** | ||||
| Lvdongcun Subdistrict | 1.033971 | 2.47699 *** | ||||
| Longyuanlu Subdistrict | 1.183477 | 1.72045 * | ||||
| Erligang Subdistrict | 0.828864 | 2.15024 ** | ||||
Publisher’s Note: MDPI stays neutral with regard to jurisdictional claims in published maps and institutional affiliations. |
© 2022 by the authors. Licensee MDPI, Basel, Switzerland. This article is an open access article distributed under the terms and conditions of the Creative Commons Attribution (CC BY) license (https://creativecommons.org/licenses/by/4.0/).
Share and Cite
Zhao, H.; Yue, L.; Jia, Z.; Su, L. Spatial Inequalities and Influencing Factors of Self-Rated Health and Perceived Environmental Hazards in a Metropolis: A Case Study of Zhengzhou City, China. Int. J. Environ. Res. Public Health 2022, 19, 7551. https://doi.org/10.3390/ijerph19127551
Zhao H, Yue L, Jia Z, Su L. Spatial Inequalities and Influencing Factors of Self-Rated Health and Perceived Environmental Hazards in a Metropolis: A Case Study of Zhengzhou City, China. International Journal of Environmental Research and Public Health. 2022; 19(12):7551. https://doi.org/10.3390/ijerph19127551
Chicago/Turabian StyleZhao, Hongbo, Li Yue, Zeting Jia, and Lingling Su. 2022. "Spatial Inequalities and Influencing Factors of Self-Rated Health and Perceived Environmental Hazards in a Metropolis: A Case Study of Zhengzhou City, China" International Journal of Environmental Research and Public Health 19, no. 12: 7551. https://doi.org/10.3390/ijerph19127551