
Identifying the Psychometric Properties of the Malay Version of the WHOQOL-BREF among Employees with Obesity Problem

 , , and
Abstract
:1. Introduction
2. Materials and Methods
2.1. Participants
2.2. Translation and Cultural Adaptation Methods
- Step 1
- Step 2
- Step 3
- Step 4
- Step 5
- Step 6
- Step 7
2.3. Measure
2.4. Statistical Analysis
3. Results
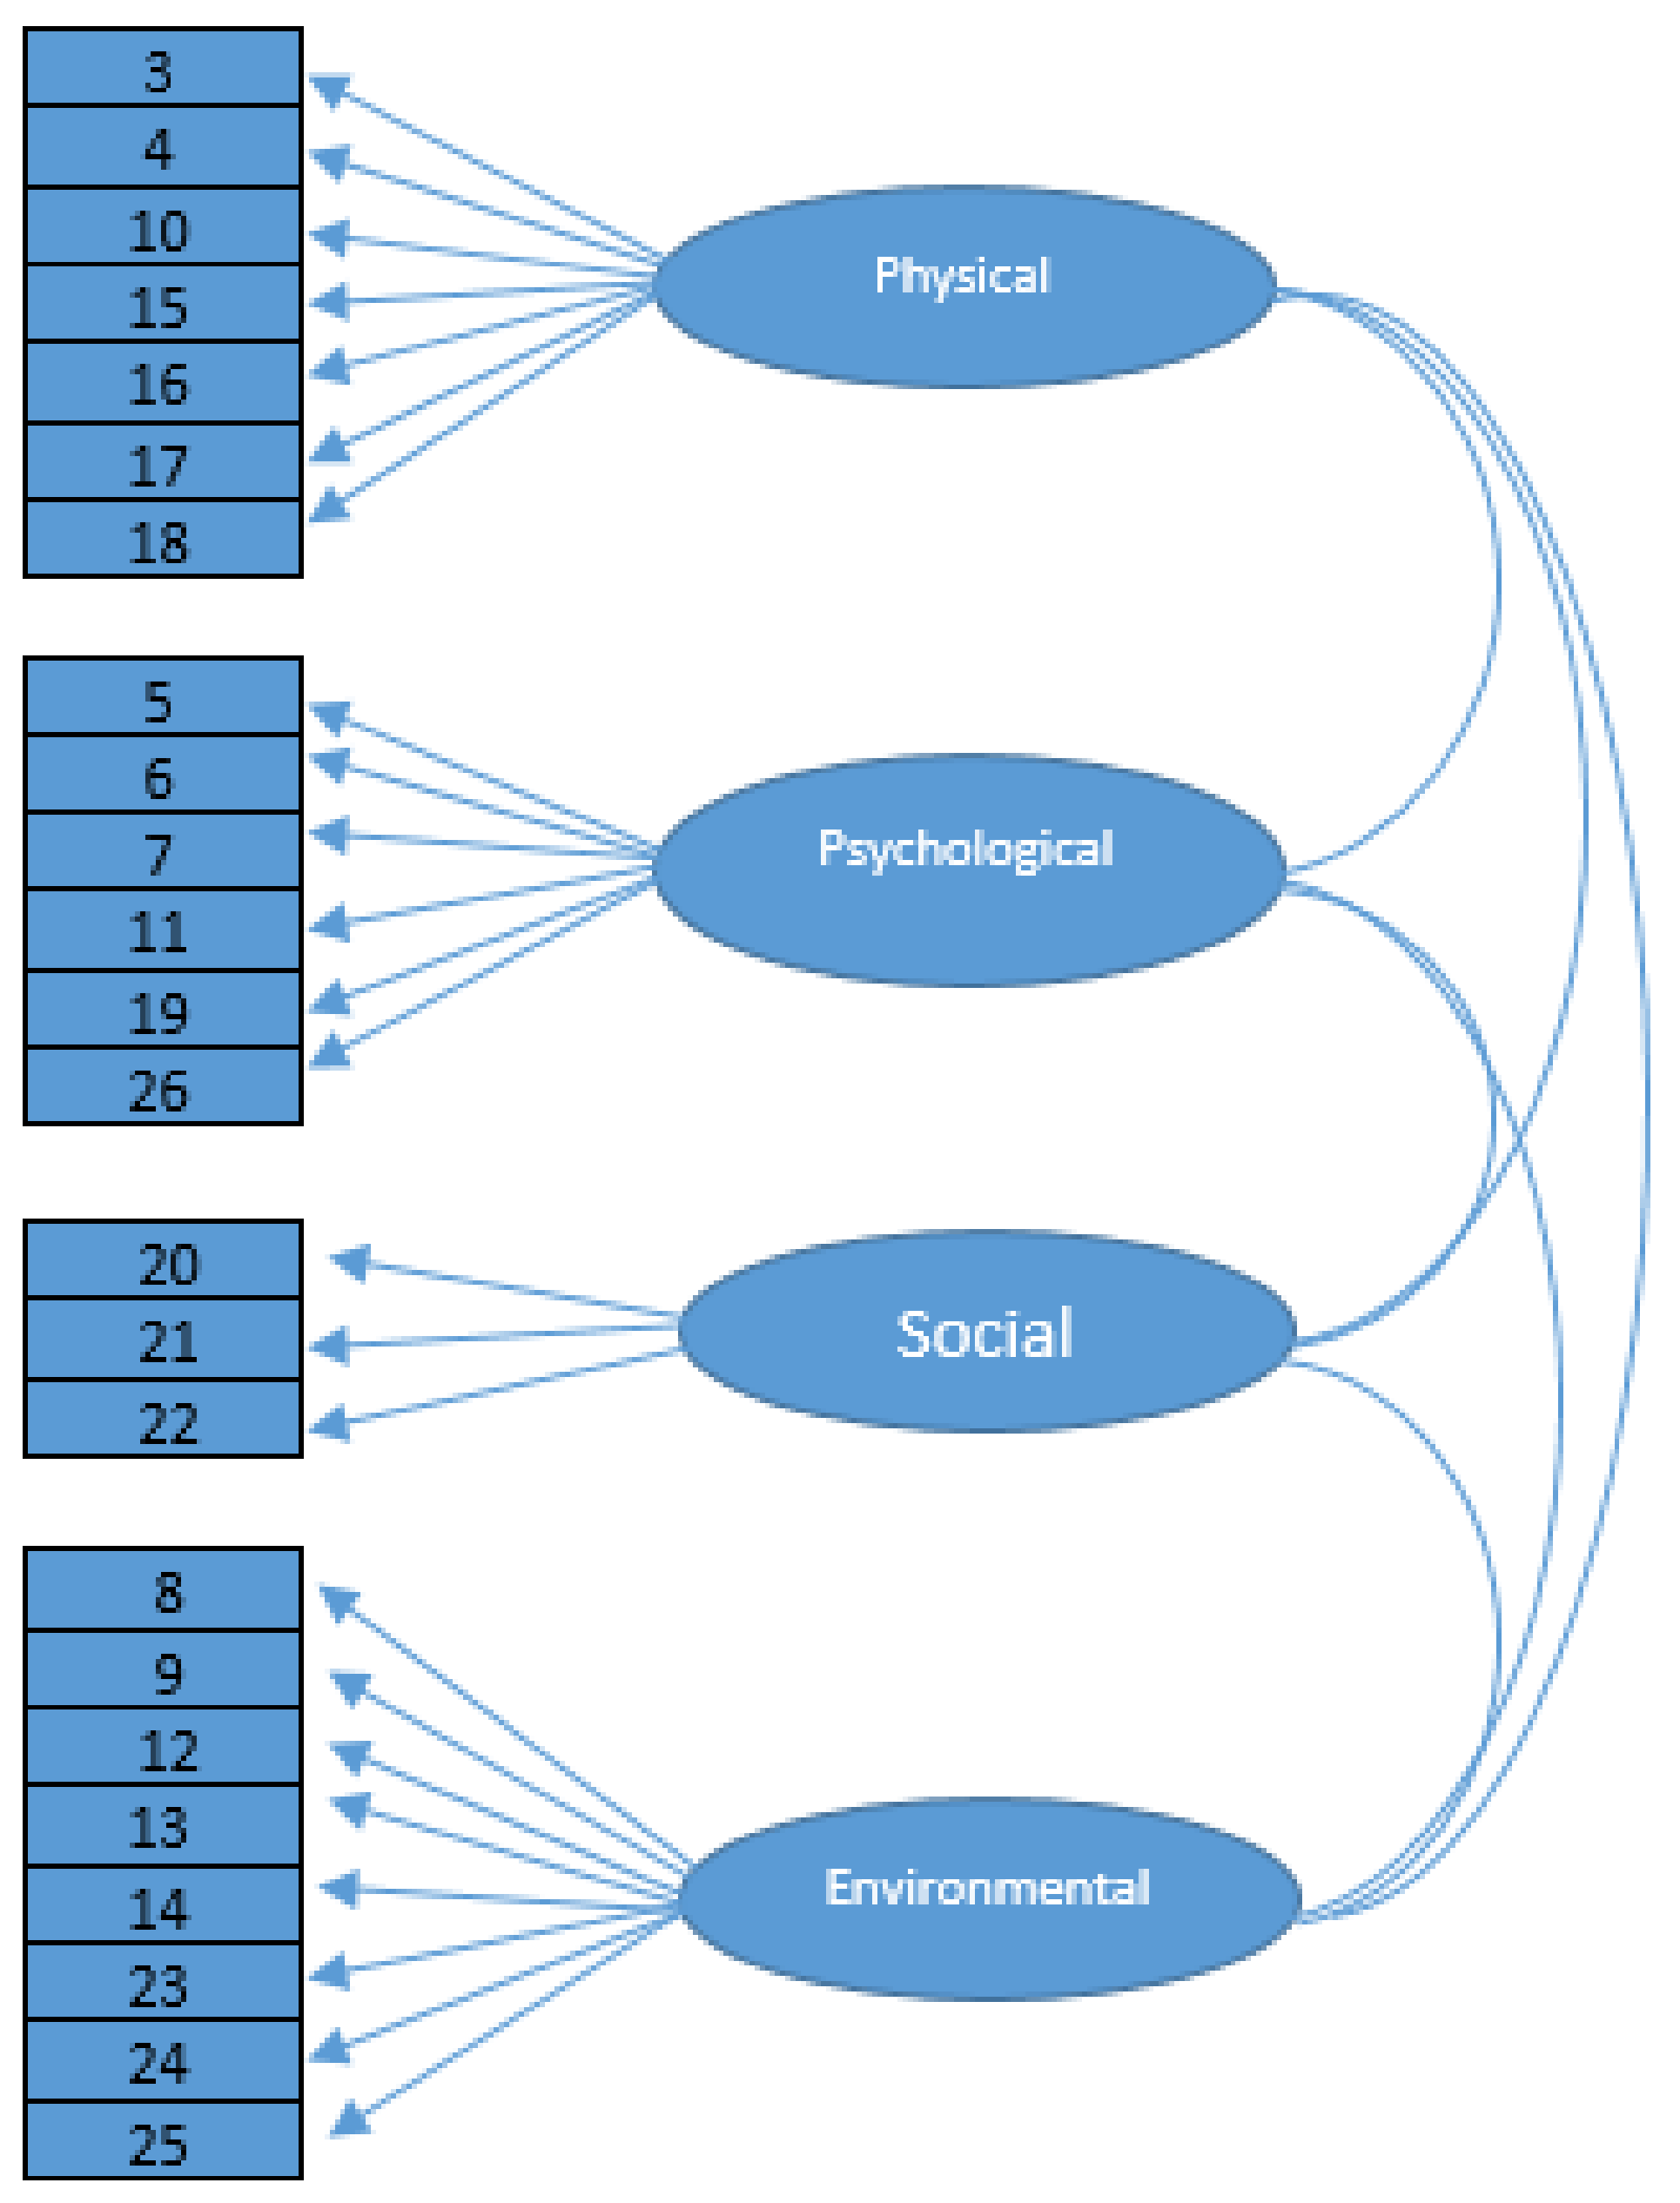
3.1. Factor Loading and Communalities
3.2. Model Fit Assessment
4. Discussion
5. Implications
6. Conclusions
Author Contributions
Funding
Institutional Review Board Statement
Informed Consent Statement
Data Availability Statement
Acknowledgments
Conflicts of Interest
References
- Lodhi, F.S.; Montazeri, A.; Nedjat, S.; Mahmoodi, M.; Farooq, U.; Yaseri, M.; Holakouie-Naieni, K. Assessing the quality of life among Pakistani general population and their associated factors by using the World Health Organization’s quality of life instrument (WHOQOL-BREF): A population based cross-sectional study. Health Qual. Life Outcomes 2019, 17, 1–17. [Google Scholar] [CrossRef] [Green Version]
- Carrard, V.; Kunz, S.; Peter, C. Mental health, quality of life, self-efficacy, and social support of individuals living with spinal cord injury in Switzerland compared to that of the general population. Spinal Cord. 2021, 59, 398–409. [Google Scholar] [CrossRef] [PubMed]
- Epifanio, M.S.; Andrei, F.; Mancini, G.; Agostini, F.; Piombo, M.A.; Spicuzza, V.; La Grutta, S. The impact of COVID-19 pandemic and lockdown measures on quality of life among Italian general population. J. Clin. Med. 2021, 10, 289. [Google Scholar] [CrossRef] [PubMed]
- Balchin, C.; Tan, A.L.; Wilson, O.J.; McKenna, J.; Stavropoulos-Kalinoglou, A. Participation in physical activity decreased more in people with rheumatoid arthritis than the general population during the COVID-19 lockdown: A cross-sectional study. Rheumatol. Int. 2022, 42, 241–250. [Google Scholar] [CrossRef] [PubMed]
- Al-Taie, N.; Maftei, D.; Kautzky-Willer, A.; Krebs, M.; Stingl, H. Assessing the quality of life among patients with diabetes in Austria and the correlation between glycemic control and the quality of life. Prim. Care Diabetes 2020, 14, 133–138. [Google Scholar] [CrossRef] [PubMed]
- Iqbal, M.S.; Kassab, Y.W.; Al-Saikhan, F.I.; Almalki, Z.S.; Haseeb, A.; Iqbal, M.Z.; Ali, M. Assessing quality of life using WHOQOL-BREF: A cross-sectional insight among patients on warfarin in Malaysia. Saudi Pharm. J. 2020, 28, 936–942. [Google Scholar] [CrossRef] [PubMed]
- Ilić, I.; Šipetić-Grujičić, S.; Grujičić, J.; Živanović Mačužić, I.; Kocić, S.; Ilić, M. Psychometric properties of the world health organization’s quality of life (WHOQOL-BREF) questionnaire in medical students. Medicina 2019, 55, 772. [Google Scholar] [CrossRef] [PubMed] [Green Version]
- Roy, B.; Naidu, C.R.; Perumal, V.; Vallipuram, P.; Subramaniam, J.; Chandrakeran, S.K.; Jacob, L. Quality of life (QoL) among medical students of clinical years in Perak state, Malaysia: A study using the WHOQOL-BREF instrument. Quest Int. J. Med. Health Sci. 2020, 3, 24–32. [Google Scholar]
- Gagliardi, J.; Brettschneider, C.; König, H.H. Health-related quality of life of refugees: A systematic review of studies using the WHOQOL-Bref instrument in general and clinical refugee populations in the community setting. Confl. Health 2021, 15, 1–14. [Google Scholar] [CrossRef]
- Yee, A.; Hodori, N.A.M.; Tung, Y.Z.; Ooi, P.L.; Latif, S.A.B.A.; Isa, H.M.; Tan, S.B. Depression level and coping responses toward the movement control order and its impact on quality of life in the Malaysian community during the COVID-19 pandemic: A web-based cross-sectional study. Ann. Gen. Psychiatry 2021, 20, 1–9. [Google Scholar] [CrossRef]
- Korkmaz, S.; Kazgan, A.; Çekiç, S.; Tartar, A.S.; Balcı, H.N.; Atmaca, M. The anxiety levels, quality of sleep and life and problem-solving skills in healthcare workers employed in COVID-19 services. J. Clin. Neurosci. 2021, 80, 131–136. [Google Scholar] [CrossRef]
- Abdul Manaf, M.R.; Mohammed Nawi, A.; Mohd Tauhid, N.; Othman, H.; Abdul Rahman, M.R.; Mohd Yusoff, H.; Ganasegeran, K. Factors Associated with Health-Related Quality of Life amongst Employees in a Malaysian Public University. Int. J. Environ. Res. Public Health 2021, 18, 10903. [Google Scholar] [CrossRef]
- The WHOQOL Group. WHOQOL-BREF Introduction, Administration and Scoring, Field Trial Version; World Health Organization: Geneva, Switzerland, 1996. [Google Scholar]
- Lucchetti, G.; Damiano, R.F.; DiLalla, L.F.; Lucchetti, A.L.G.; Moutinho, I.L.D.; da Silva Ezequiel, O.; Kevin Dorsey, J. Cross-cultural differences in mental health, quality of life, empathy, and burnout between US and Brazilian medical students. Acad. Psychiatry 2018, 42, 62–67. [Google Scholar] [CrossRef]
- Rezaeipandari, H.; Morowatisharifabad, M.A.; Mohammadpoorasl, A.; Shaghaghi, A. Cross-cultural adaptation and psychometric validation of the World Health Organization quality of life-old module (WHOQOL-OLD) for Persian-speaking populations. Health Qual. Life Outcomes 2020, 18, 1–7. [Google Scholar] [CrossRef] [Green Version]
- Saxena, S.; Carlson, D.; Billington, R.; Orley, J. The WHO quality of life assessment instrument (WHOQOL-Bref): The importance of its items for cross-cultural research. Qual. Life Res. 2001, 10, 711–721. [Google Scholar] [CrossRef]
- Haraldstad, K.; Wahl, A.; Andenæs, R.; Andersen, J.R.; Andersen, M.H.; Beisland, E.; Helseth, S. A systematic review of quality of life research in medicine and health sciences. Qual. Life Res. 2019, 28, 2641–2650. [Google Scholar] [CrossRef] [Green Version]
- Zheng, S.; He, A.; Yu, Y.; Jiang, L.; Liang, J.; Wang, P. Research trends and hotspots of health-related quality of life: A bibliometric analysis from 2000 to 2019. Health Qual. Life Outcomes 2021, 19, 1–13. [Google Scholar] [CrossRef]
- Hasanah, C.I.; Naing, L.; Rahman, A.R.A. World Health Organization quality of life assessment: Brief version in Bahasa Malaysia. Med. J. Malays. 2003, 58, 79–88. [Google Scholar]
- Abdullah Bandar, N.F.; Jani, R.; Karim, M.A. Psychometric properties of the WHOQOL-BREF questionnaire among disabled students in Malaysian higher learning institutions. Appl. Res. Qual. Life 2014, 9, 469–478. [Google Scholar] [CrossRef]
- Jani, R.; Alias, A.A.; Awang, H.; Arunasalam, R.S. Psychometric properties of the WHO quality of life disability (WHOQOL-DIS) among persons with disabilities in Malaysia. Pertanika. J. Soc. Sci. Humanit. 2020, 28, 2113–2127. [Google Scholar]
- Hambleton, R.K.; Li, S. Translation and Adaptation Issues and Methods for Educational and Psychological Tests. In Comprehensive Handbook of Multicultural School Psychology; Frisby, C.L., Reynolds, C.R., Eds.; John Wiley Sons, Inc.: Hoboken, NJ, USA, 2005; pp. 881–903. [Google Scholar]
- Prieto, A.J. A Method for Translation of Instruments to Other Languages. Adult Educ. Q. 1992, 43, 1–14. [Google Scholar] [CrossRef]
- Vermeer, H.J. Describing nonverbal behavior in the Odyssey: Scenes and verbal frames as translation problems. In Advances in Nonverbal Communication: Sociocultural, Clinical, Esthetic and Literary Per-Spectives; Poyatos, F., Ed.; John Benjamins Publishing: Amsterdam, The Netherlands, 1992; pp. 285–300. [Google Scholar]
- Gudmundsson, E. Guidelines for translating and adapting psychological instruments. Nord. Psychol. 2009, 61, 29–45. [Google Scholar] [CrossRef]
- Ferrer, M.; Alonso, J.; Prieto, L.; Plaza, V.; Monsó, E.; Marrades, R.; Antó, J.M. Validity and reliability of the St George’s Respiratory Questionnaire after adaptation to a different language and culture: The Spanish example. Eur. Respir. J. 1996, 9, 1160–1166. [Google Scholar] [CrossRef] [Green Version]
- Chang, A.M.; Chau, J.P.; Holroyd, E. Translation of questionnaires and issues of equivalence. J. Adv. Nurs. 1999, 29, 316–322. [Google Scholar] [CrossRef]
- Edwards, J. Minority Languages and Group Identity: Cases and Categories; John Benjamins Publishing: Amsterdam, The Netherlands, 2010; Volume 27. [Google Scholar]
- Harkness, J.; Schoua-Glusberg, A. Questionnaires in translation. In Cross-Cultural Survey Equivalence; Harkness, J., Ed.; Zentrum für Umfragen, Methoden und Analysen ZUMA: Mannheim, Germany, 1998; pp. 87–126. [Google Scholar]
- Van de Vijver, F.; Tanzer, N.K. Bias and equivalence in cross-cultural assessment: An overview. Eur. Rev. Appl. Psychology 2004, 54, 119–135. [Google Scholar] [CrossRef] [Green Version]
- Douglas, S.P.; Craig, C.S. Collaborative and iterative translation: An alternative approach to back translation. J. Int. Mark. 2007, 15, 30–43. [Google Scholar] [CrossRef]
- Wu, L.F.; Yang, S.H.; Koo, M. Psychometric properties of the Chinese version of Spiritual Index of Well-Being in elderly Taiwanese. BMC Geriatr. 2017, 17, 3. [Google Scholar] [CrossRef] [PubMed] [Green Version]
- Brislin, R.W. Back-translation for cross-cultural research. J. Cross-Cult. Psychol. 1970, 1, 185–216. [Google Scholar] [CrossRef]
- Del Greco, L.; Walop, W.; Eastridge, L. Questionnaire development: 3. Translation. CMAJ Can. Med. Assoc. J. 1987, 136, 817. [Google Scholar]
- Triandis, H.C.; Brislin, R.W. Cross-cultural psychology. Am. Psychol. 1984, 39, 1006. [Google Scholar] [CrossRef]
- Saleem, S.; Larimo, J.A.; Ummik, K.; Kuusik, A. Cultural and paradoxical values in advertising in Eastern Europe: Evidence from Estonia. Balt. J. Manag. 2015, 10, 313–330. [Google Scholar] [CrossRef]
- Maxwell, B. Translation and cultural adaptation of the survey instruments. In Third International Mathematics and Science Study (TIMSS) Technical Report; Martin, M.O., Kelly, D.L., Eds.; Boston College: Chestnut Hill, MA, USA, 1996; Volume 1, pp. 159–169. [Google Scholar]
- Brislin, R.W. The wording and translation of research instruments. In Field Methods in Cross-Cultural Research; Lonner, W.J., Berry, J.W., Eds.; SAGE Publications: Beverly Hills, CA, USA, 1986; pp. 137–164. [Google Scholar]
- Jones, P.S.; Lee, J.W.; Phillips, L.R.; Zhang, X.E.; Jaceldo, K.B. An adaptation of Brislin’s translation model for cross-cultural research. Nurs. Res. 2001, 50, 300–304. [Google Scholar] [CrossRef] [PubMed]
- Tsai, C. Inside the television newsroom: An insider’s view of international news translation in Taiwan. Lang. Intercult. Commun. 2005, 5, 145–153. [Google Scholar] [CrossRef]
- Mezias, J.M.; Starbuck, W.H. Studying the accuracy of managers’ perceptions: A research odyssey. Br. J. Manag. 2003, 14, 3–17. [Google Scholar] [CrossRef]
- Tweney, R.D.; Hoemann, H.W.; Andrews, C.E. Semantic organization in deaf and hearing subjects. J. Psycholinguist. Res. 1975, 4, 61–73. [Google Scholar] [CrossRef]
- Bracken, B.A.; Barona, A. State of the art procedures for translating, validating and using psychoeducational tests in cross-cultural assessment. Sch. Psychol. Int. 1991, 12, 119–132. [Google Scholar] [CrossRef]
- Maneesriwongul, W.; Dixon, J.K. Instrument translation process: A methods review. J. Adv. Nurs. 2004, 48, 175–186. [Google Scholar] [CrossRef]
- Sousa, V.D.; Rojjanasrirat, W. Translation, adaptation and validation of instruments or scales for use in cross-cultural health care research: A clear and user-friendly guideline. J. Eval. Clin. Pract. 2011, 17, 268–274. [Google Scholar] [CrossRef]
- Squires, A. Methodological challenges in cross-language qualitative research: A research review. Int. J. Nurs. Stud. 2009, 46, 277–287. [Google Scholar] [CrossRef] [Green Version]
- Baumbusch, J.L.; Kirkham, S.R.; Khan, K.B.; McDonald, H.; Semeniuk, P.; Tan, E.; Anderson, J.M. Pursuing common agendas: A collaborative model for knowledge translation between research and practice in clinical settings. Res. Nurs. Health 2008, 31, 130–140. [Google Scholar] [CrossRef]
- Zhao, H.; Kanda, K. Translation and validation of the standard Chinese version of the EORTC QLQ-C30. Qual. Life Res. 2000, 9, 129–137. [Google Scholar] [CrossRef]
- Formea, C.M.; Mohamed, A.A.; Hassan, A.; Osman, A.; Weis, J.A.; Sia, I.G.; Wieland, M.L. Lessons learned: Cultural and linguistic enhancement of surveys through community-based participatory research. Prog. Community Health Partnersh. Res. Educ. Action 2014, 8, 331. [Google Scholar] [CrossRef] [Green Version]
- McCrae, R.R.; Costa, P.T., Jr. Personality trait structure as a human universal. Am. Psychol. 1997, 52, 509. [Google Scholar] [CrossRef]
- Chapman, D.W.; Carter, J.F. Translation procedures for the cross cultural use of measurement instruments. Educ. Eval. Policy Anal. 1979, 1, 71–76. [Google Scholar] [CrossRef]
- Squires, J.E.; Ehrenberg, A.; Estabrooks, C.A.; Eldh, A.C.; Wallin, L. Translating and testing the Alberta context tool for use among nurses in Swedish elder care. BMC Health Serv. Res. 2013, 13, 68. [Google Scholar]
- Zolotor, A.J.; Runyan, D.K.; Dunne, M.P.; Jain, D.; Péturs, H.R.; Ramirez, C.; Isaeva, O. ISPCAN Child Abuse Screening Tool Children’s Version (ICAST-C): Instrument development and multi-national pilot testing. Child Abus. Negl. 2009, 33, 833–841. [Google Scholar] [CrossRef]
- Park, E.H.; So, Y.K.; Choi, N.K.; Kim, S.J.; Noh, J.S.; Ko, Y.J.; Kim, Y.S. The reliability and validity of Korean Conners Parent and Teacher Rating scale. J. Korean Acad. Child Adolesc. Psychiatry 2003, 14, 183–196. [Google Scholar]
- Kline, R.B. Structural Equation Modeling; Guilford: New York, NY, USA, 1998. [Google Scholar]
- Williams, B.; Onsman, A.; Brown, T. Exploratory factor analysis: A five-step guide for novices. Australas. J. Paramed. 2010, 8, 1–13. [Google Scholar] [CrossRef] [Green Version]
- Barrett, P. Structural equation modelling: Adjudging model fit. Personal. Individ. Differ. 2007, 42, 815–824. [Google Scholar] [CrossRef]
- Fabrigar, L.R.; Wegener, D.T.; MacCallum, R.C.; Strahan, E.J. Evaluating the use of exploratory factor analysis in psychological research. Psychol. Methods 1999, 4, 272. [Google Scholar] [CrossRef]
- MacCallum, R.C.; Widaman, K.F.; Zhang, S.; Hong, S. Sample size in factor analysis. Psychol. Methods 1999, 4, 84. [Google Scholar] [CrossRef]
- Peiper, N.; Clayton, R.; Wilson, R.; Illback, R. The performance of the K6 Scale in a large school sample. Psychol. Assess. 2015, 27, 228. [Google Scholar] [CrossRef]
- Farrell, A.M.; Rudd, J.M. Factor Analysis and Discriminant Validity: A Brief Review of Some Practical Issues. In Proceedings of the Australia and New Zealand Marketing Academy Conference (ANZMAC), Melbourne, Australia, 30 November–2 December 2009. [Google Scholar]
- Suhr, D. Exploratory or Confirmatory Factor Analysis. SAS Users Group International Conference; SAS Institute, Inc.: Cary, NJ, USA, 2006; pp. 1–17. [Google Scholar]
- Chen, F.; Curran, P.J.; Bollen, K.A.; Kirby, J.; Paxton, P. An empirical evaluation of the use of fixed cutoff points in RMSEA test statistic in structural equation models. Sociol. Methods Res. 2008, 36, 462–494. [Google Scholar] [CrossRef] [Green Version]
- Kaiser, H.F. An index of factorial simplicity. Psychometrika 1974, 39, 31–36. [Google Scholar] [CrossRef]
- Watson, R.; Thompson, D.R. Use of factor analysis in Journal of Advanced Nursing: Literature review. J. Adv. Nurs. 2006, 55, 330–341. [Google Scholar] [CrossRef]
- Cattell, R.B. A biometrics invited paper. Factor analysis: An introduction to essentials I. The purpose and underlying models. Biometrics 1965, 21, 190–215. [Google Scholar] [CrossRef]
- Hair, J.F.; Black, W.C.; Babin, B.J.; Anderson, R.E. Multivariate Data Analysis, 7th ed.; Prentice Hall: Englewood Cliffs, NJ, USA, 2009. [Google Scholar]
- Campbell, D.T.; Fiske, D.W. Convergent and discriminant validation by the multitrait-multimethod matrix. Psychol. Bull. 1959, 56, 81–105. [Google Scholar] [CrossRef] [PubMed] [Green Version]
- Mussel, P. Epistemic curiosity and related constructs: Lacking evidence of discriminant validity. Personal. Individ. Differ. 2010, 49, 506–510. [Google Scholar] [CrossRef]
- DeVon, H.A.; Block, M.E.; Moyle-Wright, P.; Ernst, D.M.; Hayden, S.J.; Lazzara, D.J.; Kostas-Polston, E. A psychometric toolbox for testing validity and reliability. J. Nurs. Scholarsh. 2007, 39, 155–164. [Google Scholar] [CrossRef]
- Peterson, R.A. A Meta-analysis of Cronbach’s Coefficient Alpha. J. Consum. Res. 1994, 21, 381–391. [Google Scholar] [CrossRef]
- Schmitt, N. Uses and abuses of Coefficient Alpha. Psychol. Assess. 1996, 8, 350–353. [Google Scholar] [CrossRef]
- Raykov, T.; Gabler, S.; Dimitrov, D.M. Maximal reliability and composite reliability: Examining their difference for multicomponent measuring instruments using latent variable modeling. Struct. Equ. Modeling: A Multidiscip. J. 2016, 23, 384–391. [Google Scholar] [CrossRef]
- Raykov, T. Estimation of maximal reliability: A note on a covariance structure modelling approach. Br. J. Math. Stat. Psychol. 2004, 57, 21–27. [Google Scholar] [CrossRef]
- Child, D. The Essentials of Factor Analysis; A&C Black: Edinburgh, UK, 2006. [Google Scholar]
- Hu, L.; Bentler, P. Evaluating model fit. In Structural Equation Modeling. Concepts, Issues, and Applications; Hoyle, R.H., Ed.; Sage: London, UK, 1995; pp. 76–99. [Google Scholar]
- Sharma, S.; Mukherjee, S.; Kumar, A.; Dillon, W.R. A simulation study to investigate the use of cutoff values for assessing model fit in covariance structure models. J. Bus. Res. 2005, 58, 935–943. [Google Scholar] [CrossRef]
- Li, L.; Young, D.; Xiao, S.; Zhou, X.; Zhou, L. Psychometric properties of the WHO Quality of Life questionnaire (WHOQOL-100) in patients with chronic diseases and their caregivers in China. Bull. World Health Organ. 2004, 82, 493–502. [Google Scholar]
- Kalfoss, M.H.; Reidunsdatter, R.J.; Klöckner, C.A.; Nilsen, M. Validation of the WHOQOL-Bref: Psychometric properties and normative data for the Norwegian general population. Health Qual. Life Outcomes 2021, 19, 1–12. [Google Scholar] [CrossRef]
- Knekta, E.; Runyon, C.; Eddy, S. One size doesn’t fit all: Using factor analysis to gather validity evidence when using surveys in your research. CBE—Life Sci. Educ. 2019, 18, rm1. [Google Scholar] [CrossRef]
- Lima, L.R.D.; Funghetto, S.S.; Volpe, C.R.G.; Santos, W.S.; Funez, M.I.; Stival, M.M. Quality of life and time since diagnosis of diabetes mellitus among the elderly. Rev. Bras. De Geriatr. E Gerontol. 2018, 21, 176–185. [Google Scholar] [CrossRef] [Green Version]
- Tchicaya, A.; Lorentz, N.; Demarest, S.; Beissel, J.; Wagner, D.R. Relationship between self-reported weight change, educational status, and health-related quality of life in patients with diabetes in Luxembourg. Health Qual. Life Outcomes 2015, 13, 1–9. [Google Scholar] [CrossRef] [Green Version]
- Reid, N.; Mason, J.; Kurdyak, P.; Nisenbaum, R.; de Oliveira, C.; Hwang, S.; Stergiopoulos, V. Evaluating the Impact of a Critical Time Intervention Adaptation on Health Care Utilization among Homeless Adults with Mental Health Needs in a Large Urban Center. Can. J. Psychiatry 2022, 67, 57–66. [Google Scholar] [CrossRef] [PubMed]
- Uys, L.R.; Holzemer, W.L.; Chirwa, M.L.; Dlamini, P.S.; Greeff, M.; Kohi, T.W.; Makoae, L.N.; Stewart, A.L.; Mullan, J.; Phetlhu, R.D.; et al. The development and validation of the HIV/AIDS Stigma Instrument-Nurse (HASI-N). AIDS Care 2009, 21, 150–159. [Google Scholar] [CrossRef] [PubMed] [Green Version]
- Abdul Kadir, N.B.; Ismail, W.N.K.; Abdullah, N.-A.; Helma, R.; Abdul Jalil, S.J.; Che Kasim, A.; Hoesni, S.M.; Manaf, M.R.A. Criterion Validity and Psychometric Properties of a Malay Version of the Short Multidimensional Inventory Lifestyle Evaluation-Confinement (SMILE-C) in a Sample of University Staff with Weight Problems. Int. J. Environ. Res. Public Health 2021, 18, 10410. [Google Scholar] [CrossRef]
- Azam, M.; Aslam, M.; Basharat, J.; Mughal, M.A.; Nadeem, M.S.; Anwar, F. An empirical study on quality of life and related factors of Pakistani breast cancer survivors. Sci. Rep. 2021, 11, 1–11. [Google Scholar] [CrossRef] [PubMed]
- Farran, N.; Safieddine, B.R.; Bayram, M.; Abi Hanna, T.; Massouh, J.; AlKhawaja, M.; Darwish, H. Factors affecting MS patients’ health-related quality of life and measurement challenges in Lebanon and the MENA region. Mult. Scler. J. –Exp. Transl. Clin. 2020, 6, 2055217319848467. [Google Scholar] [CrossRef] [PubMed]
- Alijanpour, M.; Sadatmahalleh, S.J.; Samaneh, Y.; Mahnaz, B.K.; Majid, Y.A.; Moini, A.; Kazemnejad, A. Influence of Psycho-Sexual Factors on the Quality of Life in Pregnant Women during the COVID-19 Pandemic: A Path Analysis. 2021. Available online: https://www.researchsquare.com/article/rs-45196/v2 (accessed on 22 May 2022).
- Dinç Horasan, G.; Tarı Selçuk, K.; Sakarya, S.; Sözmen, K.; Ergör, G.; Yardım, N.; Ünal, B. Health-related quality of life and perceived health status of Turkish population. Qual. Life Res. 2019, 28, 2099–2109. [Google Scholar] [CrossRef] [PubMed]
- Maasoumi, R.; Mokarami, H.; Nazifi, M.; Stallones, L.; Taban, A.; Yazdani Aval, M.; Samimi, K. Psychometric properties of the Persian translation of the sexual quality of life–male questionnaire. Am. J. Men’s Health 2017, 11, 564–572. [Google Scholar] [CrossRef] [PubMed]
- Muhammad, N.A.; Shamsuddin, K.; Amin, R.M.; Omar, K.; Thurasamy, R. Questionnaire development and validity to measure sexual intention among youth in Malaysia. BMC Public Health 2017, 17, 157. [Google Scholar] [CrossRef] [Green Version]
- Abdul Kadir, A.; Mohd Arif, M.F.; Ishak, A.; Hassan, I.I.; Mohd Noor, N. Adaptation and Validation of the Malay Version of the Osteoarthritis Knee and Hip Quality of Life Questionnaire among Knee Osteoarthritis Patients. BioMed Res. Int. 2018, 2018, 4329751. [Google Scholar] [CrossRef] [Green Version]
- Achour, M.; Ab Halim, A.B.; Ali, A.R.H.; Sa’ari, C.Z.B.; Al-Nahari, A.A.A.Q. Religiosity and subjective well-being towards a balanced civilization: A study among Muslim older adults in Malaysia. J. Al-Tamaddun 2019, 14, 153–165. [Google Scholar] [CrossRef]
- Krauss, S.E.; Zeldin, S.; Abdullah, H.; Ortega, A.; Ali, Z.; Ismail, I.A.; Ariffin, Z. Malaysian youth associations as places for empowerment and engagement. Child. Youth Serv. Rev. 2020, 112, 104939. [Google Scholar] [CrossRef]
- Grothe, L.; Grothe, M.; Wingert, J.; Schomerus, G.; Speerforck, S. Stigma in Multiple Sclerosis: The Important Role of Sense of Coherence and Its Relation to Quality of Life. Int. J. Behav. Med. 2020, 1, 1–7. [Google Scholar] [CrossRef]
- Wong, F.Y.; Yang, L.; Yuen, J.W.; Chang, K.K.; Wong, F.K. Assessing quality of life using WHOQOL-BREF: A cross-sectional study on the association between quality of life and neighborhood environmental satisfaction, and the mediating effect of health-related behaviors. BMC Public Health 2018, 18, 1113. [Google Scholar] [CrossRef] [Green Version]
- Manaf, M.R.A.; Shaharuddin, M.A.-A.; Nawi, A.M.; Tauhid, N.M.; Othman, H.; Rahman, M.R.A.; Yusoff, H.M.; Safian, N.; Ng, P.Y.; Manaf, Z.A.; et al. Perceived Symptoms of Depression, Anxiety and Stress amongst Staff in a Malaysian Public University: A Workers Survey. Int. J. Environ. Res. Public Health 2021, 18, 11874. [Google Scholar] [CrossRef]
- Patrício, B.; Jesus, L.M.; Cruice, M.; Hall, A. Quality of life predictors and normative data. Soc. Indic. Res. 2014, 119, 1557–1570. [Google Scholar] [CrossRef] [Green Version]
- Jamaludin, T.S.S. Influence of Perceive Social Support or Pre-Operative Support Program on Quality of Life in Patients Awaiting Coronary Artery Bypass Grafting (CABG) Surgery: Mixed Method Systematic Review. Int. J. Care Sch. 2019, 2, 36–44. [Google Scholar]
- Abdul Basir, S.M.; Abdul Manaf, Z.; Ahmad, M.; Abdul Kadir, N.B.; Ismail, W.N.K.; Mat Ludin, A.F.; Shahar, S. Reliability and Validity of the Malay Mindful Eating Questionnaire (MEQ-M) among Overweight and Obese Adults. Int. J. Environ. Res. Public Health 2021, 18, 1021. [Google Scholar] [CrossRef]
- Abdul Kadir, N.B.; Rusyda, H.; Ismail, W.N.K.; Abdul Jalil, S.J.; Nurul-Azza, A.; Che Kasim, A.; Mohd Hoesni, S.; Mohd Rizal, A.M. Sustaining the Quality of Life for University Employees with Obesity Using Mindfulness Activities and Work Engagement: A Quasi-Experimental Design. Sustainability 2022, 14, 1925. [Google Scholar] [CrossRef]


| 1 | 2 | 3 | 4 | 5 | 6 | 7 | 8 | 9 | 10 | 11 | 12 | 13 | 14 | 15 | 16 | 17 | 18 | 19 | 20 | 21 | 22 | 23 | 24 | |
|---|---|---|---|---|---|---|---|---|---|---|---|---|---|---|---|---|---|---|---|---|---|---|---|---|
| 1 | 1 | |||||||||||||||||||||||
| 2 | 0.48 ** | 1 | ||||||||||||||||||||||
| 3 | −0.19 ** | −0.15 * | 1 | |||||||||||||||||||||
| 4 | −0.23 ** | −0.21 ** | 0.71 ** | 1 | ||||||||||||||||||||
| 5 | −0.20 ** | −0.21 ** | 0.54 ** | 0.59 ** | 1 | |||||||||||||||||||
| 6 | −0.26 ** | −0.16 * | 0.46 ** | 0.58 ** | 0.65 ** | 1 | ||||||||||||||||||
| 7 | −0.25 ** | −0.13 | 0.33 ** | 0.44 ** | 0.40 ** | 0.61 ** | 1 | |||||||||||||||||
| 8 | −0.26 ** | −0.22 ** | 0.39 ** | 0.44 ** | 0.46 ** | 0.52 ** | 0.46 ** | 1 | ||||||||||||||||
| 9 | −0.16 * | −0.03 | 0.19 ** | 0.22 ** | 0.22 ** | 0.22 ** | 0.20 ** | 0.38 ** | 1 | |||||||||||||||
| 10 | −0.26 ** | −0.11 | 0.32 ** | 0.34 ** | 0.33 ** | 0.48 ** | 0.36 ** | 0.41 ** | 0.45 ** | 1 | ||||||||||||||
| 11 | −0.25 ** | −0.19 ** | 0.40 ** | 0.39 ** | 0.43 ** | 0.48 ** | 0.36 ** | 0.52 ** | 0.44 ** | 0.66 ** | 1 | |||||||||||||
| 12 | −0.15 * | 0.03 | 0.18 ** | 0.20 ** | 0.15 * | 0.24 ** | 0.23 ** | 0.41 ** | 0.39 ** | 0.32 ** | 0.33 ** | 1 | ||||||||||||
| 13 | −0.31 ** | −0.30 ** | 0.25 ** | 0.26 ** | 0.19 ** | 0.34 ** | 0.35 ** | 0.45 ** | 0.23 ** | 0.26 ** | 0.33 ** | 0.39 ** | 1 | |||||||||||
| 14 | −0.17 ** | −0.09 | 0.27 ** | 0.25 ** | 0.28 ** | 0.27 ** | 0.23 ** | 0.36 ** | 0.29 ** | 0.35 ** | 0.30 ** | 0.33 ** | 0.25 ** | 1 | ||||||||||
| 15 | −0.40 ** | −0.20 ** | 0.36 ** | 0.35 ** | 0.32 ** | 0.41 ** | 0.39 ** | 0.60 ** | 0.33 ** | 0.40 ** | 0.40 ** | 0.42 ** | 0.47 ** | 0.58 ** | 1 | |||||||||
| 16 | −0.24 ** | −0.23 ** | 0.36 ** | 0.36 ** | 0.39 ** | 0.41 ** | 0.37 ** | 0.51 ** | 0.22 ** | 0.28 ** | 0.35 ** | 0.31 ** | 0.36 ** | 0.45 ** | 0.66 ** | 1 | ||||||||
| 17 | −0.29 ** | −0.16 * | 0.40 ** | 0.51 ** | 0.43 ** | 0.46 ** | 0.39 ** | 0.42 ** | 0.48 ** | 0.38 ** | 0.41 ** | 0.27 ** | 0.33 ** | 0.42 ** | 0.57 ** | 0.59 ** | 1 | |||||||
| 18 | −0.23 ** | −0.18 ** | 0.38 ** | 0.43 ** | 0.47 ** | 0.43 ** | 0.35 ** | 0.40 ** | 0.33 ** | 0.36 ** | 0.39 ** | 0.18 ** | 0.24 ** | 0.43 ** | 0.53 ** | 0.52 ** | 0.68 ** | 1 | ||||||
| 19 | −0.07 | −0.06 | 0.14 * | 0.20 ** | 0.25 ** | 0.27 ** | 0.24 ** | 0.19 ** | 0.19 ** | 0.27 ** | 0.18 ** | 0.13 | 0.19 ** | 0.23 ** | 0.27 ** | 0.32 ** | 0.36 ** | 0.59 ** | 1 | |||||
| 20 | −0.20 ** | −0.21 ** | 0.37 ** | 0.45 ** | 0.46 ** | 0.32 ** | 0.34 ** | 0.35 ** | 0.31 ** | 0.28 ** | 0.35 ** | 0.13 * | 0.27 ** | 0.31 ** | 0.41 ** | 0.50 ** | 0.56 ** | 0.53 ** | 0.36 ** | 1 | ||||
| 21 | −0.25 ** | −0.18 ** | 0.28 ** | 0.37 ** | 0.40 ** | 0.40 ** | 0.35 ** | 0.29 ** | 0.21 ** | 0.42 ** | 0.36 ** | 0.13 * | 0.26 ** | 0.33 ** | 0.35 ** | 0.37 ** | 0.45 ** | 0.56 ** | 0.44 ** | 0.57 ** | 1 | |||
| 22 | −0.13 * | −0.18 ** | 0.34 ** | 0.34 ** | 0.35 ** | 0.33 ** | 0.24 ** | 0.32 ** | 0.24 ** | 0.28 ** | 0.35 ** | 0.11 | 0.26 ** | 0.24 ** | 0.25 ** | 0.21 ** | 0.44 ** | 0.46 ** | 0.31 ** | 0.40 ** | 0.51 ** | 1 | ||
| 23 | −0.20 ** | −0.25 ** | 0.30 ** | 0.36 ** | 0.31 ** | 0.35 ** | 0.25 ** | 0.30 ** | 0.15 * | 0.33 ** | 0.31 ** | 0.1 | 0.25 ** | 0.25 ** | 0.29 ** | 0.35 ** | 0.45 ** | 0.40 ** | 0.32 ** | 0.41 ** | 0.57 ** | 0.58 ** | 1 | |
| 24 | 0.23 ** | 0.26 ** | −0.23 ** | −0.22 ** | −0.23 ** | −0.30 ** | −0.21 ** | −0.21 ** | −0.16 * | −0.20 ** | −0.17 * | −0.11 | −0.24 ** | −0.33 ** | −0.29 ** | −0.27 ** | −0.38 ** | −0.36 ** | −0.19 ** | −0.21 ** | −0.26 ** | −0.21 ** | −0.16 * | 1 |
| Factor | Item No. | Item | Factor Loading | Communality |
|---|---|---|---|---|
| 3 | To what extent do you feel that physical pain prevents you from doing what you need to do? | 0.41 | 0.17 | |
| 1 | 4 | How much do you need any medical treatment to function in your daily life? | 0.36 | 0.13 |
| Physical | ||||
| 10 | Do you have enough energy for everyday life? | 0.58 | 0.33 | |
| 15 | How well are you able to get around? | 0.40 | 0.16 | |
| 16 | How satisfied are you with your sleep? | 0.42 | 0.21 | |
| 17 | How satisfied are you with your ability to perform your daily living activities? | 0.69 | 0.47 | |
| 18 | How satisfied are you with your capacity for work? | 0.61 | 0.38 | |
| 5 | How much do you enjoy life? | 0.56 | 0.31 | |
| 6 | To what extent do you feel your life to be meaningful? | 0.64 | 0.44 | |
| 2 | 7 | How well are you able to concentrate? | 0.59 | 0.34 |
| Psychological | 11 | Are you able to accept your bodily appearance? | 0.45 | 0.20 |
| 19 | How satisfied are you with yourself? | 0.68 | 0.47 | |
| 26 | How often do you have negative feelings such as blue mood, despair, anxiety, depression? | 0.28 | 0.08 | |
| 20 | How satisfied are you with your personal relationships? | 0.68 | 0.46 | |
| 3 | 21 | How satisfied are you with sex life? | 0.42 | 0.18 |
| Social | 22 | How satisfied are you with the support you get from your friends? | 0.53 | 0.28 |
| 8 | How safe do you feel in your daily life? | 0.66 | 0.44 | |
| 9 | How healthy is your physical environment? | 0.50 | 0.25 | |
| 4 | 12 | Have you enough money to meet your needs? | ||
| Environmental | 13 | How available to you is the information that you need in your day-to-day life? | 0.57 | 0.32 |
| 14 | To what extent do you have the opportunity for leisure activities? | 0.36 | 0.13 | |
| 23 | How satisfied are you with the conditions of your living place? | 0.57 | 0.33 | |
| 24 | How satisfied are you with your access to health services? | 0.48 | 0.23 | |
| 25 | How satisfied are you with your transport? | 0.52 | 0.27 |
| Factors | CR | AVE | MSV | Max R(H) | AC |
|---|---|---|---|---|---|
| Physical | 0.75 | 0.53 | 0.10 | 0.97 | 0.71 |
| Psychological | 0.90 | 0.60 | 0.15 | 0.94 | 0.77 |
| Social | 0.83 | 0.62 | 0.07 | 0.97 | 0.79 |
| Environmental | 0.78 | 0.55 | 0.14 | 0.83 | 0.74 |
| Factor | Item No. | Item | M | SD | Skewness | Kurtosis | Range |
|---|---|---|---|---|---|---|---|
| 3 | To what extent do you feel that physical pain prevents you from doing what you need to do? | 2.77 | 0.85 | 0.01 | 0.17 | 1–5 | |
| 1 Physical | 4 | How much do you need any medical treatment to function in your daily life? | 2.18 | 0.90 | 0.33 | −0.31 | 1–5 |
| 10 | Do you have enough energy for everyday life? | 3.77 | 0.71 | −0.00 | 0.40 | 2–5 | |
| 15 | How well are you able to get around? | 4.01 | 0.95 | −0.94 | 0.67 | 1–5 | |
| 16 | How satisfied are you with your sleep? | 3.50 | 0.83 | −0.35 | −0.35 | 1–5 | |
| 17 | How satisfied are you with your ability to perform your daily living activities? | 3.64 | 0.76 | −0.76 | 1.17 | 1–5 | |
| 18 | How satisfied are you with your capacity for work? | 3.79 | 0.68 | −0.94 | 2.40 | 1–5 | |
| 5 | How much do you enjoy life? | 3.81 | 0.64 | 0.10 | −0.45 | 2–5 | |
| 6 | To what extent do you feel your life to be meaningful? | 4.07 | 0.69 | 0.17 | −0.61 | 2–5 | |
| 2 | 7 | How well are you able to concentrate? | 3.70 | 0.63 | 0.13 | −0.40 | 2–5 |
| Psychological | 11 | Are you able to accept your bodily appearance? | 3.38 | 1.11 | −0.00 | −0.57 | 1–5 |
| 19 | How satisfied are you with yourself? | 3.75 | 0.72 | −0.51 | 10.12 | 1–5 | |
| 26 | How often do you have negative feelings such as blue mood, despair, anxiety, depression? | 2.24 | 0.61 | 1.5 | 3.16 | 1–5 | |
| 20 | How satisfied are you with your personal relationships? | 3.85 | 0.75 | −0.96 | 20.18 | 1–5 | |
| 3 | 21 | How satisfied are you with sex life? | 3.81 | 0.75 | −1.02 | 2.51 | 1–5 |
| Social | 22 | How satisfied are you with the support you get from your friends? | 3.88 | 0.67 | −0.38 | 0.95 | 1–5 |
| 8 | How safe do you feel in your daily life? | 3.68 | 0.65 | 0.23 | −0.49 | 2–5 | |
| 9 | How healthy is your physical environment? | 3.46 | 0.66 | 0.10 | 0.39 | 1–5 | |
| 4 | 12 | Have you enough money to meet your needs? | 3.52 | 0.88 | 0.01 | −0.35 | 1–5 |
| Environmental | 13 | How available to you is the information that you need in your day-to-day life? | 3.72 | 0.68 | −0.03 | −0.22 | 2–5 |
| 14 | To what extent do you have the opportunity for leisure activities? | 3.26 | 0.93 | 0.94 | −0.17 | 1–5 | |
| 23 | How satisfied are you with the conditions of your living place? | 3.99 | 0.64 | −0.30 | 0.41 | 2–5 | |
| 24 | How satisfied are you with your access to health services? | 3.96 | 0.66 | −0.42 | 1.17 | 1–5 | |
| 25 | How satisfied are you with your transport? | 4.07 | 0.58 | −0.14 | 0.50 | 2–5 |
| Measure | Threshold Value |
|---|---|
| Chi-square/df (CMIN/df) | <3 good |
| CFI | >0.95 great; >0.90 acceptable |
| SRMR | <0.09 |
| RMSEA | <0.05 good; 0.05–0.10 moderate; >0.10 bad |
| PCLOSE | >0.05 |
Publisher’s Note: MDPI stays neutral with regard to jurisdictional claims in published maps and institutional affiliations. |
© 2022 by the authors. Licensee MDPI, Basel, Switzerland. This article is an open access article distributed under the terms and conditions of the Creative Commons Attribution (CC BY) license (https://creativecommons.org/licenses/by/4.0/).
Share and Cite
Rusyda, M.H.; Abdul Kadir, N.B.; Ismail, W.N.K.; Abdul Jalil, S.J.; Abdullah, N.-A.; Che Kasim, A.; Hoesni, S.M.; Abdul Manaf, M.R. Identifying the Psychometric Properties of the Malay Version of the WHOQOL-BREF among Employees with Obesity Problem. Int. J. Environ. Res. Public Health 2022, 19, 7542. https://doi.org/10.3390/ijerph19127542
Rusyda MH, Abdul Kadir NB, Ismail WNK, Abdul Jalil SJ, Abdullah N-A, Che Kasim A, Hoesni SM, Abdul Manaf MR. Identifying the Psychometric Properties of the Malay Version of the WHOQOL-BREF among Employees with Obesity Problem. International Journal of Environmental Research and Public Health. 2022; 19(12):7542. https://doi.org/10.3390/ijerph19127542
Chicago/Turabian StyleRusyda, Mohd Helma, Nor Ba’yah Abdul Kadir, Wan Nur Khairunnisa Ismail, Siti Jamiaah Abdul Jalil, Nurul-Azza Abdullah, Arena Che Kasim, Suzana Mohd. Hoesni, and Mohd Rizal Abdul Manaf. 2022. "Identifying the Psychometric Properties of the Malay Version of the WHOQOL-BREF among Employees with Obesity Problem" International Journal of Environmental Research and Public Health 19, no. 12: 7542. https://doi.org/10.3390/ijerph19127542