
Value Realization and Optimization Path of Forest Ecological Products—Case Study from Zhejiang Province, China


Abstract
:1. Introduction
2. Materials and Methods
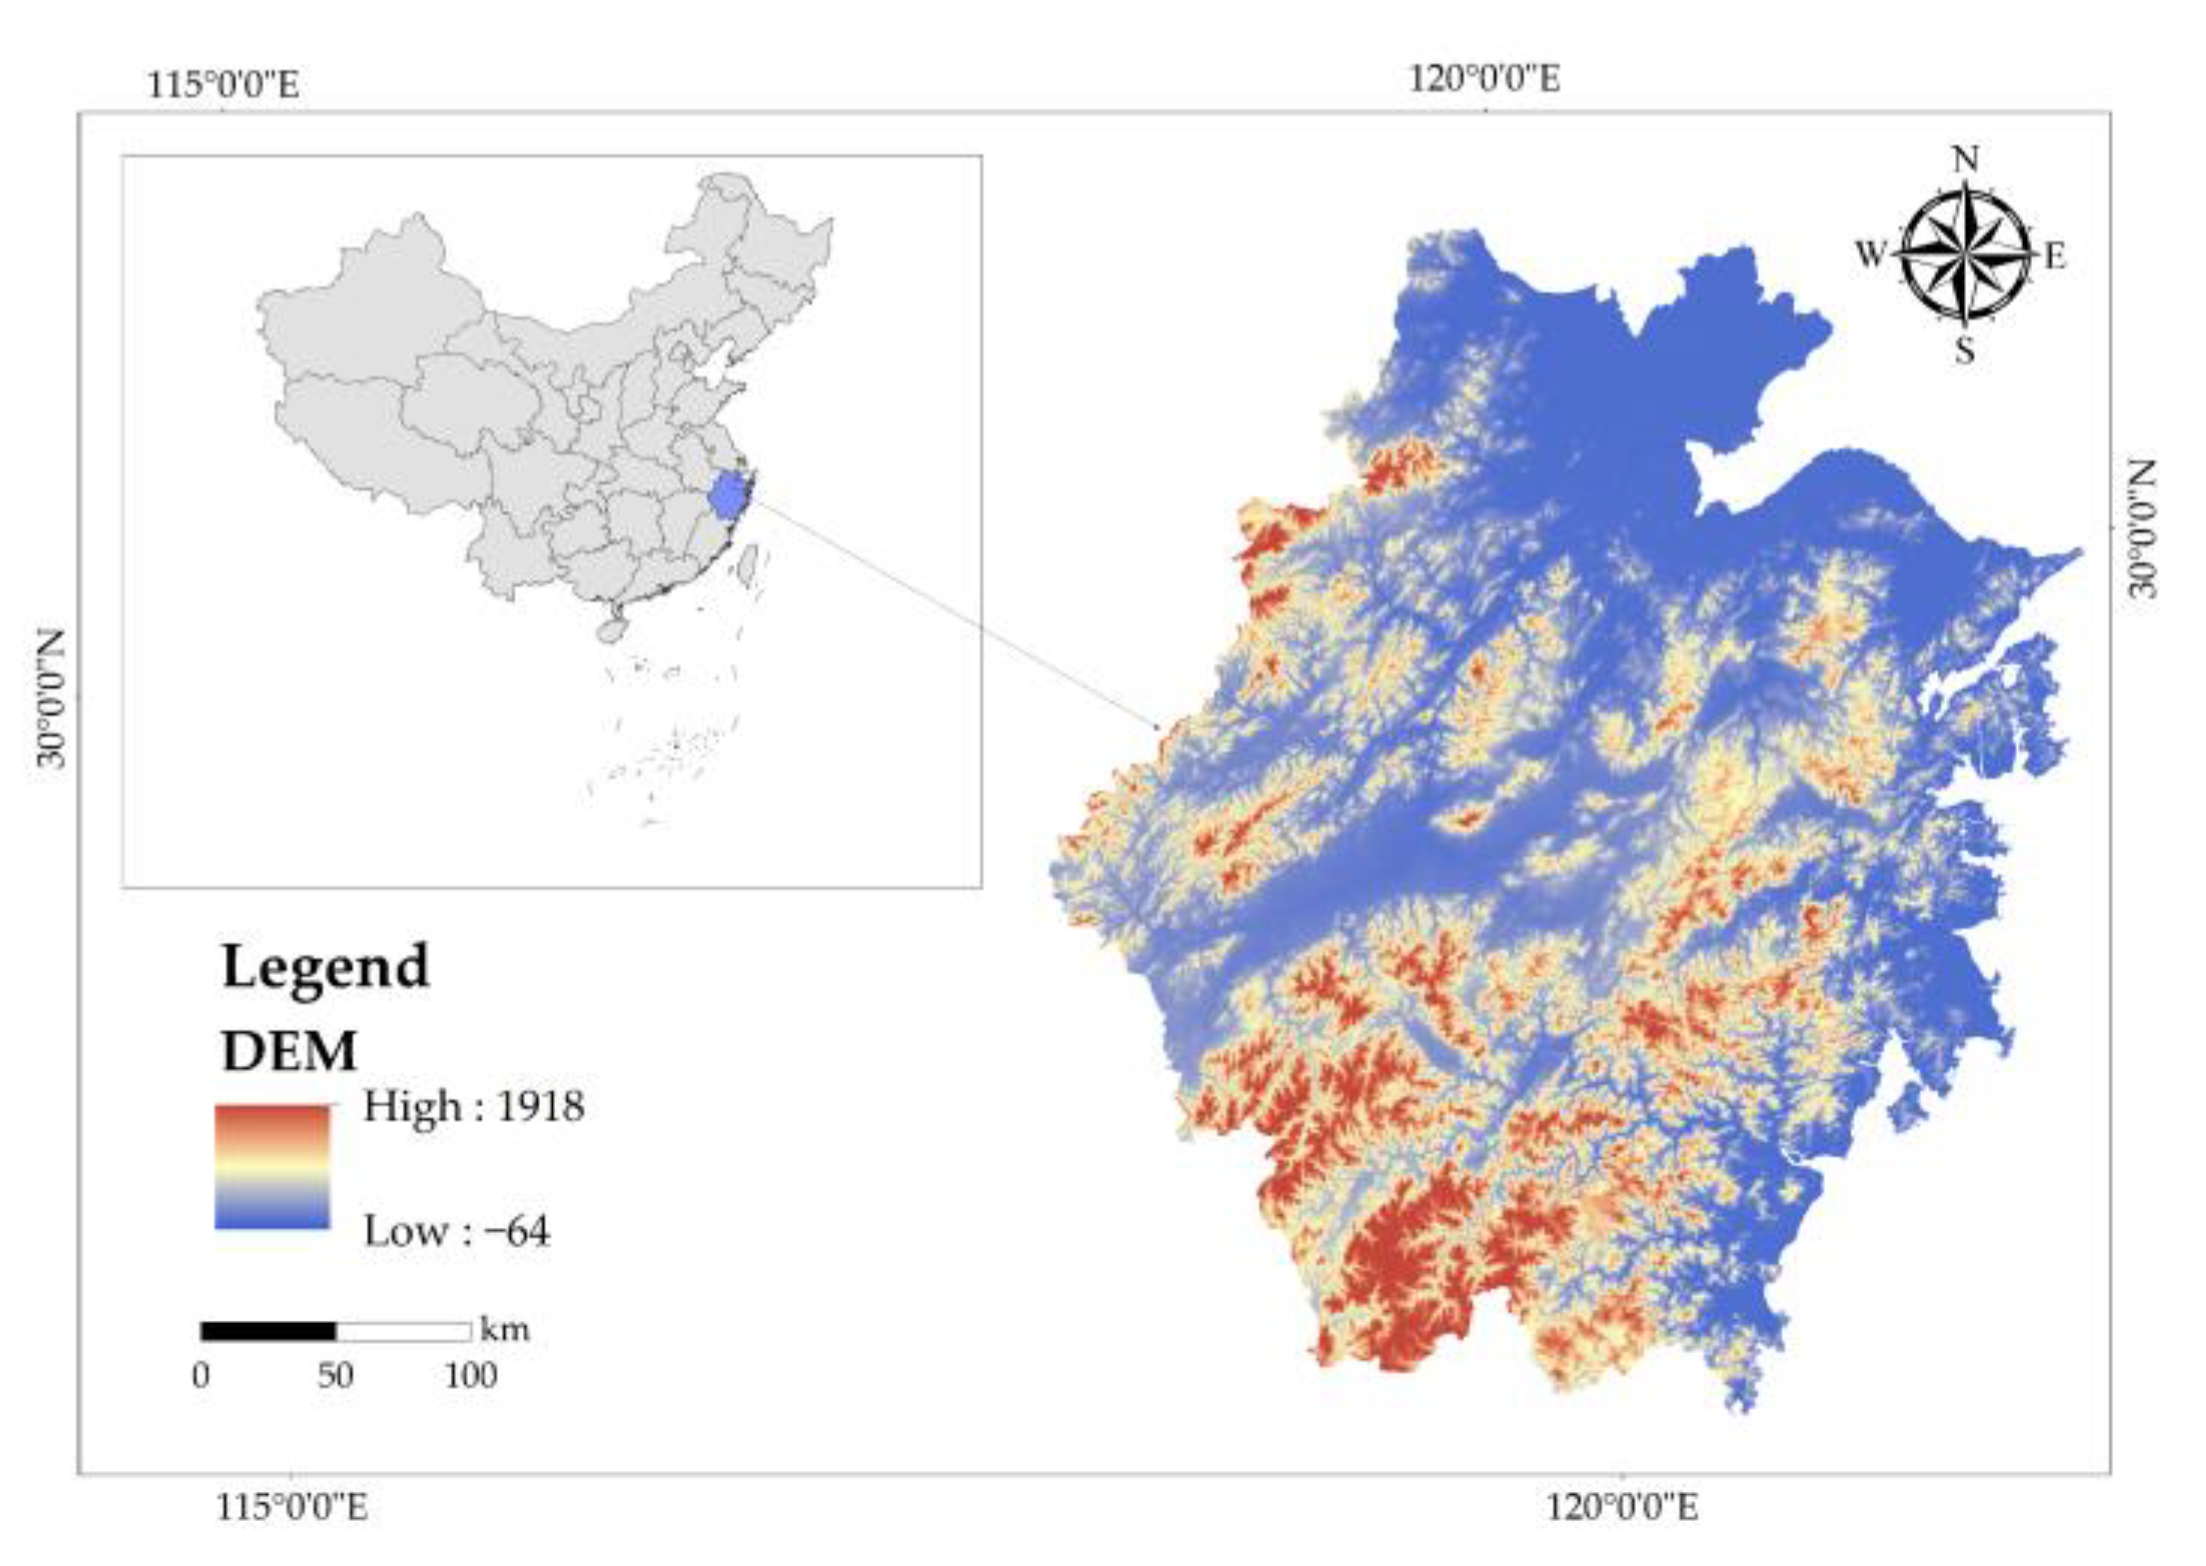
2.1. Study Area
2.2. Data Sources
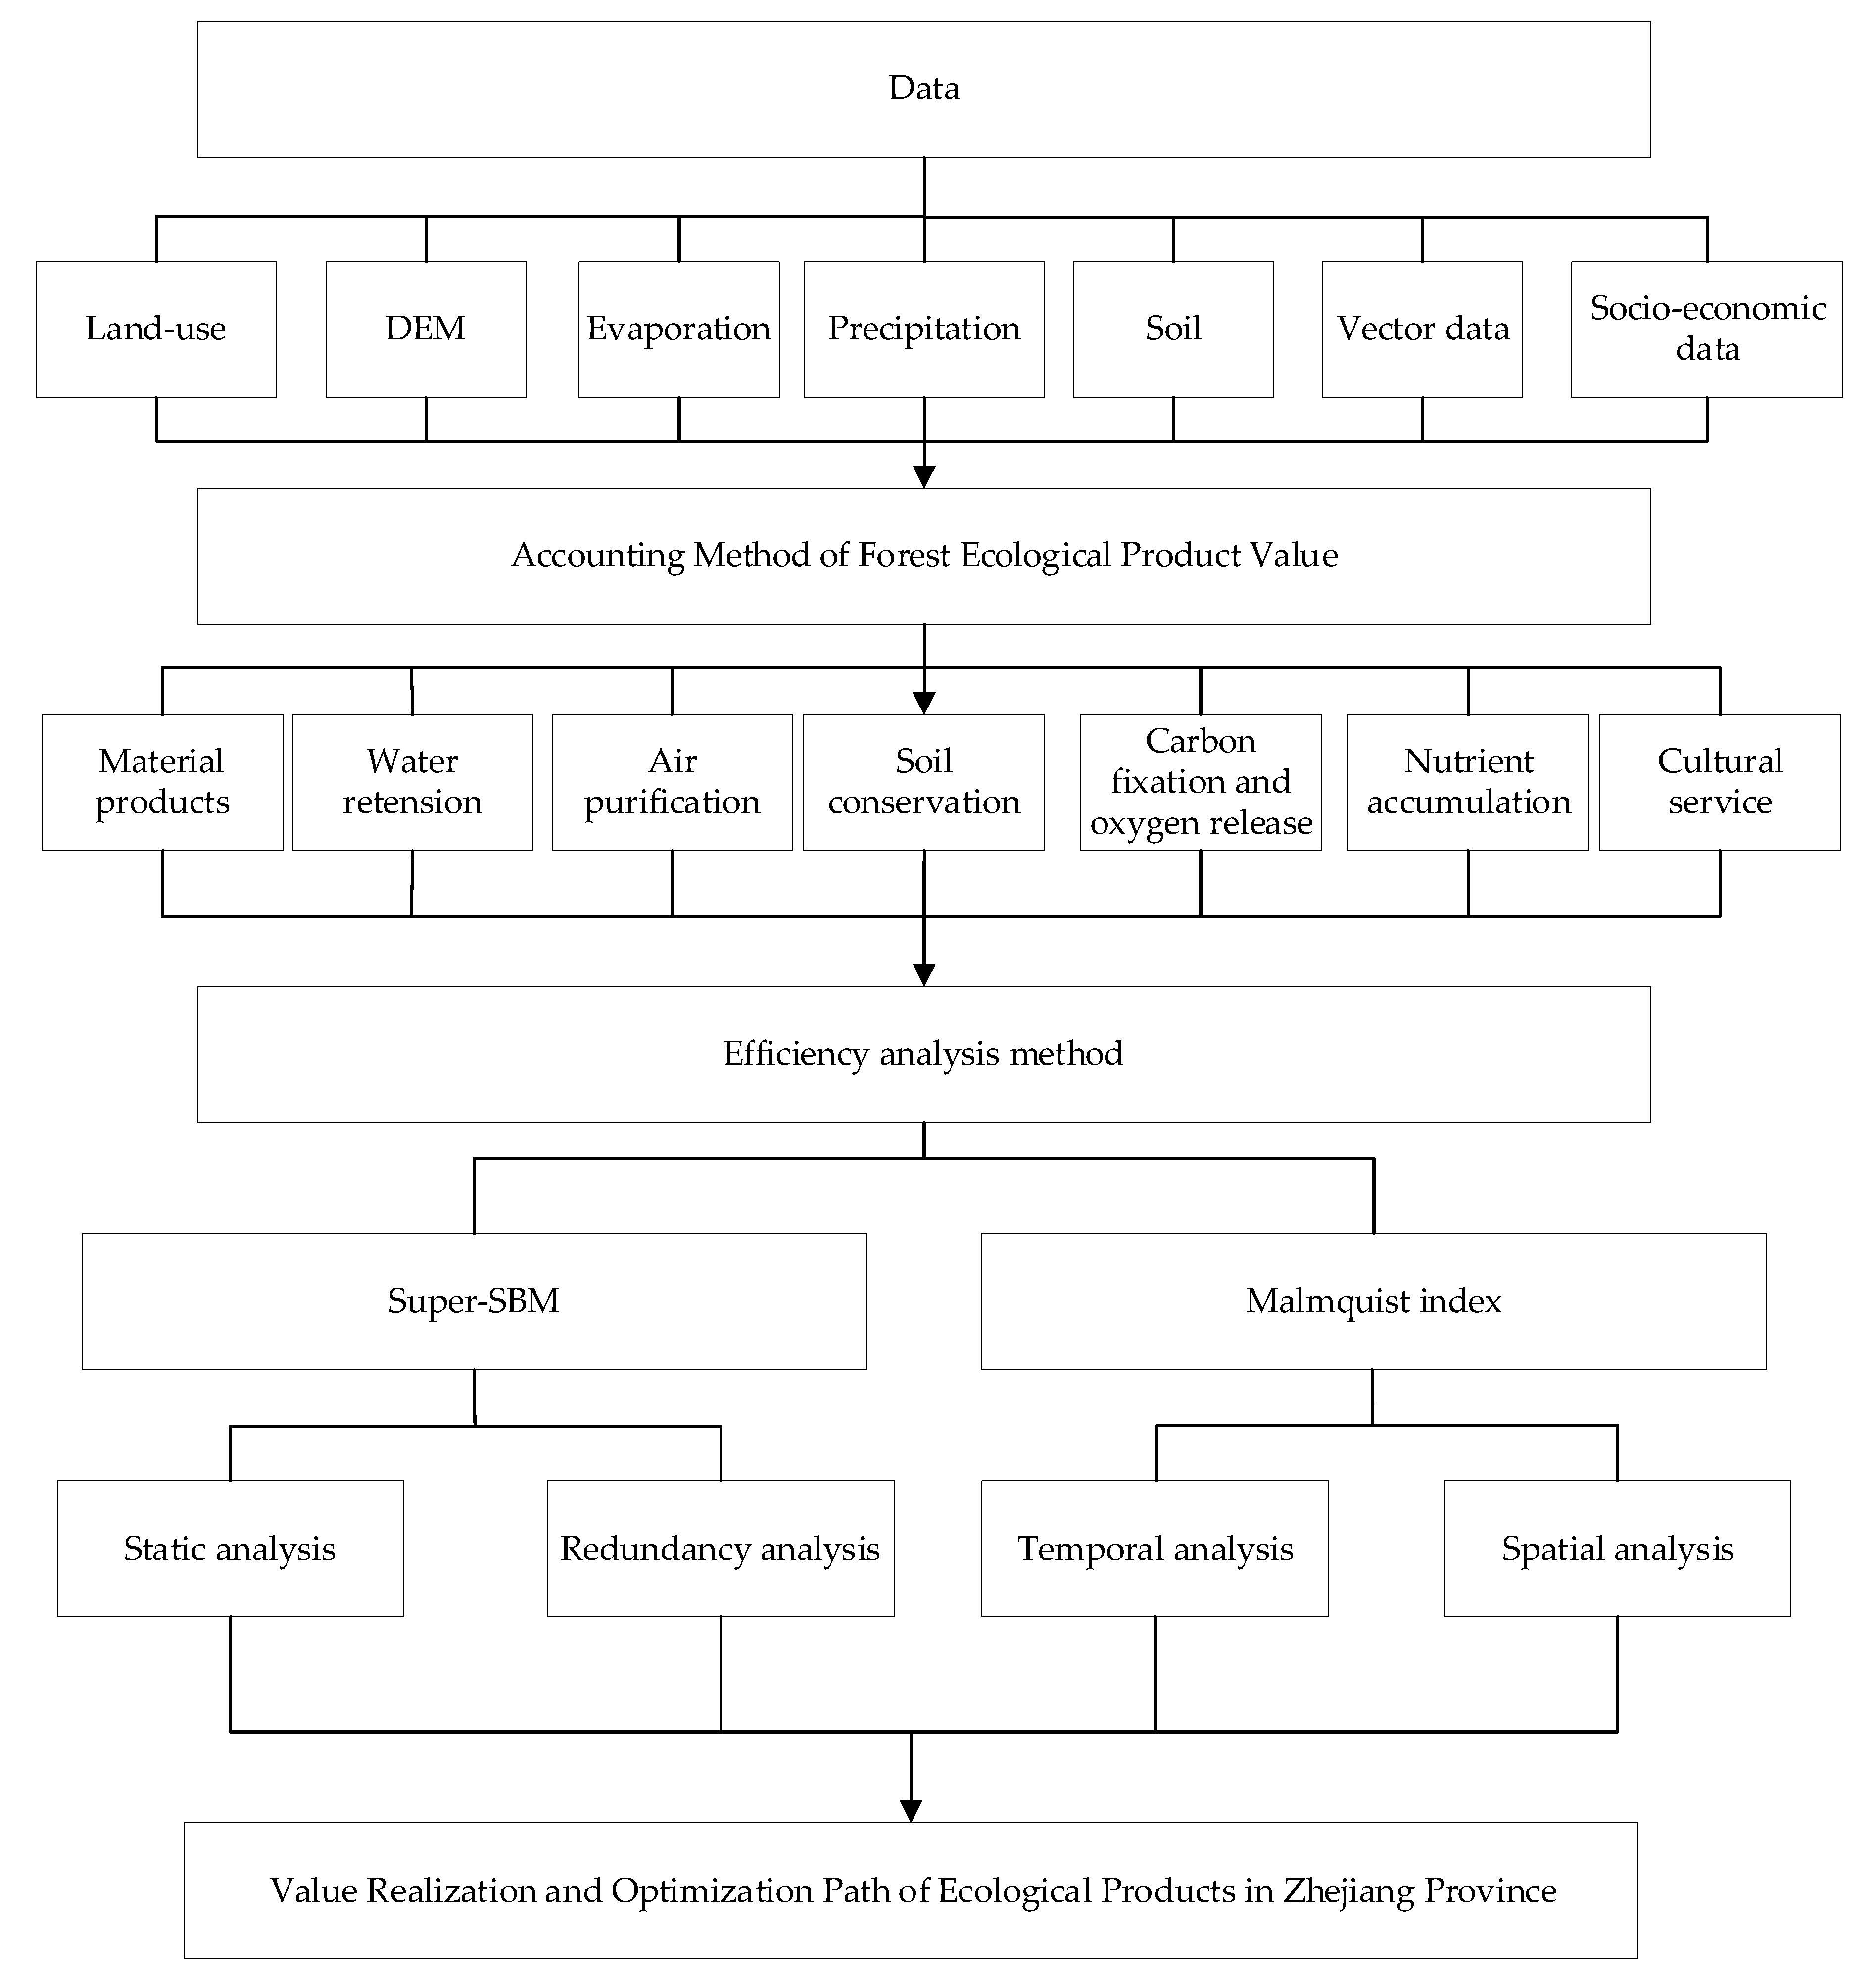
2.3. Methods
2.3.1. Value-Accounting Method of Forest Ecological Products
Accounting of Material-Products Value
Accounting of Regulatory-Products Value
- Value of Water Retention
- 2.
- Value of Nutrient Accumulation
- 3.
- Value of Soil Conservation
- 4.
- Value of Air Purification
- 5.
- Value of Carbon Fixation and Oxygen Release
Accounting of Cultural-Service Value
2.3.2. Super-SBM Model
2.3.3. Malmquist Index
3. Results
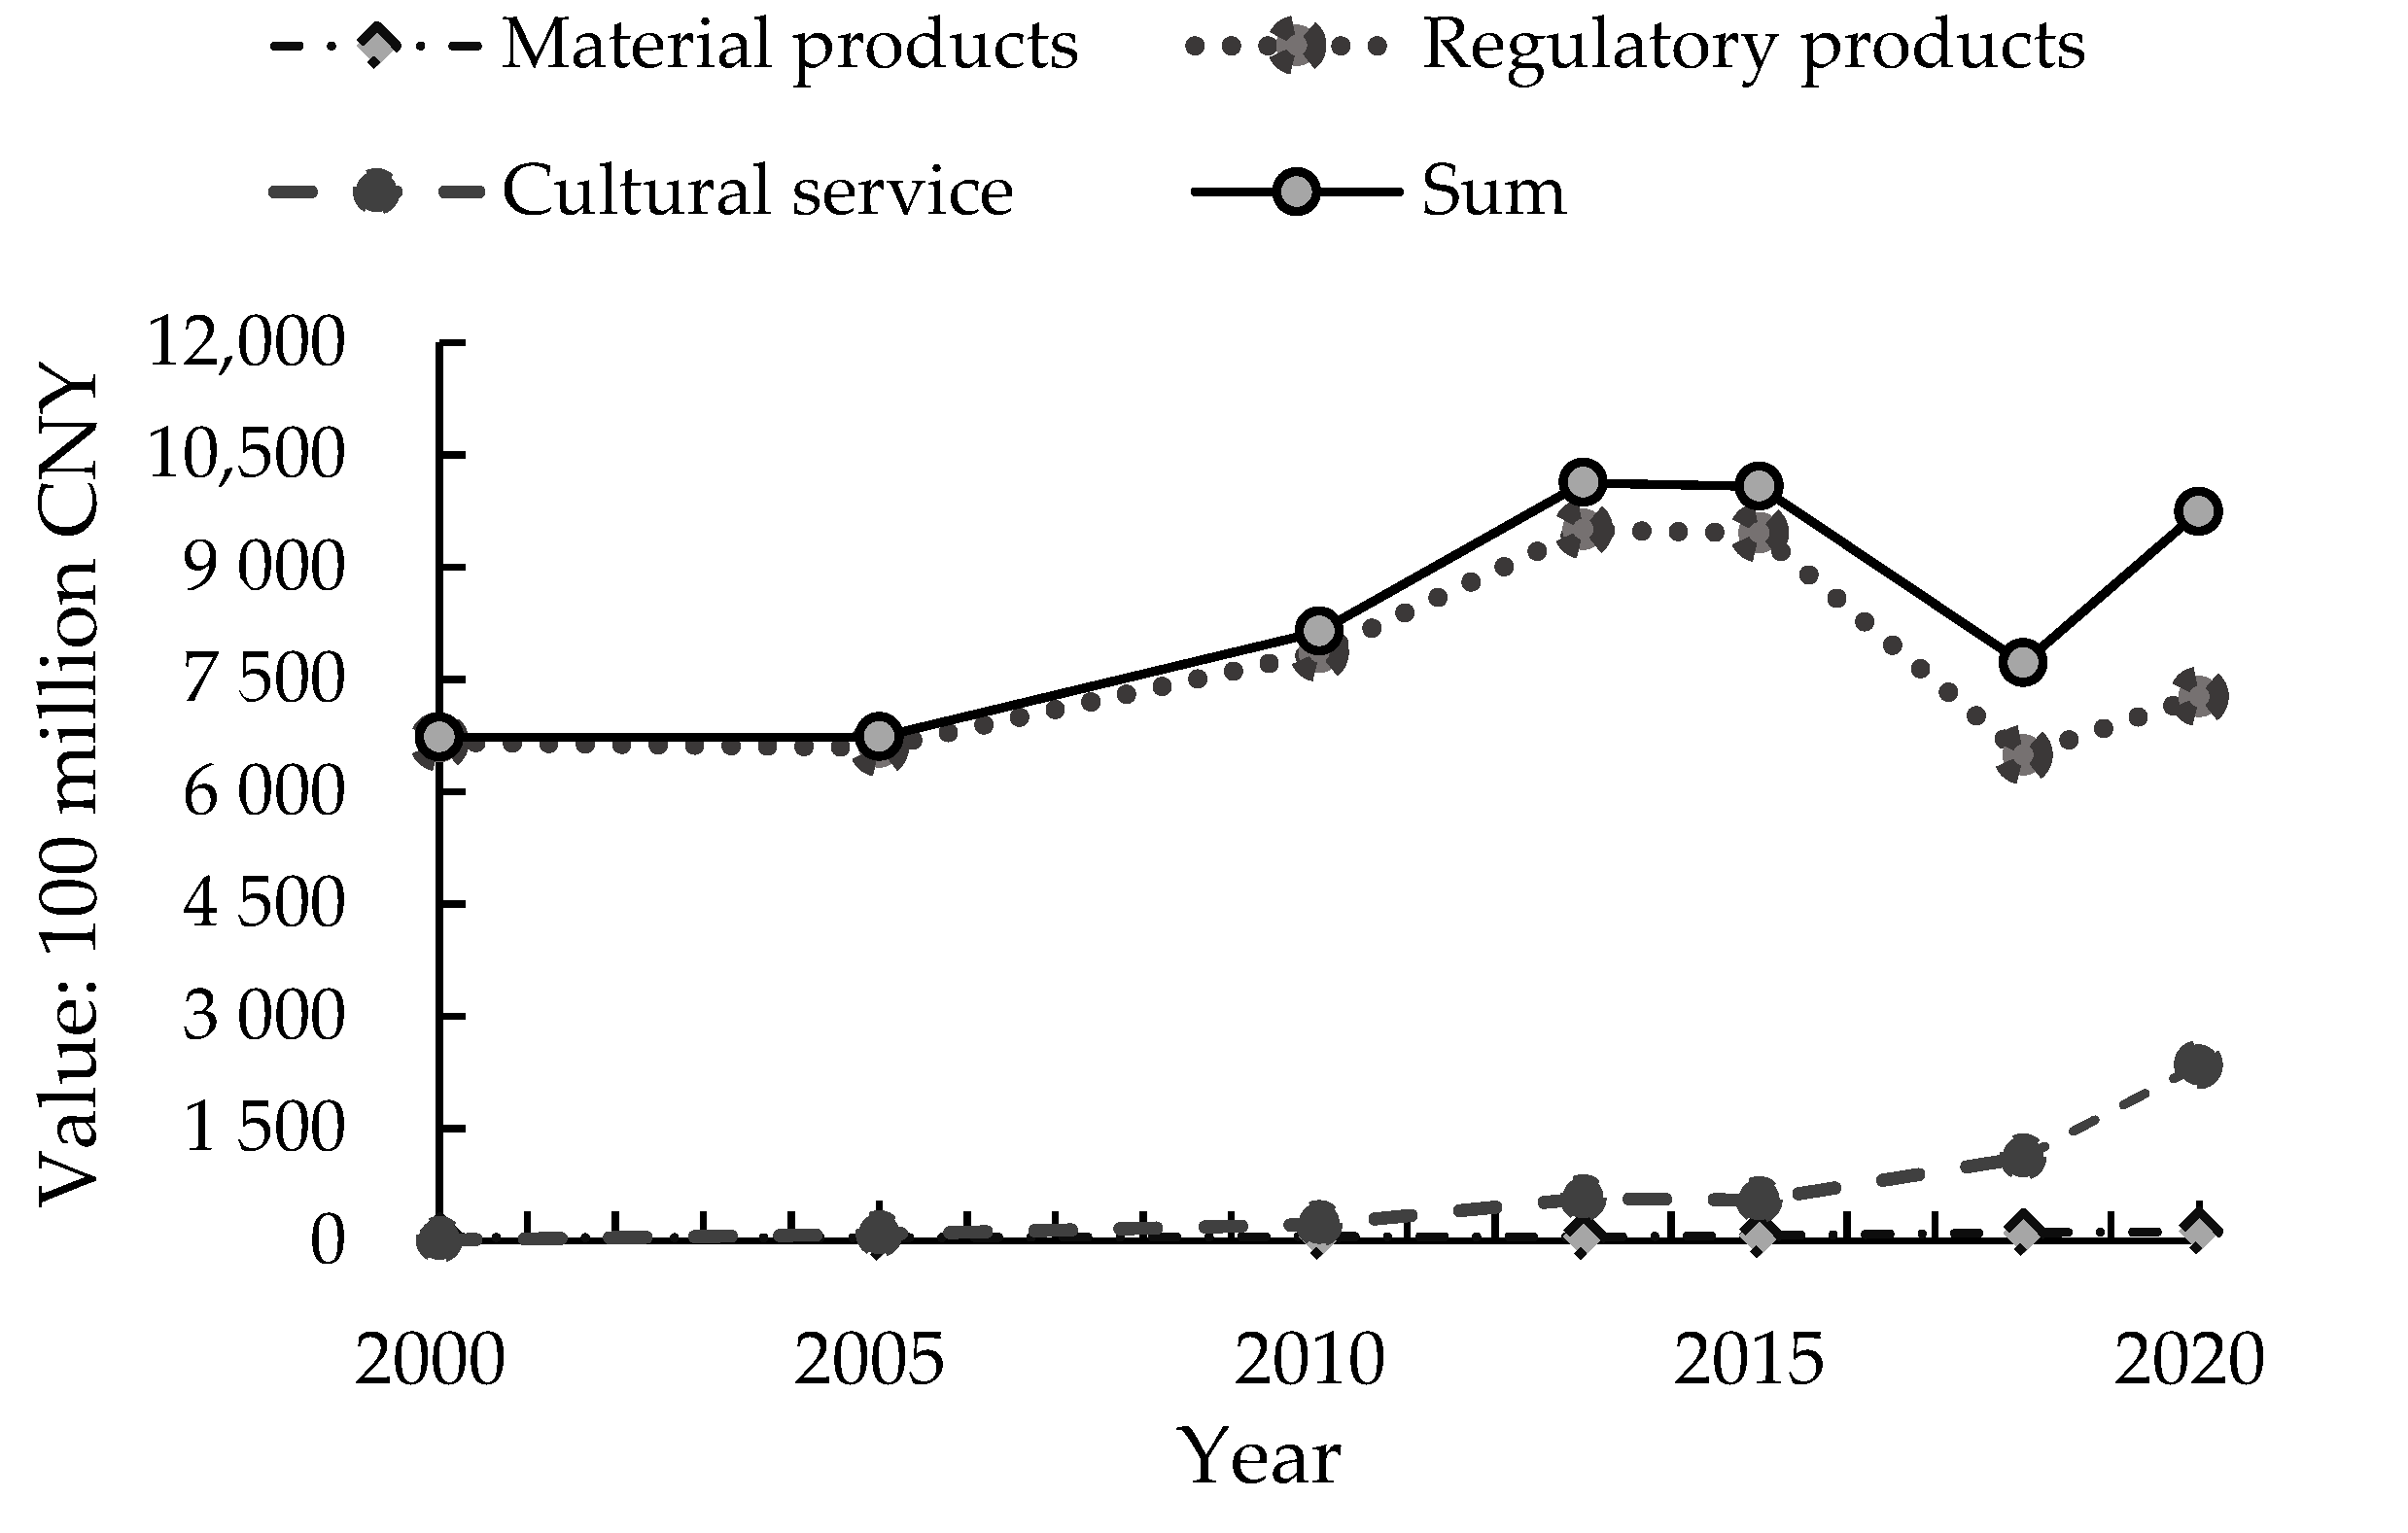
3.1. GEP Value-Accounting Results
3.2. Static Analysis
3.3. Dynamic Analysis
3.3.1. Time Dimension
3.3.2. Spatial Dimension
3.4. Input–Output Slack-Rate Analysis
4. Discussion
5. Conclusions
- (1)
- The value of forest ecological products in Zhejiang Province fluctuated and increased. The value of forest ecological products in 2020 was RMB 973.717 billion. Among them, the value of material products was RMB 12.56 billion, the value of ecological regulatory products was RMB 726.323 billion, and the value of cultural service products was RMB 234.834 billion. Carbon fixation and oxygen release, soil conservation, and cultural service were the main ecological products of forests in Zhejiang Province.
- (2)
- Overall value-conversion efficiency of forest ecological products in Zhejiang Province was generally good, but there were large differences among cities. The value-conversion efficiency of forest ecological products in each city showed an increasing phenomenon, and the cities that were in a state of inefficiency gradually approached the production frontier. It indicates that the overall value-conversion efficiency of forest ecological products in Zhejiang Province improved as a whole.
- (3)
- The total-factor productivity of forest ecological products in Zhejiang Province showed a fluctuating trend, growing rapidly from 2000 to 2010, and declining from 2010 to 2020. Changes in total-factor productivity had a positive relationship with technological progress. However, six cities have initially declined.
- (4)
- The main reason for the loss of conversion efficiency of forest ecological products’ value was excessive input and insufficient output. The specific causes of efficiency loss varied from region to region. Therefore, each city should find a path to improve the conversion efficiency, according to the actual situation.
Author Contributions
Funding
Institutional Review Board Statement
Informed Consent Statement
Data Availability Statement
Conflicts of Interest
References
- Ouyang, Z.Y.; Wang, X.K. A primary study on Chinese terrestrial ecosystem services and their ecological-economic values. Acta Ecol. Sin. 1999, 19, 19–25. [Google Scholar]
- Postel, S.; Bawa, K.; Kaufman, L.; Peterson, C.H.; Carpenter, S.; Tillman, D.; Dayton, P.; Alexander, S.; Lagerquist, K.; Goulder, L.; et al. Nature’s Services: Societal Dependence on Natural Ecosystems; Island Press: Washington, DC, USA, 1997; p. 392. [Google Scholar]
- Costanza, R.; d’Arge, R.; De Groot, R.; Farber, S.; Grasso, M.; Hannon, B.; Limburg, K.; Naeem, S.; O’neill, R.V.; Paruelo, J.; et al. The value of the world’s ecosystem services and natural capital. Nature 1997, 387, 253–260. [Google Scholar] [CrossRef]
- Bolund, P.; Hunhammar, S. Ecosystem services in urban areas. Ecol. Econ. 1999, 2, 293–301. [Google Scholar] [CrossRef]
- Drakou, E.G.; Pendleton, L.; Effron, M.; Ingram, J.C.; Teneva, L. When ecosystems and their services are not co-located: Oceans and coasts. ICES J. Mar. Sci. 2017, 74, 1531–1539. [Google Scholar] [CrossRef] [Green Version]
- Makwinja, R.; Kaunda, E.; Mengistou, S.; Alamirew, T. Impact of land use/land cover dynamics on ecosystem service value—a case from Lake Malombe, Southern Malawi. Environ. Monit. Assess. 2021, 193, 1–23. [Google Scholar] [CrossRef]
- Dardonville, M.; Legrand, B.; Clivot, H.; Bernardin, C.; Bockstaller, C.; Therond, O. Assessment of ecosystem services and natural capital dynamics in agroecosystems. Ecosyst. Serv. 2022, 54, 101415. [Google Scholar] [CrossRef]
- Hu, X.J.; Song, C.S.; Fan, X.Y.; Xiao, Y.; Xu, W.H.; Ouyang, Z.Y. Main Regulation Services and Value Assessment of Shrub Ecosystem in China. J. Beijing For. Univ. 2021, 20, 58–64. [Google Scholar]
- Shao, M.; Ma, L.P.; Wang, X.Y.; Che, X.H.; Wang, F.; Lu, J.F.; Luo, W.Y. The valuation of ecosystem service value of desertification grassland from 2004 to 2014 in Hexi Corridor, China. J. Desert Res. 2022, 42, 63–73. [Google Scholar]
- Zeng, X.G.; Yu, H.Y.; Xie, F. Concept, Classification and Market Supply Mechanism of Ecological Products. China Popul. Resour. Environ. 2014, 24, 12–17. [Google Scholar]
- Huang, R.L. Study on the Ecological Product Value Assessment. China Population. Resour. Environ. 2015, 3, 26–33. [Google Scholar]
- Liu, J.Y.; Mou, D.G. Research Progress of Ecological Product Value and Its Realization Mechanism. Ecol. Econ. 2020, 3, 207–212. [Google Scholar]
- Lu, X.C. Research on the Value Realization Path of Beijing Ecological Products in the New Development Stage. Ecol. Econ. 2022, 38, 218–223. [Google Scholar]
- Yu, G.R.; Yang, M. Ecological economics foundation research on ecological values, ecological asset management, and value realization: Scientifical concepts, basic theories, and realization paths. Chin. J. Appl. Ecol. 2022, 33, 1153–1162. [Google Scholar]
- Li, Y.; Cheng, S.L.; Huang, J.; Fu, X. The Present Situation and Prospect of Research on Ecological Product Value Realization——Based on Bibliometric Analysis. For. Econ. 2021, 43, 75–85. [Google Scholar]
- Qiu, S.L.; Jin, L.S. International Experience and Reference of Value Realization of Ecological Goods. Reform Econ. Syst. 2019, 3, 157–162. [Google Scholar]
- Tan, R. Value Realization of Ecological Products and Innovation of Governance Mechanism. Chin. Land 2021, 1, 4–11. [Google Scholar]
- Song, C.S.; Ouyang, Z.Y. Gross Ecosystem Product accounting for ecological benefits assessment: A case study of Qinghai Province. Acta Ecol. Sin. 2020, 40, 3207–3217. [Google Scholar]
- Dolkar, P.; Xiao, Y.; Ouyang, Z.Y.; Wang, L.Y. Assessment of ecological conservation effect in Xishui county based on gross ecosystem product. Acta Ecol. Sin. 2020, 40, 499–509. [Google Scholar]
- Chen, Z.Z.; Lei, J.R.; Wu, T.T.; Chen, D.X.; Zhou, Z.; Li, Y.L.; Hong, X.J.; Yang, Z.Y.; Li, Y.D. Gross ecosystem product accounting of national park: Taking Hainan Tropical Rainforest National Park as an example. Chin. J. Appl. Ecol. 2021, 32, 3883–3892. [Google Scholar]
- Fan, Z.L.; Li, W.M. Research on the Realization Mechanism of Ecological Product Value-A case Study of Guizhou Province. J. Hebei Geo Univ. 2020, 43, 82–90. [Google Scholar]
- Hao, L.H.; Chen, S.; He, S. Accounting Method and Application on the Marine Provisioning Ecological Product Values: Taking Wenzhou City’s Practice as an Example. Environ. Prot. 2021, 49, 54–60. [Google Scholar]
- Lin, Y.Y.; Xu, X.B. Spatiotemporal variations of gross ecosystem product and identification of important ecological protection spaces in the Yangtze River Delta. Resour. Sci. 2022, 44, 847–859. [Google Scholar] [CrossRef]
- Wu, Z.J.; Du, S.M.; Huang, Y.; Zheng, B.Y.; Xie, Z.Y.; Luo, C.K.; Wang, F.; Zhu, J.Q. Assessment of ecological conservation effect in southern Jiangxi Province based on gross ecosystem product. Acta Ecol. Sin. 2022, 42, 1–14. [Google Scholar]
- Cheng, C.Y.; Ge, C.Z.; Du, Y.C.; Li, J.D. Green Gold Index accounting for Quzhou City in Zhejiang Province. Acta Ecol. Sin. 2019, 39, 37–44. [Google Scholar]
- Ma, G.X.; Yu, F.; Wang, J.N.; Zhou, X.F.; Yuan, J.; Mou, X.J.; Zhou, Y.; Yang, W.S.; Peng, F. Measuring gross ecosystem product (GEP) of 2015 for terrestrial ecosystems in China. China Environ. Sci. 2017, 37, 1474–1482. [Google Scholar]
- Chen, M.; Ji, R.T.; Liu, X.; Liu, C.W.; Su, L.H.; Zhang, L.J. Gross ecosystem product accounting for ‘Two Mountains’ Bases and transformation analysis: The case study of Ninghai County. Acta Ecol. Sin. 2021, 41, 5899–5907. [Google Scholar]
- Krieger, D.J. Economic Value of Forest Ecosystem Services: A Review. Wilderness Soc. 2001, 40, 1–31. [Google Scholar]
- Ferraro, P.J.; Lawlor, K.; Mullan, K.L.; Pattanayak, S.K. Forest Figures: Ecosystem Services Valuation and Policy Evaluation in Developing Countries. Rev. Environ. Econ. Policy 2012, 6, 20–44. [Google Scholar] [CrossRef] [Green Version]
- Xu, T.Y.; Niu, X.; Wang, B. Spatial patterns of forest ecosystem services in Liaoning province. Sci. Soil Water Conserv. 2021, 19, 100–107. [Google Scholar]
- Chen, G.H.; Jin, L.; Zhan, J.W.; Chen, R.N.; Sun, L.J.; Ren, Y.D.; Yang, Y.H. Analysis on forest ecosystem services and its impact factors in Qingyuan County. Liaoning For. Sci. Technol. 2021, 5, 12–17. [Google Scholar]
- Xie, G.; Li, W.; Xiao, Y.; Zhang, B.; Lu, C.; An, K.; Wang, J.; Xu, K.; Wang, J. Forest ecosystem services and their values in Beijing. Chin. Geogr. Sci. 2010, 20, 51–58. [Google Scholar] [CrossRef]
- Aznar-Sánchez, J.A.; Belmonte-Ureña, L.J.; López-Serrano, M.J.; Velasco-Muñoz, J.F. Forest Ecosystem Services: An Analysis of Worldwide Research. Forests 2018, 9, 453. [Google Scholar] [CrossRef] [Green Version]
- Yu, L.Y.; Shi, T.; Guo, J.J. Developing Mechanisms to Realize the Value of Forest Ecological Products. For. Resour. Manag. 2019, 6, 28–31. [Google Scholar]
- Luo, J.; Li, L.; Jiang, Y.; Zhou, X.L. Evaluation of service function of forest ecosystem in Hunan province. Ecol. Sci. 2022, 41, 70–77. [Google Scholar]
- Zuo, S.L.; Jin, S.S.; Gu, X.Q. Assessment of forest ecosystem service value accounting in priority area of biodiversity protection in Anji county of geography census. Bull. Surv. Mapp. 2022, 1, 139–144. [Google Scholar]
- Mavi, N.K.; Mavi, R.K. Energy and environmental efficiency of OECD countries in the context of the circular economy: Common weight analysis for Malmquist productivity index. J. Environ. Manag. 2019, 247, 651–661. [Google Scholar] [CrossRef]
- Zhang, Z.; Liao, X.P.; Li, C.H.; Yang, C.; Yang, S.S.; Li, Y.H. Spatio-temporal Characteristics of Agricultural Eco-efficiency and Its Determinants in Hunan Province. Econ. Geogr. 2022, 42, 181–189. [Google Scholar]
- Andrejic, M.; Kilibarda, M.; Pajic, V. Measuring efficiency change in time applying malmquist productivity index: A case of distribution centres in Serbia. Facta Univ. Ser. Mech. Eng. 2021, 19, 499–514. [Google Scholar] [CrossRef]
- Yang, X.; Wang, W.; Wu, H.; Wang, J.; Ran, Q.; Ren, S. The impact of the new energy demonstration city policy on the green total factor productivity of resource-based cities: Empirical evidence from a quasi-natural experiment in China. J. Environ. Plan. Manag. 2021, 1–34. [Google Scholar] [CrossRef]
- Jin, C.; Lu, Y.Q. Review and Prospect of Research on Value Realization of Ecological Products in China. Econ. Geogr. 2021, 41, 207–213. [Google Scholar]
- Sun, B.W.; Peng, X.S. Realization Mode, Key Issues and Institutional Guarantee System of Ecological Product Value. Ecol. Econ. 2021, 37, 13–19. [Google Scholar]
- Liu, Y.X.; Shi, X.L.; Shi, W.J. Evaluation of water retention services of forest ecosystems in Fujian Province: Comparison between results from the InVEST model and meta-analysis. Acta Ecol. Sin. 2021, 41, 1349–1361. [Google Scholar]
- Ma, Z.D.; Gao, H.; Yang, J.; Xi, J.C.; Li, X.M.; Ge, Q.S. Valuation of Nansihu Lake Wetland Ecosystem Services Based on Multi-Sources Data Fusion. Resour. Sci. 2014, 36, 840–847. [Google Scholar]
- Wang, L.; Xiao, Y.; Ouyang, Z.Y.; Wei, Q.; Bo, W.; Zhang, J.; Ren, L. Gross ecosystem product accounting in the national key ecological function area. China Popul. Resour. Environ. 2017, 27, 146–154. [Google Scholar]
- Tone, K. A slacks-based measure of super-efficiency in data envelopment analysis. Eur. J. Oper. Res. 2002, 143, 32–41. [Google Scholar] [CrossRef] [Green Version]
- Wang, S.J.; Gao, S.; Huang, Y.Y.; Shi, C.Y. Spatio-temporal evolution and trend prediction of urban carbon emission performance in China based on super-efficiency SBM model. Acta Ecol. Sin. 2020, 75, 1316–1330. [Google Scholar]
- Sun, Y.X.; Cheng, Y.; Liu, N. Spatiotemporal evolution of China’s high quality economic development and its driving mechanism of scientific and technological innovation. Resour. Sci. 2021, 43, 82–93. [Google Scholar] [CrossRef]
- Li, J.J.; Jing, Y.J. Research on Environmental Efficiency Measurement and Influencing Factors Based on DEA-Malmquist-Tobit Model: Taking Henan Province as an Example. Ecol. Econ. 2021, 37, 132–137, 145. [Google Scholar]
- Bjurek, H. The Malmquist Total Factor Productivity Index. Scand. J. Econ. 1996, 98, 303. [Google Scholar] [CrossRef]
- Chen, Z.; Zhang, X. Value of ecosystem services in China. Chin. Sci. Bull. 2000, 45, 870–876. [Google Scholar] [CrossRef]
- Qing, L.; Chun, D.; Dagestani, A.A.; Li, P. Does Proactive Green Technology Innovation Improve Financial Performance? Evidence from Listed Companies with Semiconductor Concepts Stock in China. Sustainability 2022, 14, 4600. [Google Scholar] [CrossRef]
- Qing, L.; Chun, D.; Ock, Y.S.; Dagestani, A.A.; Ma, X. What Myths about Green Technology Innovation and Financial Performance’s Relationship? A Bibliometric Analysis Revie. Economies 2022, 10, 92. [Google Scholar] [CrossRef]
- Zhang, Y.N.; Zhang, L.T.; Han, L.M. Study on the Evaluation and Promotion Path of Agricultural Ecological Efficiency: An Empirical Analysis of 17 Prefecture Level Cities in Shandong Province. Ecol. Econ. 2021, 37, 118–124. [Google Scholar]


| Category | Primary Index | Secondary Index | Tertiary Index | Methods |
|---|---|---|---|---|
| Input | Value of forest ecological products | Material products value | Forest product | Marketing value method |
| Regulatory products value | Water retention | Marketing value method | ||
| Nutritional cumulation | Replacement cost | |||
| Carbon fixation and oxygen release | Replacement cost | |||
| Air purification | Replacement cost | |||
| Soil conservation | Shadow-engineering method | |||
| Cultural service | Forest recreation | Travel-cost method | ||
| Labor force | Number of employees in the forestry industry | |||
| Capital | Sum of investments in forestry fixed assets used | |||
| Output | Output value of the forestry industry | Output value of primary forestry industry | ||
| Output value of secondary forestry industry | ||||
| Output value of tertiary forestry industry | ||||
| Ecological Products/Services | Magnitude of Value/×108 | Proportion/% |
|---|---|---|
| Material products | 125.60 | 1.29 |
| Water retention | 0.57 | 0.01 |
| Nutrient accumulation | 274.68 | 2.82 |
| Carbon fixation and oxygen release | 4188.58 | 43.02 |
| Air purification | 31.32 | 0.32 |
| Soil conservation | 2768.09 | 28.42 |
| Cultural service | 2348.34 | 24.12 |
| Sum | 9737.17 | 100 |
| Year | Sum | Material Products | Regulatory Products | Water Retention | Nutritional Accumulation | Carbon Fixation and Oxygen Release | Air Purification | Soil Conservation | Cultural Service |
|---|---|---|---|---|---|---|---|---|---|
| 2001 | 6724.69 | 47.41 | 6663.44 | 0.45 | 277.01 | 4224.17 | 26.27 | 2135.54 | 13.84 |
| 2005 | 6729.24 | 45.34 | 6594.46 | 0.43 | 275.40 | 4199.68 | 31.69 | 2087.20 | 89.44 |
| 2010 | 8138.28 | 59.66 | 7854.32 | 0.29 | 275.09 | 4194.86 | 31.69 | 3352.40 | 224.30 |
| 2013 | 10,123.19 | 56.95 | 9496.54 | 0.40 | 275.94 | 4207.84 | 31.34 | 4981.02 | 569.70 |
| 2015 | 10,075.43 | 74.11 | 9457.30 | 0.38 | 273.69 | 4173.51 | 28.70 | 4981.02 | 544.02 |
| 2018 | 7715.58 | 111.88 | 6490.39 | 0.43 | 273.66 | 4173.09 | 31.32 | 2011.89 | 1113.31 |
| 2020 | 9737.17 | 125.60 | 7263.23 | 0.57 | 274.68 | 4188.58 | 31.32 | 2768.09 | 2348.34 |
| DMU | 2001 | 2005 | 2010 | 2013 | 2015 | 2018 | 2020 | Average | Rank |
|---|---|---|---|---|---|---|---|---|---|
| Hangzhou | 0.09 | 0.21 | 0.30 | 1.20 | 1.09 | 0.38 | 0.42 | 0.52 | 11 |
| Ningbo | 1.27 | 1.39 | 1.51 | 1.06 | 1.17 | 1.32 | 1.08 | 1.30 | 5 |
| Wenzhou | 0.02 | 1.02 | 0.44 | 0.47 | 1.26 | 1.10 | 1.16 | 0.78 | 10 |
| Jiaxing | 17.77 | 3.39 | 3.54 | 3.37 | 3.38 | 3.33 | 3.24 | 5.56 | 1 |
| Huzhou | 1.24 | 1.57 | 1.66 | 1.87 | 1.56 | 2.02 | 2.05 | 1.71 | 2 |
| Shaoxing | 1.44 | 1.60 | 1.43 | 1.02 | 1.21 | 1.06 | 1.17 | 1.27 | 6 |
| Jinhua | 1.86 | 1.47 | 1.09 | 1.13 | 1.34 | 1.88 | 1.67 | 1.39 | 4 |
| Quzhou | 0.28 | 1.22 | 1.28 | 1.05 | 1.10 | 1.13 | 1.25 | 1.03 | 9 |
| Taizhou | 2.07 | 1.82 | 1.39 | 1.32 | 1.06 | 1.09 | 1.31 | 1.60 | 3 |
| Lishui | 1.09 | 1.15 | 2.61 | 1.31 | 1.22 | 1.21 | 1.21 | 1.25 | 7 |
| Zhoushan | 1.16 | 1.30 | 1.35 | 1.25 | 1.23 | 1.36 | 1.02 | 1.23 | 8 |
| Average | 2.60 | 1.47 | 1.51 | 1.37 | 1.42 | 1.44 | 1.42 | — |
| Period | EFFCH | TECH | PECH | SECH | TFP |
|---|---|---|---|---|---|
| 2001–2005 | 1.021 | 0.006 | 1.13 | 0.904 | 0.006 |
| 2005–2010 | 1.071 | 5.809 | 1.026 | 1.043 | 1.419 |
| 2010–2013 | 0.876 | 1.005 | 0.964 | 0.909 | 0.881 |
| 2013–2015 | 1.101 | 0.525 | 1.022 | 1.077 | 0.578 |
| 2015–2018 | 0.792 | 1.101 | 0.793 | 1 | 0.873 |
| 2018–2020 | 1.317 | 0.534 | 1.272 | 1.036 | 0.703 |
| Average | 1.016 | 1.024 | 1.024 | 0.993 | 1.04 |
| DMU | EFFCH | TECH | PECH | SECH | TFP |
|---|---|---|---|---|---|
| Hangzhou | 1.207 | 0.855 | 1.196 | 1.009 | 1.031 |
| Ningbo | 1.03 | 0.982 | 1.085 | 0.95 | 1.012 |
| Wenzhou | 1.002 | 0.885 | 1 | 1.002 | 0.886 |
| Jiaxing | 1 | 0.743 | 1 | 1 | 0.743 |
| Huzhou | 0.959 | 0.79 | 1 | 0.959 | 0.758 |
| Shaoxing | 0.95 | 0.749 | 1 | 0.95 | 0.712 |
| Jinhua | 1 | 1.01 | 1 | 1 | 1.01 |
| Quzhou | 1.052 | 0.864 | 1 | 1.052 | 0.909 |
| Taizhou | 1 | 0.796 | 1 | 1 | 0.796 |
| Lishui | 1 | 5.617 | 1 | 1 | 5.617 |
| Zhoushan | 1 | 1.013 | 1 | 1 | 1.013 |
| Average | 1.016 | 1.024 | 1.024 | 0.993 | 1.04 |
| DMU | Redundancy Rate | Insufficient Rate | ||||||
|---|---|---|---|---|---|---|---|---|
| Material Products | Regulatory Products | Cultural Service | Number of Employees in the Forestry Industry | Forestry Investment | Output Value of Primary Forestry Industry | Output Value of Secondary Forestry Industry | Output Value of Tertiary Forestry Industry | |
| Hangzhou | 0.33 | 0.21 | 0.22 | 0.31 | 0.47 | 0.09 | 2.33 | 0.83 |
| Ningbo | 0.02 | 0.05 | 0.00 | 0.66 | 0.27 | 0.18 | 0.01 | 0.01 |
| Wenzhou | 0.04 | 0.15 | 0.12 | 15.87 | 0.01 | 0.46 | 14.23 | 0.20 |
| Jiaxing | 1.76 | 0.43 | 5.38 | 1.54 | 0.00 | 0.87 | 0.93 | 0.00 |
| Huzhou | 0.00 | 0.08 | 0.60 | 0.00 | 0.03 | 0.00 | 0.33 | 0.53 |
| Shaoxing | 0.00 | 0.45 | 0.10 | 0.00 | 0.31 | 0.22 | 0.00 | 0.00 |
| Jinhua | 0.70 | 0.14 | 0.01 | 0.02 | 0.08 | 0.25 | 0.00 | 0.17 |
| Quzhou | 0.11 | 0.48 | 0.06 | 0.12 | 0.00 | 0.08 | 0.29 | 0.00 |
| Taizhou | 0.40 | 0.16 | 0.00 | 0.22 | 0.14 | 0.09 | 0.19 | 0.21 |
| Lishui | 0.83 | 0.96 | 0.08 | 0.13 | 0.10 | 0.02 | 0.73 | 0.09 |
| Zhoushan | 0.01 | 0.00 | 0.00 | 0.11 | 0.00 | 0.00 | 0.00 | 0.53 |
Publisher’s Note: MDPI stays neutral with regard to jurisdictional claims in published maps and institutional affiliations. |
© 2022 by the authors. Licensee MDPI, Basel, Switzerland. This article is an open access article distributed under the terms and conditions of the Creative Commons Attribution (CC BY) license (https://creativecommons.org/licenses/by/4.0/).
Share and Cite
Wang, N.; Xu, C.; Kong, F. Value Realization and Optimization Path of Forest Ecological Products—Case Study from Zhejiang Province, China. Int. J. Environ. Res. Public Health 2022, 19, 7538. https://doi.org/10.3390/ijerph19127538
Wang N, Xu C, Kong F. Value Realization and Optimization Path of Forest Ecological Products—Case Study from Zhejiang Province, China. International Journal of Environmental Research and Public Health. 2022; 19(12):7538. https://doi.org/10.3390/ijerph19127538
Chicago/Turabian StyleWang, Ning, Caiyao Xu, and Fanbin Kong. 2022. "Value Realization and Optimization Path of Forest Ecological Products—Case Study from Zhejiang Province, China" International Journal of Environmental Research and Public Health 19, no. 12: 7538. https://doi.org/10.3390/ijerph19127538