
Mortality, Morbidity and Health-Related Outcomes in Informal Caregivers Compared to Non-Caregivers: A Systematic Review

 , , , , , and
Abstract
:1. Introduction
2. Materials and Methods
2.1. Search Strategy
2.2. Eligibility Criteria
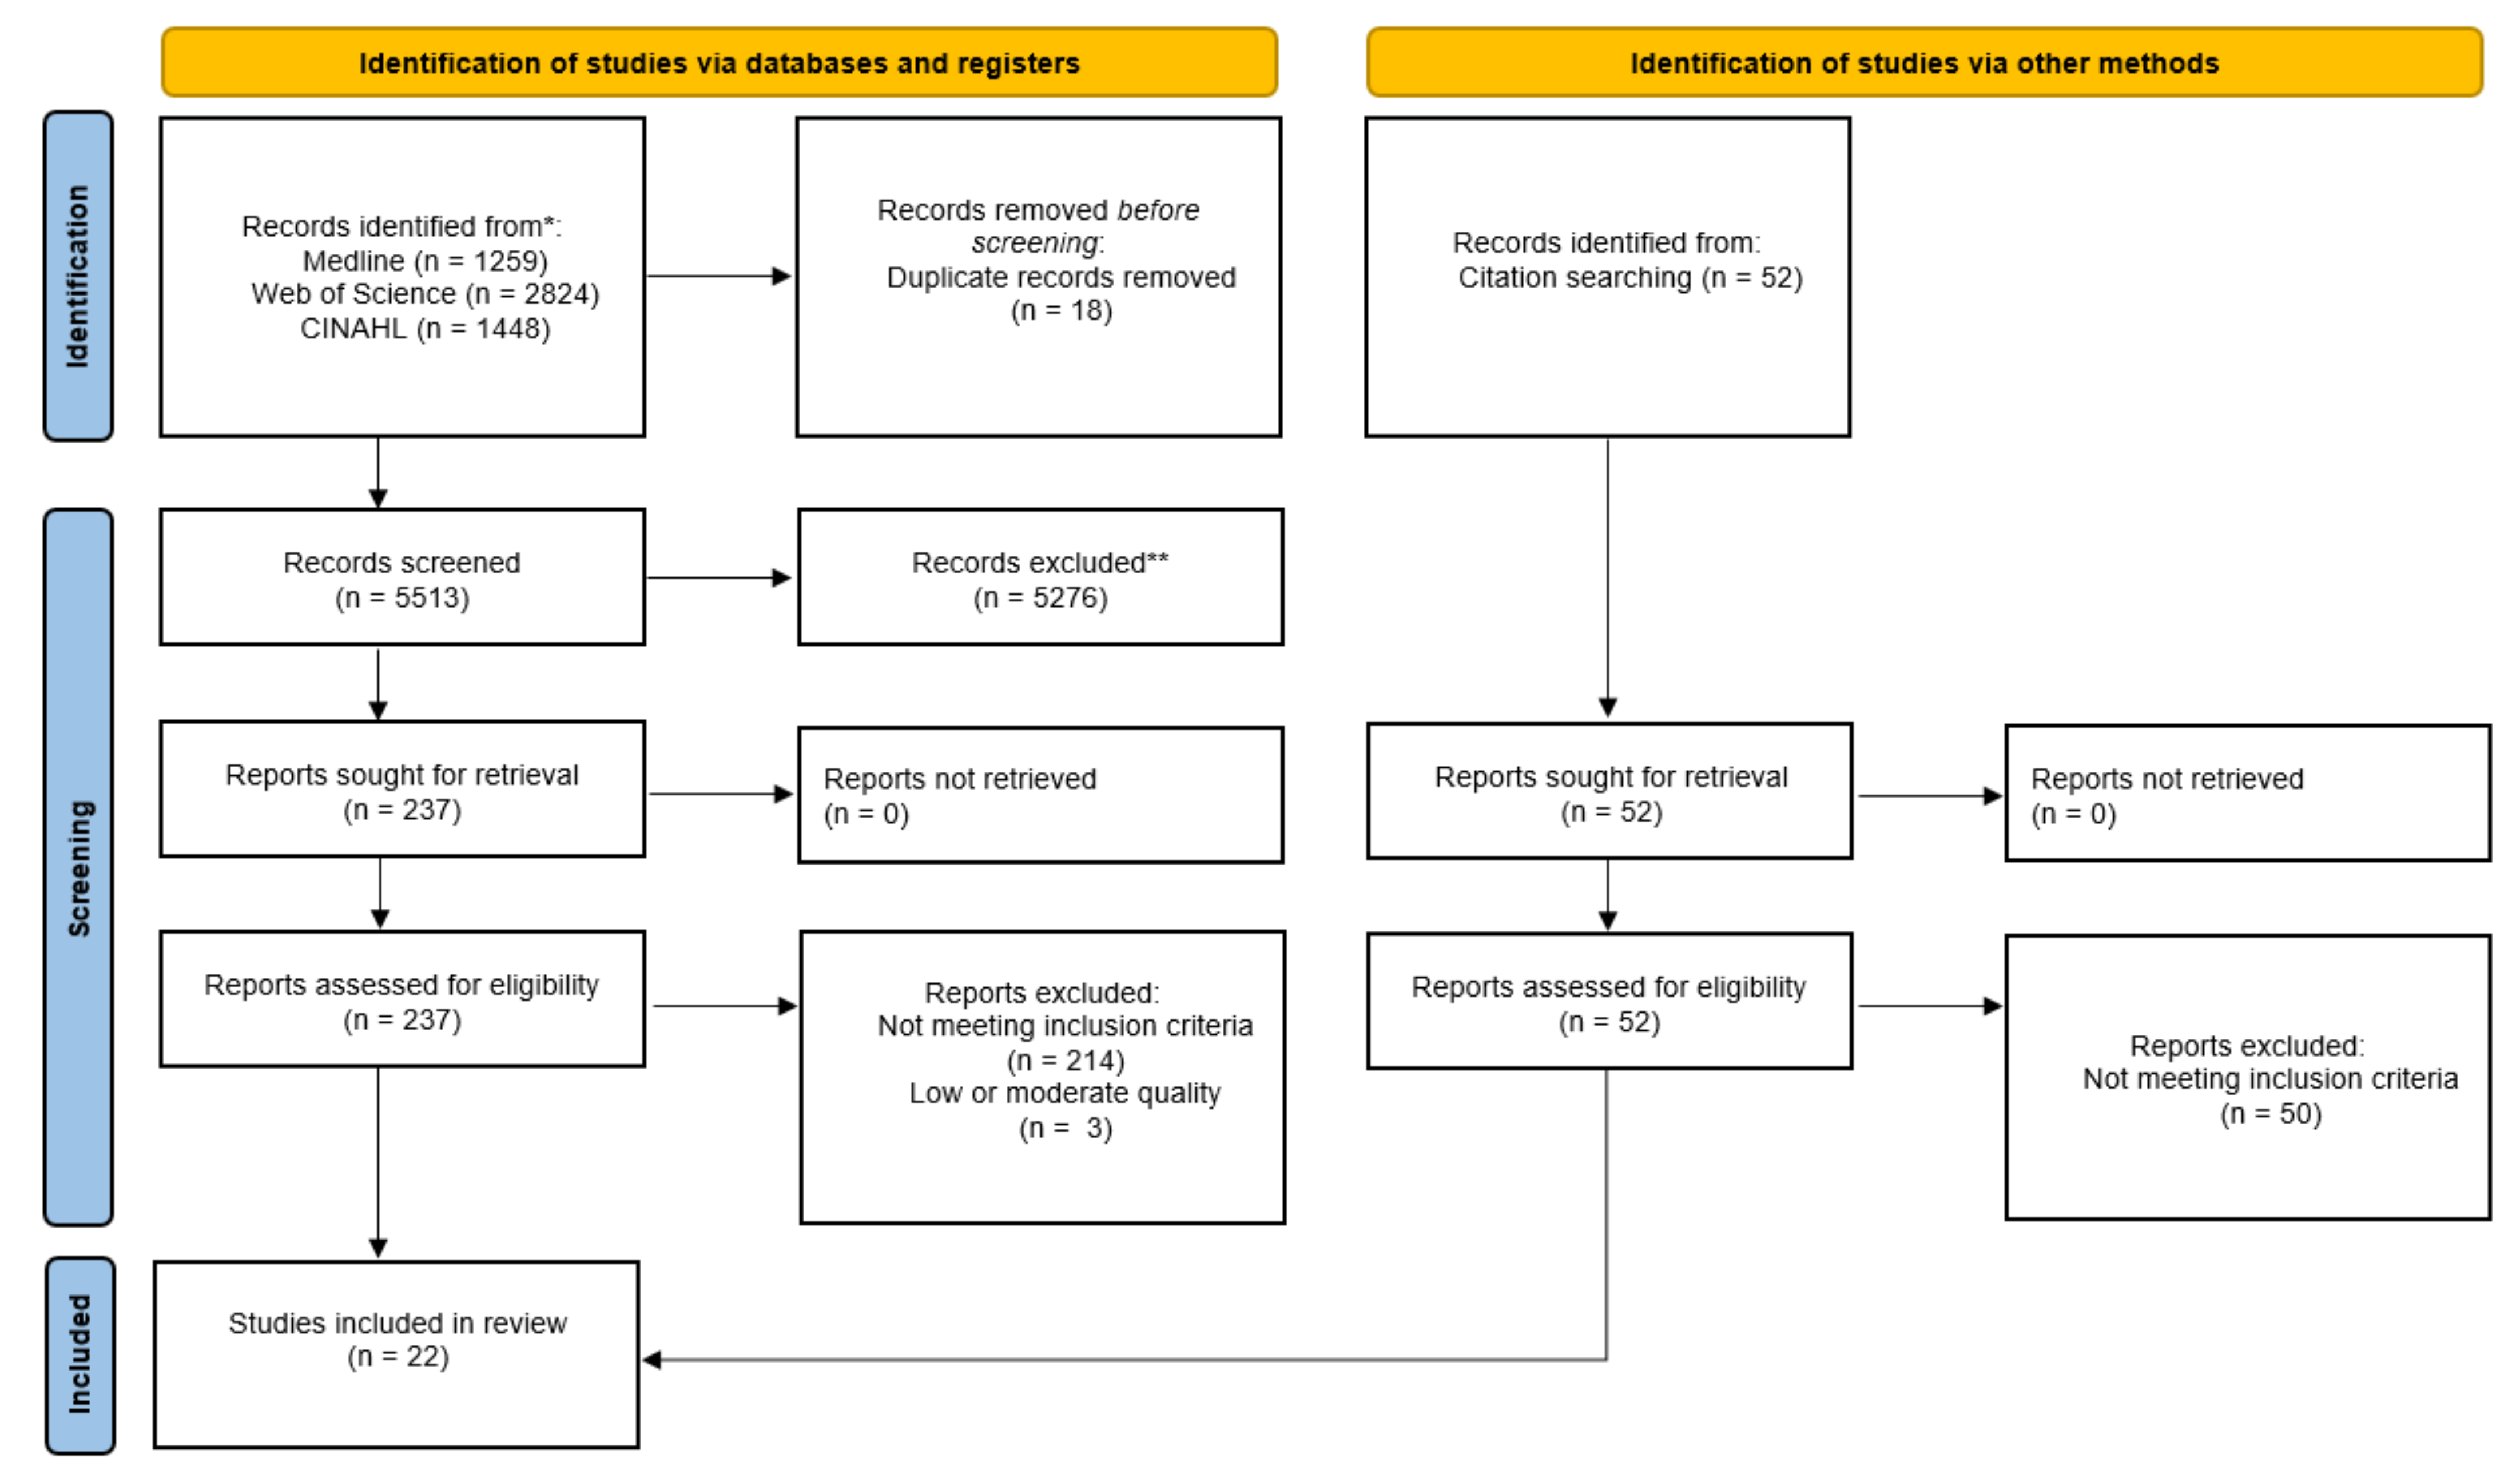
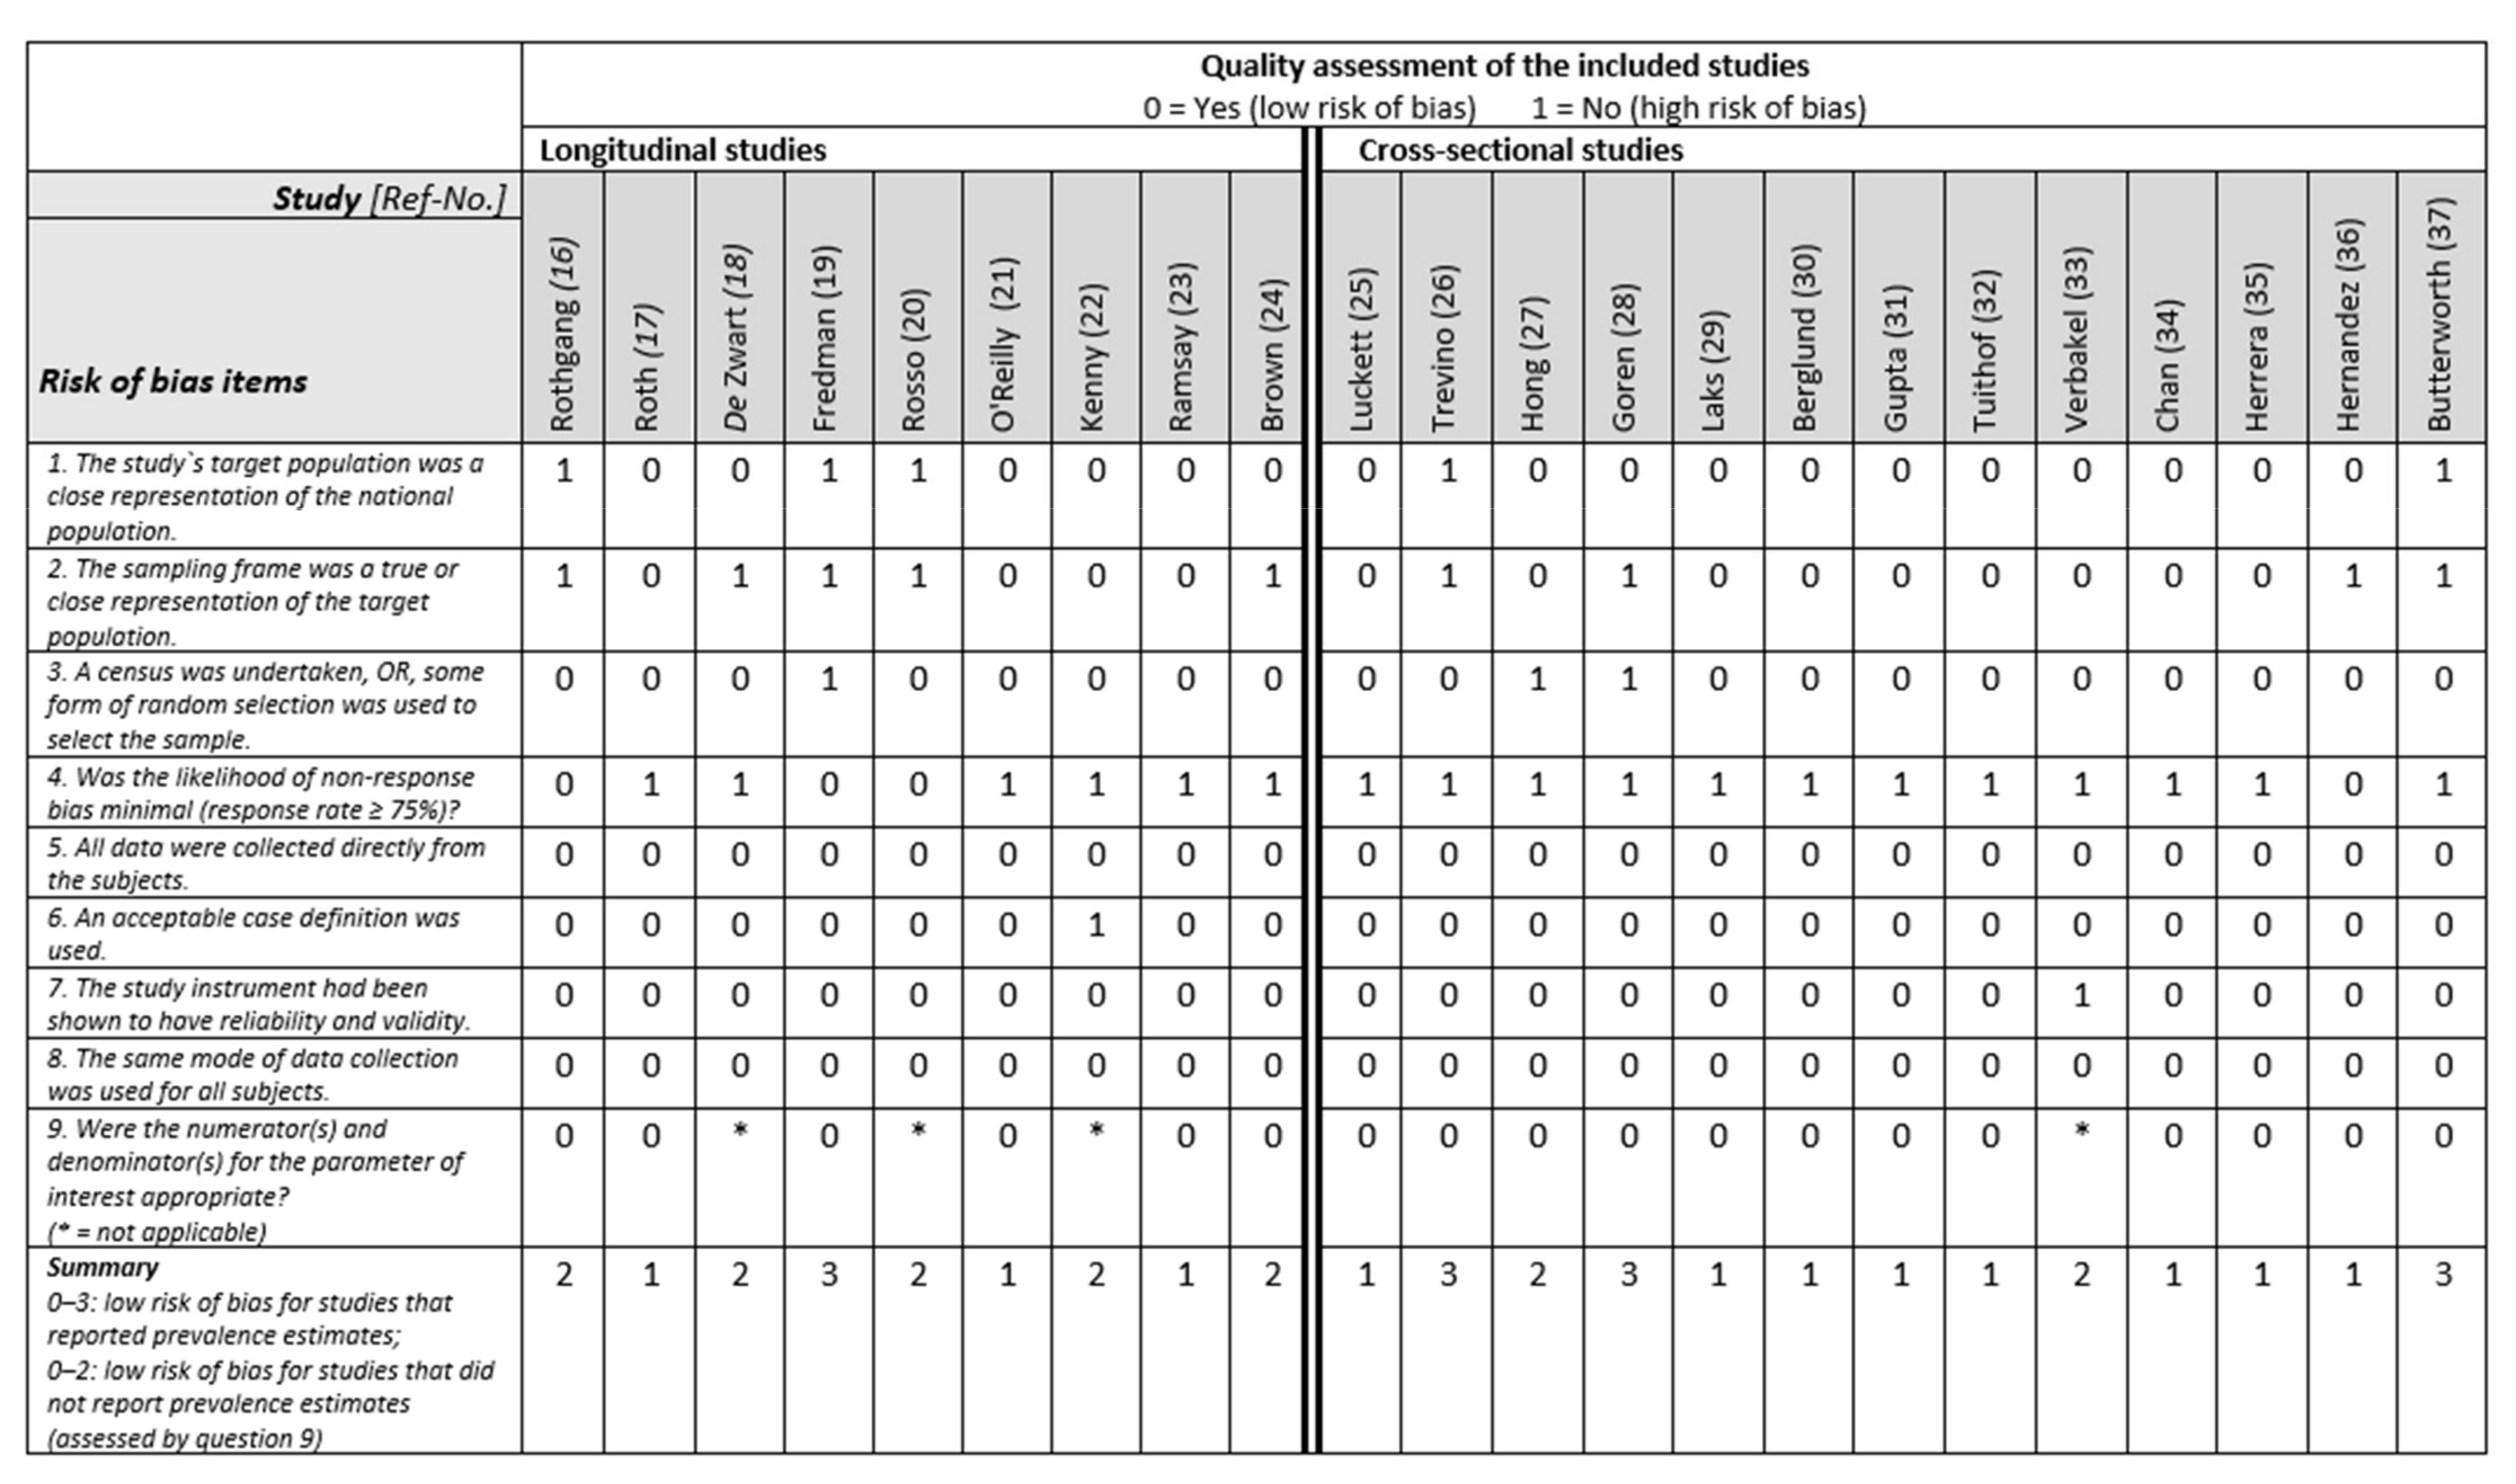
2.3. Selection of Articles and Study Quality Assessment
3. Results
3.1. Study Design and Setting
3.2. Study Sample
3.3. Longitudinal Evaluations
3.3.1. Mortality
3.3.2. Mental Morbidities
3.3.3. Physical Morbidities
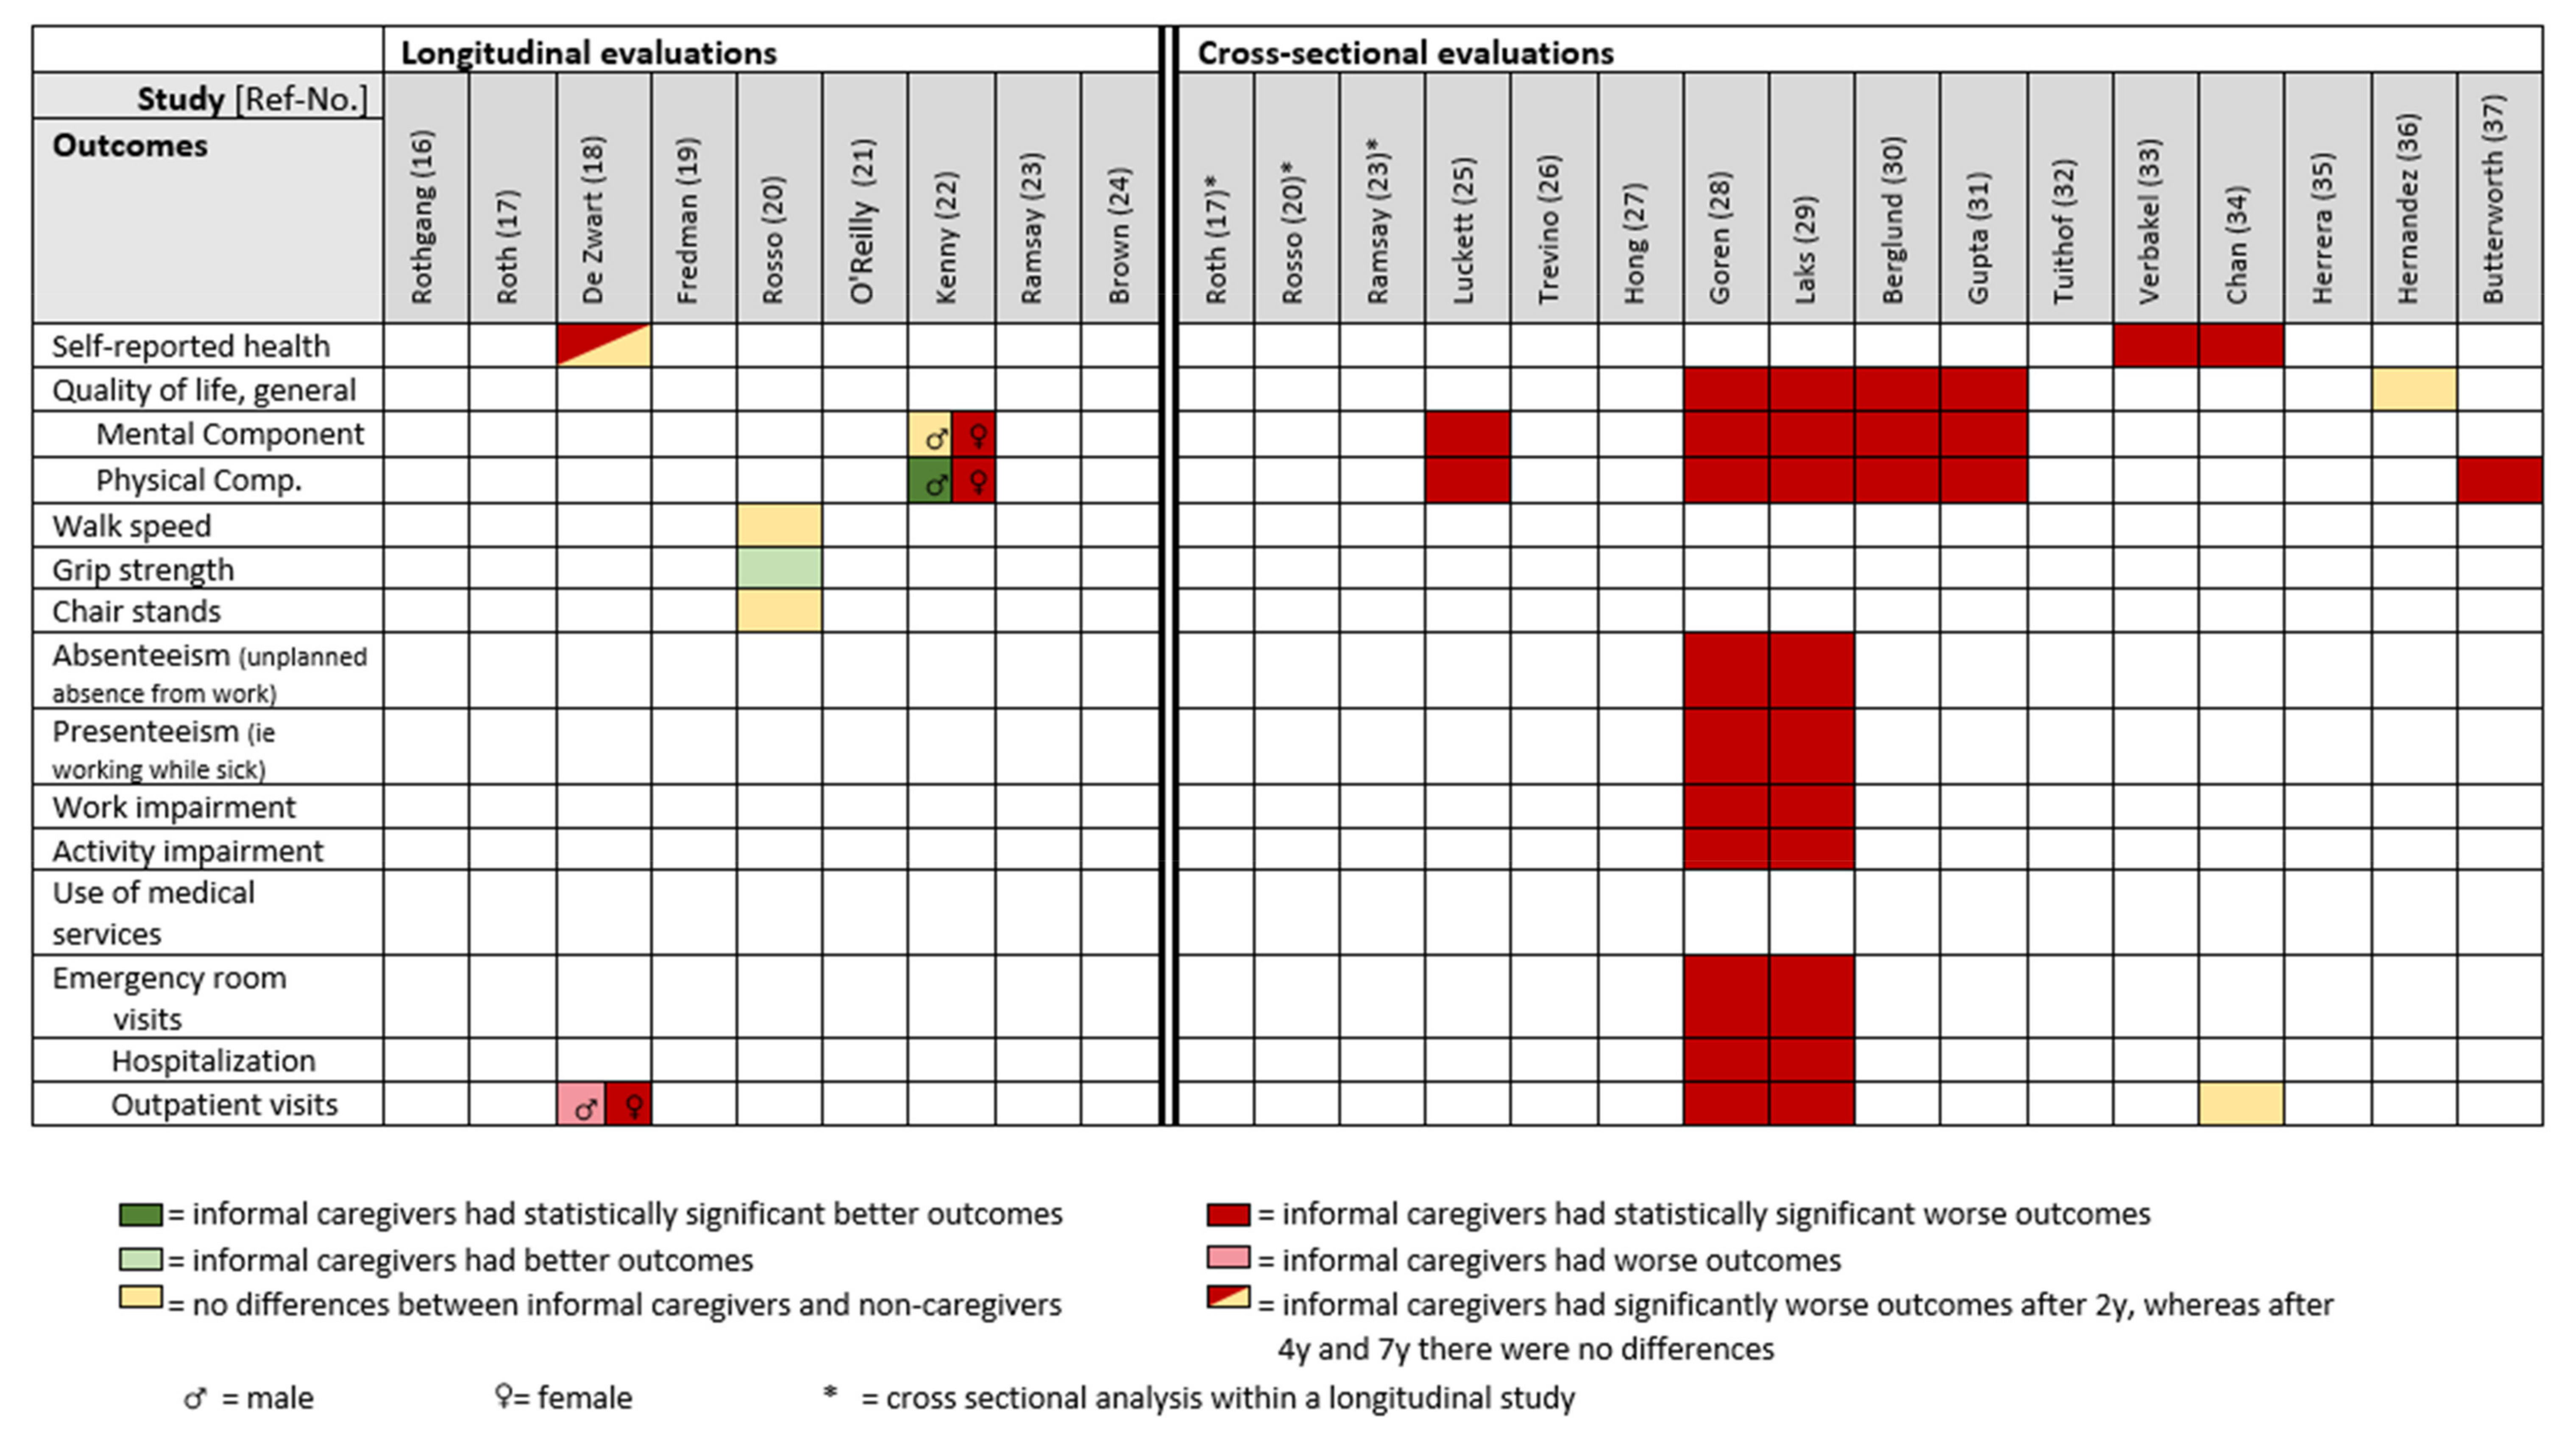
3.3.4. Health-Related Outcomes
3.4. Cross-Sectional Evaluations
3.4.1. Mental Morbidities
3.4.2. Physical Morbidities
3.4.3. Health-Related Outcomes
4. Discussion
4.1. Main Findings
4.2. Interpretation of the Results
4.2.1. Comparison with Other Systematic Reviews
4.2.2. Longitudinal Evaluations
Mortality
Morbidity
Health-Related Outcomes
4.2.3. Cross-Sectional Evaluations
Morbidity
Health-Related Outcomes
4.3. Positive Aspects of Informal Caregiving
4.4. Strengths and Limitations
5. Conclusions
Supplementary Materials
Author Contributions
Funding
Institutional Review Board Statement
Informed Consent Statement
Data Availability Statement
Acknowledgments
Conflicts of Interest
References
- United Nations, Department of Economic and Social Affairs, Population Division. World Population Ageing 2019: Highlights; United Nations: New York, NY, USA, 2020. [Google Scholar]
- Schulz, R.; Eden, J. (Eds.) Families Caring for an Aging America; National Academies Press: Washington, DC, USA, 2016; ISBN 9780309448062. [Google Scholar]
- OECD. Health at a Glance 2019; OECD: Paris, France, 2019; ISBN 9789264382084. [Google Scholar]
- Bauer, M.J.; Sousa-Poza, A. Impacts of Informal Caregiving on Caregiver Employment, Health, and Family; Institute for the Study of Labor (IZA): Bonn, Germany, 2015. [Google Scholar]
- Schulz, R.; Beach, R.S. Caregiving as a Risk Factor for Mortality: The Caregiver Health Effects Study. JAMA 1999, 282, 2215–2219. [Google Scholar] [CrossRef] [PubMed] [Green Version]
- Pinquart, M.; Sörensen, S. Differences between caregivers and noncaregivers in psychological health and physical health: A meta-analysis. Psychol. Aging 2003, 18, 250–267. [Google Scholar] [CrossRef] [PubMed]
- O’Reilly, D.; Connolly, S.; Rosato, M.; Patterson, C. Is caring associated with an increased risk of mortality? A longitudinal study. Soc. Sci. Med. 2008, 67, 1282–1290. [Google Scholar] [CrossRef] [PubMed] [Green Version]
- Mackenzie, A.; Greenwood, N. Positive experiences of caregiving in stroke: A systematic review. Disabil. Rehabil. 2012, 34, 1413–1422. [Google Scholar] [CrossRef]
- Quinn, C.; Toms, G. Influence of Positive Aspects of Dementia Caregiving on Caregivers’ Well-Being: A Systematic Review. Gerontologist 2019, 59, e584–e596. [Google Scholar] [CrossRef]
- Roth, D.L.; Fredman, L.; Haley, W.E. Informal caregiving and its impact on health: A reappraisal from population-based studies. Gerontologist 2015, 55, 309–319. [Google Scholar] [CrossRef] [Green Version]
- Alltag, S.; Conrad, I.; Riedel-Heller, S.G. Pflegebelastungen bei älteren Angehörigen von Demenzerkrankten und deren Einfluss auf die Lebensqualität: Eine systematische Literaturübersicht. Z. Gerontol. Geriatr. 2019, 52, 477–486. [Google Scholar] [CrossRef]
- Pinquart, M.; Sörensen, S. Correlates of physical health of informal caregivers: A meta-analysis. J. Gerontol. B Psychol. Sci. Soc. Sci. 2007, 62, P126–P137. [Google Scholar] [CrossRef] [Green Version]
- Bom, J.; Bakx, P.; Schut, F.; van Doorslaer, E. The Impact of Informal Caregiving for Older Adults on the Health of Various Types of Caregivers: A Systematic Review. Gerontologist 2019, 59, e629–e642. [Google Scholar] [CrossRef] [Green Version]
- Page, M.J.; McKenzie, J.E.; Bossuyt, P.M.; Boutron, I.; Hoffmann, T.C.; Mulrow, C.D.; Shamseer, L.; Tetzlaff, J.M.; Akl, E.A.; Brennan, S.E.; et al. The PRISMA 2020 statement: An updated guideline for reporting systematic reviews. BMJ 2021, 372, n71. [Google Scholar] [CrossRef]
- Hoy, D.; Brooks, P.; Woolf, A.; Blyth, F.; March, L.; Bain, C.; Smith, E.; Buchbinder, R. Assessing risk of bias in prevalence studies: Modification of an existing tool and evidence of interrater agreement. J. Clin. Epidemiol. 2012, 65, 934–939. [Google Scholar] [CrossRef]
- Rothgang, H.; Müller, R. Pflegereport 2018: Schriftenreihe zur Gesundheitsanalyse; Band 12; Pflegereport: Berlin, Germany, 2018. [Google Scholar]
- Roth, D.L.; Brown, S.L.; Rhodes, J.D.; Haley, W.E. Reduced mortality rates among caregivers: Does family caregiving provide a stress-buffering effect? Psychol. Aging 2018, 33, 619–629. [Google Scholar] [CrossRef]
- de Zwart, P.L.; Bakx, P.; van Doorslaer, E.K.A. Will you still need me, will you still feed me when I’m 64? The health impact of caregiving to one’s spouse. Health Econ. 2017, 26 (Suppl. 2), 127–138. [Google Scholar] [CrossRef] [Green Version]
- Fredman, L.; Lyons, J.G.; Cauley, J.A.; Hochberg, M.; Applebaum, K.M. The Relationship Between Caregiving and Mortality After Accounting for Time-Varying Caregiver Status and Addressing the Healthy Caregiver Hypothesis. J. Gerontol. A Biol. Sci. Med. Sci. 2015, 70, 1163–1168. [Google Scholar] [CrossRef] [Green Version]
- Rosso, A.L.; Lee, B.K.; Stefanick, M.L.; Kroenke, C.H.; Coker, L.H.; Woods, N.F.; Michael, Y.L. Caregiving frequency and physical function: The Women’s Health Initiative. J. Gerontol. A Biol. Sci. Med. Sci. 2015, 70, 210–215. [Google Scholar] [CrossRef] [Green Version]
- O’Reilly, D.; Rosato, M.; Maguire, A. Caregiving reduces mortality risk for most caregivers: A census-based record linkage study. Int. J. Epidemiol. 2015, 44, 1959–1969. [Google Scholar] [CrossRef]
- Kenny, P.; King, M.T.; Hall, J. The physical functioning and mental health of informal carers: Evidence of care-giving impacts from an Australian population-based cohort. Health Soc. Care Community 2014, 22, 646–659. [Google Scholar] [CrossRef]
- Ramsay, S.; Grundy, E.; O’Reilly, D. The relationship between informal caregiving and mortality: An analysis using the ONS Longitudinal Study of England and Wales. J. Epidemiol. Community Health 2013, 67, 655–660. [Google Scholar] [CrossRef]
- Brown, S.L.; Smith, D.M.; Schulz, R.; Kabeto, M.U.; Ubel, P.A.; Poulin, M.; Yi, J.; Kim, C.; Langa, K.M. Caregiving behavior is associated with decreased mortality risk. Psychol. Sci. 2009, 20, 488–494. [Google Scholar] [CrossRef] [Green Version]
- Luckett, T.; Agar, M.; DiGiacomo, M.; Lam, L.; Phillips, J. Health status in South Australians caring for people with cancer: A population-based study. Psychooncology. 2019, 28, 2149–2156. [Google Scholar] [CrossRef]
- Trevino, K.M.; Prigerson, H.G.; Maciejewski, P.K. Advanced cancer caregiving as a risk for major depressive episodes and generalized anxiety disorder. Psychooncology 2018, 27, 243–249. [Google Scholar] [CrossRef]
- Hong, I.; Han, A.; Reistetter, T.A.; Simpson, A.N. The risk of stroke in spouses of people living with dementia in Korea. Int. J. Stroke 2017, 12, 851–857. [Google Scholar] [CrossRef]
- Goren, A.; Montgomery, W.; Kahle-Wrobleski, K.; Nakamura, T.; Ueda, K. Impact of caring for persons with Alzheimer’s disease or dementia on caregivers’ health outcomes: Findings from a community based survey in Japan. BMC Geriatr. 2016, 16, 122. [Google Scholar] [CrossRef] [Green Version]
- Laks, J.; Goren, A.; Dueñas, H.; Novick, D.; Kahle-Wrobleski, K. Caregiving for patients with Alzheimer’s disease or dementia and its association with psychiatric and clinical comorbidities and other health outcomes in Brazil. Int. J. Geriatr. Psychiatry 2016, 31, 176–185. [Google Scholar] [CrossRef]
- Berglund, E.; Lytsy, P.; Westerling, R. Health and wellbeing in informal caregivers and non-caregivers: A comparative cross-sectional study of the Swedish general population. Health Qual. Life Outcomes 2015, 13, 109. [Google Scholar] [CrossRef]
- Gupta, S.; Isherwood, G.; Jones, K.; van Impe, K. Assessing health status in informal schizophrenia caregivers compared with health status in non-caregivers and caregivers of other conditions. BMC Psychiatry 2015, 15, 162. [Google Scholar] [CrossRef] [Green Version]
- Tuithof, M.; Have, M.; van Dorsselaer, S.; de Graaf, R. Emotional disorders among informal caregivers in the general population: Target groups for prevention. BMC Psychiatry 2015, 15, 23. [Google Scholar] [CrossRef] [Green Version]
- Verbakel, E. Informal caregiving and well-being in Europe: What can ease the negative consequences for caregivers? J. Eur. Soc. Policy 2014, 24, 424–441. [Google Scholar] [CrossRef]
- Chan, A.; Malhotra, C.; Malhotra, R.; Rush, A.J.; Østbye, T. Health impacts of caregiving for older adults with functional limitations: Results from the Singapore survey on informal caregiving. J. Aging Health 2013, 25, 998–1012. [Google Scholar] [CrossRef]
- Herrera, A.P.; Mendez-Luck, C.A.; Crist, J.D.; Smith, M.L.; Warre, R.; Ory, M.G.; Markides, K. Psychosocial and cognitive health differences by caregiver status among older Mexican Americans. Community Ment. Health J. 2013, 49, 61–72. [Google Scholar] [CrossRef] [Green Version]
- Hernandez, A.M.; Bigatti, S.M. Depression among older Mexican American caregivers. Cultur. Divers. Ethn. Minor. Psychol. 2010, 16, 50–58. [Google Scholar] [CrossRef] [PubMed]
- Butterworth, P.; Pymont, C.; Rodgers, B.; Windsor, T.D.; Anstey, K.J. Factors that explain the poorer mental health of caregivers: Results from a community survey of older Australians. Aust. N. Z. J. Psychiatry 2010, 44, 616–624. [Google Scholar] [CrossRef] [PubMed]
- Weiss, N.S. All-cause mortality as an outcome in epidemiologic studies: Proceed with caution. Eur. J. Epidemiol. 2014, 29, 147–149. [Google Scholar] [CrossRef] [PubMed]
- Bertrand, R.M.; Saczynski, J.S.; Mezzacappa, C.; Hulse, M.; Ensrud, K.; Fredman, L. Caregiving and cognitive function in older women: Evidence for the healthy caregiver hypothesis. J. Aging Health 2012, 24, 48–66. [Google Scholar] [CrossRef] [Green Version]
- McCann, J.J.; Hebert, E.L.; Bienias, L.J.; Morris, C.M.; Evans, A.D. Predictors of Beginning and Ending Caregiving During a 3-Year Period in a Biracial Community Population of Older Adults. Am. J. Public Health 2004, 94, 1800–1806. [Google Scholar] [CrossRef]
- Fredman, L.; Doros, G.; Ensrud, K.E.; Hochberg, M.C.; Cauley, J.A. Caregiving intensity and change in physical functioning over a 2-year period: Results of the caregiver-study of osteoporotic fractures. Am. J. Epidemiol. 2009, 170, 203–210. [Google Scholar] [CrossRef] [Green Version]
- Fredman, L.; Cauley, J.A.; Hochberg, M.; Ensrud, K.E.; Doros, G. Mortality associated with caregiving, general stress, and caregiving-related stress in elderly women: Results of caregiver-study of osteoporotic fractures. J. Am. Geriatr. Soc. 2010, 58, 937–943. [Google Scholar] [CrossRef] [Green Version]
- Litzelman, K.; Witt, W.P.; Gangnon, R.E.; Nieto, F.J.; Engelman, C.D.; Mailick, M.R.; Skinner, H.G. Association between informal caregiving and cellular aging in the survey of the health of wisconsin: The role of caregiving characteristics, stress, and strain. Am. J. Epidemiol. 2014, 179, 1340–1352. [Google Scholar] [CrossRef] [Green Version]
- Hajek, A.; König, H.-H. Informal Caregiving and Subjective Well-Being: Evidence of a Population-Based Longitudinal Study of Older Adults in Germany. J. Am. Med. Dir. Assoc. 2016, 17, 300–305. [Google Scholar] [CrossRef]
- Ruisoto, P.; Ramírez, M.; Paladines-Costa, B.; Vaca, S.; Clemente-Suárez, V.J. Predicting Caregiver Burden in Informal Caregivers for the Elderly in Ecuador. Int. J. Environ. Res. Public Health 2020, 17, 7338. [Google Scholar] [CrossRef]
- Mahoney, R.; Regan, C.; Katona, C.; Livingston, G. Anxiety and Depression in Family Caregivers of People with Alzheimer Disease: The LASER-AD Study. Am. J. Geriatr. Psychiatry 2005, 13, 795–801. [Google Scholar] [CrossRef]
- Lua, P.L.; Bakar, Z.A. Health-related quality of life profiles among family caregivers of patients with schizophrenia. Fam. Community Health 2011, 34, 331–339. [Google Scholar] [CrossRef]
- Cuijpers, P. Depressive disorders in caregivers of dementia patients: A systematic review. Aging Ment. Health 2005, 9, 325–330. [Google Scholar] [CrossRef]
- Fauth, E.; Hess, K.; Piercy, K.; Norton, M.; Corcoran, C.; Rabins, P.; Lyketsos, C.; Tschanz, J. Caregivers’ relationship closeness with the person with dementia predicts both positive and negative outcomes for caregivers’ physical health and psychological well-being. Aging Ment. Health 2012, 16, 699–711. [Google Scholar] [CrossRef] [Green Version]
- Pearlin, L.I.; Mullan, J.T.; Semple, S.J.; Skaff, M.M. Caregiving and the stress process: An overview of concepts and their measures. Gerontologist 1990, 30, 583–594. [Google Scholar] [CrossRef]
- van Praag, H.M. Can stress cause depression? World J. Biol. Psychiatry 2005, 6 (Suppl. 2), 5–22. [Google Scholar] [CrossRef]
- Gold, P.W. The organization of the stress system and its dysregulation in depressive illness. Mol. Psychiatry 2015, 20, 32–47. [Google Scholar] [CrossRef] [Green Version]
- Belvederi Murri, M.; Pariante, C.; Mondelli, V.; Masotti, M.; Atti, A.R.; Mellacqua, Z.; Antonioli, M.; Ghio, L.; Menchetti, M.; Zanetidou, S.; et al. HPA axis and aging in depression: Systematic review and meta-analysis. Psychoneuroendocrinology 2014, 41, 46–62. [Google Scholar] [CrossRef]
- Boggero, I.A.; Hostinar, C.E.; Haak, E.A.; Murphy, M.L.M.; Segerstrom, S.C. Psychosocial functioning and the cortisol awakening response: Meta-analysis, P-curve analysis, and evaluation of the evidential value in existing studies. Biol. Psychol. 2017, 129, 207–230. [Google Scholar] [CrossRef] [Green Version]
- van der Sanden, R.L.M.; Stutterheim, S.E.; Pryor, J.B.; Kok, G.; Bos, A.E.R. Coping with stigma by association and family burden among family members of people with mental illness. J. Nerv. Ment. Dis. 2014, 202, 710–717. [Google Scholar] [CrossRef] [Green Version]
- Dean, E. Anxiety. Nurs. Stand. 2016, 30, 15. [Google Scholar] [CrossRef]
- Del-Pino-Casado, R.; Priego-Cubero, E.; López-Martínez, C.; Orgeta, V. Subjective caregiver burden and anxiety in informal caregivers: A systematic review and meta-analysis. PLoS ONE 2021, 16, e0247143. [Google Scholar] [CrossRef]
- Conrad, I.; Alltag, S.; Matschinger, H.; Kilian, R.; Riedel-Heller, S.G. Lebensqualität älterer pflegender Angehöriger von Demenzerkrankten. Nervenarzt 2018, 89, 500–508. [Google Scholar] [CrossRef]
- Moreno, J.A.; Nicholls, E.; Ojeda, N.; de los Reyes-Aragón, C.J.; Rivera, D.; Arango-Lasprilla, J.C. Caregiving in Dementia and its Impact on Psychological Functioning and Health-Related Quality of Life: Findings from a Colombian Sample. J. Cross Cult. Gerontol. 2015, 30, 393–408. [Google Scholar] [CrossRef]
- Santos, R.L.; Sousa, M.F.B.d.; Simões-Neto, J.P.; Nogueira, M.L.; Belfort, T.T.; Torres, B.; Rosa, R.D.L.d.; Laks, J.; Dourado, M.C.N. Caregivers’ quality of life in mild and moderate dementia. Arq. Neuropsiquiatr. 2014, 72, 931–937. [Google Scholar] [CrossRef]
- Okun, M.A.; Yeung, E.W.; Brown, S. Volunteering by older adults and risk of mortality: A meta-analysis. Psychol. Aging 2013, 28, 564–577. [Google Scholar] [CrossRef] [Green Version]
- Brown, W.M.; Consedine, N.S.; Magai, C. Altruism relates to health in an ethnically diverse sample of older adults. J. Gerontol. B Psychol. Sci. Soc. Sci. 2005, 60, P143–P152. [Google Scholar] [CrossRef] [Green Version]
- Schwartz, C.; Meisenhelder, J.B.; Ma, Y.; Reed, G. Altruistic social interest behaviors are associated with better mental health. Psychosom. Med. 2003, 65, 778–785. [Google Scholar] [CrossRef] [Green Version]
- Jacobi, C.E.; van den Berg, B.; Boshuizen, H.C.; Rupp, I.; Dinant, H.J.; van den Bos, G.A.M. Dimension-specific burden of caregiving among partners of rheumatoid arthritis patients. Rheumatology 2003, 42, 1226–1233. [Google Scholar] [CrossRef] [Green Version]
- Hansen, T.; Slagsvold, B.; Ingebretsen, R. The Strains and Gains of Caregiving: An Examination of the Effects of Providing Personal Care to a Parent on a Range of Indicators of Psychological Well-Being. Soc. Indic. Res. 2013, 114, 323–343. [Google Scholar] [CrossRef] [Green Version]
- Lazarus, R.S.; Folkman, S. Stress, Appraisal and Coping; Springer: New York, NY, USA, 1984. [Google Scholar]
- Schulz, R.; Beach, S.R.; Cook, T.B.; Martire, L.M.; Tomlinson, J.M.; Monin, J.K. Predictors and consequences of perceived lack of choice in becoming an informal caregiver. Aging Ment. Health 2012, 16, 712–721. [Google Scholar] [CrossRef] [PubMed] [Green Version]
- Buyck, J.-F.; Bonnaud, S.; Boumendil, A.; Andrieu, S.; Bonenfant, S. Informal Caregiving and Self-Reported Mental and Physical Health: Results from the Gazel Cohort Study. Am. J. Public Health 2011, 101, 1971–1979. [Google Scholar] [CrossRef] [PubMed]
- Bendavid, E.; Oh, C.; Bhattacharya, J.; Ioannidis, J.P.A. Assessing mandatory stay-at-home and business closure effects on the spread of COVID-19. Eur. J. Clin. Investig. 2021, 51, e13484. [Google Scholar] [CrossRef] [PubMed]
- Santini, S.; Socci, M.; Fabbietti, P.; Lamura, G.; Teti, A. Factors Worsening and Mitigating the Consequences of the COVID-19 Outbreak on the Overall Health of Informal Caregivers of Older People with Long-Term Care Needs Living in Germany and in Italy. Int. J. Environ. Res. Public Health 2022, 19, 1694. [Google Scholar] [CrossRef] [PubMed]
- Budnick, A.; Hering, C.; Eggert, S.; Teubner, C.; Suhr, R.; Kuhlmey, A.; Gellert, P. Informal caregivers during the COVID-19 pandemic perceive additional burden: Findings from an ad-hoc survey in Germany. BMC Health Serv. Res. 2021, 21, 353. [Google Scholar] [CrossRef]
- Schorren, N. The Impact of COVID-19 on Wellbeing, Depression, and Physical Activity of Informal Caregivers and Non-Caregivers during Isolation. Available online: http://essay.utwente.nl/82470/1/Schorren_BA_BMS.pdf (accessed on 23 September 2021).
- Hoffmann, F.; Icks, A. Diabetes ‘epidemic’ in Germany? A critical look at health insurance data sources. Exp. Clin. Endocrinol. Diabetes 2012, 120, 410–415. [Google Scholar] [CrossRef]


| First Author, Publication Year, Country [Reference] | Year of Recruitment, Follow-up | Study Population: N, Age [Mean (SD); Range], Women (%) | Data Source | Description of Sample |
|---|---|---|---|---|
| Rothgang, 2018, Germany [16] | 2012, 5 y | IC vs. NC: 179,134 vs. approx. 2,300,000 (projected) members as NC from BARMER health insurance company. IC (for NC not reported) 20–44 y: 11%, 45–99 y: 89% 67% | BARMER health insurance company: routine data of IC (n = 179,134). Weighted for general population characteristics. | The main caregiver of the care recipient based on reports to their statutory health insurance company (in Germany). The care recipient had to be in need of care according to the German Social Security Code XI. Main caregiver sociodemographic parameters: male: 30.5%, female: 69.5%; age: 0–49 y: 14.4%, 50–59 y: 26.0%, 60–69 y: 25.7%, 70–79 y: 16.2%, >80 y: 17.7%; working hours per week: no: 65.3%, 0–9 h/wk: 4.7%, 10–19 h/wk: 11.0%, 20–29 h/wk: 10.7%, >30 h/wk: 8.4%. |
| Roth, 2018, USA [17] | 2003, 7 y | IC vs. NC: 3580 vs. 3580, 63.6 y (9.0) vs. 63.6 y (9.1), 63.0% vs. 61.3% | The population-based Reasons for Geographic and Racial Differences in Stroke study. | The caregiver had to be older than 45 years and provide any kind of care to a family member with chronic illness or disability. |
| De Zwart, 2017, AT/BE/CH/DE/DK/ES/FR/GR/IT/ NL/SE [18] | 2004–2013, 7 y | IC vs. NC: 423 vs. 10,048, 68.0 y vs. 61.8 y, n.r. | The Survey of Health, Ageing and Retirement in Europe including people ≥ 50 years and their spouses. | The caregiver had to provide any personal care (i.e., washing, getting out of bed, or dressing) to their partner (spouse) daily or almost daily during at least three months within the past 12 months. |
| Fredman, 2015, USA [19] | 1997, 13 y | IC vs. NC: 374 vs. 694, 81 y (0.2) vs. 81.5 y (0.1), ≥65, 100% | Caregiver-Study of Osteoporotic Fractures (Caregiver-SOF), an ancillary study to the SOF. | The caregiver had to be a woman, assisting someone with at least one activity of daily living (ADL) or instrumental activity of daily living (IADL). Care recipients’ characteristics: 27% dementia, 22% frailty/general health decline, 21% stroke. Years spent caregiving (at baseline of study): <2 y: 22.2%, 2–5 y: 39.6%, >5 y: 38.2%. |
| Rosso, 2015, USA [20] | 1993–1998, 6 y | IC vs. NC: 2138 vs. 3511, 70.1 y (3.8) vs. 69.8 y (3.7), 100% | A subsample from the Women’s Health Initiative Clinical Trial of women aged 65–80 years. | The caregiver had to provide any kind of care for a family member or friend because of being sick, limited or frail. |
| O’Reilly, 2015, UK (N. Ireland) [21] | 2011, 2.8 y | IC (1–19 h/wk, 20–49 h, ≥50 h) vs. NC: 183,842 vs. 938,937, 25–44 y: 35%, 36%, 28% vs. 42%, 45–64 y: 53%, 49%, 44% vs. 35%, ≥65 y: 12%, 16%, 28% vs. 23%, 59% vs. 51% | Northern Ireland Mortality Study based census data and mortality register. | The caregiver had to provide any kind of care to a family member, friend, neighbour or others with long-term physical or mental illness, disability or problems related to old age. |
| Kenny, 2014, Australia [22] | 2001, 4 y | IC vs. NC: 424 vs. 424, 48.9 y (14.8) vs. 49.7 y (15.2), ≥16 y, 60% | IC and propensity score-matched NC from the Household Income and Labour Dynamics. | The caregiver had to provide any kind of care to a disabled spouse, adult relative or elderly parent/parent-in-law. Distribution of caregiving hours/week: <5 h/wk: 49.1%, 5–19 h/wk: 33.5%, >20 h/wk: 17.4. |
| Ramsay, 2013, UK [23] | 2001, 8 y | IC (1–19 h/wk and ≥20 h/wk) vs. NC: 31,404 vs. 146,964, 52.0 y (9.4) and 53.7 y (10.7) vs. 50.7 y (10.9), 55% and 61% vs. 49% | Office for National Statistics-Longitudinal Study of England and Wales (people between 35–74 years). | The caregiver had to look after or give any help/support to family members, friends, neighbours, or others with long-term physical or mental ill health, disability, or age-related problems. |
| Brown, 2009, USA [24] | 1993, 7 y | IC (1–14 h/wk and >14 h/wk) vs. NC: 306 and 338 vs. 2732, range ≥70 y, n.r. | Health and Retirement Study, a nationally representative sample. | The caregiver had to provide any kind of care to their spouse. |
| First Author, Publication Year, Country [Reference] | Year of Recruitment, Follow-Up | Study Population: N, Age (Mean (SD); Range), Women (%) | Data Source | Description of Sample |
|---|---|---|---|---|
| Luckett, 2019, Australia [25] | 2016 | IC vs. NC: 374 vs. 1993, 49 y (17) vs. 47 y (20), 59% vs. 48% | The Health Omnibus Survey: annual survey with randomly selected households. | The caregiver had to provide any kind of care for someone with cancer in the last five years. |
| Trevino, 2018, USA [26] | 2002–2008 | IC vs. NC: 540 vs. 9282, 53 y (14) vs. 53 y (18), 72% vs. 72% | The Coping with Cancer study identified IC and the National Comorbidity Survey Replication: general population data. | The caregiver had to provide any kind of care for a relative or a friend with advanced cancer (estimated life expectancy of six months or less). |
| Hong, 2017, South Korea [27] | 2012–2013 | IC vs. NC: 3868 vs. 310,658, 61 y (14) y vs. 53 y (14) y, 48% vs. 48% | Korea Community Health Survey. | Spousal caregiving for a partner with dementia. |
| Goren 2016, Japan [28] | 2012–2013 | IC vs. NC: 1302 vs. 53,758, 53 y (14) vs. 48 y (16), 53% vs. 49% | National Health and Wellness Survey in Japan. | Caring for a related adult with dementia including Alzheimer’s disease. |
| Laks, 2016, Brazil [29] | 2012 | IC vs. NC: 209 vs. 10,644, 42 y (14) vs. 40 y (16), 53% vs. 50% | The National Health and Wellness Survey: internet-based survey, using stratified random sampling | Any kind of care for a person with dementia. |
| Berglund 2015, Sweden [30] | 2004–2013 | IC vs. NC: 9343 vs. 76,112, 54 y (15) vs. 49 y (18), 59% vs. 54% | Swedish national public health survey Health on equal terms. | Any kind of care for a sick or old relative. |
| Gupta, 2015, FR/DE/IT/ES/GB [31] | 2010, 2010 and 2013 | IC vs. NC: 398 vs. 158,989, 45 y (16) vs. 46 y (16), 60% vs. 51% | The 5EU National Health and Wellness Survey: stratified random sample. | Any kind of care to a person with schizophrenia. |
| Tuithof, 2015, The Netherlands [32] | 2010–2012 | IC vs. NC: 1759 vs. 3544, <45 y: 36% (21–68 y) vs. 55% (21–68 y), 60% vs. 45% | The 2nd wave of the Netherlands Mental Health Survey and Incidence Study-2: nationally representative sample | Providing unpaid care in the 12 months preceding the study to a family member, partner, or friend because of physical or mental problems, or ageing. |
| Verbakel, 2014, AT/BE/CZ/DK/FI/FR/DE/HU/IE/LU/NL/NO/PL/SK/SI/ES/SE/GB [33] | 2007 | IC vs. NC: 4736 vs. 15,600, n.r. vs. n.r. n.r. vs. n.r. | The European Quality of Life Survey: random samples of the adult population; selection of countries based on availability of all relevant data. | Any kind of care for an elderly or disabled relative. |
| Chan, 2013, Singapore [34] | 2010–2011 | IC vs. NC: 1077 vs. 318, 56 y (13) vs. 57 y (15), 61% vs. 65% | A stratified, random sample of 20,000 Singaporeans from the national database of dwellings. | Any kind of care for a family member or a friend aged ≥75 y. |
| Herrera, 2013, USA [35] | 1998–1999 | IC vs. NC: 92 vs. 1888, 77 y (0.50) vs. 77 y (0.14), 72% vs. 59% | The Hispanic Established Populations for Epidemiologic Studies of the Elderly (Wave 3). | Caring for a related or unrelated older adult. Mexican-American caregivers aged ≥70 y from Texas, New Mexico, Colorado, Arizona, and California. |
| Hernandez, 2010, USA [36] | 2000–2001 | IC vs. NC: 57 vs. 57, 78 y (4) vs. 79 y (5), 68% vs. 68% | The Hispanic Established Populations for Epidemiologic Studies of the Elderly (Wave 4). | Mexican American caregivers aged ≥65 y from Texas, New Mexico, Colorado, Arizona, and California. Caring for a person with Alzheimer’s disease or physical disability. |
| Butterworth, 2010, Australia [37] | 2005 | IC vs. NC: 212 vs. 2010, 67 y (0.03), 64–69 y vs. 67 y (0.10), 64–69 y, 59% vs. 47% | PATH Through Life Project: survey of 3 cohorts from Canberra and Queanbeyan: second wave data of cohort born 1937–1941 For the present analysis. | Any kind of care ≥5 h per week. The sample of care recipients consisted of: physical disability/chronic illness (58%), memory/cognitive problems (10%), mental illness (13%). |
| First Author, Publication Year [Reference] | Outcomes and Assessment Tools | Results: Informal Caregivers (IC) vs. Non-Caregivers (NC) (Numbers in Bold Were Reported to Be Stat. Significant Results) |
|---|---|---|
| Rothgang, 2018 [16] | Incidence based on International Statistical Classification of Diseases and Related Health Problems (ICD-10): | Five-year incidence of disease in IC vs. NC (2012–2017; as ref.-categ.) comparing new diagnoses in 2017 with 2012 using odds ratios (OR) as relative risk estimates: |
| 1. Mental and behavioural disorders (F) | 1. OR: 1.35 (prevalence in 2012: 39.6% vs. 36.7%; in 2017: 48.7% vs. 42.5%) | |
| 1a. Depression (F32, F33, F34.1) | 1a. OR: 1.38 (prevalence in 2012: 18.1% vs. 16.5%; in 2017: 23.4% vs. 19.7%) | |
| 1b. Severe stress/adjustment disorders (F43) | 1b. OR: 1.61 (prevalence in 2012: 8.5% vs. 7.1%; in 2017: 12.5% vs. 8.5%) | |
| 1c. Sleep disorders (F51) | 1c. OR: 1.2 (prevalence in 2012: 1.2% vs. 1.1%; in 2017: 1.8% vs. 1.5%) | |
| 2. Diseases of digestive system (K) | 2. OR: 1.06 (prevalence in 2012: 39.2% vs. 37.6%; in 2017: 45.9% vs. 44.6%) | |
| 3. Diseases of musculoskeletal system and connective tissue (M) | 3. OR: 1.17 (prevalence in 2012: 66.8% vs. 64.4%; in 2017: 72.1% vs. 69.4%) | |
| 3a. Spinal diseases/back (M40-54) | 3a. OR: 1.19 (prevalence in 2012: 50.6% vs. 47.6%; in 2017: 54.9% vs. 51.3%) | |
| 3b. Joint disease (M00-25) | 3b. OR: 1.09 (prevalence in 2012: 20.3% vs19.6%; in 2017: 23.5% vs. 22.7%) | |
| 4. Pain (F45.5, F62.80, G54.6, M25.5, M54, M75.8, M79.6, R52) | 4. OR: 1.19 (prevalence in 2012: 42.9% vs. 39.9%; in 2017: 48.4% vs. 44.6%) | |
| Roth, 2018 [17] | Mortality over 7 years (death certificates or National Death Index) | Total sample aHR: 0.84, 95% CI: 0.72–0.97), p = 0.018 |
| Subsamples (by caregiving groups): | ||
| Spouse caregivers: aHR: 0.96, 95% CI: 0.73–1.25 | ||
| High strain caregivers: aHR: 0.73, 95% CI: 0.52–1.03 | ||
| Some strain caregivers: aHR: 0.89, 95% CI: 0.71–1.12 | ||
| No strain caregivers: aHR: 0.84, 95% CI: 0.66–1.07 | ||
| Caregiving ≥ 14 h/wk: aHR: 0.78, 95% CI: 0.63–0.98 | ||
| Caregiving < 14 h/wk: aHR: 0.87, 95% CI: 0.71–1.07 | ||
| De Zwart, 2017 [18] | 1. Depressive symptoms EURO-D scale (0 = not depressed at all, 12 = severely depressed) | 1. Change in mean scores after propensity match scoring: males: after 2 y: 0.45 (0.16), p < 0.01, 4 y: −0.18 (0.18), 7 y: 0.15 (0.23), both p ≥ 0.050 females: after 2 y: 0.57 (0.16), p < 0.01, 4 y: −0.10 (0.18), 7 y: −0.13 (0.20), both p ≥ 0.050 |
| 2. Self-reported health (5-point scale from 1 = worst to 5 = best) | 2. Change in mean scores after propensity match scoring: males: after 2 y: −0.16 (0.07), p < 0.10, 4 y: 0.07 (0.09), 7 y: 0.02 (0.10), both p ≥ 0.050 females: after 2 y: −0.20 (0.061), p < 0.10, 4 y: 0.01 (0.07), 7 y: 0.02 (0.08), both p ≥ 0.050 | |
| 3. Self-reported number of doctor visits in past 12 months | 3. Change in mean scores after propensity match scoring: males: after 2 y: 0.67 (0.50), p ≥ 0.050, 4 y: 0.88 (0.64), p ≥ 0.050, 7 y: 1.22 (0.79), p ≥ 0.050 females: after 2 y: 1.37 (0.47), p < 0.05, 4 y: 0.01 (0.52),p ≥ 0.050, 7 y: −1.54 (0.58), p < 0.05 | |
| Fredman, 2015 [19] | Mortality over 13 years (death certificates) | IC vs. NC: 38.8% (n = 145) vs. 48.7% (n = 338) deaths aHR 0.77, 95% CI: 0.62–0.95 |
| Rosso, 2015 [20] | Physical function | Baseline Characteristics for High-Frequency IC (≥3 x/wk)/Low-Frequency IC (≤2 x/wk)/NC |
| 1. Mean walk speed (time to complete a 6-m course) | 1. Mean walk speed, m/s (SD): 1.10 (0.26)/1.08 (0.27)/1.09 (0.26) | |
| 2. Mean grip strength (by hand-grip dynamometer) | 2. Mean grip strength, kg (SD): 22.5 (5.5)/23.2 (5.4)/22.9 (5.4) | |
| 3. Mean chair stands (number of times participants could rise in 15 s) | 3. Mean chair stands, number (SD): 6.4 (1.9)/6.4 (1.9)/6.4 (1.9) | |
| Mean Differences in Measures of Physical Function after 6 years: High-frequency IC (≥3 x/wk) and Low-Frequency (≤2 x/wk) vs. NC (reference) | 1. Walk speed (m/s): 0.01, 95% CI: −0.01–0.03 and 0.00, 95% CI: −0.12–0.02 | |
| 2. Grip strength (kg): 0.11, 95% CI: −0.57–0.35 and 0.63, 95% CI: 0.24–1.01 | ||
| 3. Chair stands (number): 0.02, 95% CI: −0.17–0.22 and −0.12, 95% CI: −0.26–0.03 | ||
| Analyses used inverse proportional weights from propensity scores of caregiving at baseline and for differential attrition and were adjusted for study enrolment. | ||
| O’Reilly, 2015 [21] | Mortality over 2.8 years (mortality records) | Total sample: aHR 0.72, 95% CI: 0.69–0.75 |
| Subsamples (by number of hours/week spent caring): | ||
| Men, heavy care (≥50 h/wk): aHR: 0.77, 95% CI: 0.71–0.83 | ||
| Men, medium care (20–49 h/wk): aHR: 0.81, 95% CI: 0.71–0.92 | ||
| Men, light care (1–19 h/wk): aHR: 0.70, 95% CI: 0.64–0.77 | ||
| Women, heavy care (≥50 h/wk): aHR: 0.76, 95% CI: 0.69–0.83 | ||
| Women, medium care 20–49 h/wk): aHR: 0.66, 95% CI: 0.57–0.78 | ||
| Women, light care (1–19 h/wk): aHR: 0.62, 95% CI:0.56–0.69 | ||
| Kenny, 2014 [22] | Quality of Life (QoL) (SF-36: Physical Component and Mental Component Scale, range 0 = worst, 100 = best) | Coefficient (95% CI) from separate multiple regression models for change in QoL components in IC relative to NC: |
| 1. Physical Functioning Component | 1. Caregiving 5–19 h/wk: after 2 y: 2.5 (−4.8–9.9), after 4 y: −7.7 (−16.4–1.0) 1. Caregiving ≥ 20 h/wk: after 2 y: 10.0 (1.5–18.4), after 4 y: 3.1 (−6.7–12.9) | |
| 2. Mental Health Component | 2. Caregiving 5–19 h/wk: after 2 y: −2.4 (−7.4–2.5), after 4 y: −9.2 (−17.0–1.5), 2. Caregiving ≥ 20 h/wk: after 2 y: 3.2 (−3.5–9.9), after 4 y: −8.7 (−18.1–0.7) | |
| Ramsay, 2013 [23] | Mortality over 8 years | All-cause mortality in subsamples |
| Men Caregiving ≥20 h/wk: aHR 0.87, 95% CI: 0.79–0.97 | ||
| Men Caregiving 1–19 h/wk: aHR 0.81, 95% CI: 0.75–0.89 | ||
| Women Caregiving ≥20 h/wk: aHR 0.80, 95% CI: 0.71–0.89 | ||
| Women Caregiving 1–19 h/wk: aHR 0.74, 95% CI: 0.66–0.83 | ||
| Brown, 2009 [24] | Mortality over 7 years | All-cause mortality |
| Caregiving ≥14 h/wk: aHR 0.64, 95% CI: 0.45–0.90 | ||
| Caregiving 1–14 h/wk: aHR 0.92, 95% CI: 0.69–1.24 |
| First Author, Publication Year [Reference] | Outcomes and Assessment Tools | Results: Informal Caregivers (IC) vs. Non-Caregivers (NC) (Numbers in Bold Were Reported to Be Stat. Significant Results) |
|---|---|---|
| Luckett, 2019 [25] | Quality of Life (SF-12, range 0 = worst, 100 = best) | Physical component summary (PCS): mean (SD): 49.1 (10.2) vs. 50.4 (10.0),p = 0.020 Mental component summary (MCS): mean (SD): 49.8 (9.8) vs. 51.1 (9.5),p = 0.020 |
| Roth, 2018 [17] | 1. Depressive Symptoms (CES-D, range 0 = best, 12 = worst, cut-off for depression ≥4) | 1. Depressive symptoms, mean (SD): 1.4 (2.3) vs. 1.0 (1.9),p < 0.001 |
| 2. Stress (Cohen’s Perceived Stress Scale 4-items, range 0 = best, 16 = worst) | 2. Perceived stress levels, mean (SD): 3.6 (3.1) vs. 3.2 (2.9),p < 0.001 | |
| 3. Hypertension (self reported) | 3. Hypertension: 57% vs. 58%, p = 0.467 | |
| 4. Diabetes (self-reported) | 4. Diabetes: 21% vs. 22%, p = 0.141 | |
| 5. Cardiovascular disease (self-reported) | 5. Cardiovascular diseases: 18.7% vs. 23.2%,p < 0.001 | |
| Trevino, 2018 [26] | Major depressive episode ([MDE] DSM-IV) Generalized anxiety disorder ([GAD] DSM-IV) | Odds ratio [OR], (95% confidence interval) Past MDE, n (%): 85 (16%) vs. 1607 (17%), OR: 0.9 (0.7–1.1), p = 0.348 Current MDE, n (%): 22 (4.1%) vs. 239 (2.6%), OR: 1.6 (1.0–2.5),p = 0.037 Current GAD, n (%): 21 (3.9%) vs. 125 (1.3%), OR: 3.0 (1.9–4.8),p < 0.001 Current Comorbid MDE and GAD, n (%): 6 (1.1%) vs. 42 (0.5%), OR: 2.5 (1.1–5.9),p = 0.038 IC without past MDE: OR: 7.7 (3.5–17.0),p < 0.001 IC with past MDE: OR: 1.1 (0.6–2.1), p = 0.662 Past MDE and NC: OR: 60.3 (38.0–95.6),p < 0.001 Past MDE and IC: OR: 8.9 (3.7–21.7),p < 0.001 |
| Hong, 2017 [27] | Self-reported diagnoses (depression, insomnia, hypertension, pain, diabetes) | Prevalences of self-reported diagnoses (after matching for age, sex, education etc.): Depression, % (n): 4.9 (192) vs. 3.5 (138),p < 0.001 Hypertension, % (n): 33.2 (1287) vs. 32.3 (1252), p = 0.39 Diabetes, % (n): 13.8 (535) vs. 13.2 (511), p = 0.42 Dyslipidaemia, % (n): 14.2 (551) vs. 13.7 (531), p = 0.51 Angina pectoris, % (n): 3.2 (126) vs. 2.9 (114), p = 0.43 Heart attack, % (n): 2.4 (95) vs. 2.0 (80), p = 0.25 Arthritis, % (n): 20.5 (794) vs. 19.8 (767), p = 0.44 Osteoporosis, % (n): 12.6 (490) vs. 11.8 (459), p = 0.28 Cataract, % (n): 16.7 (648) vs. 16.7 (648), p = 1.0 |
| Goren, 2016 [28] | 1. Depressive symptoms (PHQ-9, range 0 = best, 27 = worst, cut-off for depression ≥ 10) | 1. PHQ-9 mean [SD]: 4.4 [5.5] vs. 3.2 [4.8],p < 0.05 1. PHQ-9 ≥ 10 (MDD) % (n): 14.2 (185) vs. 8.9 (4801),p < 0.05 |
| 2. Self-reported diagnoses (depression, insomnia, hypertension, pain, diabetes) | 2. Depression: diagnosed % (n): 6.2 (81) vs. 3.3 (1778),p < 0.05 2. Insomnia: diagnosed % (n): 9.8 (128) vs. 4.4 (2361),p < 0.05 2. Anxiety: diagnosed % (n): 2.0 (26) vs. 0.8 (448),p < 0.05 2. Hypertension: diagnosed % (n): 17.5 (228) vs. 11.7 (6290),p < 0.05 2. Pain: diagnosed % (n): 15.5 (202) vs. 7.9 (4269),p < 0.05 2. Diabetes: diagnosed % (n): 6.1 (79) vs. 3.7 (1981), p < 0.05 | |
| 3. Quality of Life (SF-36v2: mental and physical component summary [MCS, PCS], range 0 = worst, 100 = best. SF-6D: range 0.29 = worst, 1 = best) | 3. PCS mean [SD]: 51.6 [6.6] vs. 53.6 [6.1],p < 0.05 3. MCS mean [SD]: 46.0 [10.7) vs. 48.0 [9.6],p < 0.05 3. SF-6D: mean [SD]: 0.7 [0.1] vs. 0.8 [0.1], p < 0.05 | |
| 4. Productivity impairment (WPAI) | 4. Absenteeism: % work missed mean [SD): 5.8 (15.8) vs. 2.9 (12.4),p < 0.05 4. Presenteeism: % impairment at work mean [SD): 22.8 (25.4) vs. 18.6 (23.2),p < 0.05 4. Overall work impairment in hours mean (SD): 25.7 (28.2) vs. 20.3 (25.2),p < 0.05 4. Activity impairment in hours mean (SD): 25.4 (25.8) vs. 20.7 (24.4), p < 0.05 | |
| 5. Self-reported healthcare resource utilization | 5. Emergency room visits (past 6 months) mean (SD): 0.3 (1.8) vs. 0.1 (0.9),p < 0.05 5. Hospitalizations, past 6 months mean (SD): 0.8 (5.2) vs. 0.5 (4.1),p < 0.05 5. Healthcare provider visits, past 6 months mean (SD):7.7 (18.5) vs. 4.4 (7.7), p < 0.05 | |
| Laks, 2016 [29] | 1.Depressive symptoms (PHQ-9, range 0 = best, 27 = worst, cut-off for depression ≥10) | 1. PHQ-9 mean (SD): 7.3 (7.0) vs. 5.5 (6.0),p < 0.05 1. PHQ-9 ≥ 10 (MDD) % (n): 28.7 (60) vs. 20.4 (2176),p < 0.05 |
| 2. Self-reported diagnose (depression, insomnia, hypertension, pain, diabetes) | 2. Depression: diagnosed (OR:2.0) % (n): 23.0 (48) vs. 10.9 (1157),p < 0.05 2. Insomnia: diagnosed (OR:1.6) % (n): 26.8 (56) vs. 15.4 (1635),p = 0.003 2. Anxiety: diagnosed (OR:1.7) % (n): 30.6 (64) vs. 17.6 (1878),p = 0.001 2. Hypertension: diagnosed (OR: 1.6) % (n): 23.4 (49) vs. 14.5 (1547),p = 0.009 2. Pain: diagnosed (OR:1.7) % (n): 31.1 (65) vs. 19.0 (2020),p = 0.001 2. Diabetes: diagnosed (OR:2.1) % (n): 12.0 (25) vs. 4.9 (526),p = 0.004 | |
| 3. Quality of Life (SF-36v2: mental and physical component summary [MCS, PCS], range 0 = worst, 100 = best. SF-6D, range 0.29 = worst, 1 = best) | 3. PCS mean (SD): 51.0 (7.8) vs. 52.2 (7.7),p < 0.05 3. MCS mean (SD): 44.8 (12.24) vs. 47.2 (11.14),p < 0.05 3. SF-6D mean (SD): 0.68 (0.139) vs. 0.72 (0.137),p < 0.05 | |
| 4. Productivity impairment (WPAI) | 4. Absenteeism: % work missed mean (SD): 10.1 (19.55) vs. 6.1 (16.88),p < 0.05 4. Presenteeism: % impairment mean (SD): 26.6 (31.60) vs. 16.8 (25.26),p < 0.05 4. Overall work impairment (hours) mean (SD): 30.8 (33.47) vs. 20.3 (28.66),p < 0.05 4. Activity impairment in hours mean (SD): 26.8 (29.85) vs. 20.9 (27.84),p < 0.05 | |
| 5. Self-reported healthcare resource utilization | 5. Emergency room visits, past 6 months mean (SD): 0.8 (1.93) vs. 0.5 (1.74),p < 0.05 5. Hospitalizations, past 6 months mean (SD): 0.4 (2.24) vs. 0.2 (0.94),p < 0.05 5. Healthcare provider visits, past 6 months mean (SD): 6.6 (8.30) vs. 4.6 (6.54), p < 0.05 | |
| Berglund, 2015 [30] | 1. Self-reported long-term illness (“Do you have any long-term illness, problems following an accident, any disability or other long-term health problem?”) | 1. Yes 42.9% vs. 36.4%,p ≤ 0.01 |
| 2. Self-rated health (“How do you rate your general state of health?”) | 2. Poor/very poor: 7.3% vs. 5.8%,p ≤ 0.01 2. Neither good nor poor: 27.3% vs. 22.5%,p ≤ 0.01 2. Good/very good: 65.5% vs. 71.7%,p ≤ 0.01 | |
| 3. Health-related quality of life (CDC HRQOL-4) | 3. Days with poor physical health (last 30 days) mean (SD): 7.3 (9.4) vs. 6.4 (9.4),p ≤ 0.01 3. Days with poor mental health (last 30 days) mean (SD): 6.3 (9.0) vs. 5.3 (8.3),p ≤ 0.01 3. Days without work capacity (last 30 days) mean (SD): 4.8 (8.9) vs. 4.1 (8.4),p ≤ 0.01 | |
| 4. Psychological wellbeing (GHQ-12: range 0 = best, 36 = worst, cut-off ≥ 12) | 4. GHQ12 MD mean (SD): 9.1 (5.3) vs. 8.9 (4.8),p ≤ 0.01 4. Good psychological wellbeing: 78.2% vs. 82.4%,p ≤ 0.01 4. Poor psychological wellbeing: 21.8% vs. 17.6 %, p ≤ 0.01 | |
| Gupta, 2015 [31] | 1. Quality of Life (SF-36v2: MCS, PCS: range 0 = worst, 100 = best. SF-6D: range 0.29 = worst, 1 = best) | 1. MCS mean (SD): 40.3 (10.8) vs. 45.9 (10.9),p < 0.001 1. PCS mean (SD): 46.8 (10.2) vs. 49.0 (9.8),p < 0.001 1. SF-6D mean (SD): 0.6 (0.1) vs. 0.7 (0.1),p < 0.001 |
| 2. Depressive Symptoms (PHQ-9: 0–4 = minimal, 5–9 = mild, 10–14 = moderate, 15–19 = moderately severe, 20–27 = severe) | 2. Minimal (%): 19.9 vs. 38.6,p < 0.001 2. Mild (%): 21.1 vs. 17.2,p < 0.001 2. Moderate (%): 11.8 vs. 7.4,p < 0.001 2. Moderately severe (%):6.5 vs. 3.8,p < 0.001 2. Severe (%): 6.5 vs. 1.6, p < 0.001 | |
| 3. Self-reported current medication use for depression | 3. Medication use (%): 17.6 vs. 8.2, p < 0.001 | |
| 4. Self-reported comorbidities (“Have you experienced the following in the past twelve months”) | 4. Narcolepsy (%): 1.2 vs. 0.5, p = 0.072 4. Insomnia (%): 32.4 vs. 18.5, p < 0.001 4. Sleep difficulties (%): 42.7 vs. 28.5, p < 0.001 4. Pain (%): 39.7 vs. 30.4, p = 0.001 4. Anxiety (%):37.9 vs. 23.6, p < 0.001 4. Depression (%): 29.4 vs. 19.4, p < 0.001 4. Heartburn (%): 31.7 vs. 22.9, p = 0.001 4. Migraines (%): 26.6 vs. 22.4, p = 0.102 4. Headaches (%):48.0 vs. 42.0, p = 0.048 | |
| Rosso, 2015 [20] | 1. Self-reported diagnosis (chronic disorders) | High- (≥3 x/wk) vs. Low-Frequency IC (≤2 x/wk) vs. NC: 1. Diabetes % (n): 7.0 (53) vs. 2.5 (35) vs. 6.9 (241), p < 0.001 (comparing high vs. low/NC) 1. Asthma % (n): 11.0 (82) vs. 5.4 (73) vs. 6.7 (231), p < 0.001 (comparing high vs. low/NC) 1. Osteoporosis, % (n): 7.8 (58) vs. 7.0 (95) vs. 10.3 (353), p < 0.001 (comparing high vs. low/NC) |
| 2. BMI (calculated by measured height and weight, >29.9 = obese) | 2. Obese % (n):40.4 (303) vs. 28.9 (395) vs. 27.5 (957), p < 0.001 (comparing high vs. low/NC) | |
| Tuithof, 2015 [32] | 1. Self-reported chronic physical disorders (standard checklist assessed presence of 17 chronic physical disorders) | 1. 45.5% vs. 37.1%, OR: 1.09, 95% CI: 0.93–1.28 |
| 2. Emotional Disorder (12-month prevalence) (DSM-IV) | 2. 7.5% vs. 8.8%, OR: 0.86, 95% CI: 0.66–1.11, p = 0.15 When informal caregiving was defined more strictly: caregiving for >8 h/wk: OR = 0.92, 95% CI: 0.64–1.31 longer than 1 year: OR = 1.22, 95% CI: 0.92–1.63 caregiving for >8 h/wk and longer than 1 year: OR = 1.17, 95% CI: 0.73–1.87 | |
| Verbakel, 2014 [33] | Subjective well-being (self-reported happiness on a scale from 0 to 10) | Unadjusted mean (SD): 7.69 (1.71) vs. 7.66 (1.77), not statistically significant. IC had on average a slightly lower level of well-being compared to NC (−0.11, SD 0.16) that was stat. sign. after adjusting for age, sex, educational level, partner, children, co-residing parents aged 65+ and religiosity. This Well-being-difference varied across countries: in most European countries, IC reported lower levels of well-being than NC did, whereas in Scandinavia they were slightly higher in IC vs. NC. Resources of formal long-term care reduced this gap, services directed at psychosocial support, facilitating the combination of work and care and financial support did not reduce negative effects of informal caregiving. |
| Chan, 2013 [34] | 1. Depressive symptoms (CES-D-11, range 0 = best, 19 = worst, cut-off for depression ≥ 7) | 1. CES-D, mean (SD): 3.8 (3.2) vs. 2.9 (2.6),p < 0.0001 1. Clinically significant depressive symptoms (CESD ≥ 7): 18.2% vs. 7.9%, p < 0.0001 OR: 2.36, 95% CI: 1.44–3.86 |
| 2. Self-rated health (“In general would you say your health is—excellent/very good/good/fair/poor?”) | 2. Poor: 3.0%, fair: 21.5%, good: 57.5 %, very good: 14.7%, excellent: 3.4% vs poor: 1.3%, fair: 15.1%, good: 64.2%, very good: 17.0 %, excellent: 2.5%, p = 0.02 IC were significantly more likely to have poorer SRH OR: 2.45, 95% CI: 1.84–3.26 | |
| 3. Outpatient visits (assessed by asking if they had seen a doctor in a clinic in the last month and the number of visits) | 3. No outpatient visits in the last month: 62.9% vs. 58.5%, p = 0.15 3. Mean number (SD) of outpatient visits (last month): 1.2 (0.8) vs. 1.2 (0.5), p = 0.42 | |
| Herrera, 2013 [35] | Depressive symptoms (CES-D, range 0 = best, 60 = worst, cut-off for depression ≥ 16) | Depressive symptoms: CES-D, mean (SD): 8.0 (0.87) vs. 8.3 (0.22) CES-D ≥ 16: 14.1% vs. not reported |
| Ramsay, 2013 [23] | Limiting long-term illness (self-reported health problems or disability including problems that are due to age) | Limiting long-term illness: heavy caregiver (≥20 h/week): 32.1% light caregiver (1–19 h/week): 19.0% non-caregiver: 18.9% |
| Hernandez, 2010 [36] | 1. Depressive symptoms (CES-D, range 0= best, 60= worst, cut-off for depression ≥ 16) | 1. CES-D, mean (SD): 10.32 (10.60) vs. 6.13 (6.77), p = 0.014 1. CES-D ≥16: 24% vs. 7%, p = 0.004 |
| 2. Self-reported health (“How would you rate your overall health? 1 (excellent) to 4 (poor)”) | 2. Mean (SD): 2.68 (0.76) vs. 2.70 (0.75) | |
| Butterworth, 2010 [37] | 1. Anxiety and Depression (Goldberg anxiety and depression scale) | 1. Anxiety, clinically significant: 25.9% vs. 17.5%, p = 0.003 OR: 1.57, 95% CI: 1.11–2.20 1. Depression, clinically significant: 50.5% vs. 39.3%, p = 0.002 OR: 1.52, 95% CI: 1.15–2.03 |
| 2. Physical impairment (range 0 = worst, 100 = best) | 2. SF-12 RAND scoring method with scores < 40: 23.3% vs. 17.5%, p = 0.038 |
Publisher’s Note: MDPI stays neutral with regard to jurisdictional claims in published maps and institutional affiliations. |
© 2022 by the authors. Licensee MDPI, Basel, Switzerland. This article is an open access article distributed under the terms and conditions of the Creative Commons Attribution (CC BY) license (https://creativecommons.org/licenses/by/4.0/).
Share and Cite
Janson, P.; Willeke, K.; Zaibert, L.; Budnick, A.; Berghöfer, A.; Kittel-Schneider, S.; Heuschmann, P.U.; Zapf, A.; Wildner, M.; Stupp, C.; et al. Mortality, Morbidity and Health-Related Outcomes in Informal Caregivers Compared to Non-Caregivers: A Systematic Review. Int. J. Environ. Res. Public Health 2022, 19, 5864. https://doi.org/10.3390/ijerph19105864
Janson P, Willeke K, Zaibert L, Budnick A, Berghöfer A, Kittel-Schneider S, Heuschmann PU, Zapf A, Wildner M, Stupp C, et al. Mortality, Morbidity and Health-Related Outcomes in Informal Caregivers Compared to Non-Caregivers: A Systematic Review. International Journal of Environmental Research and Public Health. 2022; 19(10):5864. https://doi.org/10.3390/ijerph19105864
Chicago/Turabian StyleJanson, Patrick, Kristina Willeke, Lisa Zaibert, Andrea Budnick, Anne Berghöfer, Sarah Kittel-Schneider, Peter U. Heuschmann, Andreas Zapf, Manfred Wildner, Carolin Stupp, and et al. 2022. "Mortality, Morbidity and Health-Related Outcomes in Informal Caregivers Compared to Non-Caregivers: A Systematic Review" International Journal of Environmental Research and Public Health 19, no. 10: 5864. https://doi.org/10.3390/ijerph19105864