
The Long-Term Effect of Preterm Birth on Renal Function: A Meta-Analysis


Abstract
:1. Introduction
2. Materials and Methods
2.1. Literature Search and Study Selection
2.2. Inclusion and Exclusion Criteria
2.3. Data Extraction and Outcomes
2.4. Quality Assessment
2.5. Statistical Analysis and Evaluation of Heterogeneity and Publication Bias
3. Results
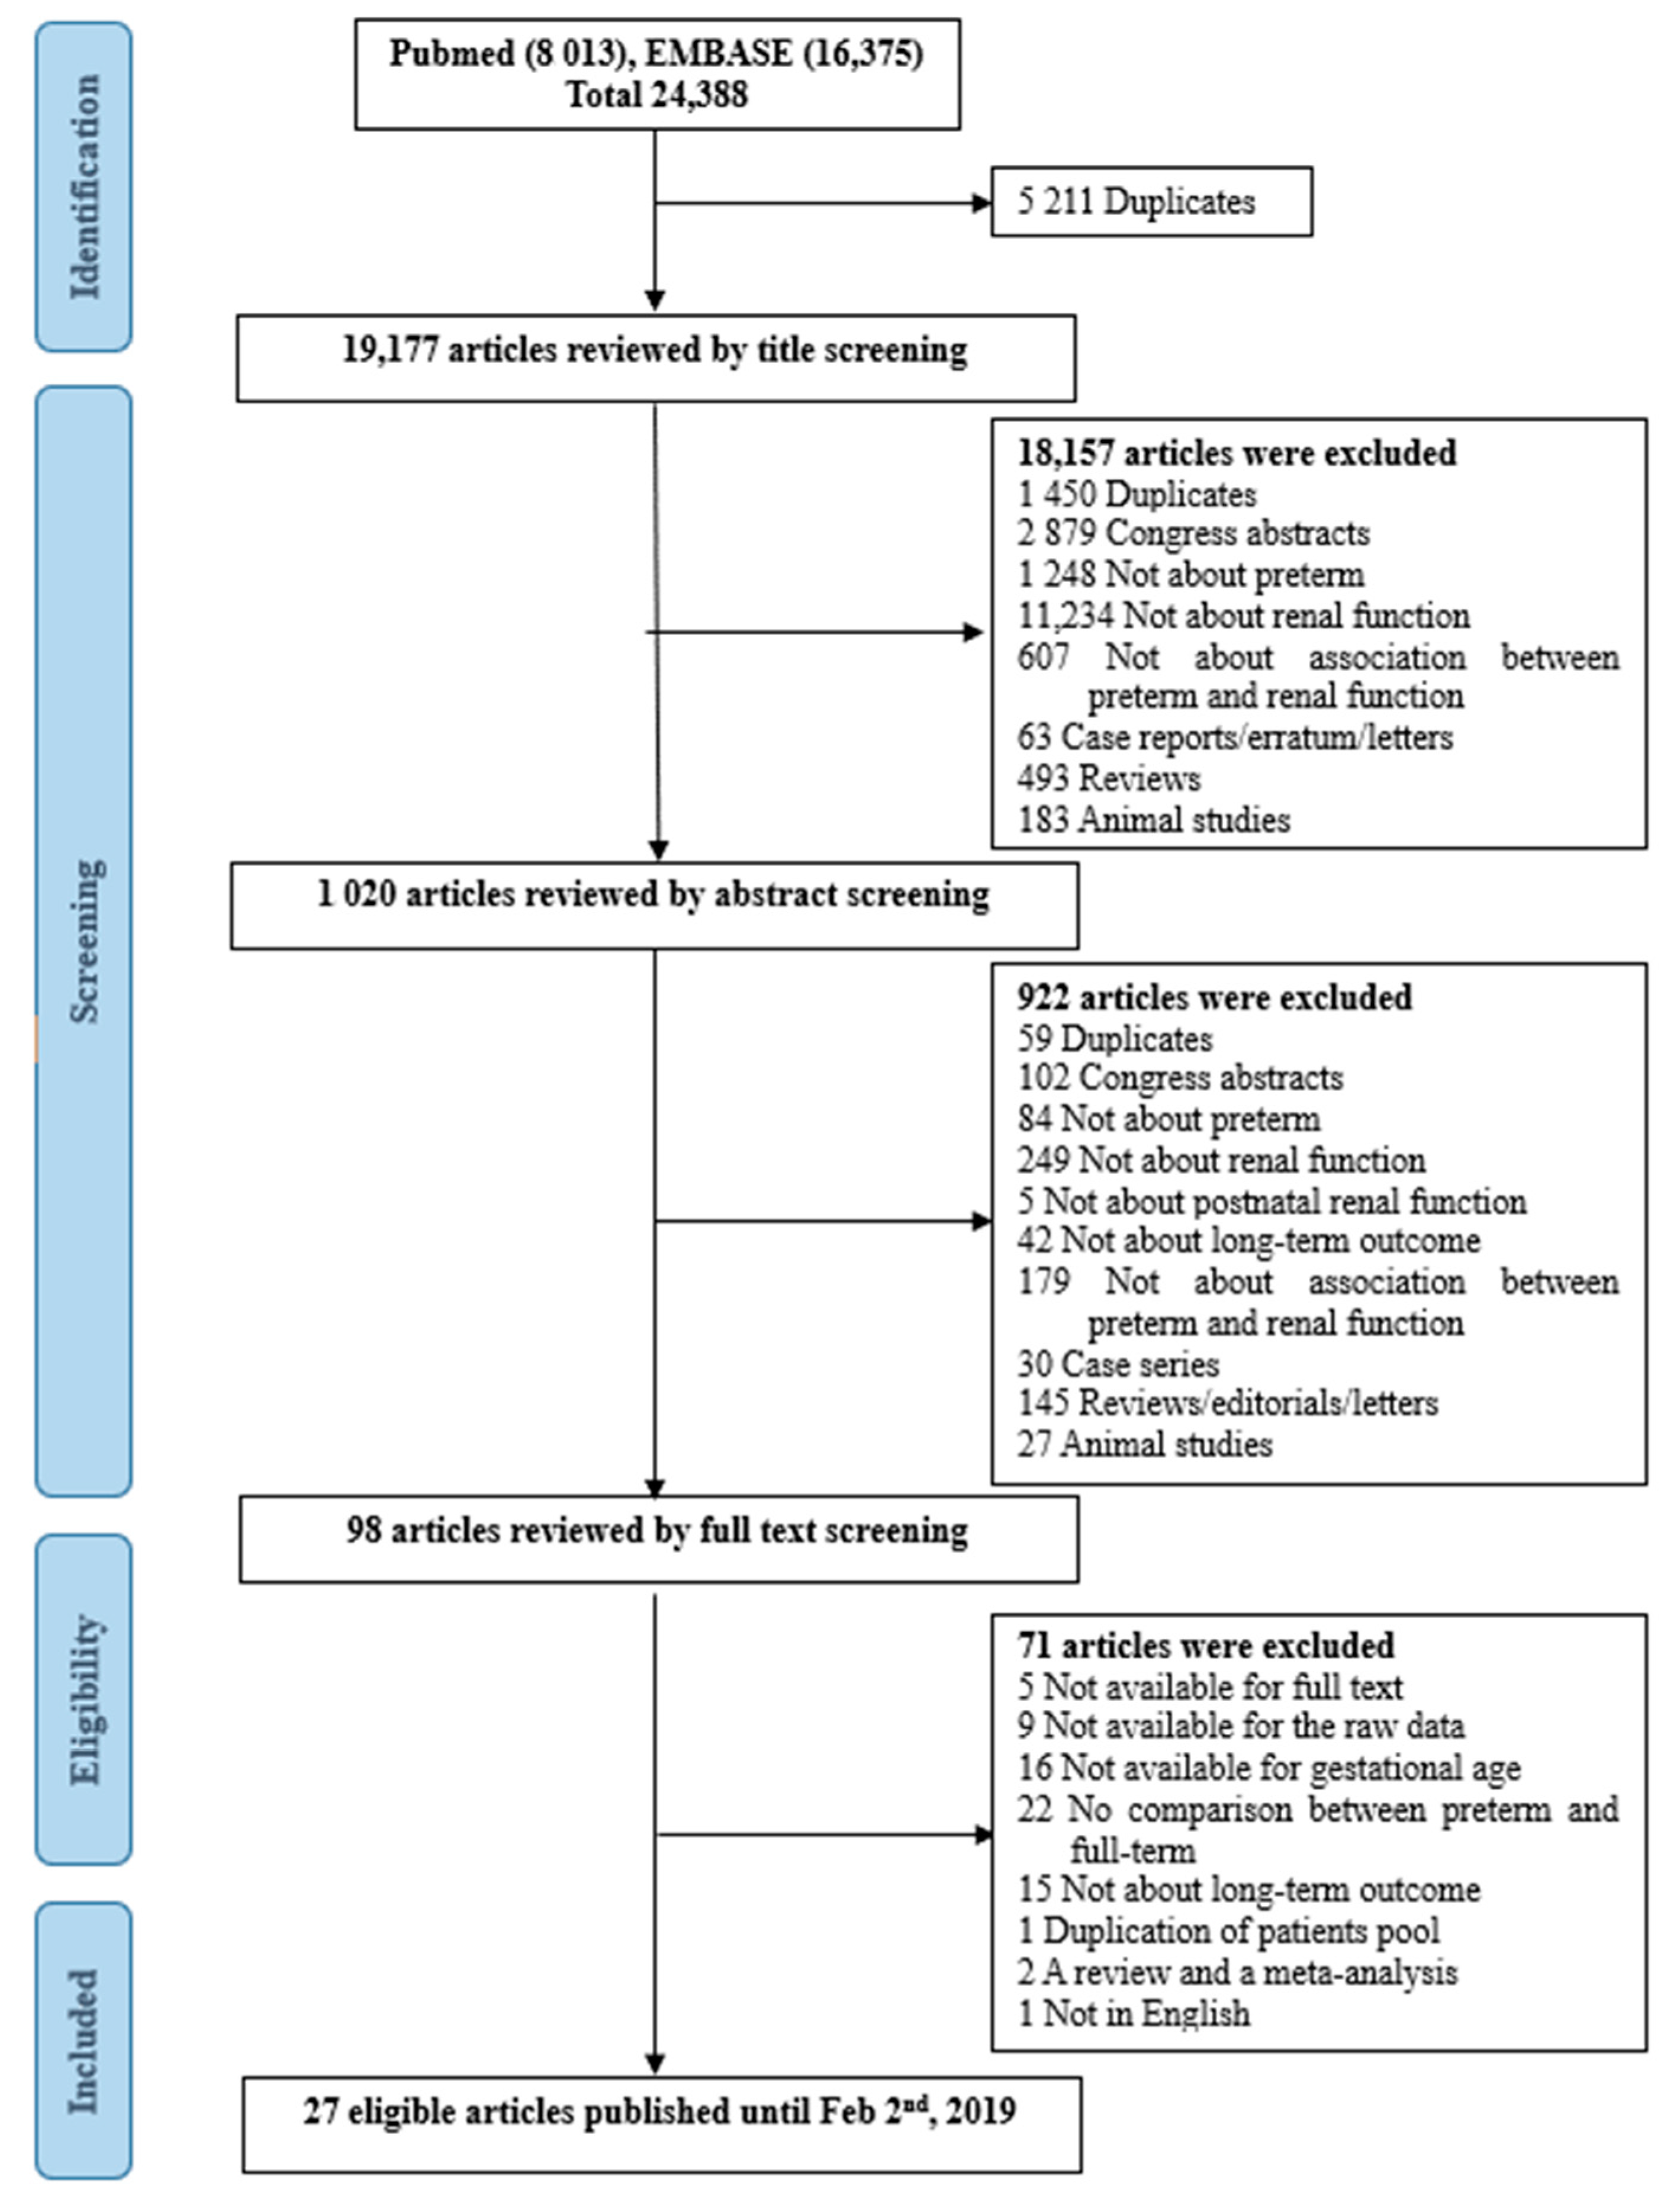
3.1. Study Selection, Qualitiative and Quantitative Analysis
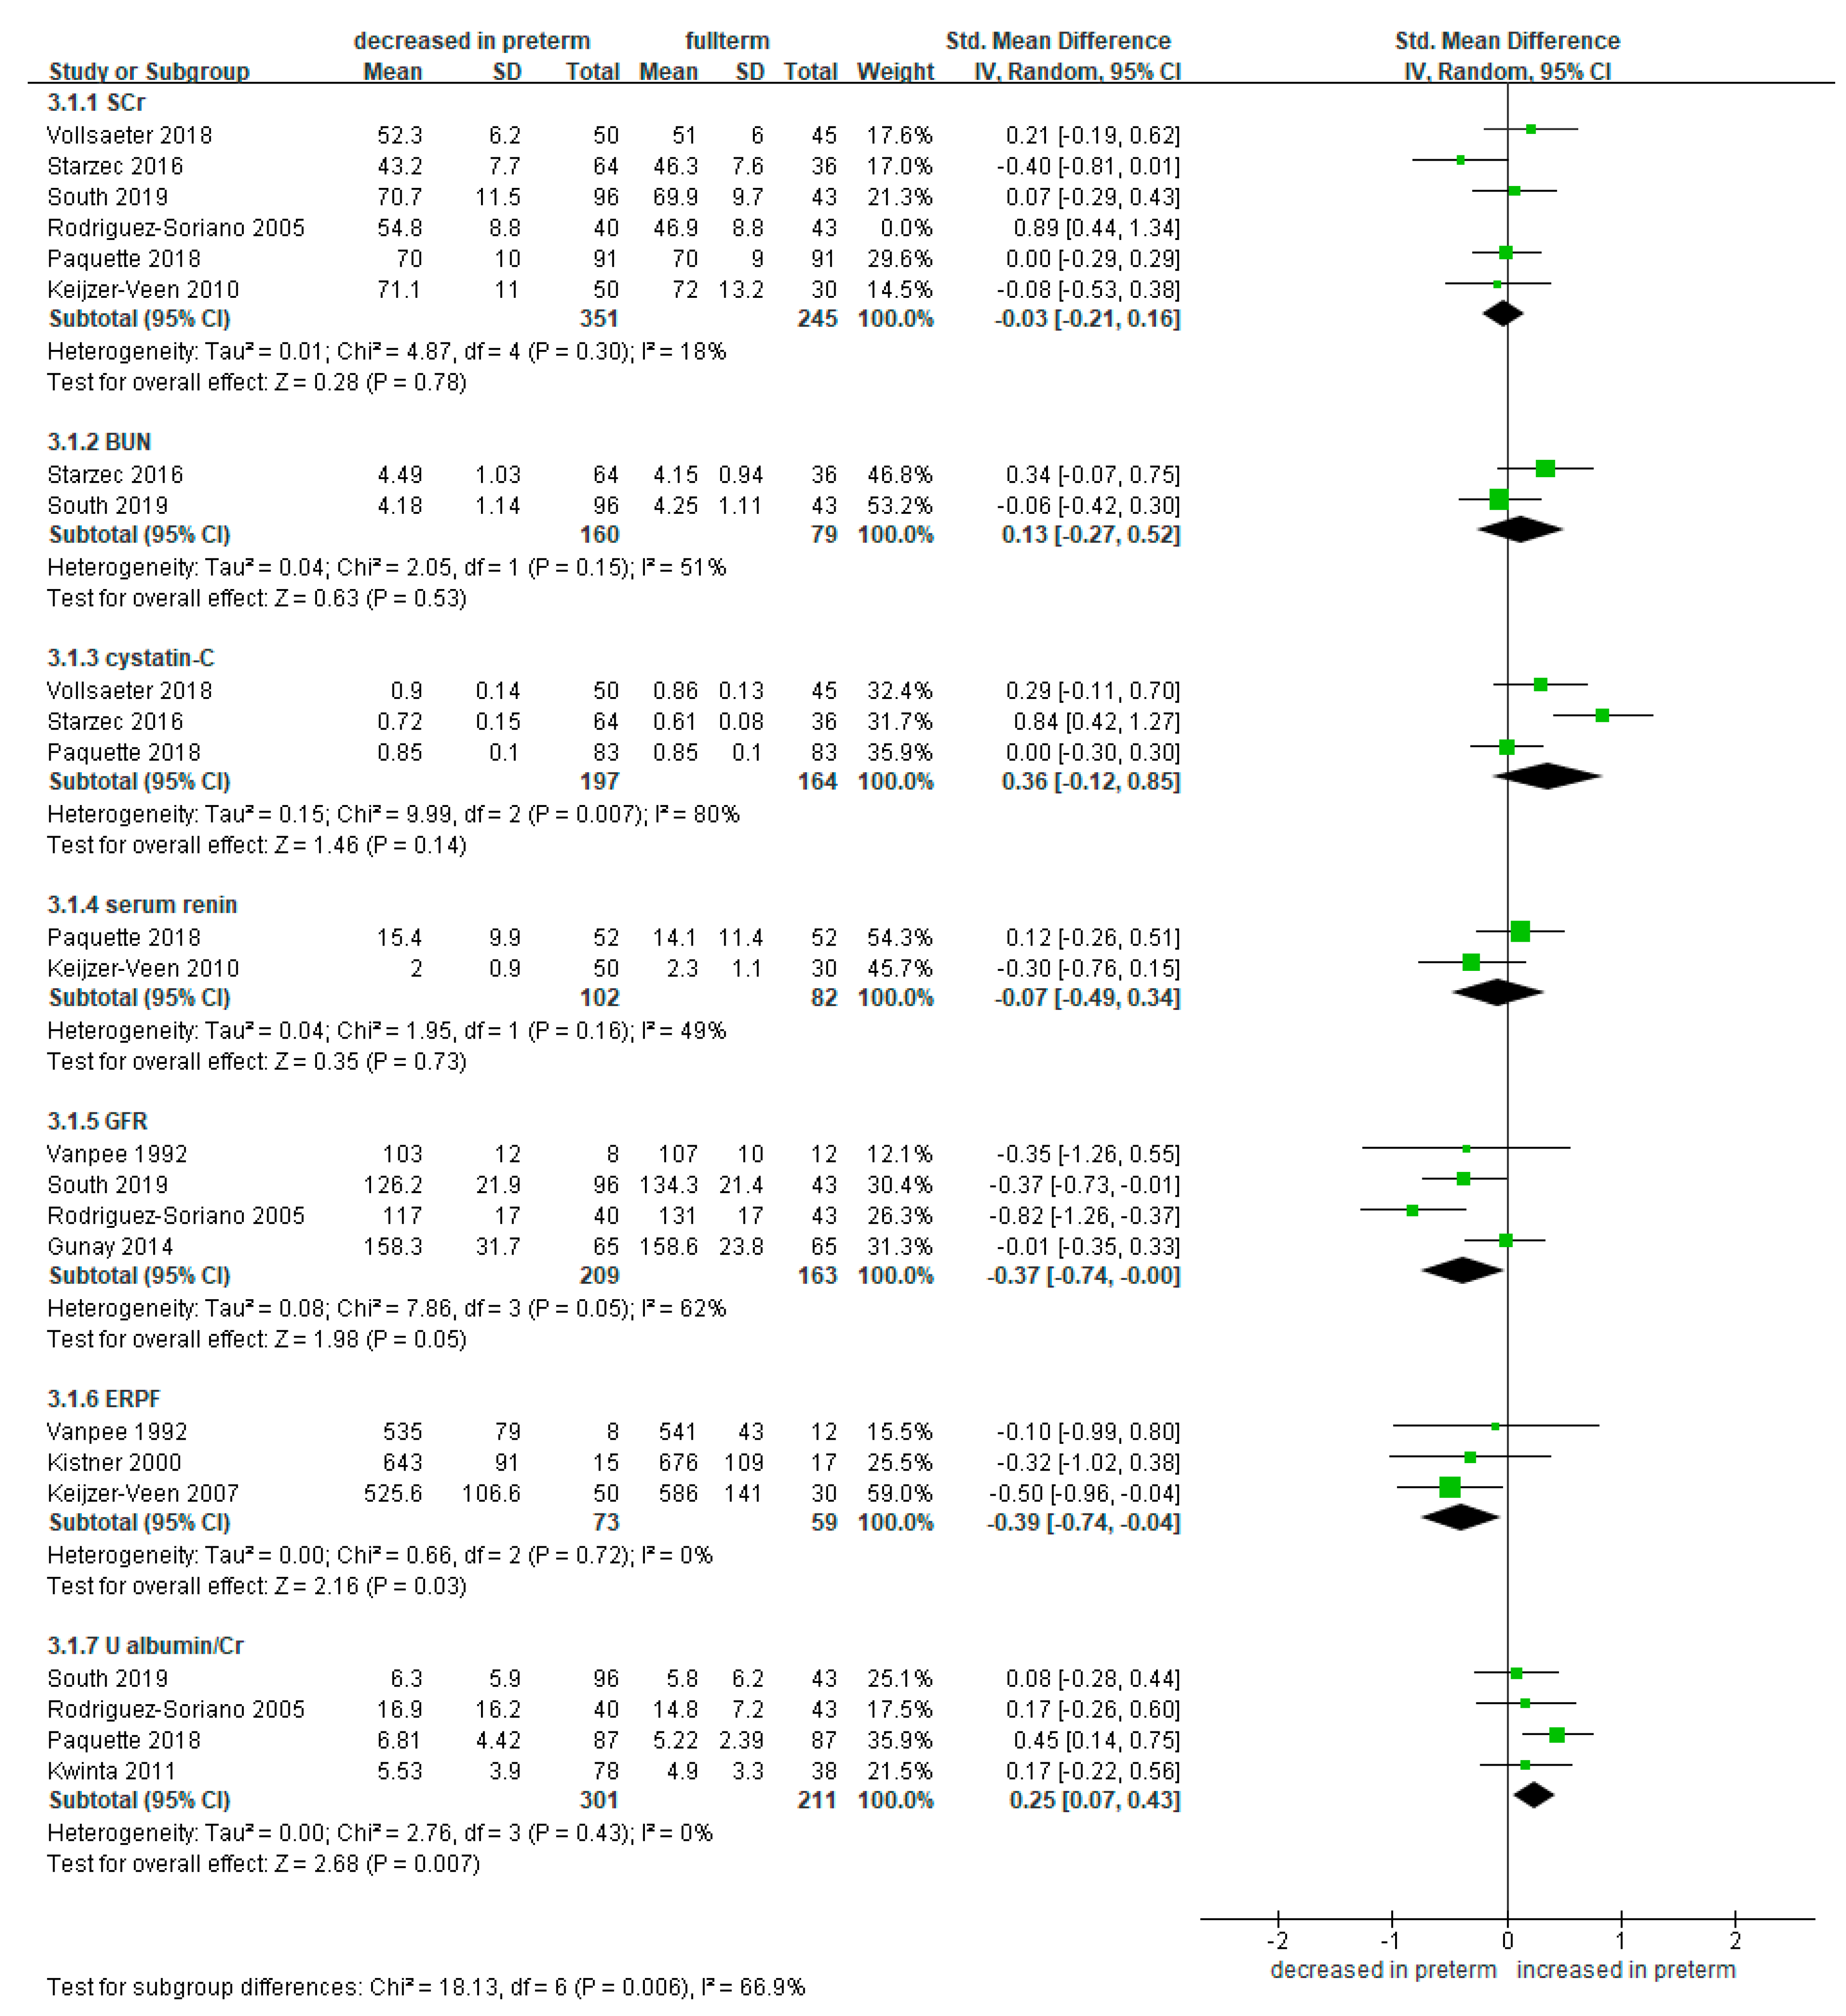
3.2. Meta-Analysis of Renal Function-Related Markers in Preterm Infants Compared to Full-Term Controls
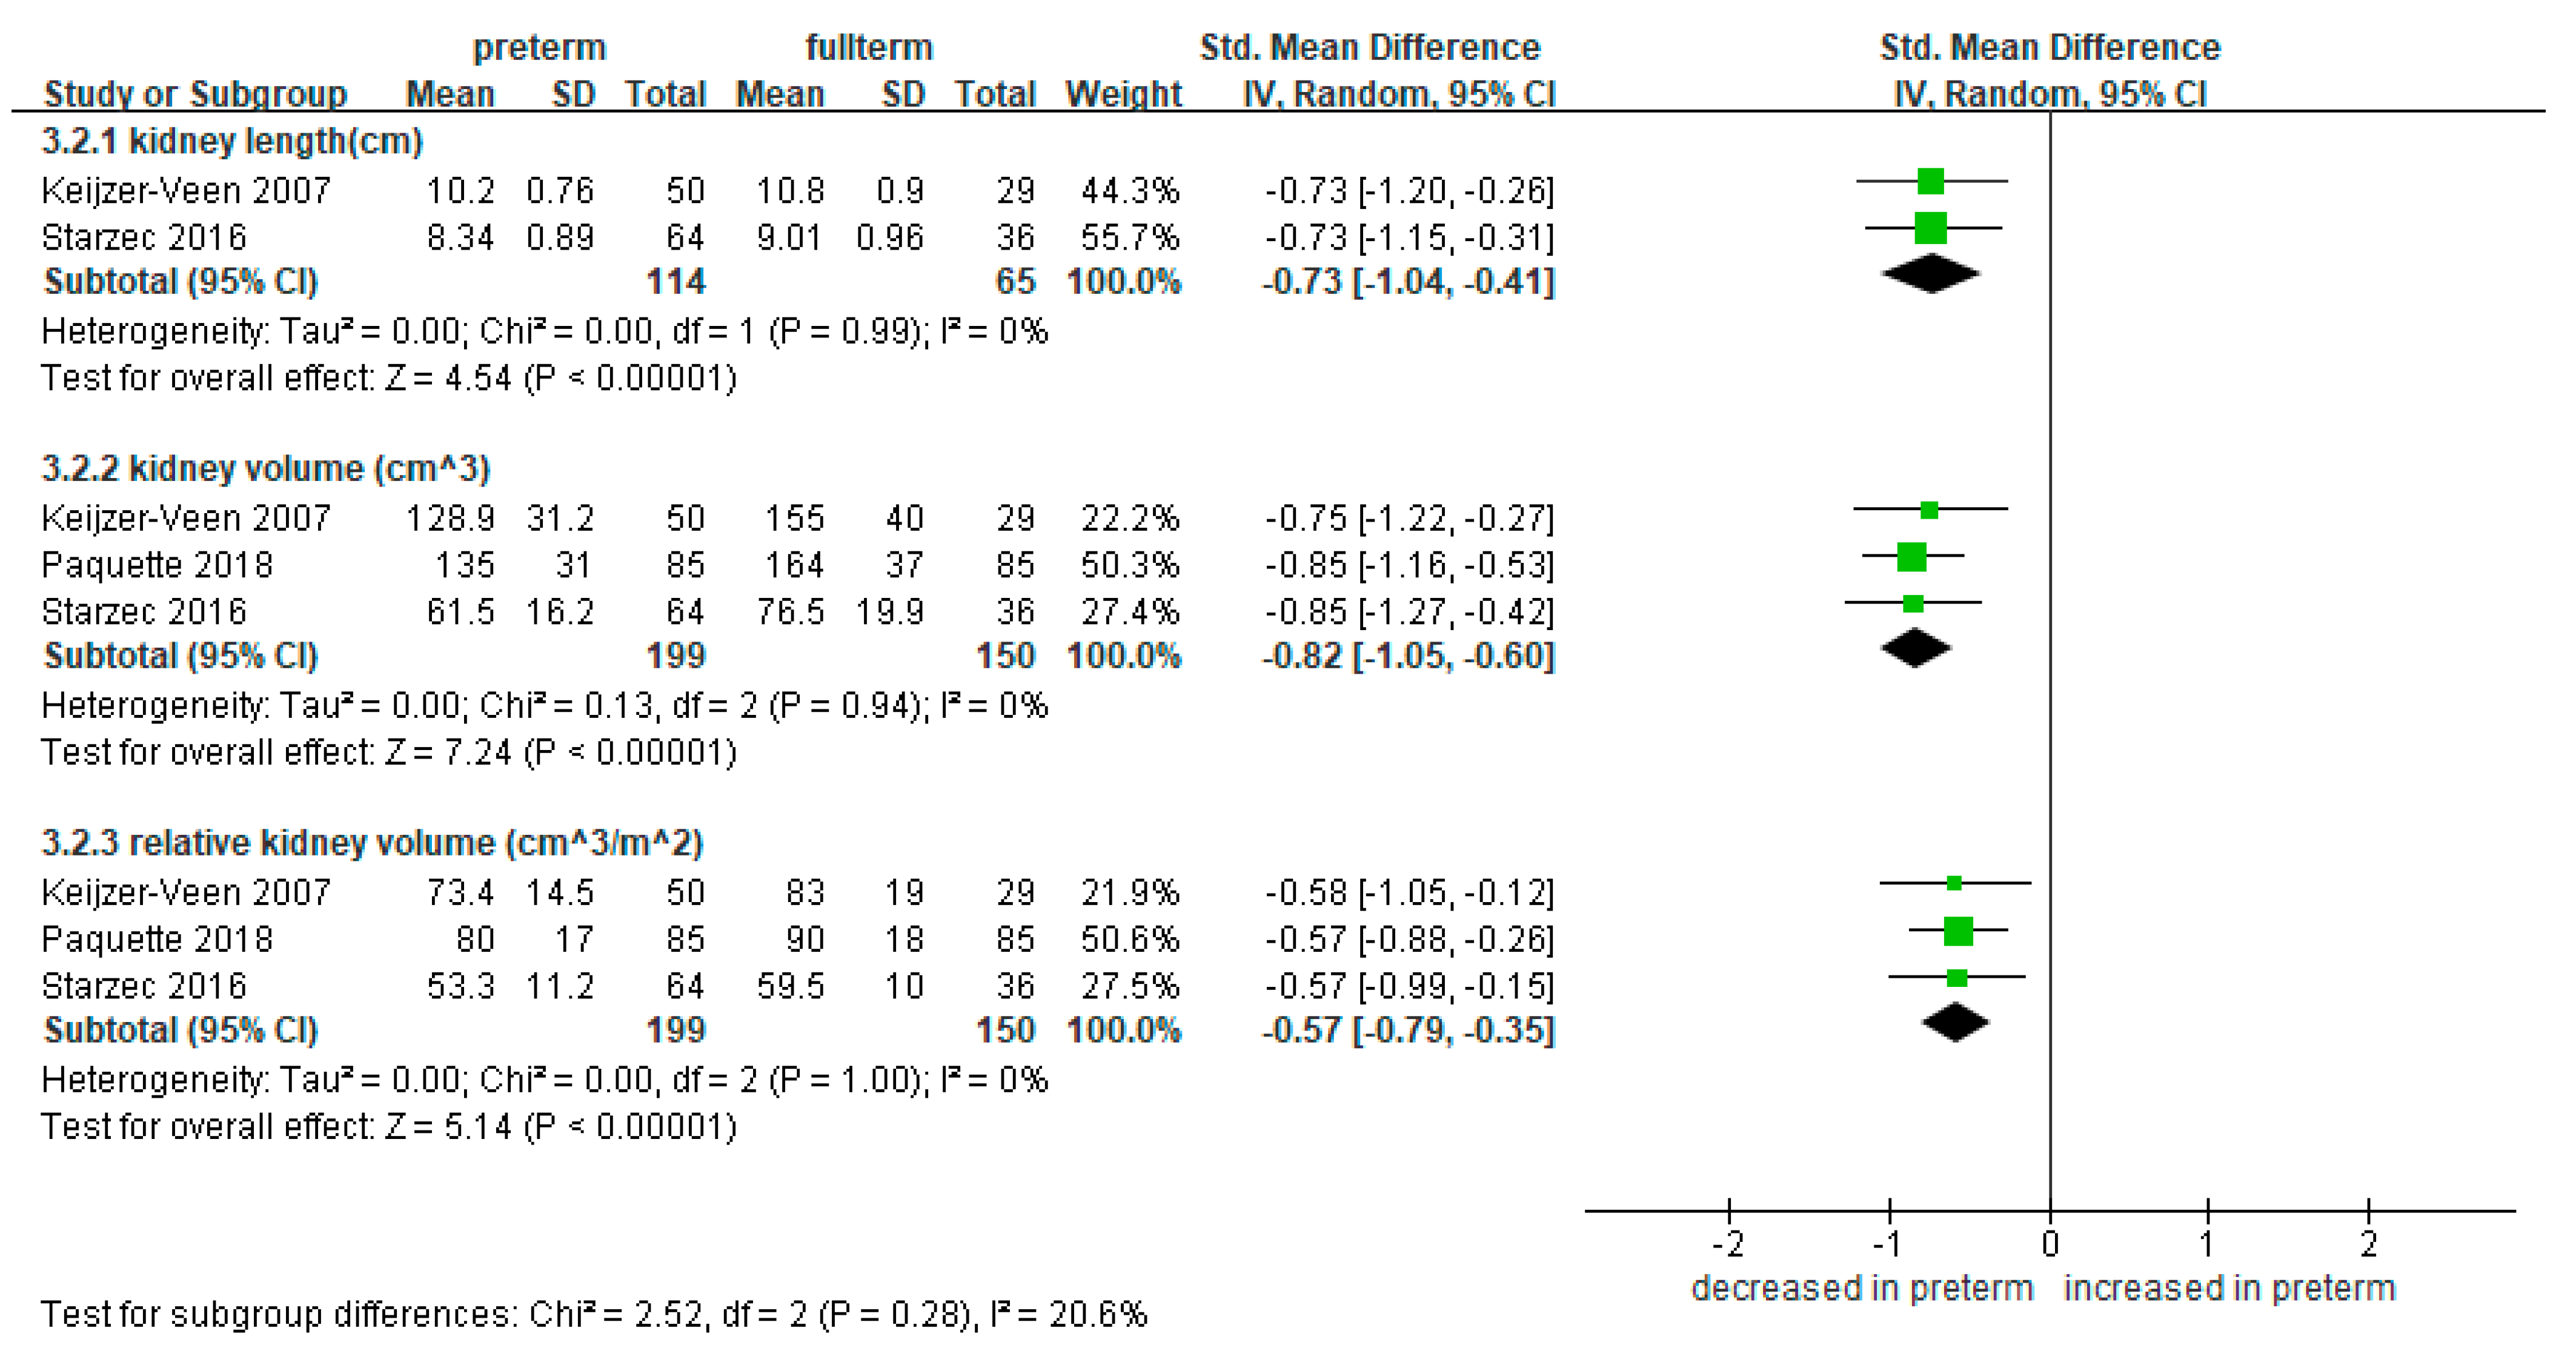
3.3. Meta-Analysis of Kidney Length and Volume in Preterm Infants Compared to Full-Term Controls
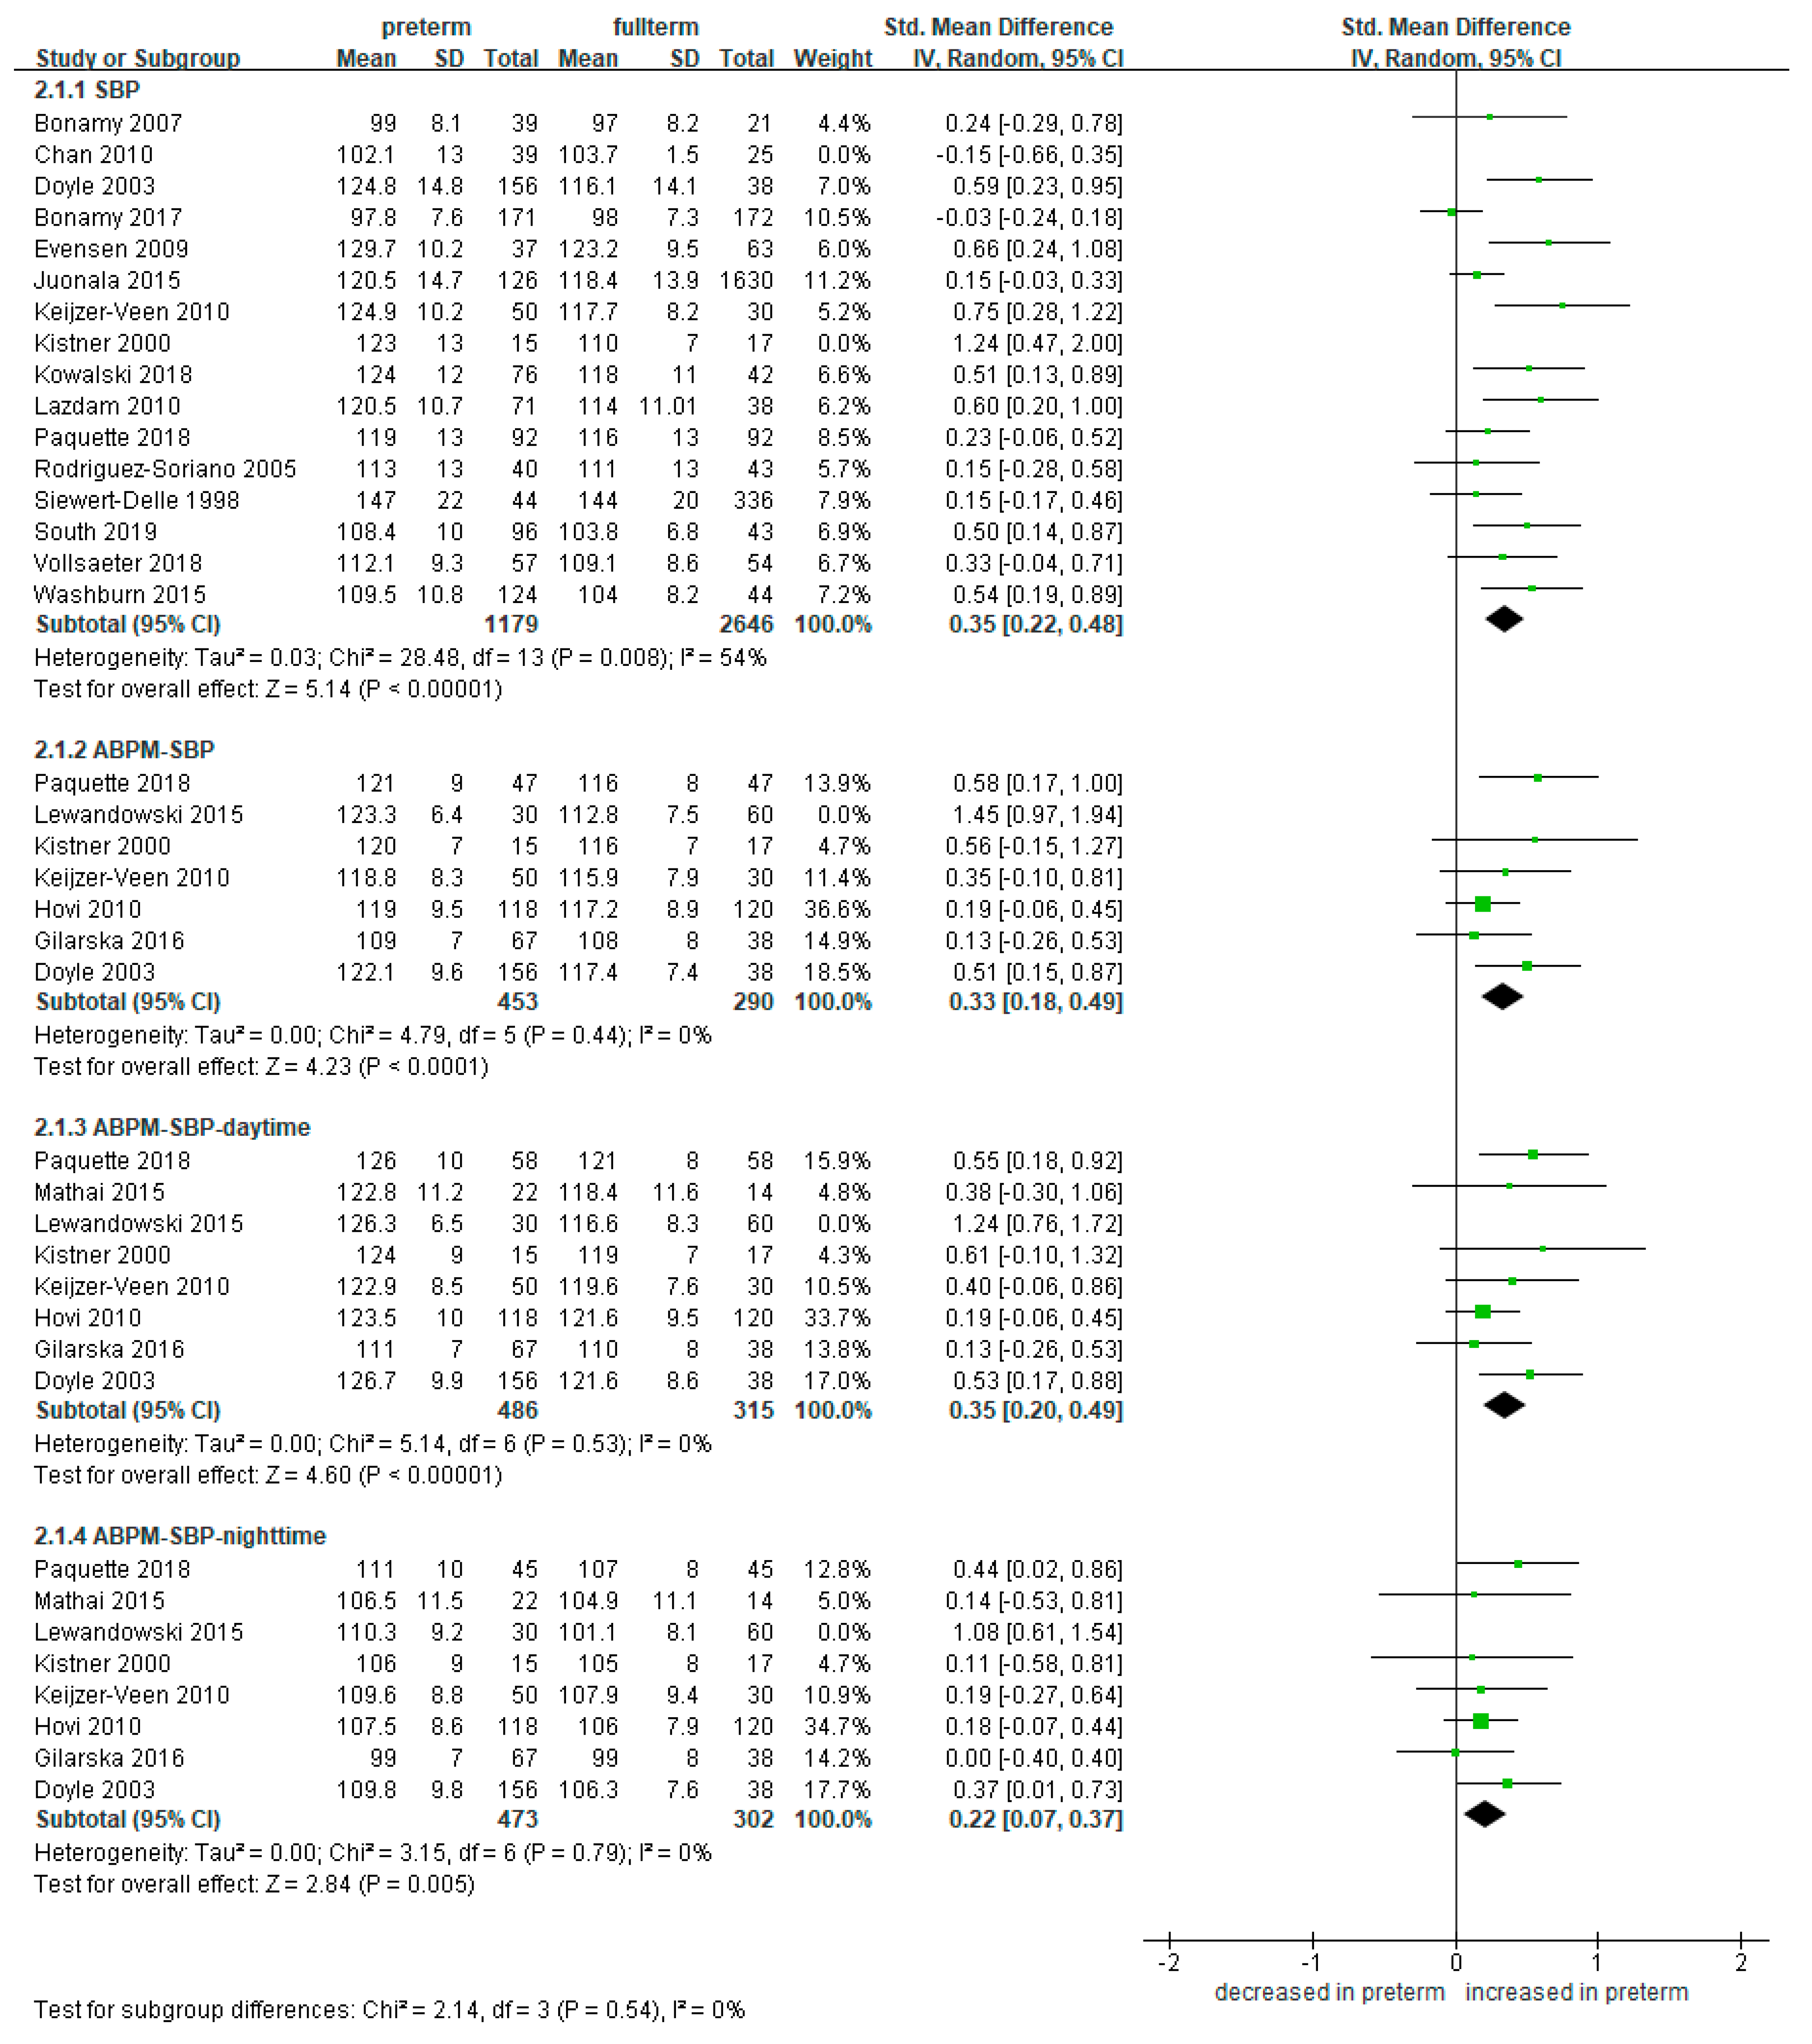
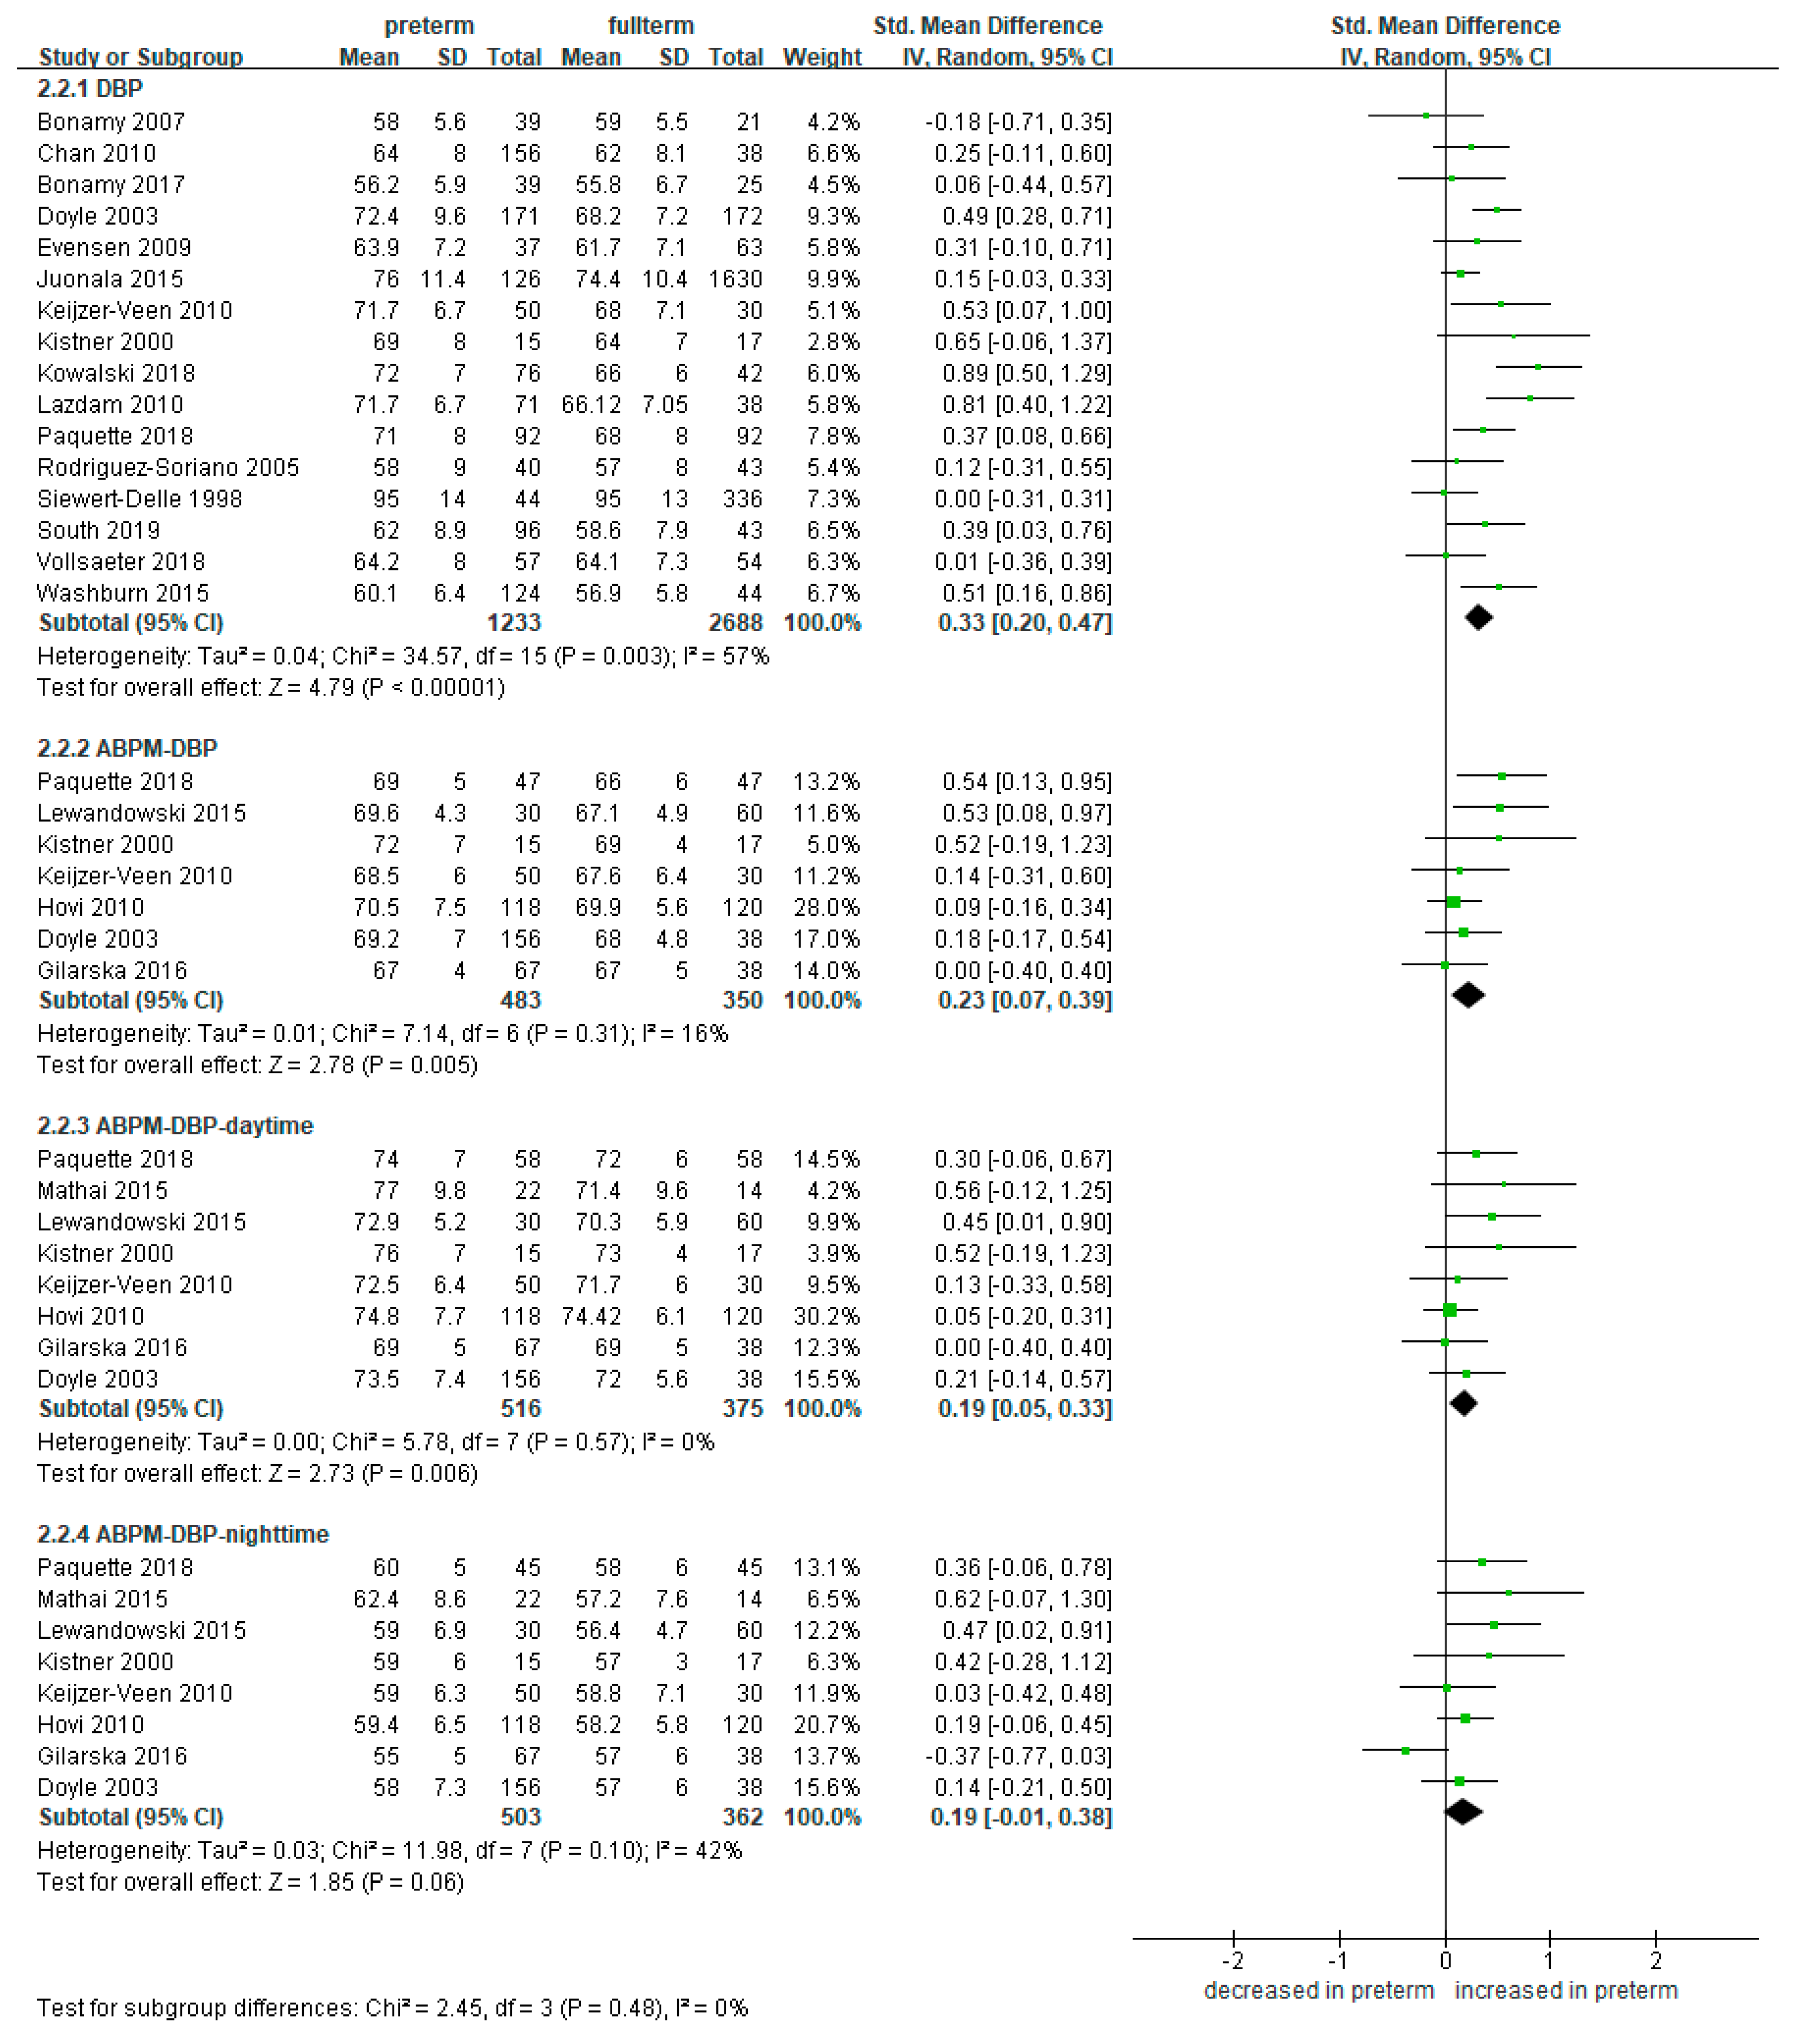
3.4. Meta-Analysis of Blood Pressure in Preterm Infants Compared to Full-Term Controls
3.5. Subgroup Analysis According to SGA and AGA
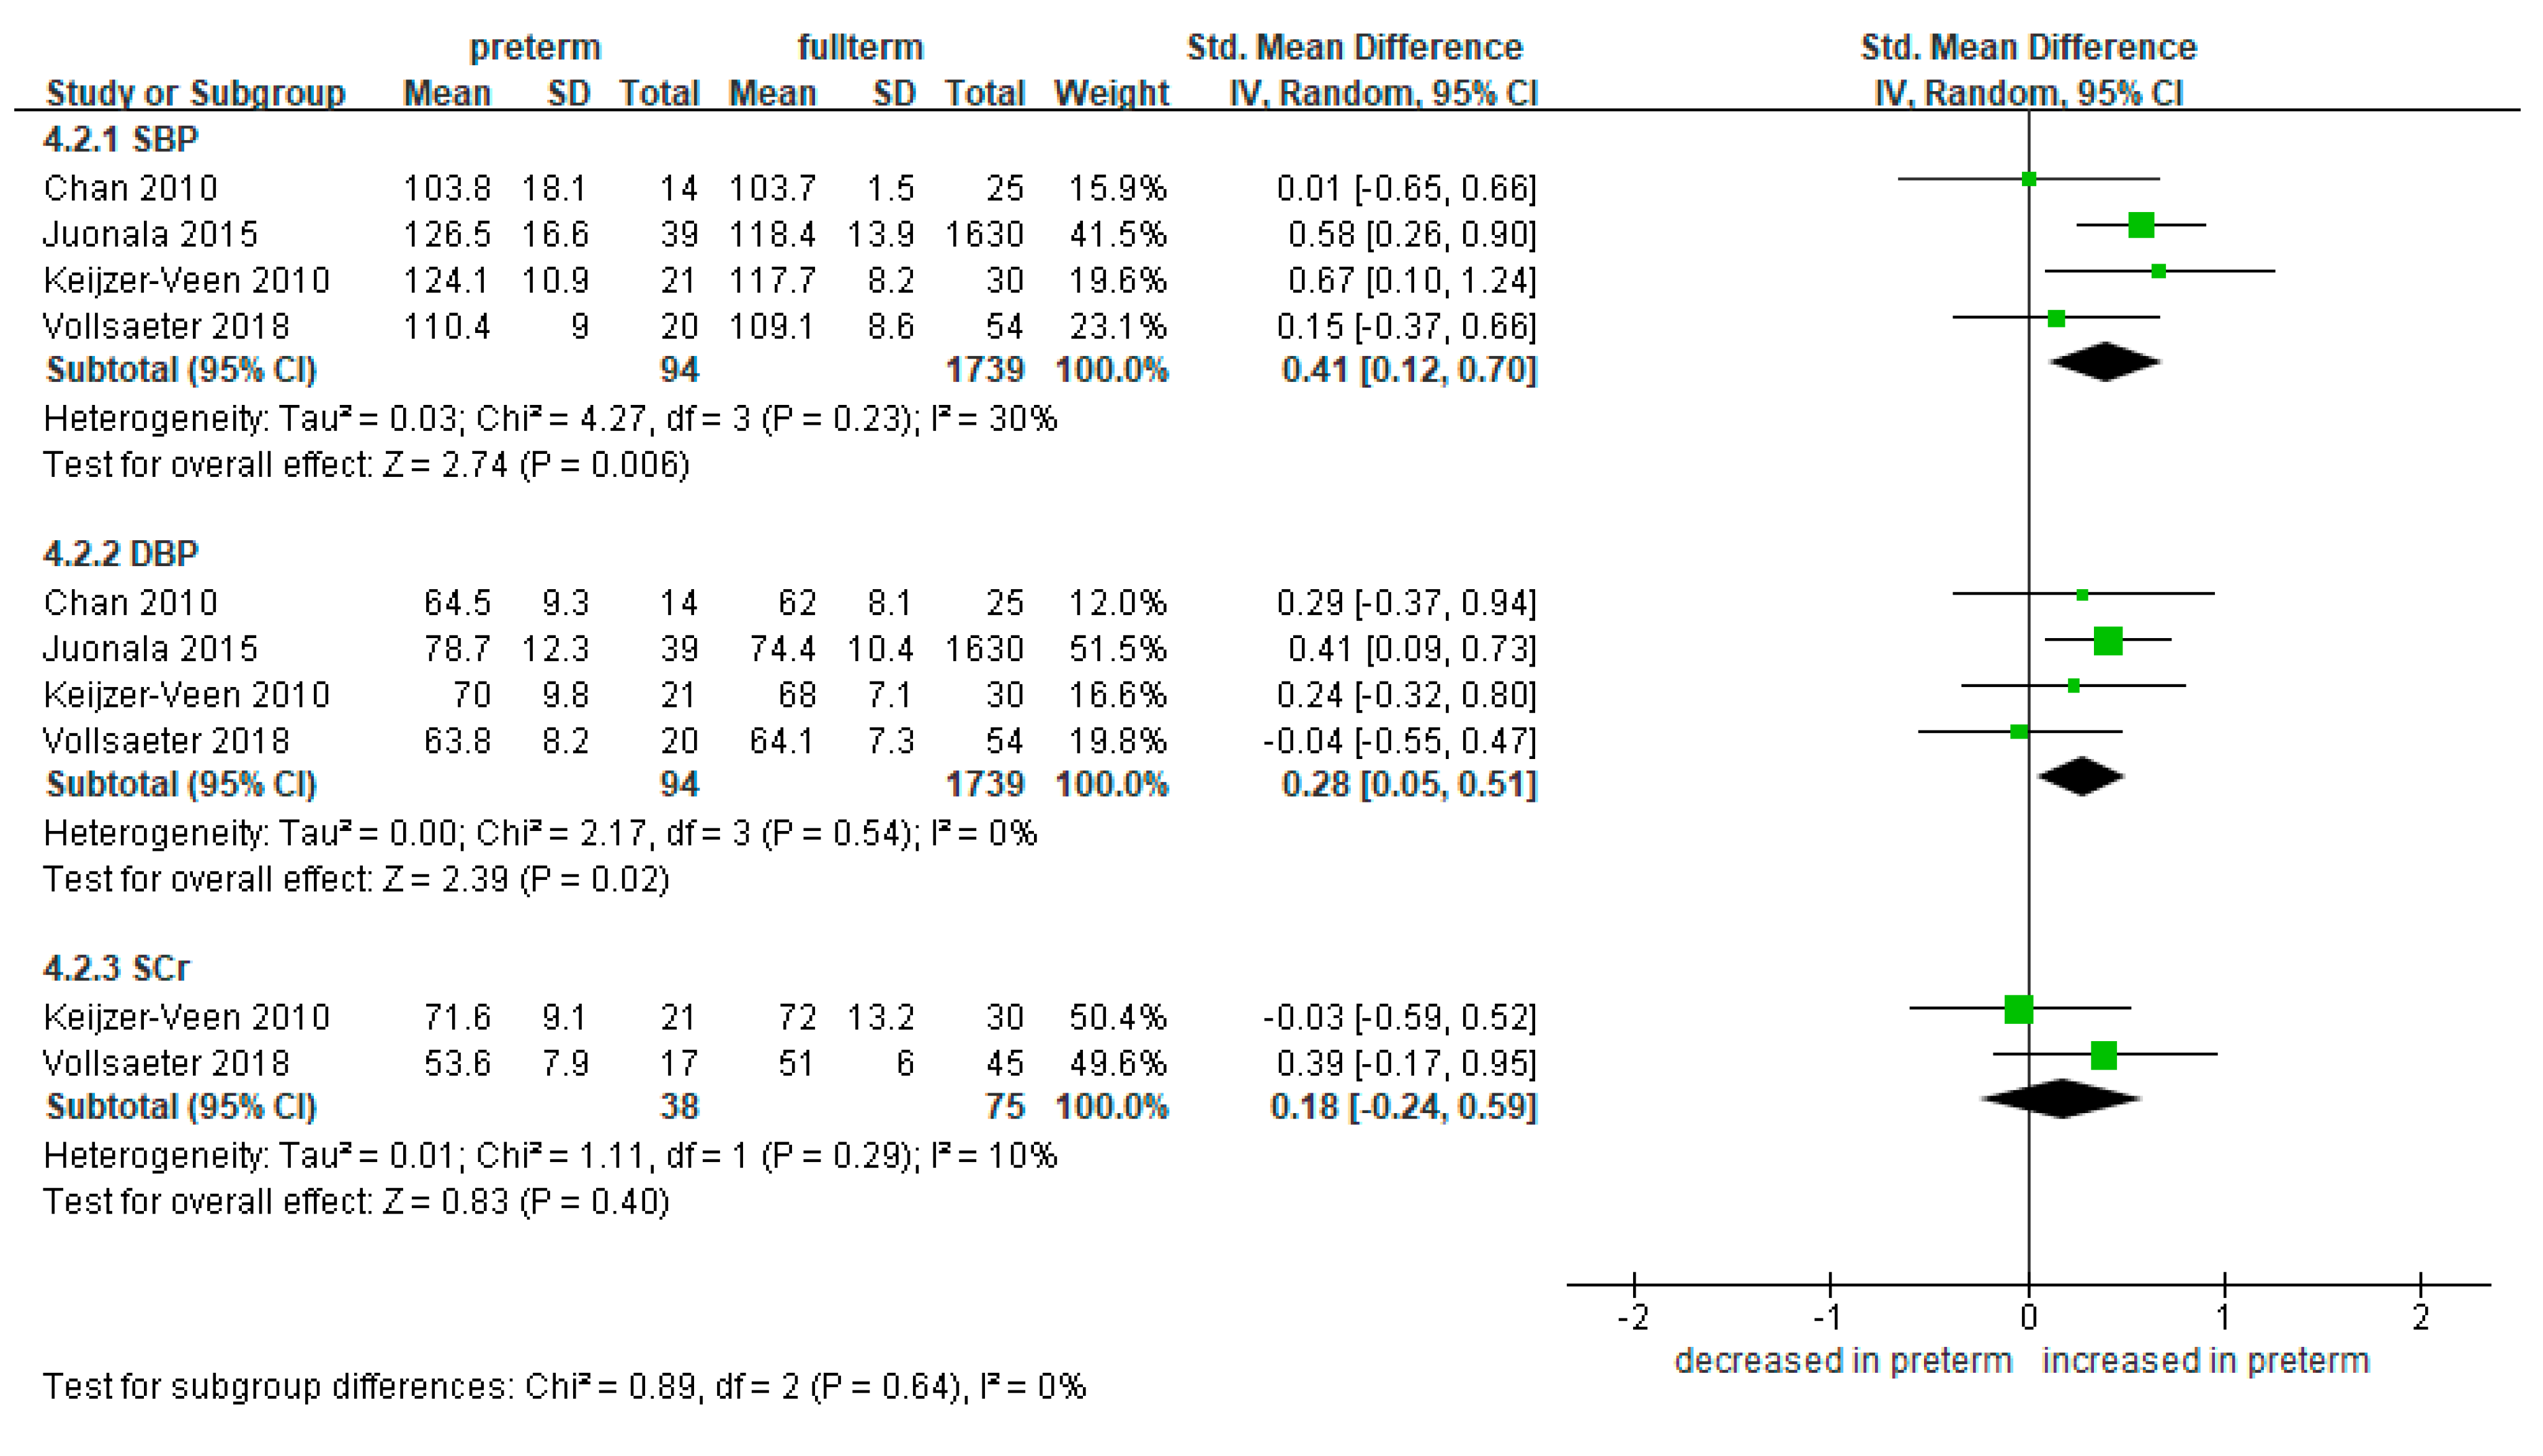
3.5.1. SGA
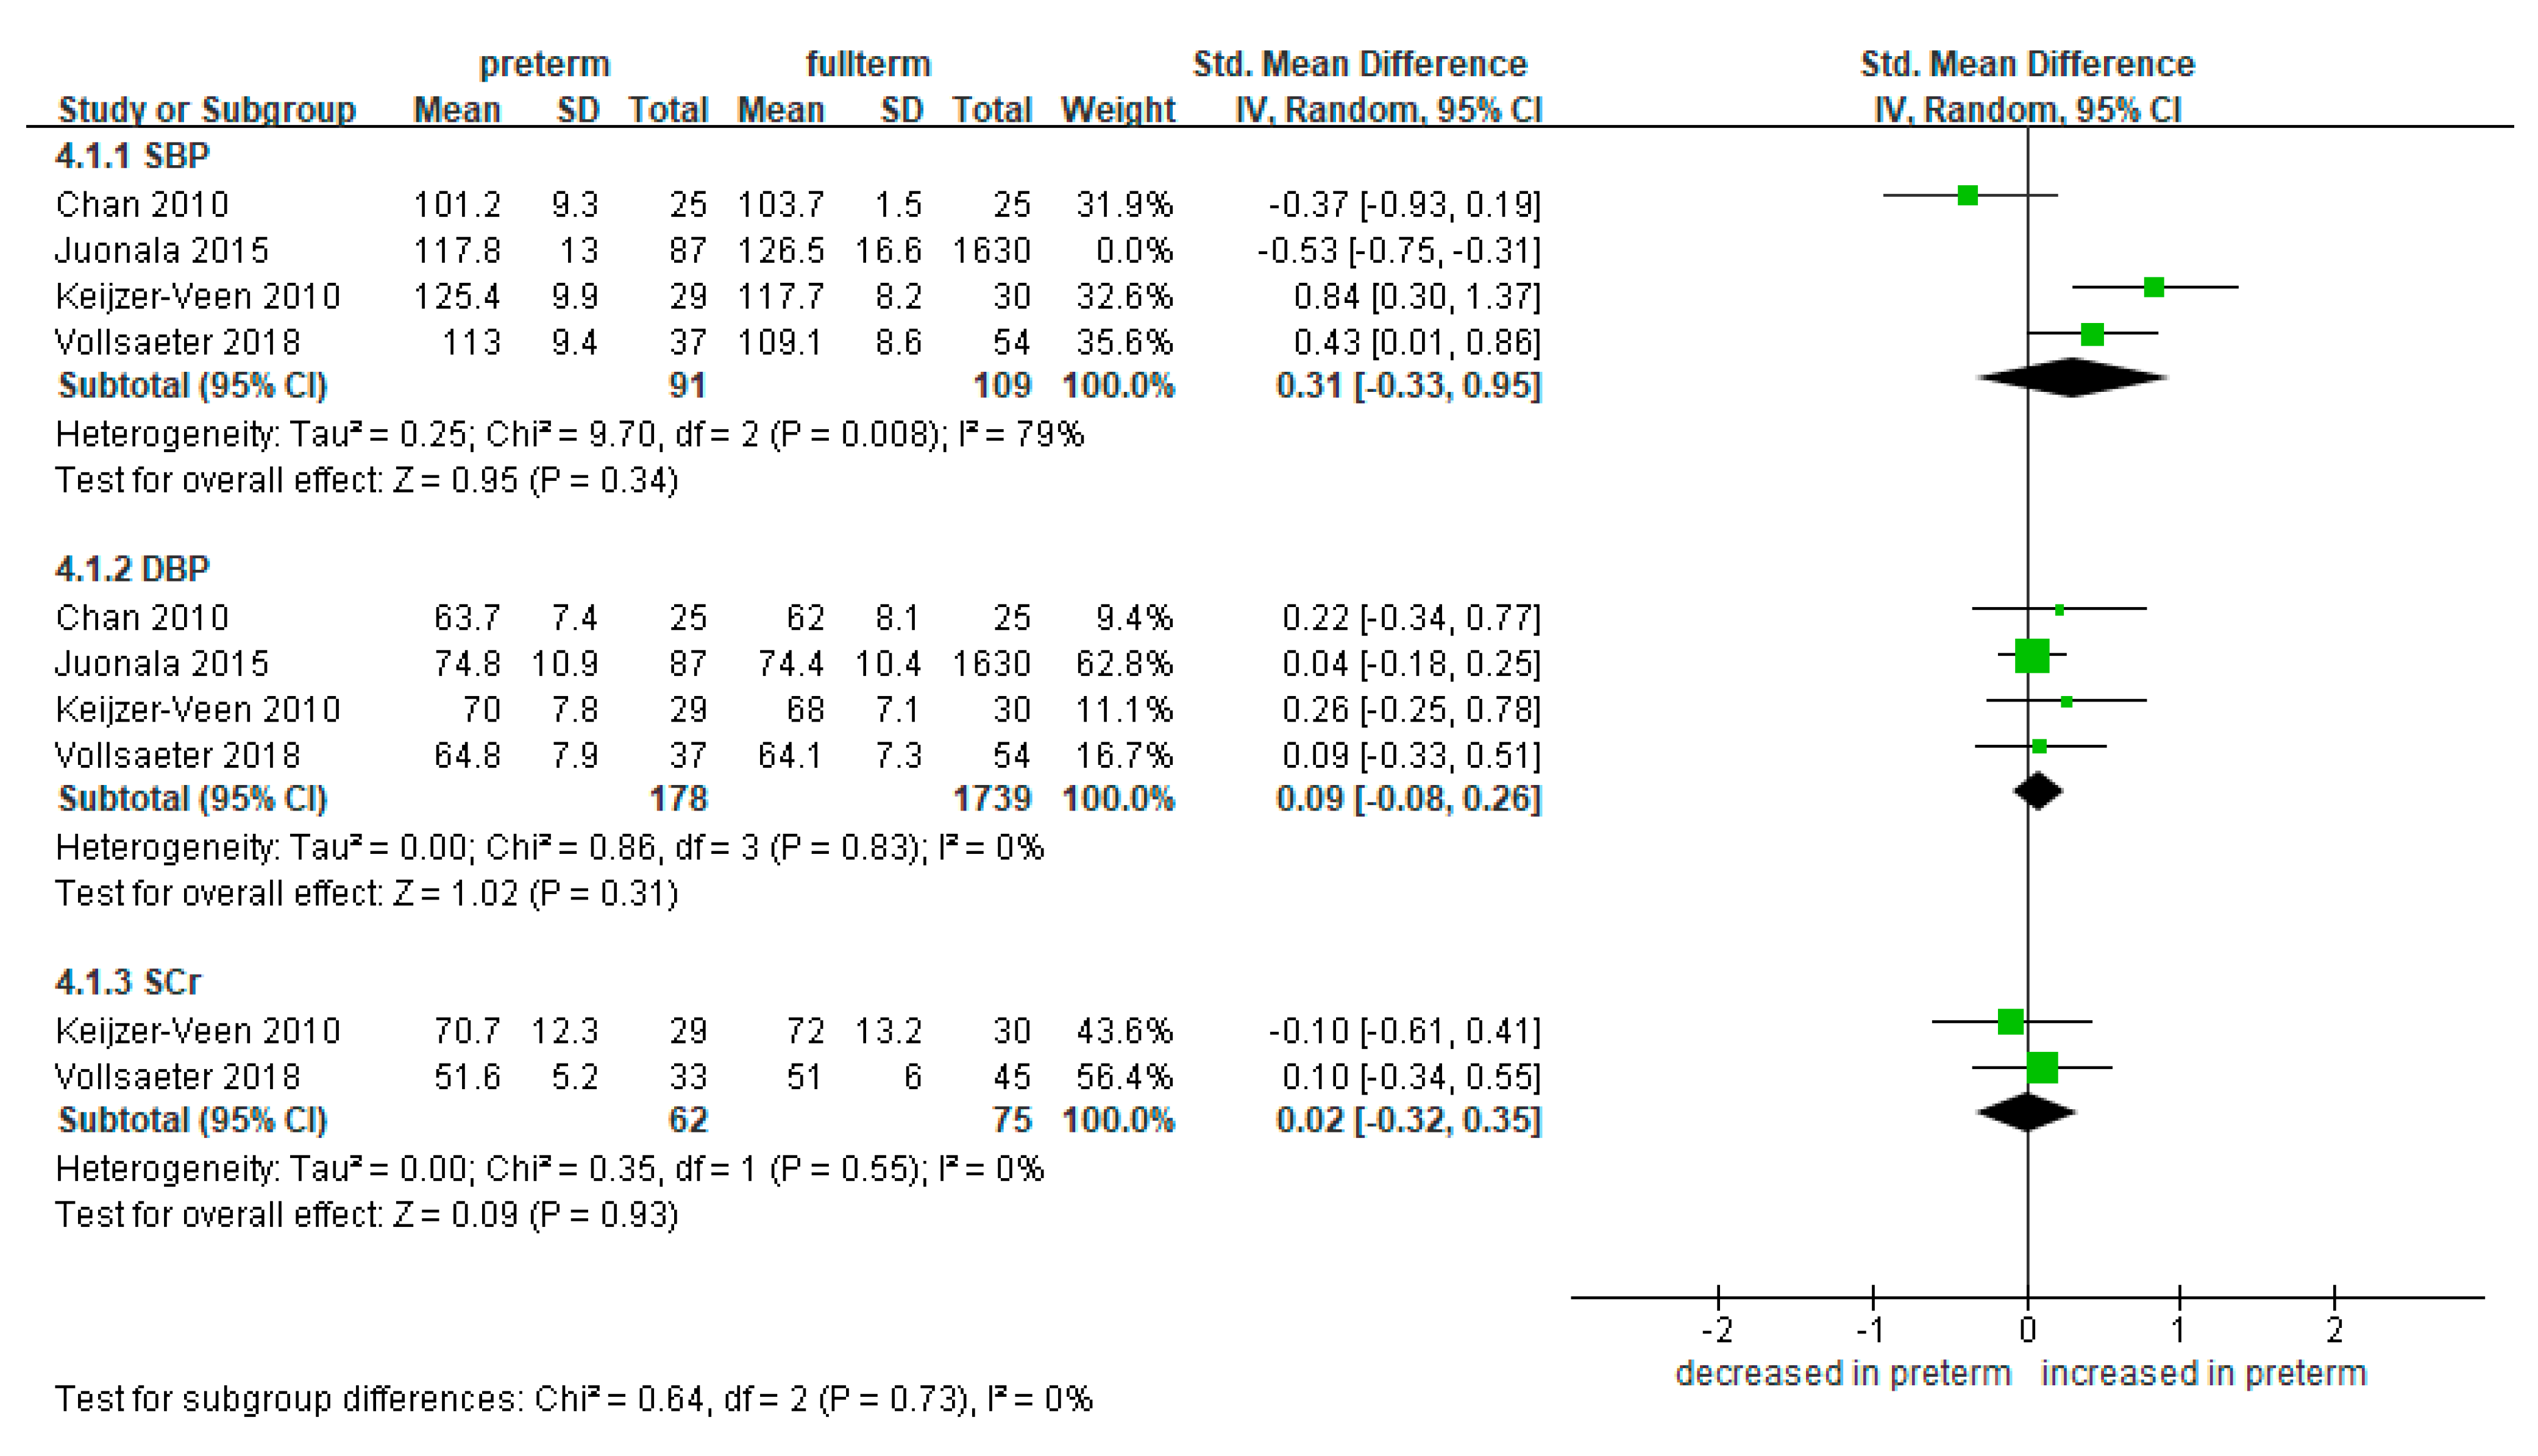
3.5.2. AGA
4. Discussion
5. Conclusions
Supplementary Materials
Author Contributions
Funding
Institutional Review Board Statement
Informed Consent Statement
Data Availability Statement
Conflicts of Interest
References
- Blencowe, H.; Cousens, S.; Oestergaard, M.Z.; Chou, D.; Moller, A.B.; Narwal, R.; Adler, A.; Vera Garcia, C.; Rohde, S.; Say, L.; et al. National, regional, and worldwide estimates of preterm birth rates in the year 2010 with time trends since 1990 for selected countries: A systematic analysis and implications. Lancet 2012, 379, 2162–2172. [Google Scholar] [CrossRef] [Green Version]
- Chehade, H.; Simeoni, U.; Guignard, J.P.; Boubred, F. Preterm Birth: Long Term Cardiovascular and Renal Consequences. Curr. Pediatric Rev. 2018, 14, 219–226. [Google Scholar] [CrossRef] [PubMed] [Green Version]
- Vohr, B.R. Neurodevelopmental outcomes of extremely preterm infants. Clin. Perinatol. 2014, 41, 241–255. [Google Scholar] [CrossRef]
- Raju, T.N.K.; Pemberton, V.L.; Saigal, S.; Blaisdell, C.J.; Moxey-Mims, M.; Buist, S. Long-Term Healthcare Outcomes of Preterm Birth: An Executive Summary of a Conference Sponsored by the National Institutes of Health. J. Pediatr. 2017, 181, 309–318.e1. [Google Scholar] [CrossRef] [PubMed] [Green Version]
- Nuyt, A.M.; Lavoie, J.C.; Mohamed, I.; Paquette, K.; Luu, T.M. Adult Consequences of Extremely Preterm Birth: Cardiovascular and Metabolic Diseases Risk Factors, Mechanisms, and Prevention Avenues. Clin. Perinatol. 2017, 44, 315–332. [Google Scholar] [CrossRef]
- Luu, T.M.; Rehman Mian, M.O.; Nuyt, A.M. Long-Term Impact of Preterm Birth: Neurodevelopmental and Physical Health Outcomes. Clin. Perinatol. 2017, 44, 305–314. [Google Scholar] [CrossRef] [PubMed]
- Hinchliffe, S.A.; Sargent, P.H.; Howard, C.V.; Chan, Y.F.; van Velzen, D. Human intrauterine renal growth expressed in absolute number of glomeruli assessed by the disector method and Cavalieri principle. Lab. Investig. A J. Tech. Methods Pathol. 1991, 64, 777–784. [Google Scholar]
- South, A.M.; Nixon, P.A.; Chappell, M.C.; Diz, D.I.; Russell, G.B.; Jensen, E.T.; Shaltout, H.A.; O’Shea, T.M.; Washburn, L.K. Renal function and blood pressure are altered in adolescents born preterm. Pediatr. Nephrol. 2019, 34, 137–144. [Google Scholar] [CrossRef]
- Rodríguez, M.M.; Gómez, A.H.; Abitbol, C.L.; Chandar, J.J.; Duara, S.; Zilleruelo, G.E. Histomorphometric analysis of postnatal glomerulogenesis in extremely preterm infants. Pediatr. Dev. Pathol. Off. J. Soc. Pediatr. Pathol. Paediatr. Pathol. Soc. 2004, 7, 17–25. [Google Scholar] [CrossRef] [PubMed]
- Kim, S.H.; Ahn, Y.H.; Shin, J.; Jung, Y.H.; Kim, J.Y.; Choi, C.W. Cystic dysplasia of the kidneys in extremely preterm infants following acute kidney injury. Pediatr. Nephrol. 2020, 35, 2369–2372. [Google Scholar] [CrossRef]
- Sutherland, M.R.; Gubhaju, L.; Moore, L.; Kent, A.L.; Dahlstrom, J.E.; Horne, R.S.; Hoy, W.E.; Bertram, J.F.; Black, M.J. Accelerated maturation and abnormal morphology in the preterm neonatal kidney. J. Am. Soc. Nephrol. 2011, 22, 1365–1374. [Google Scholar] [CrossRef] [Green Version]
- Brenner, B.M.; Garcia, D.L.; Anderson, S. Glomeruli and blood pressure. Less of one, more the other? Am. J. Hypertens 1988, 1, 335–347. [Google Scholar] [CrossRef]
- White, S.L.; Perkovic, V.; Cass, A.; Chang, C.L.; Poulter, N.R.; Spector, T.; Haysom, L.; Craig, J.C.; Salmi, I.A.; Chadban, S.J.; et al. Is low birth weight an antecedent of CKD in later life? A systematic review of observational studies. Am. J. Kidney Dis. Off. J. Natl. Kidney Found. 2009, 54, 248–261. [Google Scholar] [CrossRef]
- Vikse, B.E.; Irgens, L.M.; Leivestad, T.; Hallan, S.; Iversen, B.M. Low birth weight increases risk for end-stage renal disease. J. Am. Soc. Nephrol. 2008, 19, 151–157. [Google Scholar] [CrossRef]
- Ruggajo, P.; Skrunes, R.; Svarstad, E.; Skjærven, R.; Reisæther, A.V.; Vikse, B.E. Familial Factors, Low Birth Weight, and Development of ESRD: A Nationwide Registry Study. Am. J. Kidney Dis. Off. J. Natl. Kidney Found. 2016, 67, 601–608. [Google Scholar] [CrossRef]
- Crump, C.; Sundquist, J.; Winkleby, M.A.; Sundquist, K. Preterm birth and risk of chronic kidney disease from childhood into mid-adulthood: National cohort study. BMJ Clin. Res. 2019, 365, l1346. [Google Scholar] [CrossRef] [Green Version]
- Higgins, J.P.T.; Thomas, J.; Chandler, J.; Cumpston, M.; Li, T.; Page, M.J.; Welch, V.A. Cochrane Handbook for Systematic Reviews of Interventions Version 6.0 (Updated July 2019). Cochrane. 2019. Available online: www.training.cochrane.org/handbook (accessed on 11 November 2019).
- Wan, X.; Wang, W.; Liu, J.; Tong, T. Estimating the sample mean and standard deviation from the sample size, median, range and/or interquartile range. BMC Med. Res. Methodol. 2014, 14, 135. [Google Scholar] [CrossRef] [PubMed] [Green Version]
- Moher, D.; Liberati, A.; Tetzlaff, J.; Altman, D.G.; Group, A.T.P. Preferred Reporting Items for Systematic Reviews and Meta-Analyses: The PRISMA Statement. Ann. Intern. Med. 2009, 151, 264–269. [Google Scholar] [CrossRef] [PubMed] [Green Version]
- Wells, G.A.; Shea, B.; O’Connell, D.; Peterson, J.; Welch, V.; Losos, M.; Tugwell, P. The Newcastle-Ottawa Scale (NOS) for Assessing the Quality of Nonrandomised Studies in Meta-Analyses. Available online: http://www.ohri.ca/programs/clinical_epidemiology/oxford.asp (accessed on 11 November 2019).
- Cochran, W.G. The comparison of percentages in matched samples. Biometrika 1950, 37, 256–266. [Google Scholar] [CrossRef] [PubMed]
- The Cochrane Collaboration. Cochrane Handbook for Systematic Reviews of Interventions; Version 5.0.1; Wiley: Hoboken, NJ, USA, 2008; Chapter 9; p. 27. [Google Scholar]
- Higgins, J.P.; Thompson, S.G. Quantifying heterogeneity in a meta-analysis. Stat. Med. 2002, 21, 1539–1558. [Google Scholar] [CrossRef] [PubMed]
- Vollsaeter, M.; Halvorsen, T.; Markestad, T.; Oymar, K.; Ueland, P.M.; Meyer, K.; Midttun, O.; Bjorke-Monsen, A.L. Renal function and blood pressure in 11 year old children born extremely preterm or small for gestational age. PLoS ONE 2018, 13, e0205558. [Google Scholar] [CrossRef]
- Paquette, K.; Fernandes, R.O.; Xie, L.F.; Cloutier, A.; Fallaha, C.; Girard-Bock, C.; Mian, M.O.R.; Lukaszewski, M.A.; Masse, B.; El-Jalbout, R.; et al. Kidney Size, Renal Function, Ang (Angiotensin) Peptides, and Blood Pressure in Young Adults Born Preterm. Hypertension 2018, 72, 918–928. [Google Scholar] [CrossRef]
- Kowalski, R.R.; Beare, R.; Mynard, J.P.; Cheong, J.L.Y.; Doyle, L.W.; Smolich, J.J.; Cheung, M.M.H. Increased aortic wave reflection contributes to higher systolic blood pressure in adolescents born preterm. J. Hypertens. 2018, 36, 1514–1523. [Google Scholar] [CrossRef]
- Edstedt Bonamy, A.K.; Mohlkert, L.A.; Hallberg, J.; Liuba, P.; Fellman, V.; Domellof, M.; Norman, M. Blood Pressure in 6-Year-Old Children Born Extremely Preterm. J. Am. Heart Assoc. 2017, 6. [Google Scholar] [CrossRef]
- Starzec, K.; Klimek, M.; Grudzień, A.; Jagła, M.; Kwinta, P. Longitudinal assessment of renal size and function in extremely low birth weight children at 7 and 11 years of age. Pediatr. Nephrol. 2016, 31, 2119–2126. [Google Scholar] [CrossRef] [Green Version]
- Gilarska, M.; Klimek, M.; Drozdz, D.; Grudzien, A.; Kwinta, P. Blood Pressure Profile in the 7th and 11th Year of Life in Children Born Prematurely. Iran. J. Pediatr. 2016, 26, e5080. [Google Scholar] [CrossRef] [PubMed] [Green Version]
- Washburn, L.K.; Nixon, P.A.; Russell, G.B.; Snively, B.M.; O’Shea, T.M. Preterm Birth Is Associated with Higher Uric Acid Levels in Adolescents. J. Pediatr. 2015, 167, 76–80. [Google Scholar] [CrossRef] [Green Version]
- Mathai, S.; Derraik, J.G.B.; Cutfield, W.S.; Dalziel, S.R.; Harding, J.E.; Biggs, J.B.; Jefferies, C.; Hofman, P.L. Blood pressure abnormalities in adults born moderately preterm and their children. Int. J. Cardiol. 2015, 181, 152–154. [Google Scholar] [CrossRef]
- Lewandowski, A.J.; Davis, E.F.; Yu, G.; Digby, J.E.; Boardman, H.; Whitworth, P.; Singhal, A.; Lucas, A.; McCormick, K.; Shore, A.C.; et al. Elevated blood pressure in preterm-born offspring associates with a distinct antiangiogenic state and microvascular abnormalities in adult life. Hypertension 2015, 65, 607–614. [Google Scholar] [CrossRef] [Green Version]
- Juonala, M.; Cheung, M.M.H.; Sabin, M.A.; Burgner, D.; Skilton, M.R.; Kähönen, M.; Hutri-Kähönen, N.; Lehtimäki, T.; Jula, A.; Laitinen, T.; et al. Effect of birth weight on life-course blood pressure levels among children born premature: The Cardiovascular Risk in Young Finns Study. J. Hypertens. 2015, 33, 1542–1548. [Google Scholar] [CrossRef] [PubMed]
- Gunay, F.; Alpay, H.; Gokce, I.; Bilgen, H. Is late-preterm birth a risk factor for hypertension in childhood? Eur. J. Pediatr. 2014, 173, 751–756. [Google Scholar] [CrossRef] [PubMed]
- Bassareo, P.P.; Fanos, V.; Mussap, M.; Flore, G.; Noto, A.; Puddu, M.; Saba, L.; Mercuro, G. Urinary NGAL and hematic ADMA levels: An early sign of cardio-renal syndrome in young adults born preterm? J. Matern. Fetal Neonatal Med. 2013, 26, 80–83. [Google Scholar] [CrossRef]
- Kwinta, P.; Klimek, M.; Drozdz, D.; Grudzień, A.; Jagła, M.; Zasada, M.; Pietrzyk, J.J. Assessment of long-term renal complications in extremely low birth weight children. Pediatric Nephrol. 2011, 26, 1095–1103. [Google Scholar] [CrossRef] [PubMed] [Green Version]
- Lazdam, M.; de la Horra, A.; Pitcher, A.; Mannie, Z.; Diesch, J.; Trevitt, C.; Kylintireas, I.; Contractor, H.; Singhal, A.; Lucas, A.; et al. Elevated blood pressure in offspring born premature to hypertensive pregnancy: Is endothelial dysfunction the underlying vascular mechanism? Hypertension 2010, 56, 159–165. [Google Scholar] [CrossRef] [Green Version]
- Keijzer-Veen, M.G.; Dülger, A.; Dekker, F.W.; Nauta, J.; Van Der Heijden, B.J. Very preterm birth is a risk factor for increased systolic blood pressure at a young adult age. Pediatr. Nephrol. 2010, 25, 509–516. [Google Scholar] [CrossRef] [PubMed] [Green Version]
- Hovi, P.; Andersson, S.; Räikkönen, K.; Strang-Karlsson, S.; Järvenpää, A.L.; Eriksson, J.G.; Pesonen, A.K.; Heinonen, K.; Pyhälä, R.; Kajantie, E. Ambulatory Blood Pressure in Young Adults with Very Low Birth Weight. J. Pediatr. 2010, 156, 54–59.e51. [Google Scholar] [CrossRef] [PubMed]
- Chan, P.Y.; Morris, J.M.; Leslie, G.I.; Kelly, P.J.; Gallery, E.D. The long-term effects of prematurity and intrauterine growth restriction on cardiovascular, renal, and metabolic function. Int. J. Pediatr. 2010, 2010, 280402. [Google Scholar] [CrossRef] [PubMed] [Green Version]
- Evensen, K.A.; Steinshamn, S.; Tjønna, A.E.; Stølen, T.; Høydal, M.A.; Wisløff, U.; Brubakk, A.M.; Vik, T. Effects of preterm birth and fetal growth retardation on cardiovascular risk factors in young adulthood. Early Hum. Dev. 2009, 85, 239–245. [Google Scholar] [CrossRef] [PubMed]
- Keijzer-Veen, M.G.; Kleinveld, H.A.; Lequin, M.H.; Dekker, F.W.; Nauta, J.; de Rijke, Y.B.; van der Heijden, B.J. Renal function and size at young adult age after intrauterine growth restriction and very premature birth. Am. J. Kidney Dis. Off. J. Natl. Kidney Found. 2007, 50, 542–551. [Google Scholar] [CrossRef]
- Edstedt Bonamy, A.K.; Martin, H.; Jorneskog, G.; Norman, M. Lower skin capillary density, normal endothelial function and higher blood pressure in children born preterm. J. Intern. Med. 2007, 262, 635–642. [Google Scholar] [CrossRef]
- Rodríguez-Soriano, J.; Aguirre, M.; Oliveros, R.; Vallo, A. Long-term renal follow-up of extremely low birth weight infants. Pediatr. Nephrol. 2005, 20, 579–584. [Google Scholar] [CrossRef]
- Kistner, A.; Celsi, G.; Vanpée, M.; Jacobson, S.H. Increased systolic daily ambulatory blood pressure in adult women born preterm. Pediatr. Nephrol. 2005, 20, 232–233. [Google Scholar] [CrossRef]
- Doyle, L.W.; Faber, B.; Callanan, C.; Morley, R. Blood pressure in late adolescence and very low birth weight. Pediatrics 2003, 111, 252–257. [Google Scholar] [CrossRef]
- Kistner, A.; Celsi, G.; Vanpee, M.; Jacobson, S.H. Increased blood pressure but normal renal function in adult women born preterm. Pediatr. Nephrol. 2000, 15, 215–220. [Google Scholar] [CrossRef] [PubMed]
- Siewert-Delle, A.; Ljungman, S. The impact of birth weight and gestational age on blood pressure in adult life: A population-based study of 49-year-old men. Am. J. Hypertens. 1998, 11, 946–953. [Google Scholar] [CrossRef] [Green Version]
- Vanpee, M.; Blennow, M.; Linne, T.; Herin, P.; Aperia, A. Renal function in very low birth weight infants: Normal maturity reached during early childhood. J. Pediatr. 1992, 121, 784–788. [Google Scholar] [CrossRef]
- Jung, K.; Jung, M. Cystatin C: A promising marker of glomerular filtration rate to replace creatinine. Nephron 1995, 70, 370–371. [Google Scholar] [CrossRef] [PubMed]
- Hosten, A.O. BUN and Creatinine. In Clinical Methods: The History, Physical, and Laboratory Examinations; Walker, H.K., Hall, W.D., Hurst, J.W., Eds.; Butterworths: Boston, MA, USA, 1990. [Google Scholar]
- Shlipak, M.G.; Katz, R.; Sarnak, M.J.; Fried, L.F.; Newman, A.B.; Stehman-Breen, C.; Seliger, S.L.; Kestenbaum, B.; Psaty, B.; Tracy, R.P.; et al. Cystatin C and prognosis for cardiovascular and kidney outcomes in elderly persons without chronic kidney disease. Ann. Intern. Med. 2006, 145, 237–246. [Google Scholar] [CrossRef]
- Shlipak, M.G.; Praught, M.L.; Sarnak, M.J. Update on cystatin C: New insights into the importance of mild kidney dysfunction. Curr. Opin. Nephrol. Hypertens. 2006, 15, 270–275. [Google Scholar] [CrossRef]
- Brennan, S.; Watson, D.; Rudd, D.; Schneider, M.; Kandasamy, Y. Evaluation of fetal kidney growth using ultrasound: A systematic review. Eur. J. Radiol. 2017, 96, 55–64. [Google Scholar] [CrossRef]
- Schreuder, M.F.; Bueters, R.R.; Allegaert, K. The interplay between drugs and the kidney in premature neonates. Pediatr. Nephrol. 2014, 29, 2083–2091. [Google Scholar] [CrossRef]
- Vásárhelyi, B.; Tóth-Heyn, P.; Treszl, A.; Tulassay, T. Genetic polymorphisms and risk for acute renal failure in preterm neonates. Pediatr. Nephrol. 2005, 20, 132–135. [Google Scholar] [CrossRef] [PubMed]
- Barhight, M.; Altaye, M.; Gist, K.M.; Isemann, B.; Goldstein, S.L.; Akinbi, H. Nephrotoxic Medications and Associated Acute Kidney Injury in Very Low Birth Weight Infants. J. Clin. Nephrol. Res. 2017, 4, 1070. [Google Scholar] [PubMed]
- Nada, A.; Bonachea, E.M.; Askenazi, D.J. Acute kidney injury in the fetus and neonate. Semin. Fetal Neonatal Med. 2017, 22, 90–97. [Google Scholar] [CrossRef] [PubMed] [Green Version]
- Gilarska, M.; Raaijmakers, A.; Zhang, Z.Y.; Staessen, J.A.; Levtchenko, E.; Klimek, M.; Grudzień, A.; Starzec, K.; Allegaert, K.; Kwinta, P. Extremely Low Birth Weight Predisposes to Impaired Renal Health: A Pooled Analysis. Kidney Blood Press. Res. 2019, 44, 897–906. [Google Scholar] [CrossRef]
- Markopoulou, P.; Papanikolaou, E.; Analytis, A.; Zoumakis, E.; Siahanidou, T. Preterm Birth as a Risk Factor for Metabolic Syndrome and Cardiovascular Disease in Adult Life: A Systematic Review and Meta-Analysis. J. Pediatr. 2019, 210, 69–80.e65. [Google Scholar] [CrossRef]
- Parkinson, J.R.; Hyde, M.J.; Gale, C.; Santhakumaran, S.; Modi, N. Preterm birth and the metabolic syndrome in adult life: A systematic review and meta-analysis. Pediatrics 2013, 131, e1240–e1263. [Google Scholar] [CrossRef] [Green Version]
- De Jong, F.; Monuteaux, M.C.; van Elburg, R.M.; Gillman, M.W.; Belfort, M.B. Systematic review and meta-analysis of preterm birth and later systolic blood pressure. Hypertension 2012, 59, 226–234. [Google Scholar] [CrossRef] [Green Version]
- Kistner, A.; Jacobson, L.; Jacobson, S.H.; Svensson, E.; Hellstrom, A. Low gestational age associated with abnormal retinal vascularization and increased blood pressure in adult women. Pediatr. Res. 2002, 51, 675–680. [Google Scholar] [CrossRef]
- Brenner, B.M.; Chertow, G.M. Congenital oligonephropathy and the etiology of adult hypertension and progressive renal injury. Am. J. Kidney Dis. Off. J. Natl. Kidney Found. 1994, 23, 171–175. [Google Scholar] [CrossRef]
- Luyckx, V.A.; Bertram, J.F.; Brenner, B.M.; Fall, C.; Hoy, W.E.; Ozanne, S.E.; Vikse, B.E. Effect of fetal and child health on kidney development and long-term risk of hypertension and kidney disease. Lancet 2013, 382, 273–283. [Google Scholar] [CrossRef] [Green Version]
- Wühl, E.; Schaefer, F. Therapeutic strategies to slow chronic kidney disease progression. Pediatr. Nephrol. 2008, 23, 705–716. [Google Scholar] [CrossRef] [Green Version]


| Author Year | Study Groups | n | GA (Weeks) 1 | Birth Wt (g) 1 | SGA n (%) | BMI (kg/m2) 1 | Age at FU (Years) 1 |
|---|---|---|---|---|---|---|---|
| South, 2019 [8] | Preterm | 96 | 27.8 ± 2.6 | 1048 ± 276 | 9 (9.4) | 22.1 ± 5.1 | 14 |
| Full-term | 43 | 39.7 ± 1.1 | 3458 ± 451 | 3 (7.0) | 21.5 ± 3.5 | 14 | |
| Vollsaeter, 2018 [24] | Preterm (SGA) | 20 | 28.0 ± 1.6 | 724 ± 143.2 | 20 (100.0) | 17.6 ± 3.1 | 11.3 ± 0.9 |
| Preterm (AGA) | 37 | 26.1 ± 1.2 | 918 ± 151.5 | 0 (0.0) | 17.5 ± 2.2 | 11.4 ± 1.0 | |
| Full-term (AGA) | 54 | n/a | 3701 ± 434.1 | 0 (0.0) | 17.8 ± 2.7 | 11.7 ± 1.5 | |
| Paquette, 2018 [25] | Preterm | 92 | 27.1 ± 1.3 | 955 ± 223 | 6 (6.5) | 22.6 ± 3.8 | 23.2 ± 2.2 |
| Full-term | 92 | 39.5 ± 1.1 | 3401 ± 376 | 6 (6.5) | 23.7 ± 4.4 | 23.2 ± 2.3 | |
| Kowalski, 2018 [26] | Preterm | 76 | 27 ± 1 | 904 ± 161 | 12 (15.8) | 23.0 ± 4.7 | 18.2 ± 1.3 |
| Full-term (AGA) | 42 | 39 ± 1 | 3435 ± 470 | 0 (0.0) | 23.2 ± 3.7 | 18.6 ± 0.9 | |
| Bonamy, 2017 [27] | Preterm | 171 | 25.4 ± 1.0 | 786 ± 169 | 22 (12.9) | 14.7 ± 1.7 | 6.6 ± 0.2 |
| Full-term | 172 | 39.8 ± 1.2 | 3595 ± 465 | 3 (1.7) | 16.0 ± 2.1 | 6.7 ± 0.2 | |
| Starzec, 2016 [28] | Preterm | 64 | 27 ± 5.8 | 875 ± 406 | 19 (29.7) | n/a | 11 ± 1.0 |
| Full-term | 36 | 40 ± 1.5 | 3570 ± 717 | 2 (5.6) | n/a | 10.7 ± 1.3 | |
| Gilarska, 2016 [29] | Preterm | 67 | 27 ± 2.3 | 850 ± 128 | n/a | n/a | 11.0 ± 0.3 |
| Full-term | 38 | 39.8 ± 1.4 | 3571 ± 538 | n/a | n/a | 10.6 ± 0.9 | |
| Washburn, 2015 [30] | Preterm | 124 | 27.8 ± 2.6 | 1056 ± 272 | n/a | 22.8 ± 5.2 | 14 |
| Full-term | 44 | 39.6 ± 1.1 | 3457 ± 446 | n/a | 22.8 ± 5.2 | 14 | |
| Mathai, 2015 [31] | Preterm | 22 | n/a | n/a | n/a | 28.6 ± 4.3 | 35.8 ± 1.2 |
| Full-term | 14 | n/a | n/a | n/a | 26.2 ± 4.4 | 35.6 ± 1.1 | |
| Lewandowski, 2015 [32] | Preterm | 30 | 30.5 ± 2.7 | 1295.6 ± 304.5 | n/a | 26.3 ± 7.2 | 26.6 ± 1.0 |
| Full-term | 60 | 39.6 ± 0.8 | 3411.2 ± 319.0 | n/a | 23.0 ± 3.3 | 26.2 ± 1.9 | |
| Juonala, 2015 [33] | Preterm (SGA) | 39 | n/a | n/a | 39 (100.0) | 27.3 ± 5.1 | 40.7 ± 4.3 |
| Preterm (AGA) | 87 | n/a | n/a | 0 (0.0) | 27.3 ± 5.6 | 41.3 ± 4.9 | |
| Full-term | 1630 | n/a | n/a | n/a | 26.5 ± 5.0 | 41.3 ± 4.9 | |
| Gunay, 2014 [34] | Preterm | 65 | 35.7 ± 0.4 | 2521.2 ± 119.2 | n/a | n/a | 9.0 ± 3.2 |
| Full-term | 65 | 38.5 ± 0.6 | 3328.9 ± 97.8 | n/a | n/a | 9.5 ± 2.7 | |
| Bassareo, 2013 [35] | Preterm | 12 | 26.8 ± 2.0 | 927.3 ± 67.5 | n/a | 21.6 ± 6 | 23.9 ± 3.2 |
| Full-term | 12 | 39.8 ± 0.3 | 3256.7 ± 151.5 | n/a | 21.5 ± 7 | 23.8 ± 2.9 | |
| Kwinta, 2011 [36] | Preterm | 78 | 27.3 ± 2.2 | 866.7 ± 140.7 | 22 (28.2) | n/a | 6.7 ± 0.4 |
| Full-term | 38 | 40.0 ± 1.5 | 3591.3 ± 304.4 | 2 (5.3) | n/a | 6.8 ± 0.7 | |
| Lazdam, 2010 [37] | Preterm | 71 | 30.3 ± 2.5 | 1303.4 ± 278.8 | n/a | 24.4 ± 4.3 | 24 |
| Full-term | 38 | n/a | n/a | n/a | 23.1 ± 2.6 | 24 | |
| Keijzer-Veen, 2010 [38] | Preterm (SGA) | 21 | 30.6 ± 1.1 | 858 ± 132 | 21 (100.0) | 21.7 ± 2.6 | 20.7 ± 0.3 |
| Preterm (AGA) | 29 | 29.5 ± 1.4 | 1489 ± 257 | 0 (0.0) | 22.1 ± 2.8 | 20.7 ± 0.4 | |
| Full-term (AGA) | 30 | 40.2 ± 1.3 | 3632 ± 489 | 0 (0.0) | 22.9 ± 2.8 | 20.7 ± 0.8 | |
| Hovi, 2010 [39] | Preterm | 118 | 29.2 ± 2.2 | 1138 ± 224 | 39 (33.1) | 22.0 ± 3.8 | 18–27 |
| Full-term (AGA) | 120 | 40.1 ± 1.0 | 3623 ± 479 | 0 (0.0) | 23.2 ± 3.6 | 18–27 | |
| Chan, 2010 [40] | Preterm (SGA) | 14 | 30.3 ± 1.6 | 929 ± 200 | 14 (100.0) | 18.0 ± 4.2 | 13.3 ± 1.1 |
| Preterm (AGA) | 25 | 29.5 ± 2.6 | 1492 ± 636 | 0 (0.0) | 19.7 ± 2.4 | 14.3 ± 1.0 | |
| Full-term (AGA) | 25 | 39.8 ± 1.9 | 3366 ± 433 | 0 (0.0) | 18.7 ± 2.3 | 13.6 ± 1.7 | |
| Evensen, 2009 [41] | Preterm (SGA) | 14 | 32 (27–35) 2 | 1415 (800–1500) 2 | 14 (100.0) | 23.9 ± 3.4 | 18.4 ± 0.7 |
| Preterm (AGA) | 23 | 28 (24–31) 2 | 1210 (820–1490) 2 | 0 (0.0) | 21.2 ± 3.4 | 18.1 ± 0.5 | |
| Full-term (AGA) | 63 | 40 (37–42) 2 | 3700 (2670–5140) 2 | 0 (0.0) | 23.2 ± 3.2 | 18.6 ± 0.8 | |
| Keijzer-Veen, 2007 [42] | Preterm (SGA) | 23 | 30.6 ± 1.0 | 859 ± 126 | 23 (100.0) | 21.6 ± 2.5 | 20.7 ± 0.3 |
| Preterm (AGA) | 29 | 29.5 ± 1.4 | 1489 ± 257 | 0 (0.0) | 22.1 ± 2.8 | 20.7 ± 0.4 | |
| Full-term (AGA) | 30 | 40.2 ± 1.3 | 3632 ± 489 | 0 (0.0) | 22.9 ± 2.8 | 20.7 ± 0.8 | |
| Bonamy, 2007 [43] | Preterm | 39 | 28.9 ± 1.6 | 1106 ± 305 | 20 (51.3) | 16.8 ± 2.8 | 9.1 ± 1.7 |
| Full-term | 21 | 40.3 ± 1.0 | 3704 ± 404 | 0 (0.0) | 16.2 ± 2.0 | 9.7 ± 1.5 | |
| Rodríguez-Soriano, 2005 [44] | Preterm | 40 | 27.6 (23–35) 3 | 845 (540–1000) 3 | 13 (32.5) | 16.0 ± 2.3 | 8.6 ± 1.8 |
| Full-term | 43 | n/a | n/a | n/a | 19.3 ± 2.7 | 8.5 ± 1.8 | |
| Kistner, 2005 [45] | Preterm (AGA) | 14 | 30 (28–32) 2 | 1250 (950–2040) 2 | 0 (0.0) | n/a | 26 ± 2 |
| Full-term (AGA) | 17 | n/a | 3720 (3120–4220) 2 | 0 (0.0) | n/a | 26 ± 2 | |
| Doyle, 2003 [46] | Preterm | 156 | 28.8 ± 2.0 | 1098 ± 235 | n/a | n/a | 18+ |
| Full-term | 60 | 40.0 ± 1.1 | 3493 ± 494 | n/a | n/a | 18+ | |
| Kistner, 2000 [47] | Preterm | 15 | n/a | 1293 ± 283 | n/a | 23.4 ± 2.9 | 26 ± 1.9 |
| Full-term (AGA) | 17 | n/a | 3720 ± 313 | 0 (0.0) | 23.9 ± 3.1 | 26 ± 1.9 | |
| Siewert-Delle, 1998 [48] | Preterm | 44 | n/a | 3045 ± 646 | n/a | 25.6 ± 3.0 | 49 |
| Full-term | 336 | n/a | 3559 ± 526 | n/a | 25.7 ± 3.5 | 49 | |
| Vanpée, 1992 [49] | Preterm | 8 | 28.2 ± 1.5 | n/a | n/a | n/a | 8 |
| Full-term | 12 | n/a | n/a | n/a | n/a | (2.0–25.3) 4 |
Publisher’s Note: MDPI stays neutral with regard to jurisdictional claims in published maps and institutional affiliations. |
© 2021 by the authors. Licensee MDPI, Basel, Switzerland. This article is an open access article distributed under the terms and conditions of the Creative Commons Attribution (CC BY) license (http://creativecommons.org/licenses/by/4.0/).
Share and Cite
Heo, J.S.; Lee, J.M. The Long-Term Effect of Preterm Birth on Renal Function: A Meta-Analysis. Int. J. Environ. Res. Public Health 2021, 18, 2951. https://doi.org/10.3390/ijerph18062951
Heo JS, Lee JM. The Long-Term Effect of Preterm Birth on Renal Function: A Meta-Analysis. International Journal of Environmental Research and Public Health. 2021; 18(6):2951. https://doi.org/10.3390/ijerph18062951
Chicago/Turabian StyleHeo, Ju Sun, and Jiwon M. Lee. 2021. "The Long-Term Effect of Preterm Birth on Renal Function: A Meta-Analysis" International Journal of Environmental Research and Public Health 18, no. 6: 2951. https://doi.org/10.3390/ijerph18062951