
Adjusted Unit Value Transfer as a Tool for Raising Awareness on Ecosystem Services Provided by Constructed Wetlands for Water Pollution Control: An Italian Case Study


Abstract
:1. Introduction
2. Materials and Methods
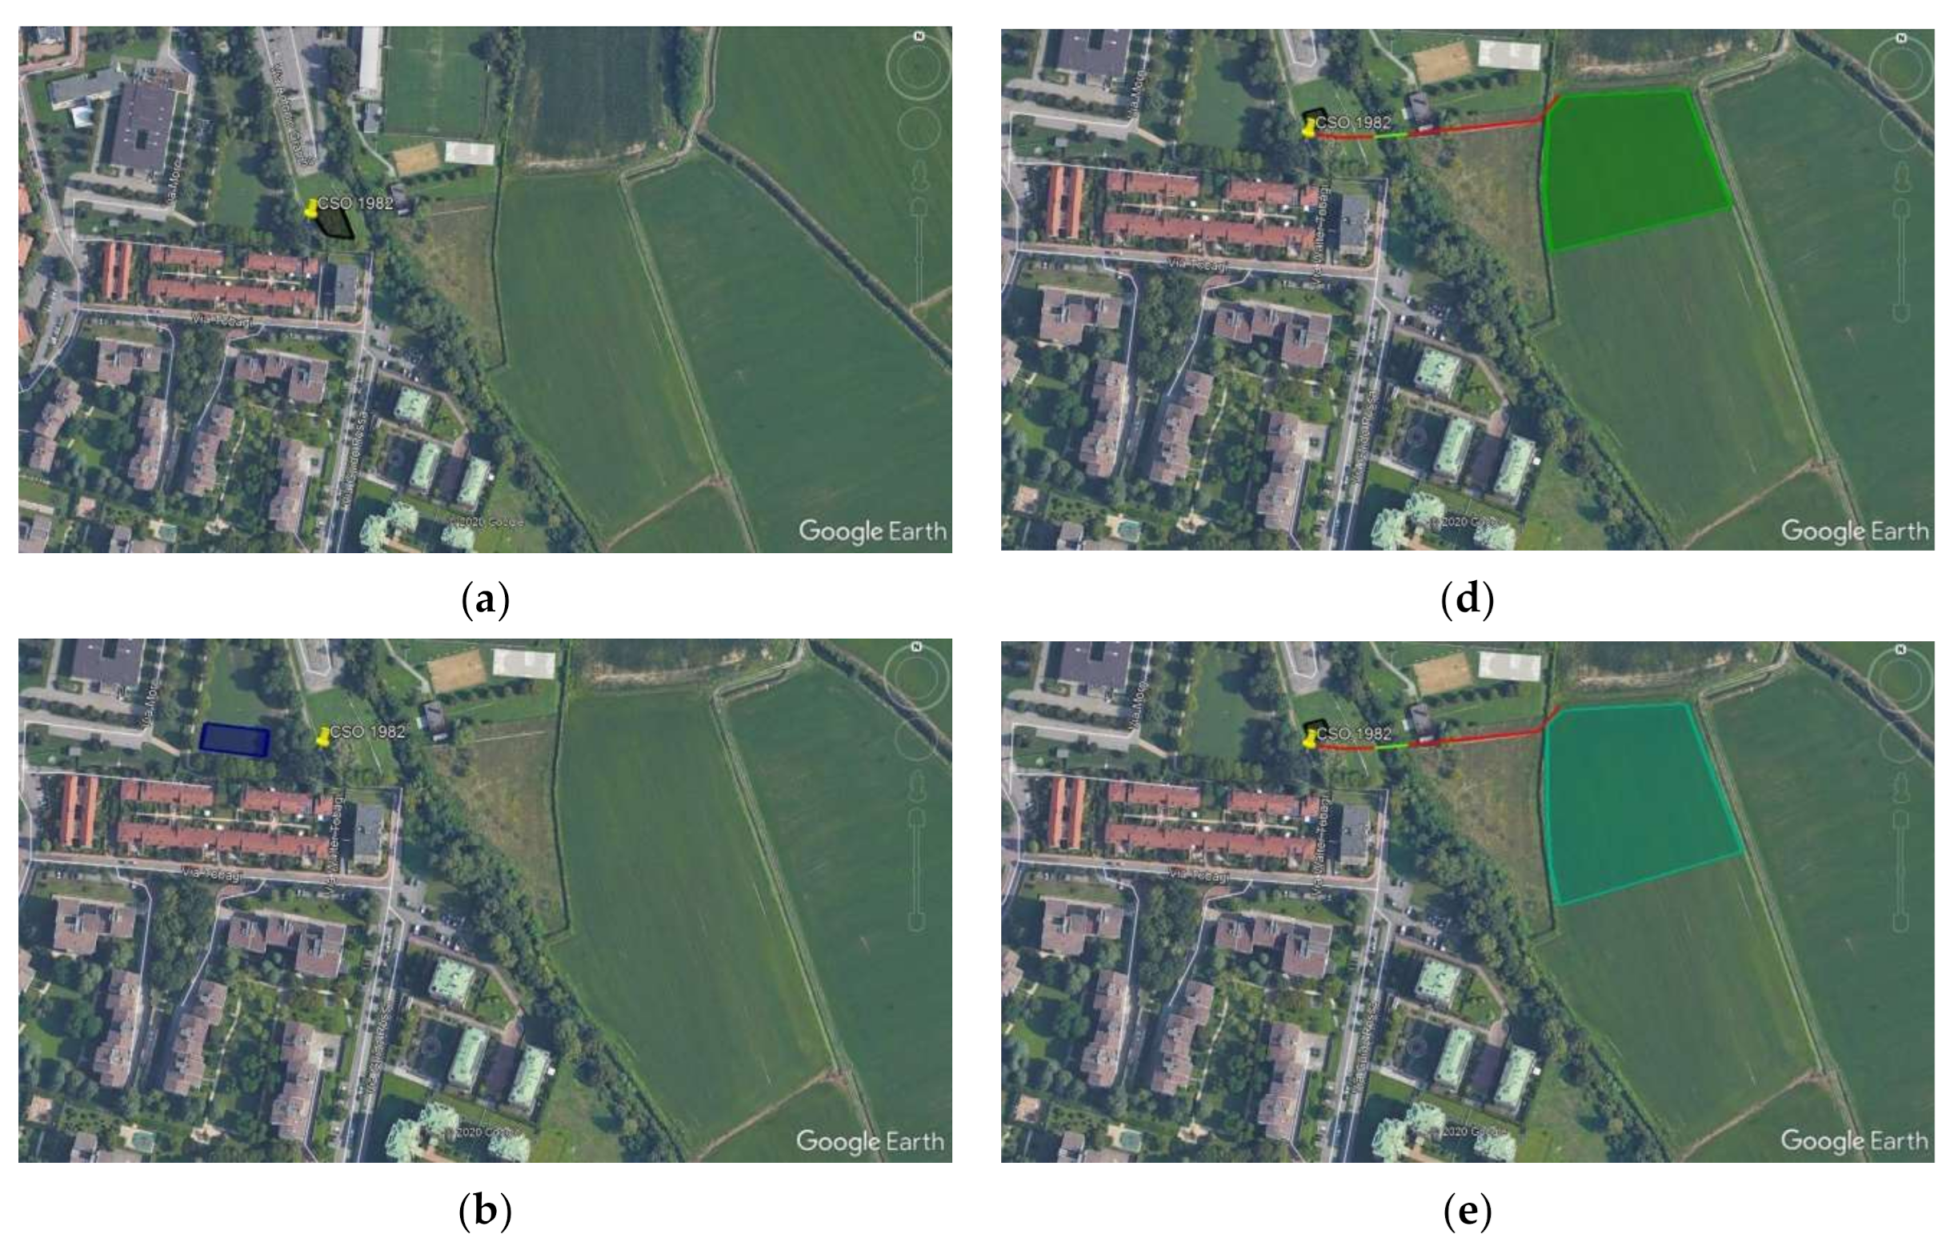
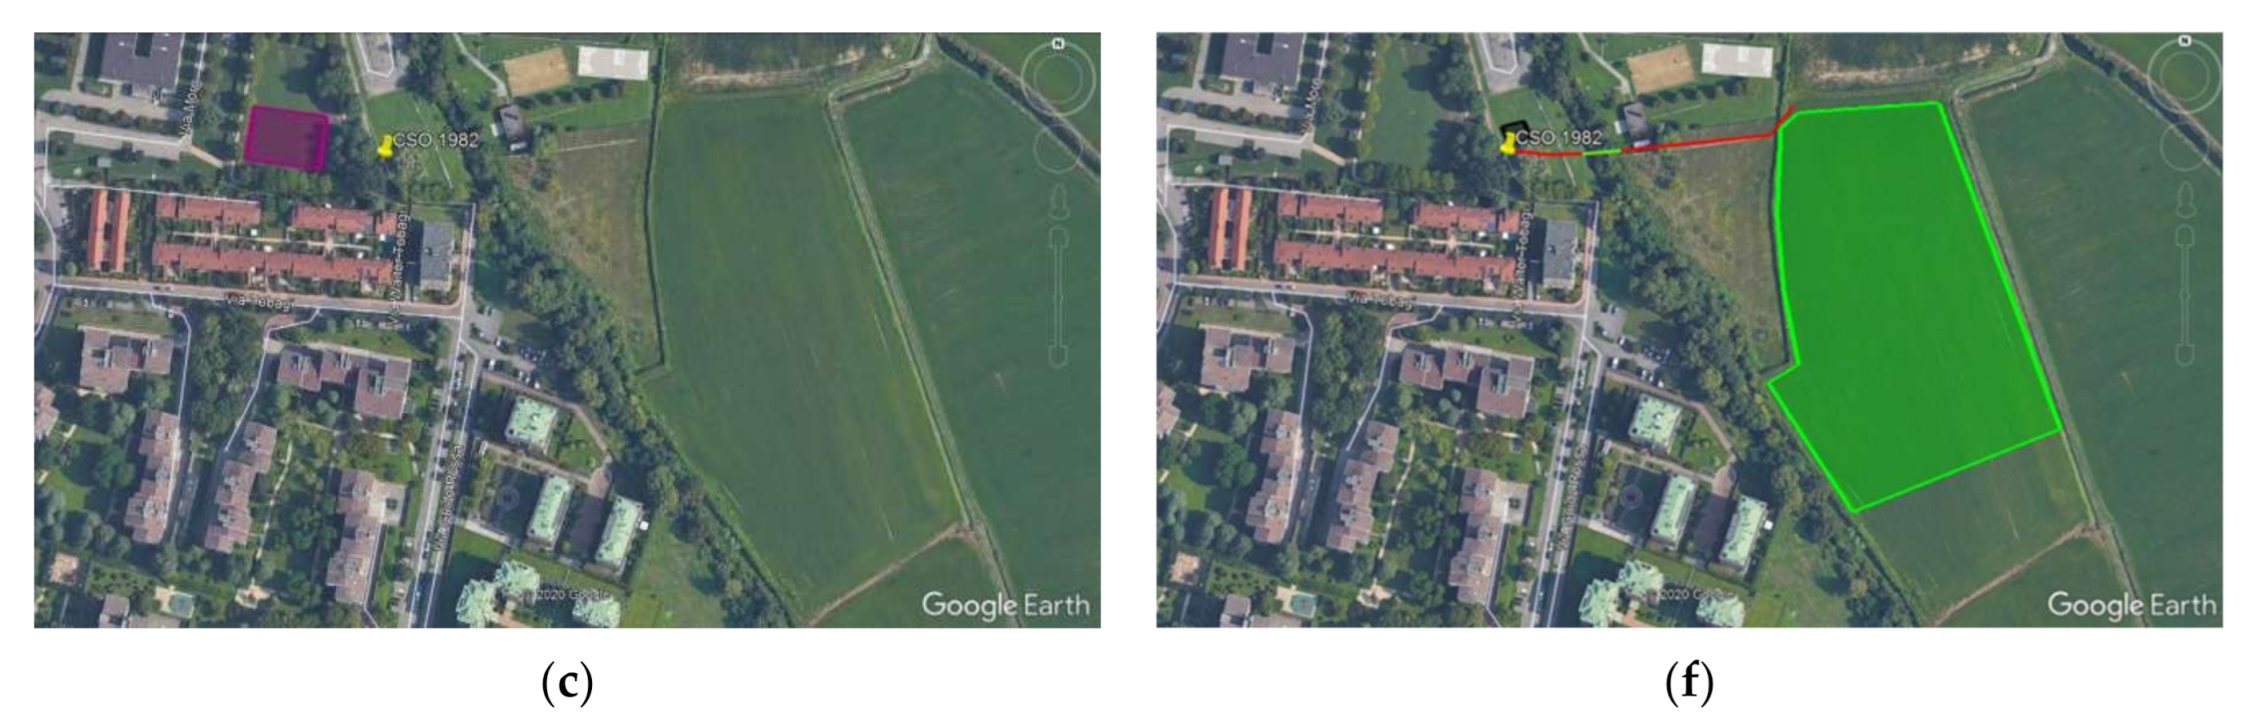
2.1. Case Study
2.2. Multi-Criteria Analysis (MCA)
2.2.1. Criteria Selection
2.2.2. Alternative Definition and Sizing
2.2.3. Weights and Sensitivity Analysis
2.3. Ecosystem Service Monetizaion
2.4. Other Criteria Evaluation
2.5. Value Functions and MCA Final Score
3. Results
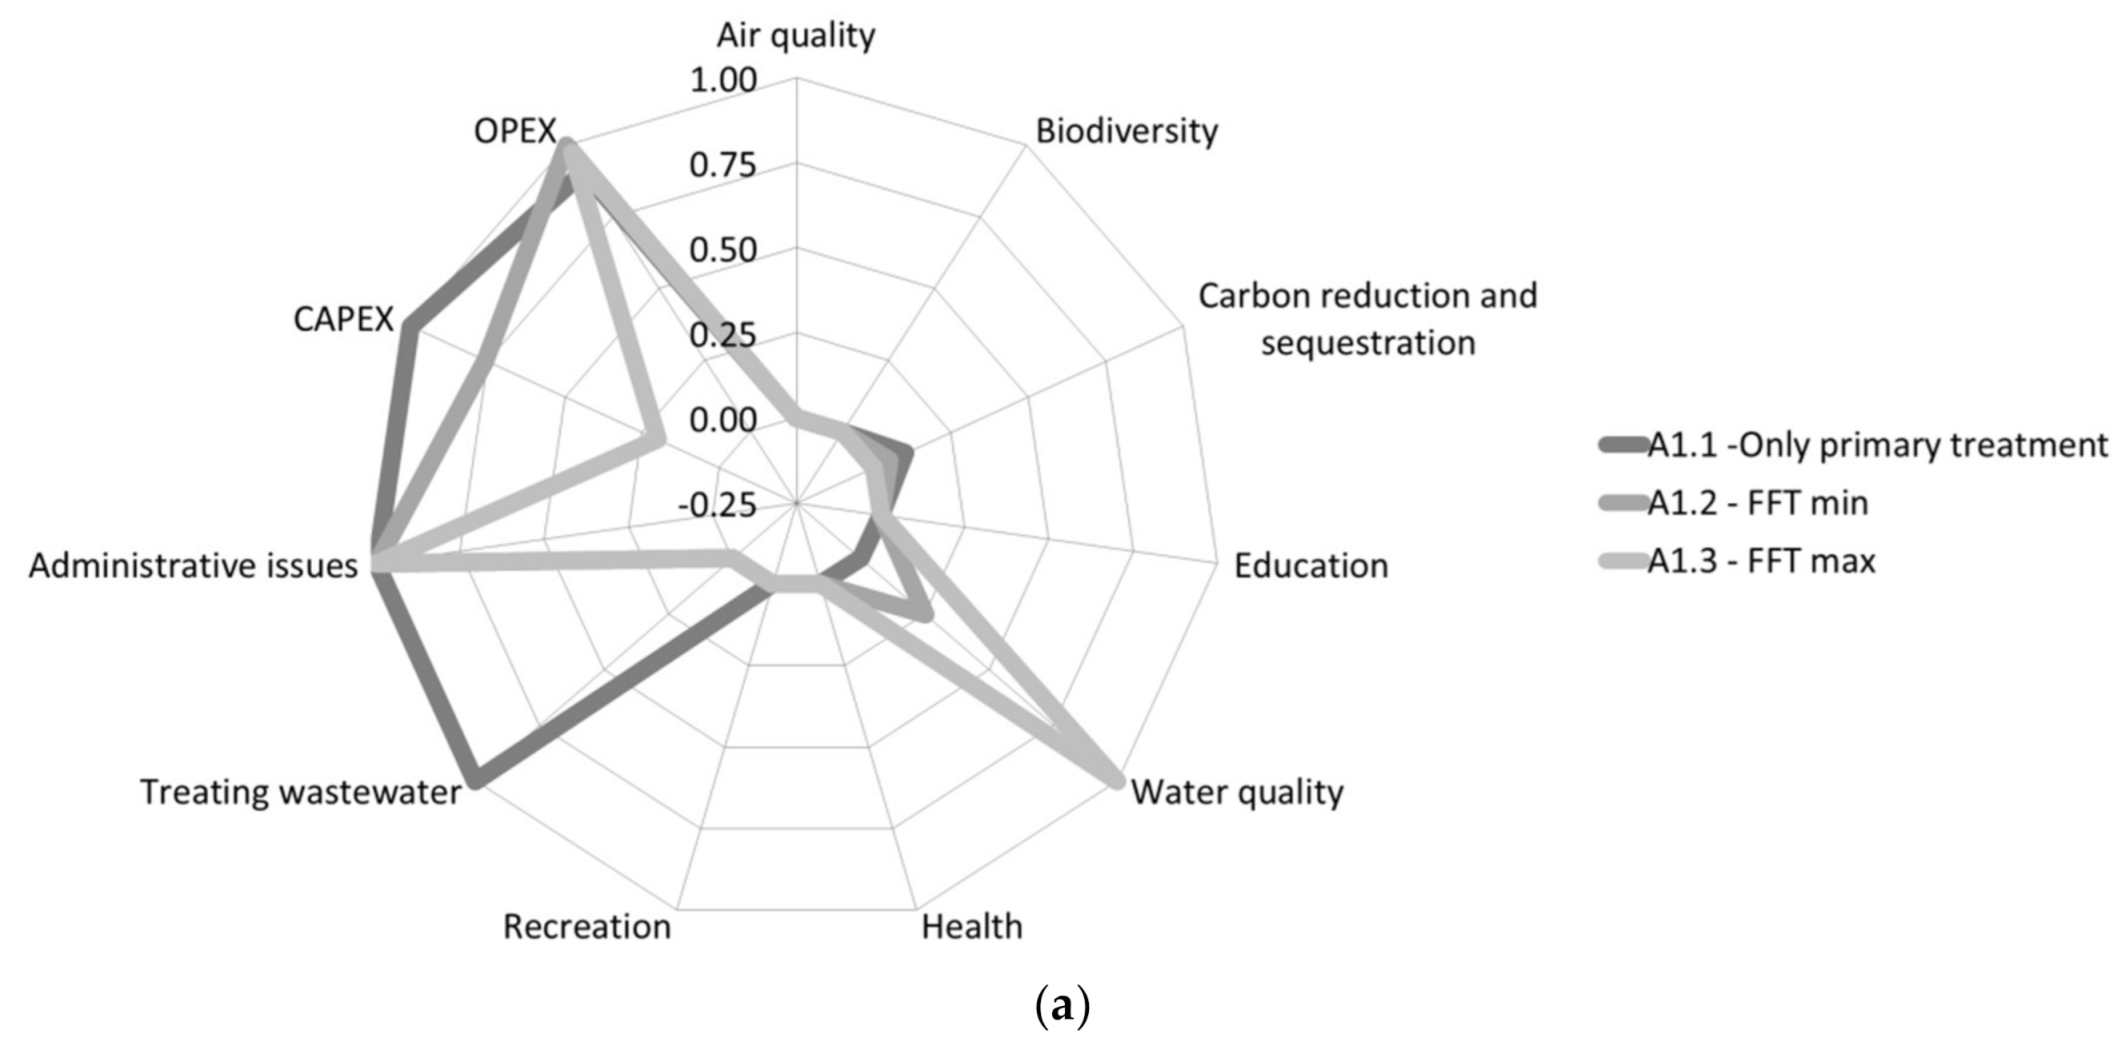
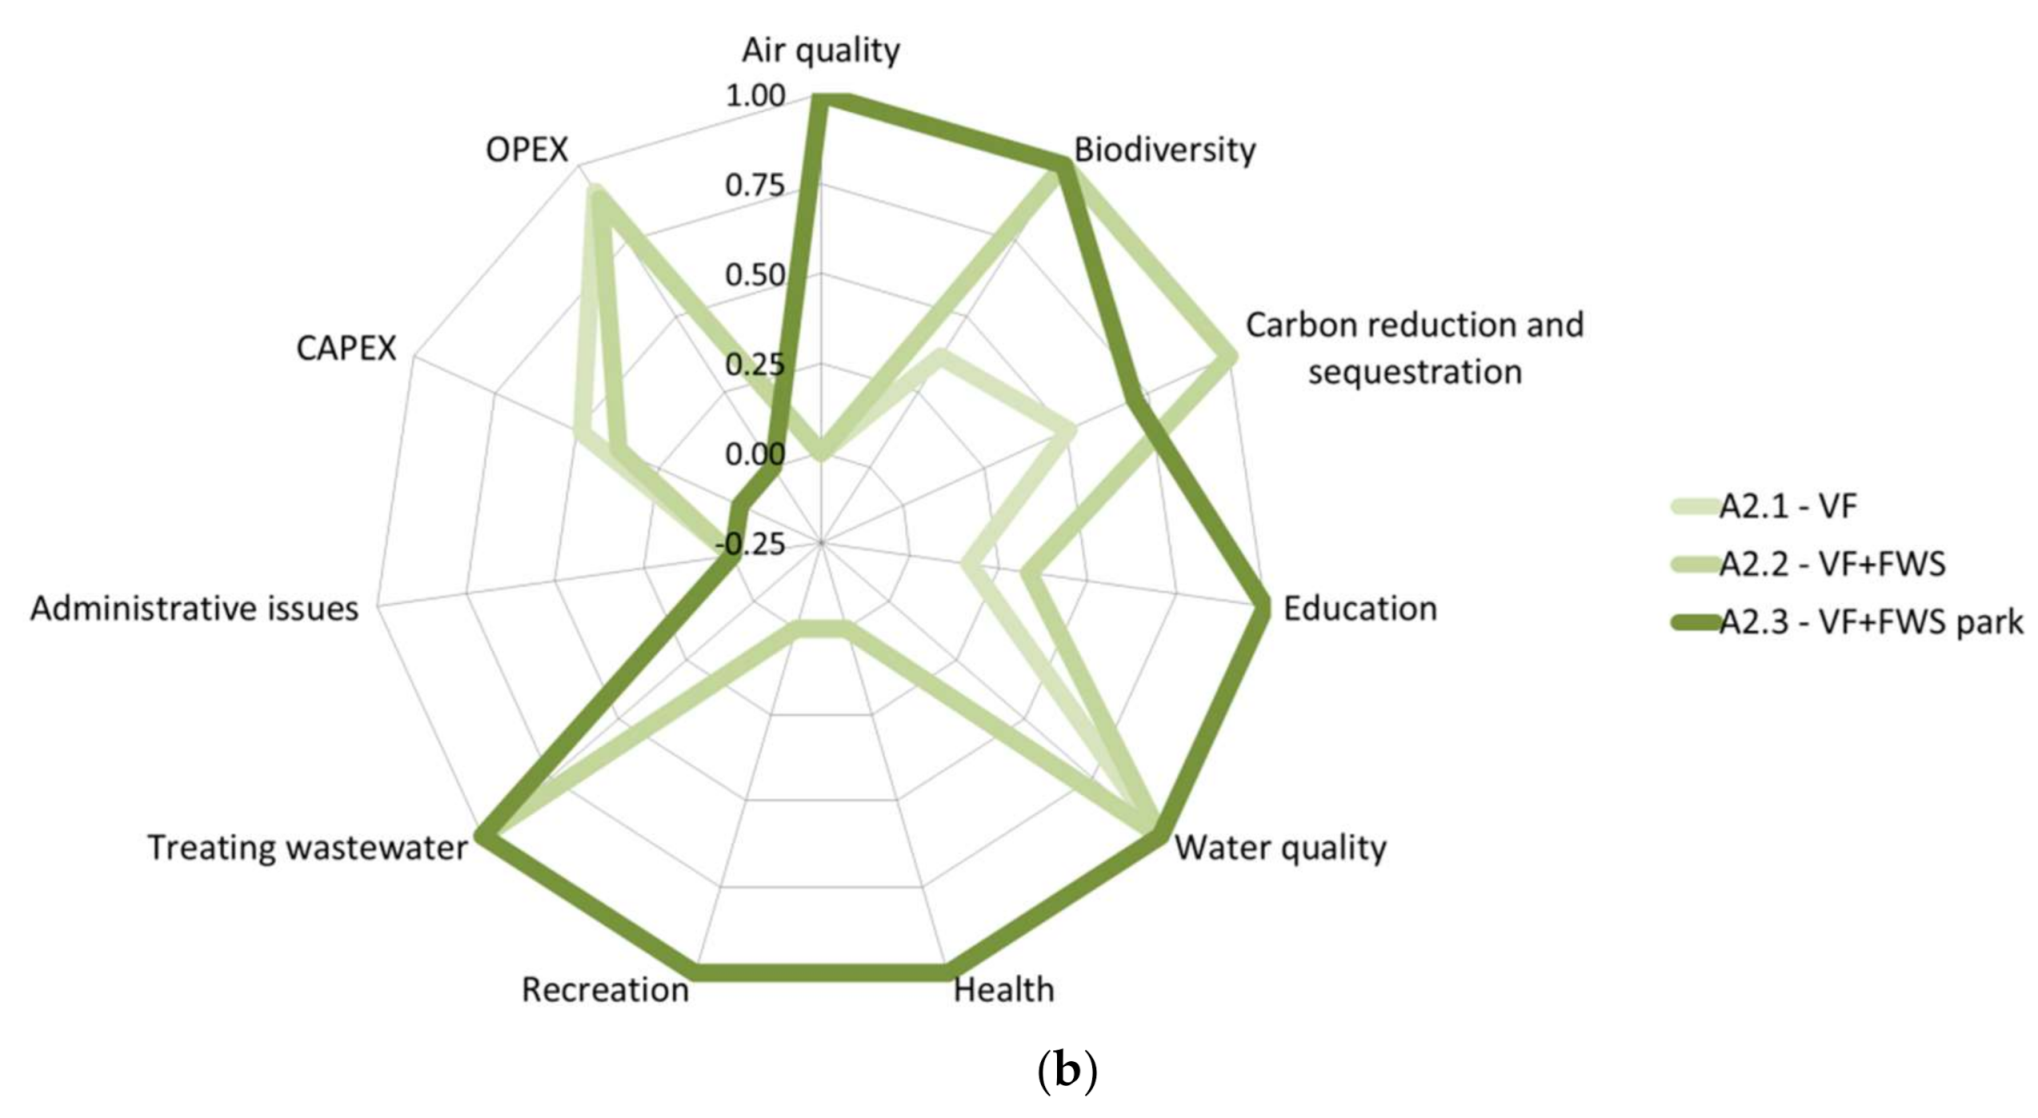
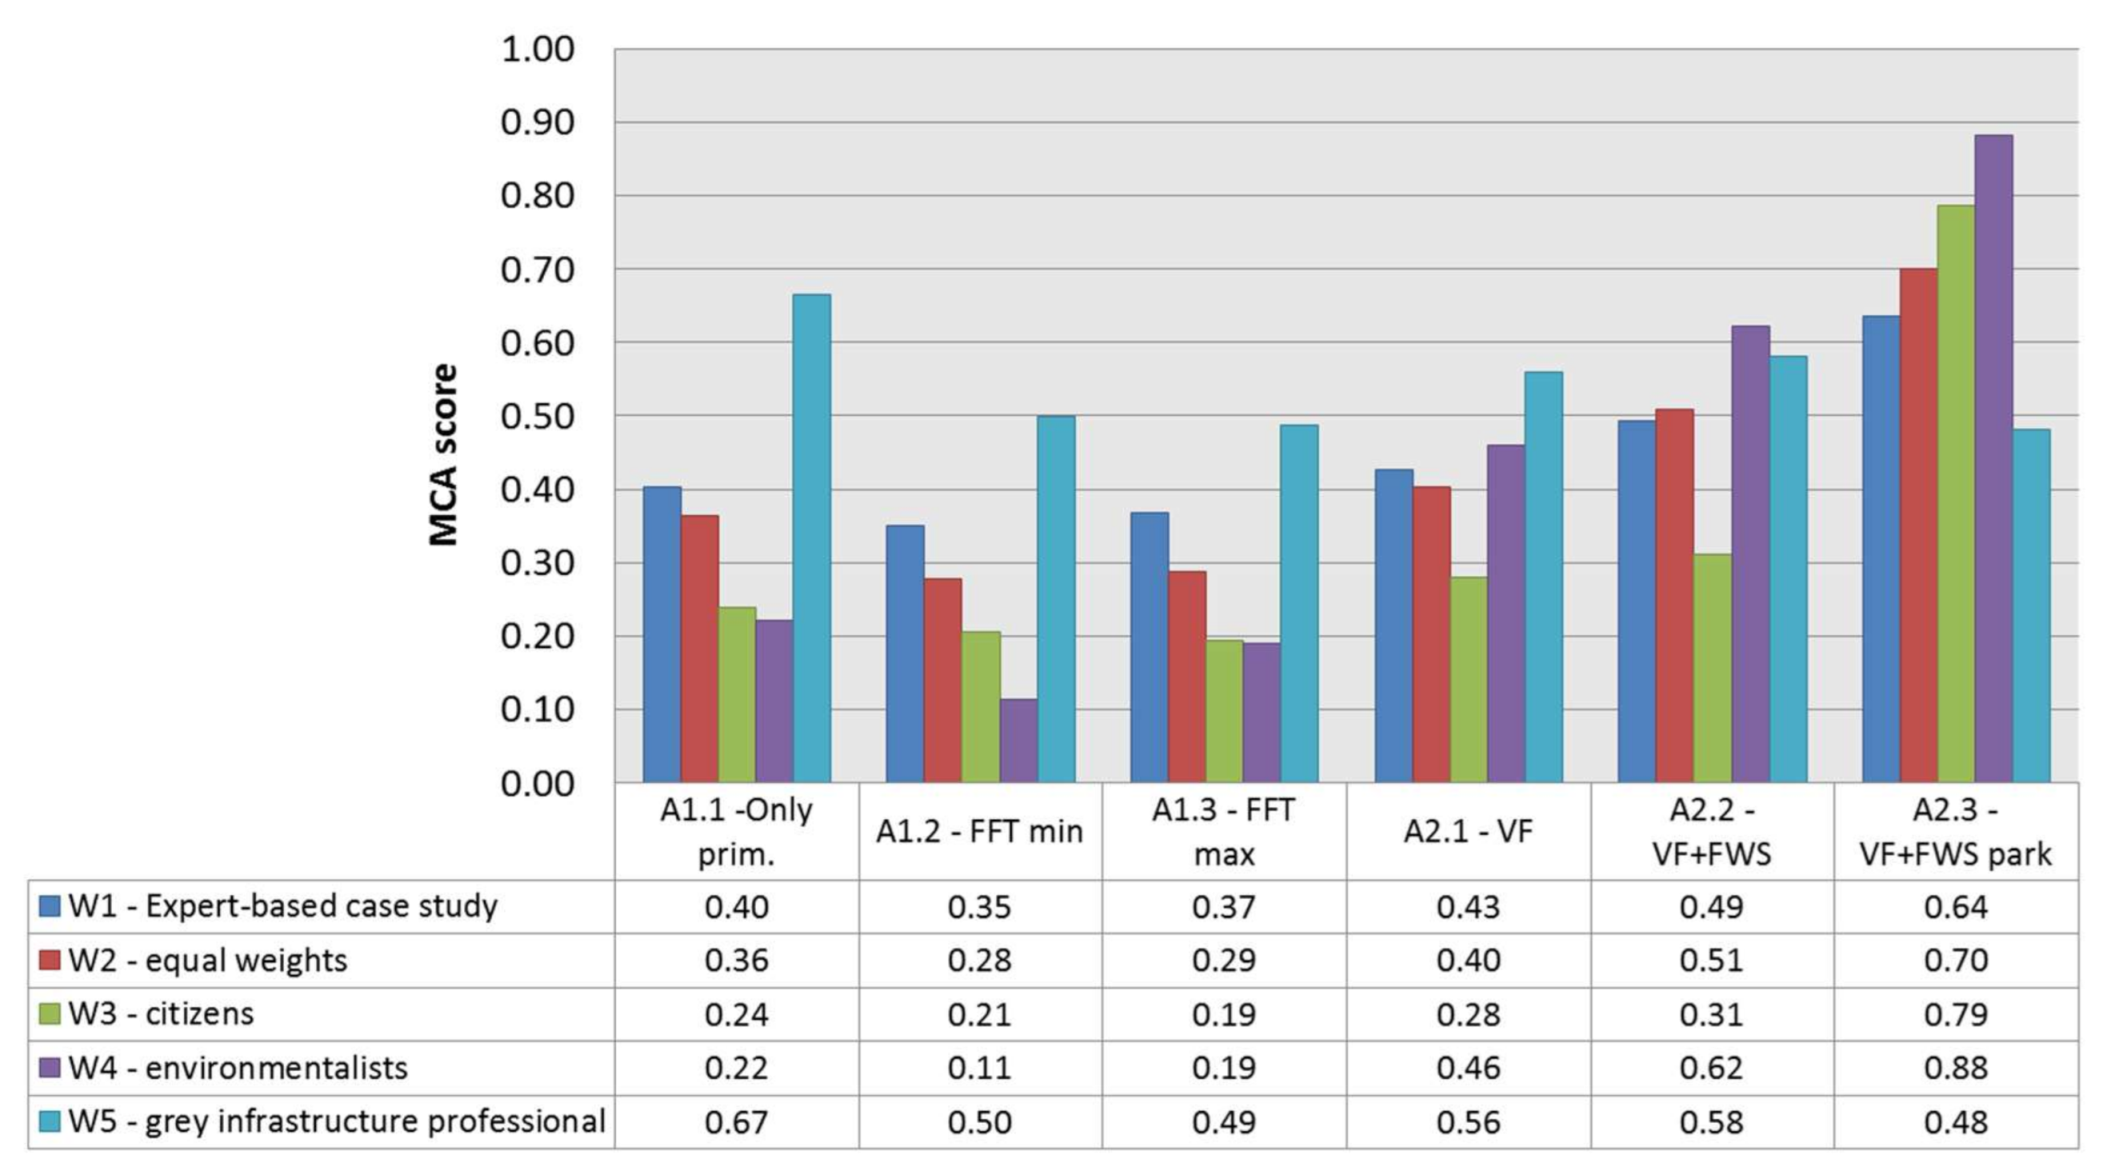
3.1. MCA Results
- An improvement of air quality is expected only by A2.3, i.e., the only one for which the plantation of new trees was planned.
- Biodiversity support is given by all the alternative using green infrastructures. A2.1 is evaluated with a lower biodiversity contribution, as only one habitat (Phragmites australis) is implemented, with no free water wetland. Alternatives A2.2 and A2.3, instead, are better rated, since they also use a FWS stage, which is able to support a greater number of species (especially dragonflies).
- The best balance between CO2 production (due to energy consumption) and sequestration (biomass stock) results for the alternative A2.2, even if a positive balance is estimated for all the alternatives that use green infrastructure.
- Environmental education benefits result only for green infrastructures, due to the minimal ability to attract educational activities with grey solutions. The capability to propose environmental education activities increase with the increase of habitat complexity and recreational value of the area, i.e., from A2.1 to A2.3.
- All the alternatives give a positive contribution in terms of water quality. The lower effect of A1.1 is due to the lower performance of primary treatment only compared to the others.
- Health and recreation ESs are activated only by A2.3, i.e., only when the alternative includes an urban park and, therefore, is properly designed to provide these additional side-benefits.
- Benefits in terms of reduction of wastewater to be treated by the centralized WWTP are delivered only by the alternatives that provide a continuous in-line treatment, i.e., A1.1 and green infrastructures.
- Better performance of grey infrastructure are linked to criteria requiring a lower areal footprint, since the CAPEX are lower and there is no need to reach an agreement with the Municipality of Milan for the land located outside the Buccinasco Municipality border.
- OPEX range from the lowest value obtained for A1.2 (and slightly higher A1.3), and the highest obtained for the “urban park” alternative, which show O&M costs an order of magnitude higher. The other 3 in-line alternatives show similar performances.
3.2. Sensitivity Analysis
4. Discussion
5. Conclusions
Author Contributions
Funding
Institutional Review Board Statement
Informed Consent Statement
Data Availability Statement
Acknowledgments
Conflicts of Interest
Abbreviation
| CSO | combined sewer overflow |
| CW | constructed wetland |
| ES | ecosystem services |
| MCA | Multi-criteria Analysis |
| NBS | Nature-based Solution |
| VT | value transfer |
References
- Masi, F.; Rizzo, A.; Regelsberger, M. The role of constructed wetlands in a new circular economy, resource oriented, and ecosystem services paradigm. J. Environ. Manag. 2018, 216, 275–284. [Google Scholar] [CrossRef]
- Stefanakis, A.I. The role of constructed wetlands as green infrastructure for sustainable urban water management. Sustainability 2019, 11, 6981. [Google Scholar] [CrossRef] [Green Version]
- Rizzo, A.; Bresciani, R.; Masi, F.; Boano, F.; Revelli, R.; Ridolfi, L. Flood reduction as an ecosystem service of constructed wetlands for combined sewer overflow. J. Hydrol. 2018, 560, 150–159. [Google Scholar] [CrossRef]
- Hsu, C.B.; Hsieh, H.L.; Yang, L.; Wu, S.H.; Chang, J.S.; Hsiao, S.C.; Su, H.C.; Yeh, C.H.; Ho, Y.S.; Lin, H.J. Biodiversity of constructed wetlands for wastewater treatment. Ecol. Eng. 2011, 37, 1533–1545. [Google Scholar] [CrossRef]
- Avellán, T.; Gremillion, P. Constructed wetlands for resource recovery in developing countries. Renew. Sustain. Energy Rev. 2019, 99, 42–57. [Google Scholar] [CrossRef]
- De Klein, J.J.; van der Werf, A.K. Balancing carbon sequestration and GHG emissions in a constructed wetland. Ecol. Eng. 2014, 66, 36–42. [Google Scholar] [CrossRef]
- Mitsch, W.J.; Bernal, B.; Nahlik, A.M.; Mander, Ü.; Zhang, L.; Anderson, C.J.; Jørgensen, S.E.; Brix, H. Wetlands, carbon, and climate change. Landsc. Ecol. 2013, 28, 583–597. [Google Scholar] [CrossRef]
- Ghermandi, A.; Fichtman, E. Cultural ecosystem services of multifunctional constructed treatment wetlands and waste stabilization ponds: Time to enter the mainstream? Ecol. Eng. 2015, 84, 615–623. [Google Scholar] [CrossRef]
- Grizzetti, B.; Liquete, C.; Antunes, P.; Carvalho, L.; Geamănă, N.; Giucă, R.; Leone, M.; McConnell, S.; Preda, E.; Santos, R.; et al. Ecosystem services for water policy: Insights across Europe. Environ. Sci. Policy 2016, 66, 179–190. [Google Scholar] [CrossRef] [Green Version]
- Masi, F.; Rizzo, A.; Bresciani, R.; Conte, G. Constructed wetlands for combined sewer overflow treatment: Ecosystem services at Gorla Maggiore, Italy. Ecol. Eng. 2017, 98, 427–438. [Google Scholar] [CrossRef]
- Liquete, C.; Udias, A.; Conte, G.; Grizzetti, B.; Masi, F. Integrated valuation of a nature-based solution for water pollution control. Highlighting hidden benefits. Ecosyst. Serv. 2016, 22, 392–401. [Google Scholar] [CrossRef]
- Reynaud, A.; Lanzanova, D.; Liquete, C.; Grizzetti, B. Going green? Ex-post valuation of a multipurpose water infrastructure in Northern Italy. Ecosyst. Serv. 2017, 27, 70–81. [Google Scholar] [CrossRef]
- Rizzo, A.; Tondera, K.; Pálfy, T.G.; Dittmer, U.; Meyer, D.; Schreiber, C.; Zacharias, N.; Ruppelt, J.P.; Esser, D.; Molle, P.; et al. Constructed wetlands for combined sewer overflow treatment: A state-of-the-art review. Sci. Total Environ. 2020, 727, 138618. [Google Scholar] [CrossRef]
- Rolfe, J.; Johnston, R.J.; Rosenberger, R.S.; Brouwer, R. Introduction: Benefit Transfer of Environmental and Resource Values. In Benefit Transfer of Environmental and Resource Values; Johnston, R.J., Rolfe, J., Rosenberger, R.S., Brower, R., Eds.; Springer: Dordrecht, The Netherlands, 2015; pp. 3–17. [Google Scholar]
- Ghermandi, A.; Van Den Bergh, J.C.; Brander, L.M.; De Groot, H.L.; Nunes, P.A. Values of natural and human-made wetlands: A meta-analysis. Water Resour. Res. 2010, 46, 1–12. [Google Scholar] [CrossRef] [Green Version]
- Woodward, R.T.; Wui, Y.S. The economic value of wetland services: A meta-analysis. Ecol. Econ. 2001, 37, 257–270. [Google Scholar] [CrossRef]
- Brander, L.; Brouwer, R.; Wagtendonk, A. Economic valuation of regulating services provided by wetlands in agricultural landscapes: A meta-analysis. Ecol. Eng. 2013, 56, 89–96. [Google Scholar] [CrossRef]
- He, J.; Moffette, F.; Fournier, R.; Revéret, J.P.; Théau, J.; Dupras, J.; Boyer, J.P.; Varin, M. Meta-analysis for the transfer of economic benefits of ecosystem services provided by wetlands within two watersheds in Quebec, Canada. Wetl. Ecol. Manag. 2015, 23, 707–725. [Google Scholar] [CrossRef]
- Brander, L. Guidance Manual on Value Transfer Methods for Ecosystem Services; Publishing Services Section, UNON: Nairobi, Kenya, 2013. [Google Scholar]
- Gómez-Baggethun, E.; Barton, D.N. Classifying and valuing ecosystem services for urban planning. Ecol. Econ. 2013, 86, 235–245. [Google Scholar] [CrossRef]
- Barton, D.N.; Kelemen, E.; Dick, J.; Martin-Lopez, B.; Gómez-Baggethun, E.; Jacobs, S.; Hendriks, C.M.A.; Termansen, M.; García-Llorente, M.; Primmer, E.; et al. (Dis) integrated valuation–Assessing the information gaps in ecosystem service appraisals for governance support. Ecosyst. Serv. 2018, 29, 529–541. [Google Scholar] [CrossRef] [Green Version]
- Ashley, R.M.; Digman, C.J.; Horton, B.; Gersonius, B.; Smith, B.; Shaffer, P.; Baylis, A. Evaluating the longer term benefits of sustainable drainage. In Proceedings of the Institution of Civil Engineers-Water Management; Thomas Telford Ltd.: London, UK, 2018; Volume 171, pp. 57–66. [Google Scholar]
- Hamann, F.; Blecken, G.T.; Ashley, R.M.; Viklander, M. Valuing the Multiple Benefits of Blue-Green Infrastructure for a Swedish Case Study: Contrasting the Economic Assessment Tools B£ ST and TEEB. J. Sustain. Water Built Environ. 2020, 6, 05020003. [Google Scholar] [CrossRef]
- Barton, D.N. Value Transfer Method. Metod Factsheet. In EU FP7 OpenNESS Project Deliverable 3.3–4.4; Integrated Valuation of Ecosystem Services. Guidelines and Experiences. European Commission FP7; Barton, D.N., Harrison, P.A., Eds.; European Commission: Luxembourg, 2017. [Google Scholar]
- Maucieri, C.; Barbera, A.C.; Vymazal, J.; Borin, M. A review on the main affecting factors of greenhouse gases emission in constructed wetlands. Agric. For. Meteorol. 2017, 236, 175–193. [Google Scholar] [CrossRef]
- Raymond, C.M.; Frantzeskaki, N.; Kabisch, N.; Berry, P.; Breil, M.; Nita, M.R.; Geneletti, D.; Calfapietra, C. A framework for assessing and implementing the co-benefits of nature-based solutions in urban areas. Environ. Sci. Policy 2017, 77, 15–24. [Google Scholar] [CrossRef]
- Rizzo, A.; Bresciani, R.; Martinuzzi, N.; Masi, F. French reed bed as a solution to minimize the operational and maintenance costs of wastewater treatment from a small settlement: An Italian example. Water 2018, 10, 156. [Google Scholar] [CrossRef] [Green Version]
- Beinat, E.; Nijkamp, P. Multicriteria Analysis for Land-Use Management; Springer Science & Business Media: Berlin, Germany, 1998; Volume 9. [Google Scholar]
- Alarcon, B.; Aguado, A.; Manga, R.; Josa, A. A value function for assessing sustainability: Application to industrial buildings. Sustainability 2011, 3, 35–50. [Google Scholar] [CrossRef] [Green Version]
- Seddon, N.; Chausson, A.; Berry, P.; Girardin, C.A.; Smith, A.; Turner, B. Understanding the value and limits of nature-based solutions to climate change and other global challenges. Philos. Trans. R. Soc. B 2020, 375, 20190120. [Google Scholar] [CrossRef] [PubMed] [Green Version]


| Criteria | Orient. | Indicator | W1 | W2 | W3 | W4 | W5 | |||||
|---|---|---|---|---|---|---|---|---|---|---|---|---|
| A | N | A | N | A | N | A | N | A | N | |||
| Air quality | + | € life span | 7 | 0.09 | 10 | 0.09 | 10 | 0.18 | 10 | 0.13 | 2 | 0.03 |
| Biodiversity | + | € life span | 5 | 0.06 | 10 | 0.09 | 2 | 0.04 | 10 | 0.13 | 2 | 0.03 |
| C reduction and sequestration | + | € life span | 5 | 0.06 | 10 | 0.09 | 0 | 0.00 | 10 | 0.13 | 2 | 0.03 |
| Education | + | € life span | 7 | 0.09 | 10 | 0.09 | 7 | 0.13 | 7 | 0.09 | 2 | 0.03 |
| Water quality | + | € life span | 10 | 0.12 | 10 | 0.09 | 3 | 0.05 | 10 | 0.13 | 7 | 0.12 |
| Health | + | € life span | 7 | 0.09 | 10 | 0.09 | 10 | 0.18 | 7 | 0.09 | 2 | 0.03 |
| Recreation | + | € life span | 7 | 0.09 | 10 | 0.09 | 10 | 0.18 | 5 | 0.07 | 2 | 0.03 |
| Wastewater treatment | + | € life span | 5 | 0.06 | 10 | 0.09 | 2 | 0.04 | 10 | 0.13 | 10 | 0.17 |
| Administrative issues | - | Expert judgment | 8 | 0.10 | 10 | 0.09 | 0 | 0.00 | 0 | 0.00 | 10 | 0.17 |
| CAPEX | - | € | 10 | 0.12 | 10 | 0.09 | 5 | 0.09 | 2 | 0.03 | 10 | 0.17 |
| OPEX | € y−1 | 10 | 0.12 | 10 | 0.09 | 7 | 0.13 | 4 | 0.05 | 10 | 0.17 | |
| ES | Confidence Scores 1 | Assumed Information for VT | ||
|---|---|---|---|---|
| Q | V | Type/Proxy | Value | |
| Air quality | 50% | 100% | no. and type of trees | A2.3
|
| Biodiversity | 50% | 25% VF 100% FWS | wetland area | A2.1, A2.2, A2.3
|
| Carbon reductionand sequestration | 25% trees 50% CW | 100% | no. and type of trees energy consumption wetland area | All the alternatives
|
| Education | 25% | 50% | no. of studentsper year | Environmental education activities of the group of interest 5:
|
| Water quality | 25% | 25% | no. of NWEBS categories with a change in water quality classification 6 Local context Length of the water course with improved quality | Change in water quality classification: Bad to Poor no. of NWBES changes:
0.5 km of water course with improved quality 8 |
| Health | 25% | 50% | no. of visits per year | A2.3 9
|
| Recreation | 25% | 50% | no. of visits per year | A2.3 9
|
| Treating wastewater | 50% | 100% | Daily average flow not discharged in sewer | A1.2, A2.1, A2.2., A2.3
|
| Item | A1.1 prim. Only | A1.2 FFT min | A1.3 FFT max | A2.1 VF | A2.2 VF + FWS | A2.3 VF + FWS Park |
|---|---|---|---|---|---|---|
| Grid | 100,000 € | - € | - € | 100,000 € | 100,000 € | 100,000 € |
| Sedimentation tank | 190,000 € | - € | - € | - € | - € | - € |
| Grit chamber | - € | - € | - € | 25,000 € | 25,000 € | 25,000 € |
| First flush tank | - € | 512,000 € | 1,024,000 € | - € | - € | - € |
| Pumping station | - € | - € | - € | 30,000 € | 30,000 € | 30,000 € |
| Pumps | - € | - € | - € | 60,000 € | 60,000 € | 60,000 € |
| Piping | - € | - € | - € | 44,000 € | 44,000 € | 44,000 € |
| Culvert | - € | - € | - € | 10,000 € | 10,000 € | 10,000 € |
| VF | - € | - € | - € | 360,000 € | 360,000 € | 360,000 € |
| FWS | - € | - € | - € | - € | 60,000 € | 60,000 € |
| Pedestrian path | - € | - € | - € | - € | - € | 10,000 € |
| Bike trail | - € | - € | - € | - € | - € | 15,000 € |
| Rest area | - € | - € | - € | - € | - € | 6000 € |
| Trees | - € | - € | - € | - € | - € | 25,000 € |
| Benches | - € | - € | - € | - € | - € | 3000 € |
| Racks | - € | - € | - € | - € | - € | 500 € |
| Lighting | - € | - € | - € | - € | - € | 13,000 € |
| Playground | - € | - € | - € | - € | - € | 20,000 € |
| Boardwalk | - € | - € | - € | - € | - € | 50,000 € |
| Land acquisition | 8500 € | 8800 € | 17,600 € | 146,000 € | 191,000 € | 395,000 € |
| Total CAPEX | 298,500 € | 520,800 € | 1,041,600 € | 775,000 € | 880,000 € | 1,226,500 € |
| Energy 1 | 200 € y−1 | 500 € y−1 | 900 € y−1 | 600€ y−1 | 600 € y−1 | 3900 € y−1 |
| Sludge removal 2 | 1500 € y−1 | - € y−1 | - € y−1 | - € y−1 | - € y−1 | - € y−1 |
| Reed harvesting 3 | - € y−1 | - € y−1 | - € y−1 | 1100 € y−1 | 1100 € y−1 | 1100 € y−1 |
| Green maintenance 3 | - € y−1 | - € y−1 | - € y−1 | 100 € y−1 | 200 € y−1 | 7500 € y−1 |
| Personnel 4 | 900 € y−1 | 900 € y−1 | 900 € y−1 | 700 € y−1 | 900 € y−1 | 1500 € y−1 |
| Total OPEX | 2600 € y−1 | 1400 € y−1 | 1800 € y−1 | 2500 € y−1 | 2800 € y−1 | 14,000 € y−1 |
| Criteria | Orient. | A1.1 prim. Only | A1.2 FFT min | A1.3 FFT max | A2.1 VF | A2.2 VF + FWS | A2.3 VF + FWS Park |
|---|---|---|---|---|---|---|---|
| Air quality 1 | + | 0 € | 0 € | 0 € | 0 € | 0 € | 11,240 € |
| Biodiversity 1 | + | 0 € | 0 € | 0 € | 264 € | 719 € | 719 € |
| Carbon reduction and sequestration 1 | + | - 84 € | - 209 € | - 334€ | 919 € | 2139 € | 1420 € |
| Education 1 | + | 0 € | 0 € | 0 € | 5254 € | 10,508 € | 31,525 € |
| Water quality 1 | + | 1786 € | 2679 € | 5359 € | 5359 € | 5359 € | 5359 € |
| Health 1 | + | 0 € | 0 € | 0 € | 0 € | 0 € | 141,099 € |
| Recreation 1 | + | 0 € | 0 € | 0 € | 0 € | 0 € | 73,085 € |
| Wastewater Treatment 1 | + | 19,021 € | 0 € | 0 € | 19,021 € | 19,021 € | 19,021 € |
| Administrative issues | + | 1 | 1 | 1 | 0 | 0 | 0 |
| CAPEX | - | 298,500 € | 520,800 € | 1,041,600 € | 775,000 € | 880,000 € | 1,226,500 € |
| OPEX | - | 2600 € y−1 | 1400 € y−1 | 1800 € y−1 | 2500 € y−1 | 2800 € y−1 | 14,000 € y−1 |
| Alternative | VT Method | ES Prov. 1 | ES Regul. 2 | ES Cult. 3 | ES Supp. 4 | ES Total | OPEX | |
|---|---|---|---|---|---|---|---|---|
| [€ y−1] | [€ y−1] | [€ y−1] | [€ y−1] | [€ y−1] | [€ y−1 ha−1] 5 | [€ y−1] | ||
| A2.1 VF | U | 2131 | 4933 | 2355 | 61 | 9480 | 12,986 | 2552 |
| AU | 1066 | 352 | 294 | 15 | 1726 | 2365 | ||
| A2.2 VF + FWS | U | 2131 | 4933 | 4710 | 86 | 11,860 | 12,419 | 2848 |
| AU | 1066 | 412 | 589 | 40 | 2115 | 2214 | ||
| A2.3 VF + FWS park | U | 2131 | 6442 | 110,350 | 86 | 119,010 | 60,258 | 13,955 |
| AU | 1066 | 981 | 13,794 | 40 | 15,881 | 8041 | ||
Publisher’s Note: MDPI stays neutral with regard to jurisdictional claims in published maps and institutional affiliations. |
© 2021 by the authors. Licensee MDPI, Basel, Switzerland. This article is an open access article distributed under the terms and conditions of the Creative Commons Attribution (CC BY) license (http://creativecommons.org/licenses/by/4.0/).
Share and Cite
Rizzo, A.; Conte, G.; Masi, F. Adjusted Unit Value Transfer as a Tool for Raising Awareness on Ecosystem Services Provided by Constructed Wetlands for Water Pollution Control: An Italian Case Study. Int. J. Environ. Res. Public Health 2021, 18, 1531. https://doi.org/10.3390/ijerph18041531
Rizzo A, Conte G, Masi F. Adjusted Unit Value Transfer as a Tool for Raising Awareness on Ecosystem Services Provided by Constructed Wetlands for Water Pollution Control: An Italian Case Study. International Journal of Environmental Research and Public Health. 2021; 18(4):1531. https://doi.org/10.3390/ijerph18041531
Chicago/Turabian StyleRizzo, Anacleto, Giulio Conte, and Fabio Masi. 2021. "Adjusted Unit Value Transfer as a Tool for Raising Awareness on Ecosystem Services Provided by Constructed Wetlands for Water Pollution Control: An Italian Case Study" International Journal of Environmental Research and Public Health 18, no. 4: 1531. https://doi.org/10.3390/ijerph18041531