
Local Characteristics Related to SARS-CoV-2 Transmissions in the Seoul Metropolitan Area, South Korea


Abstract
:1. Introduction
2. Data and Methods
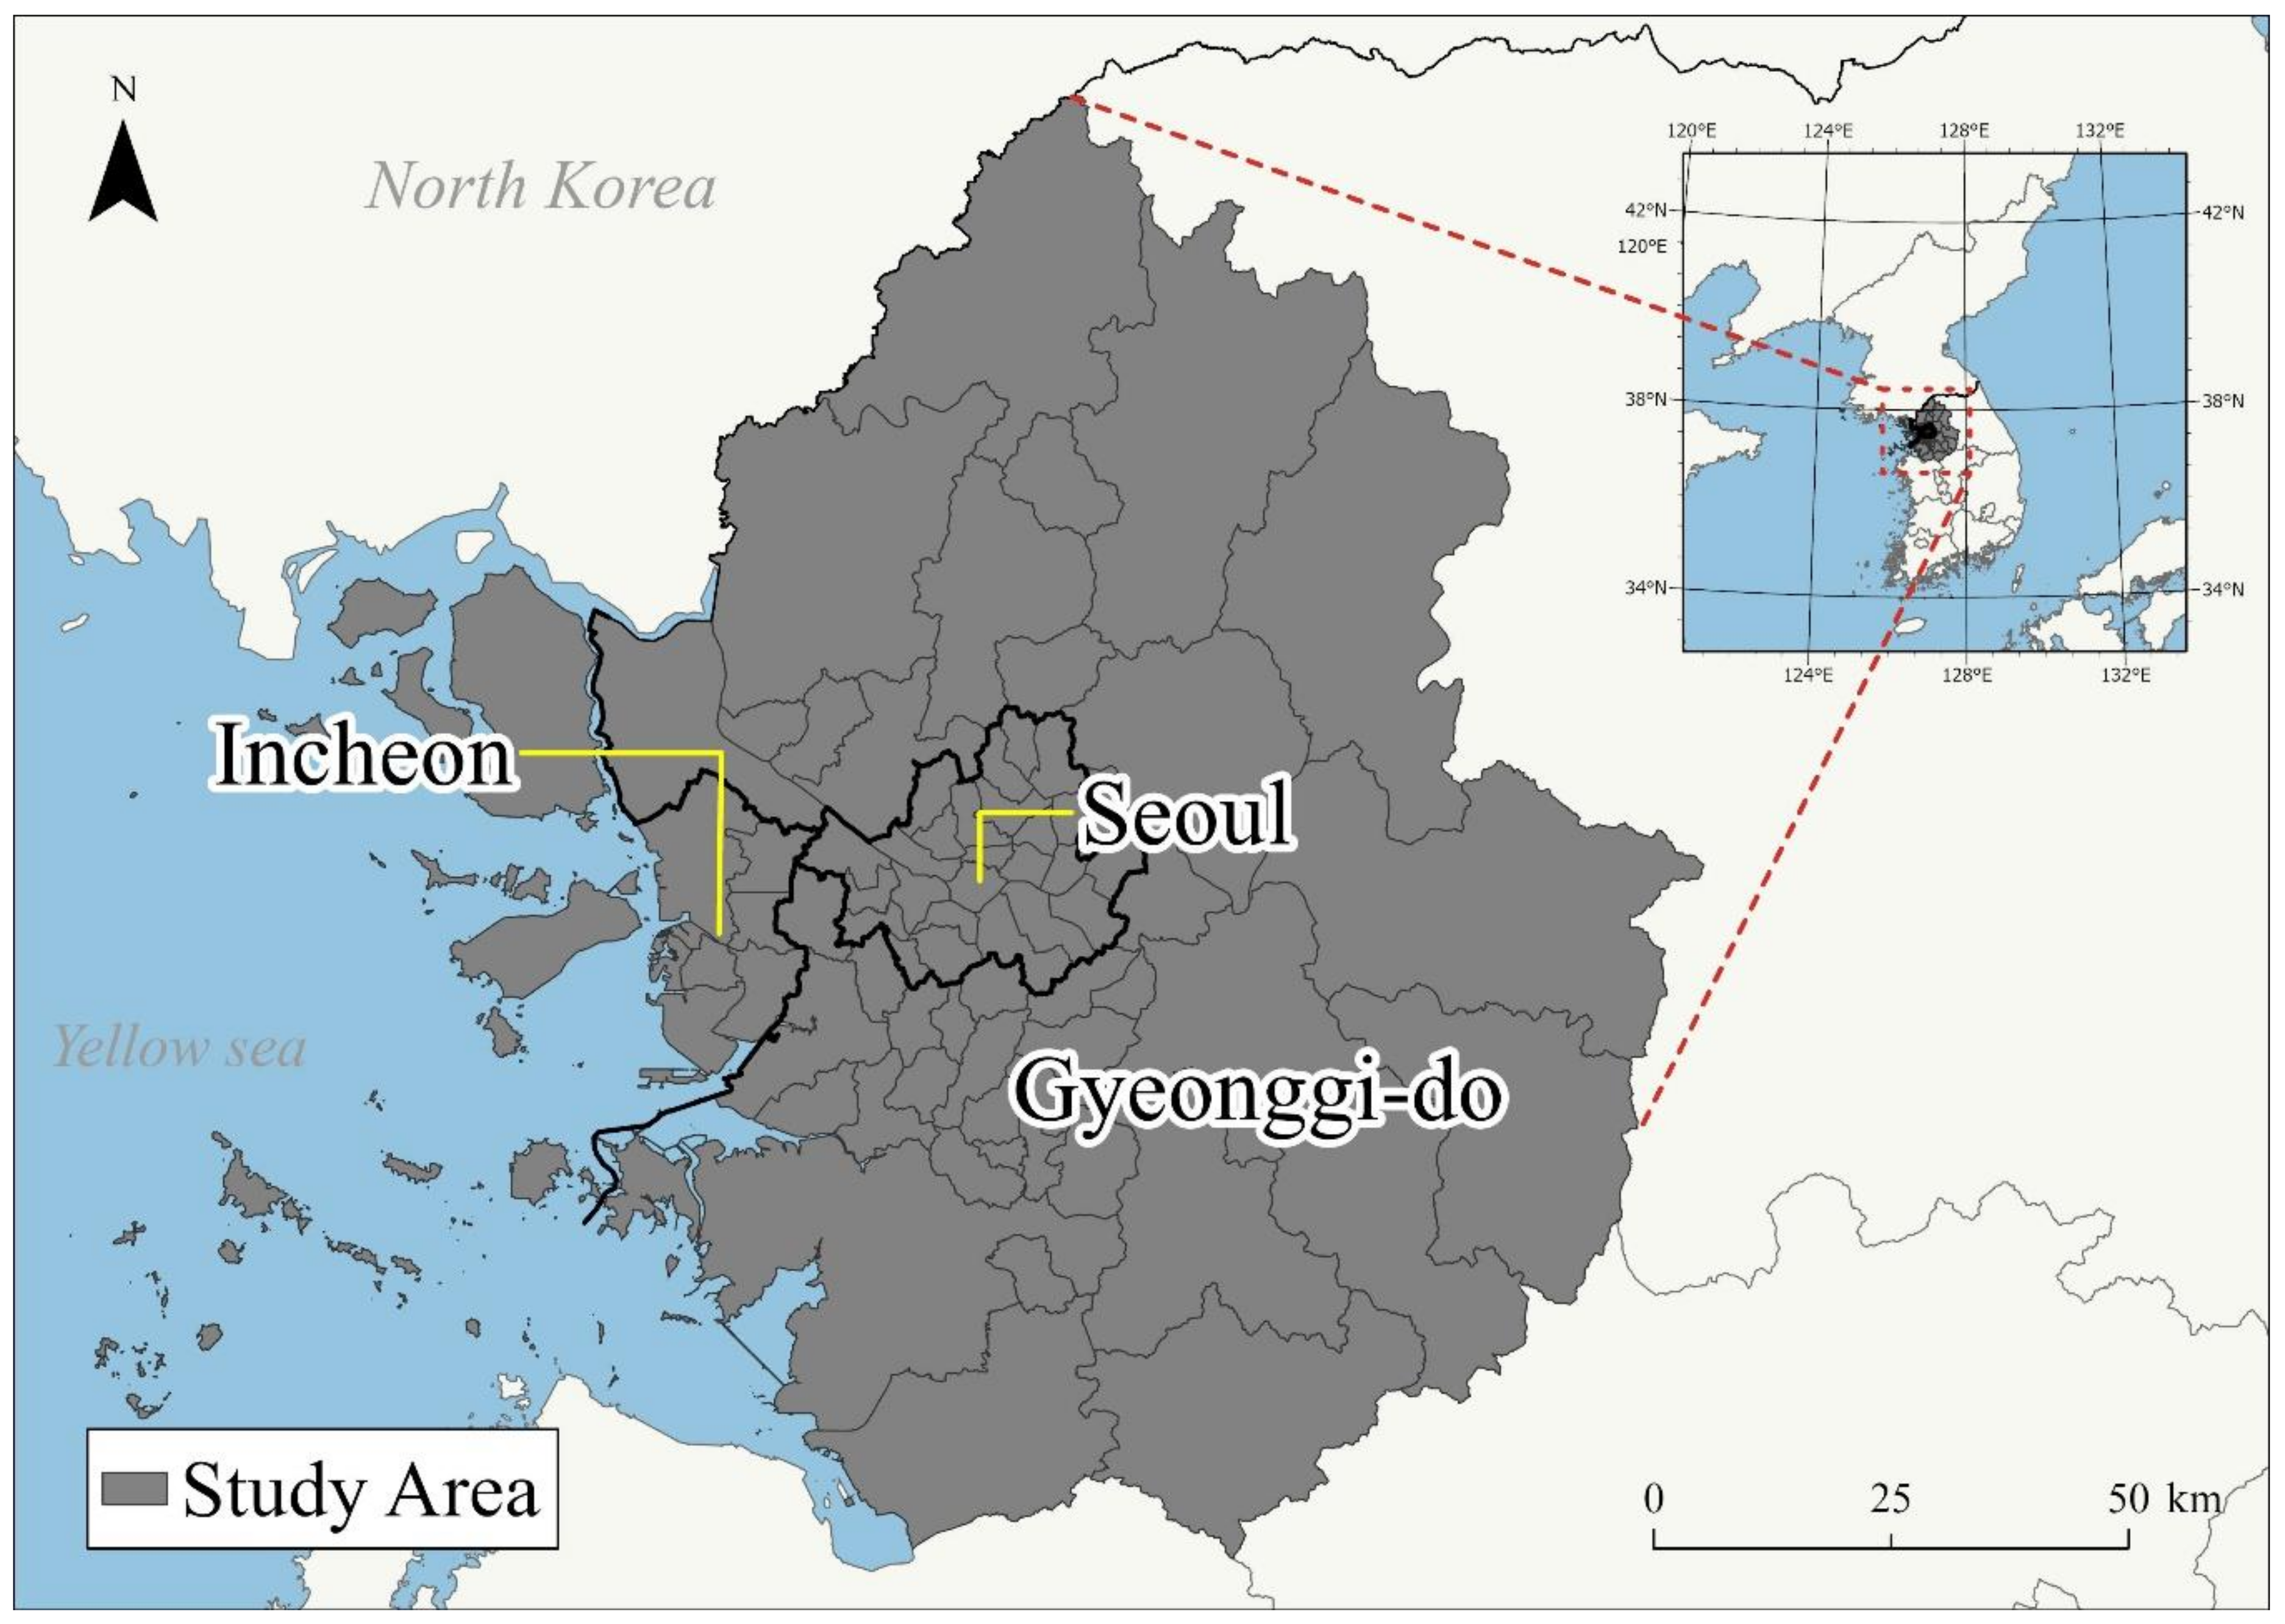
2.1. Data
2.1.1. Study Data
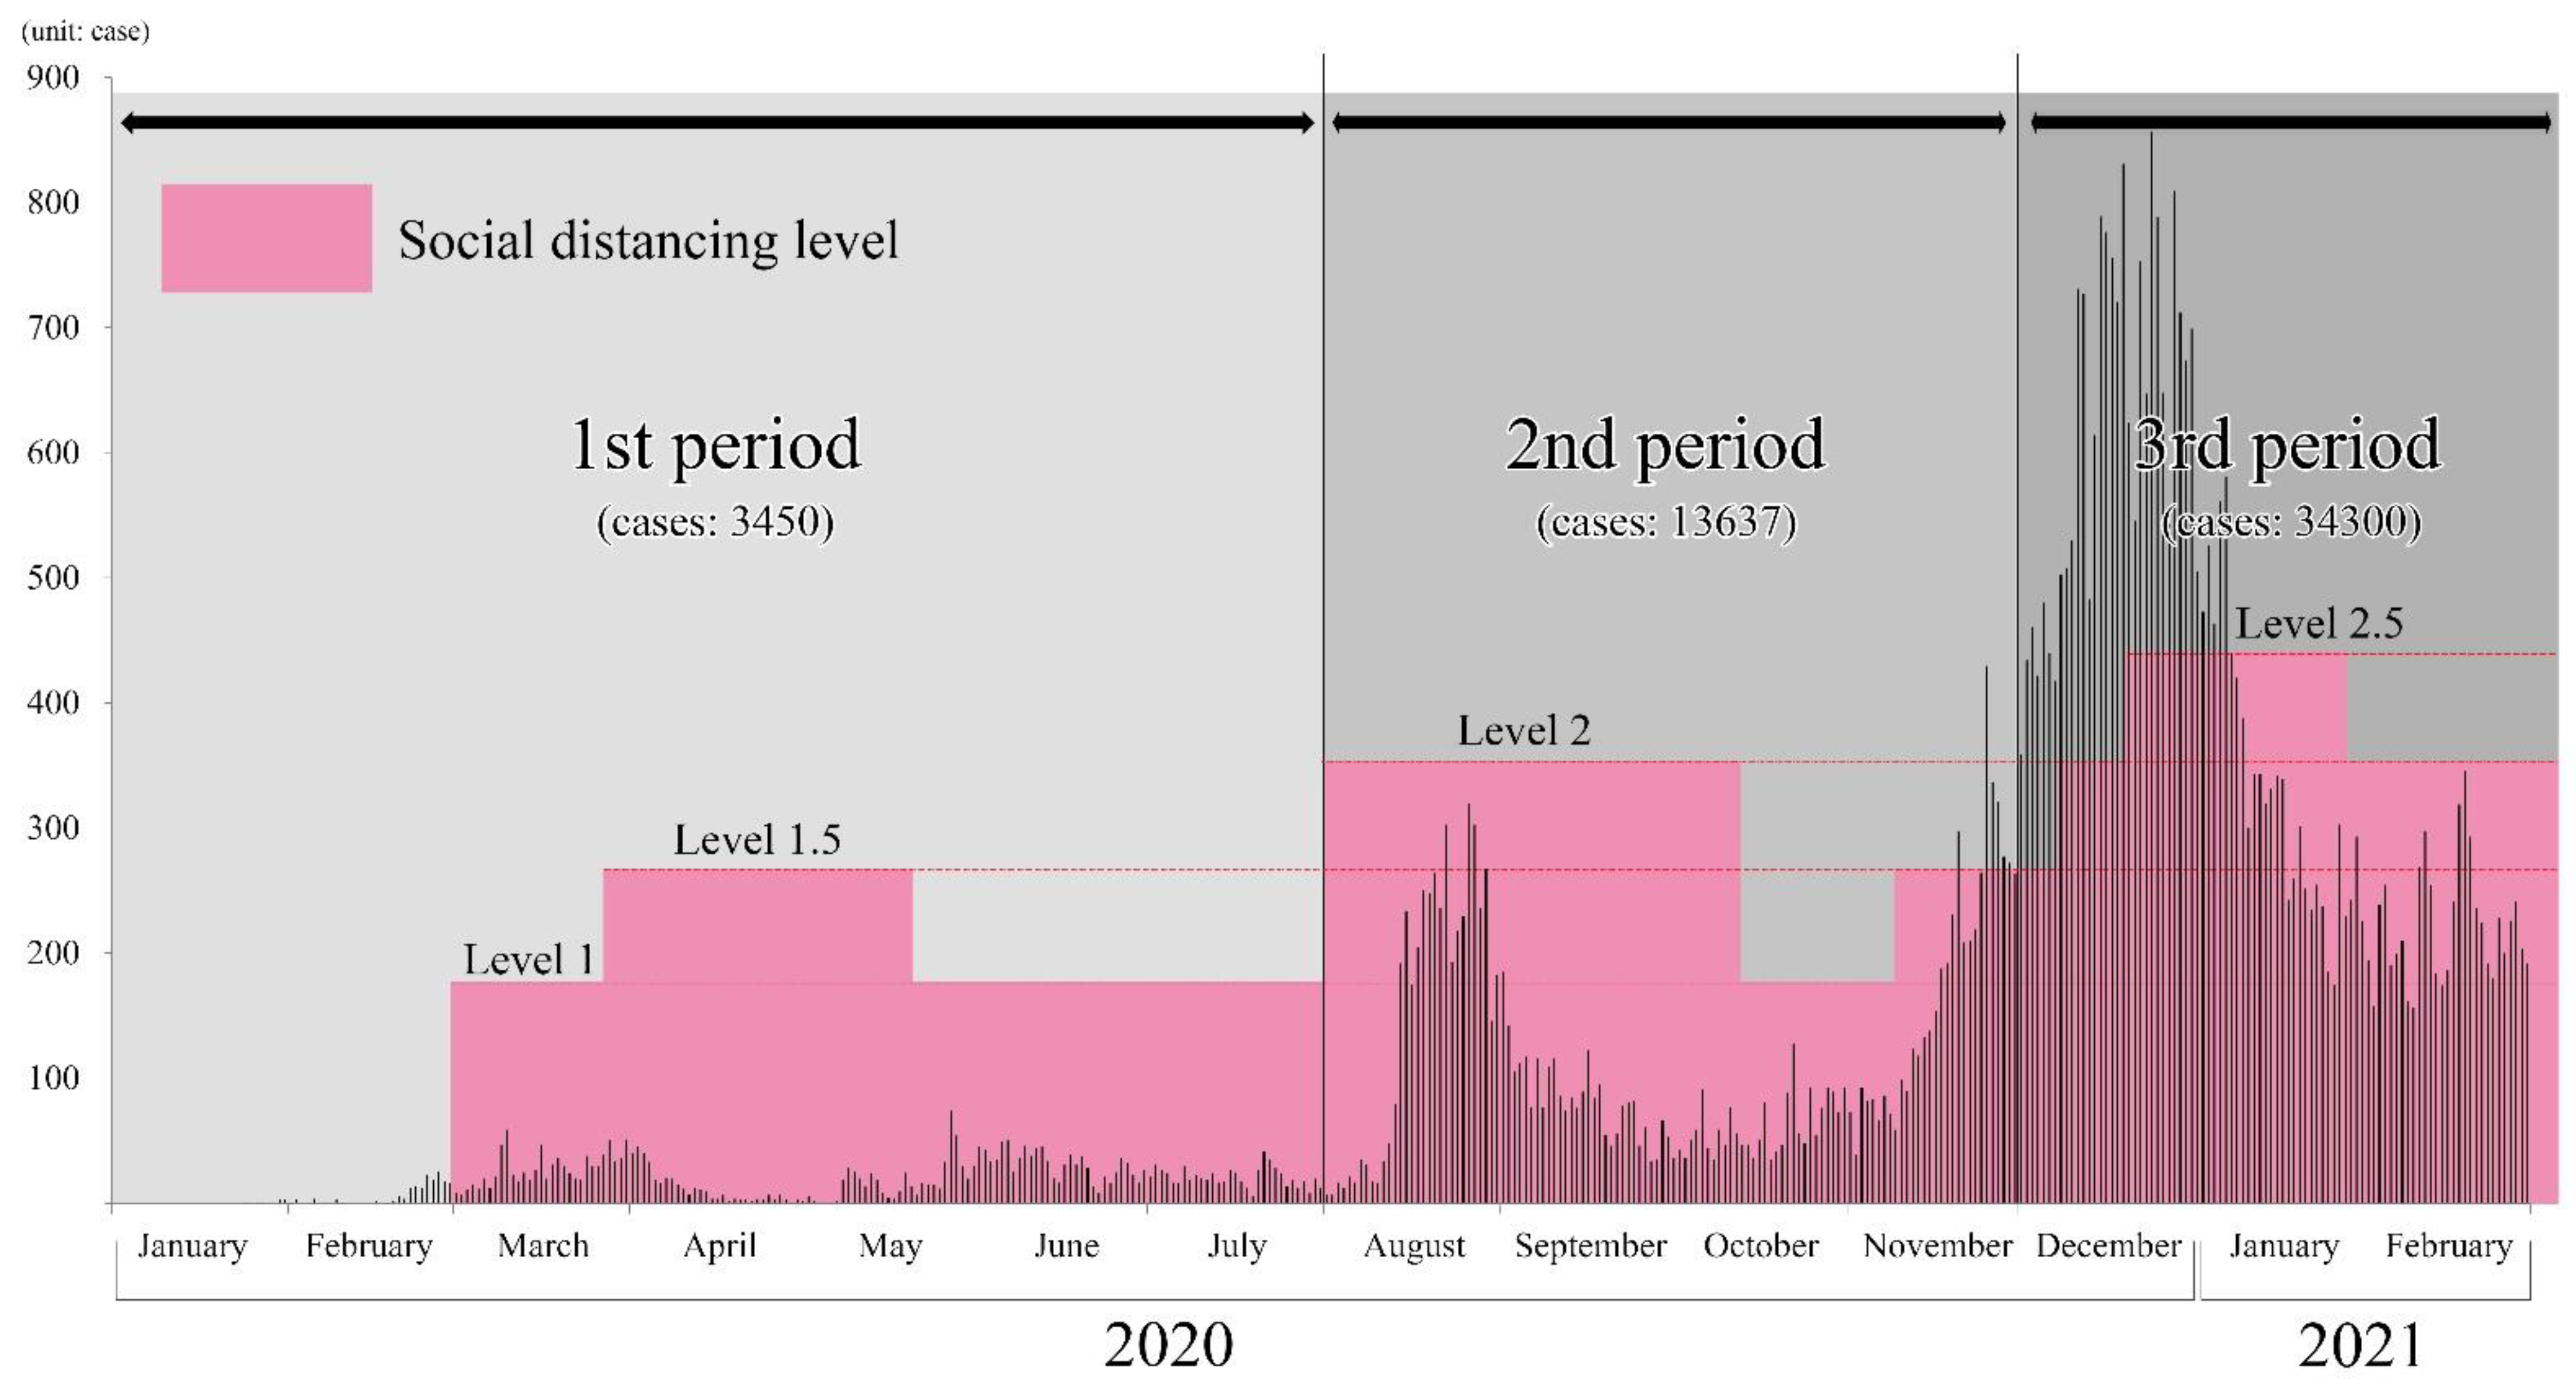
2.1.2. COVID-19 Cases
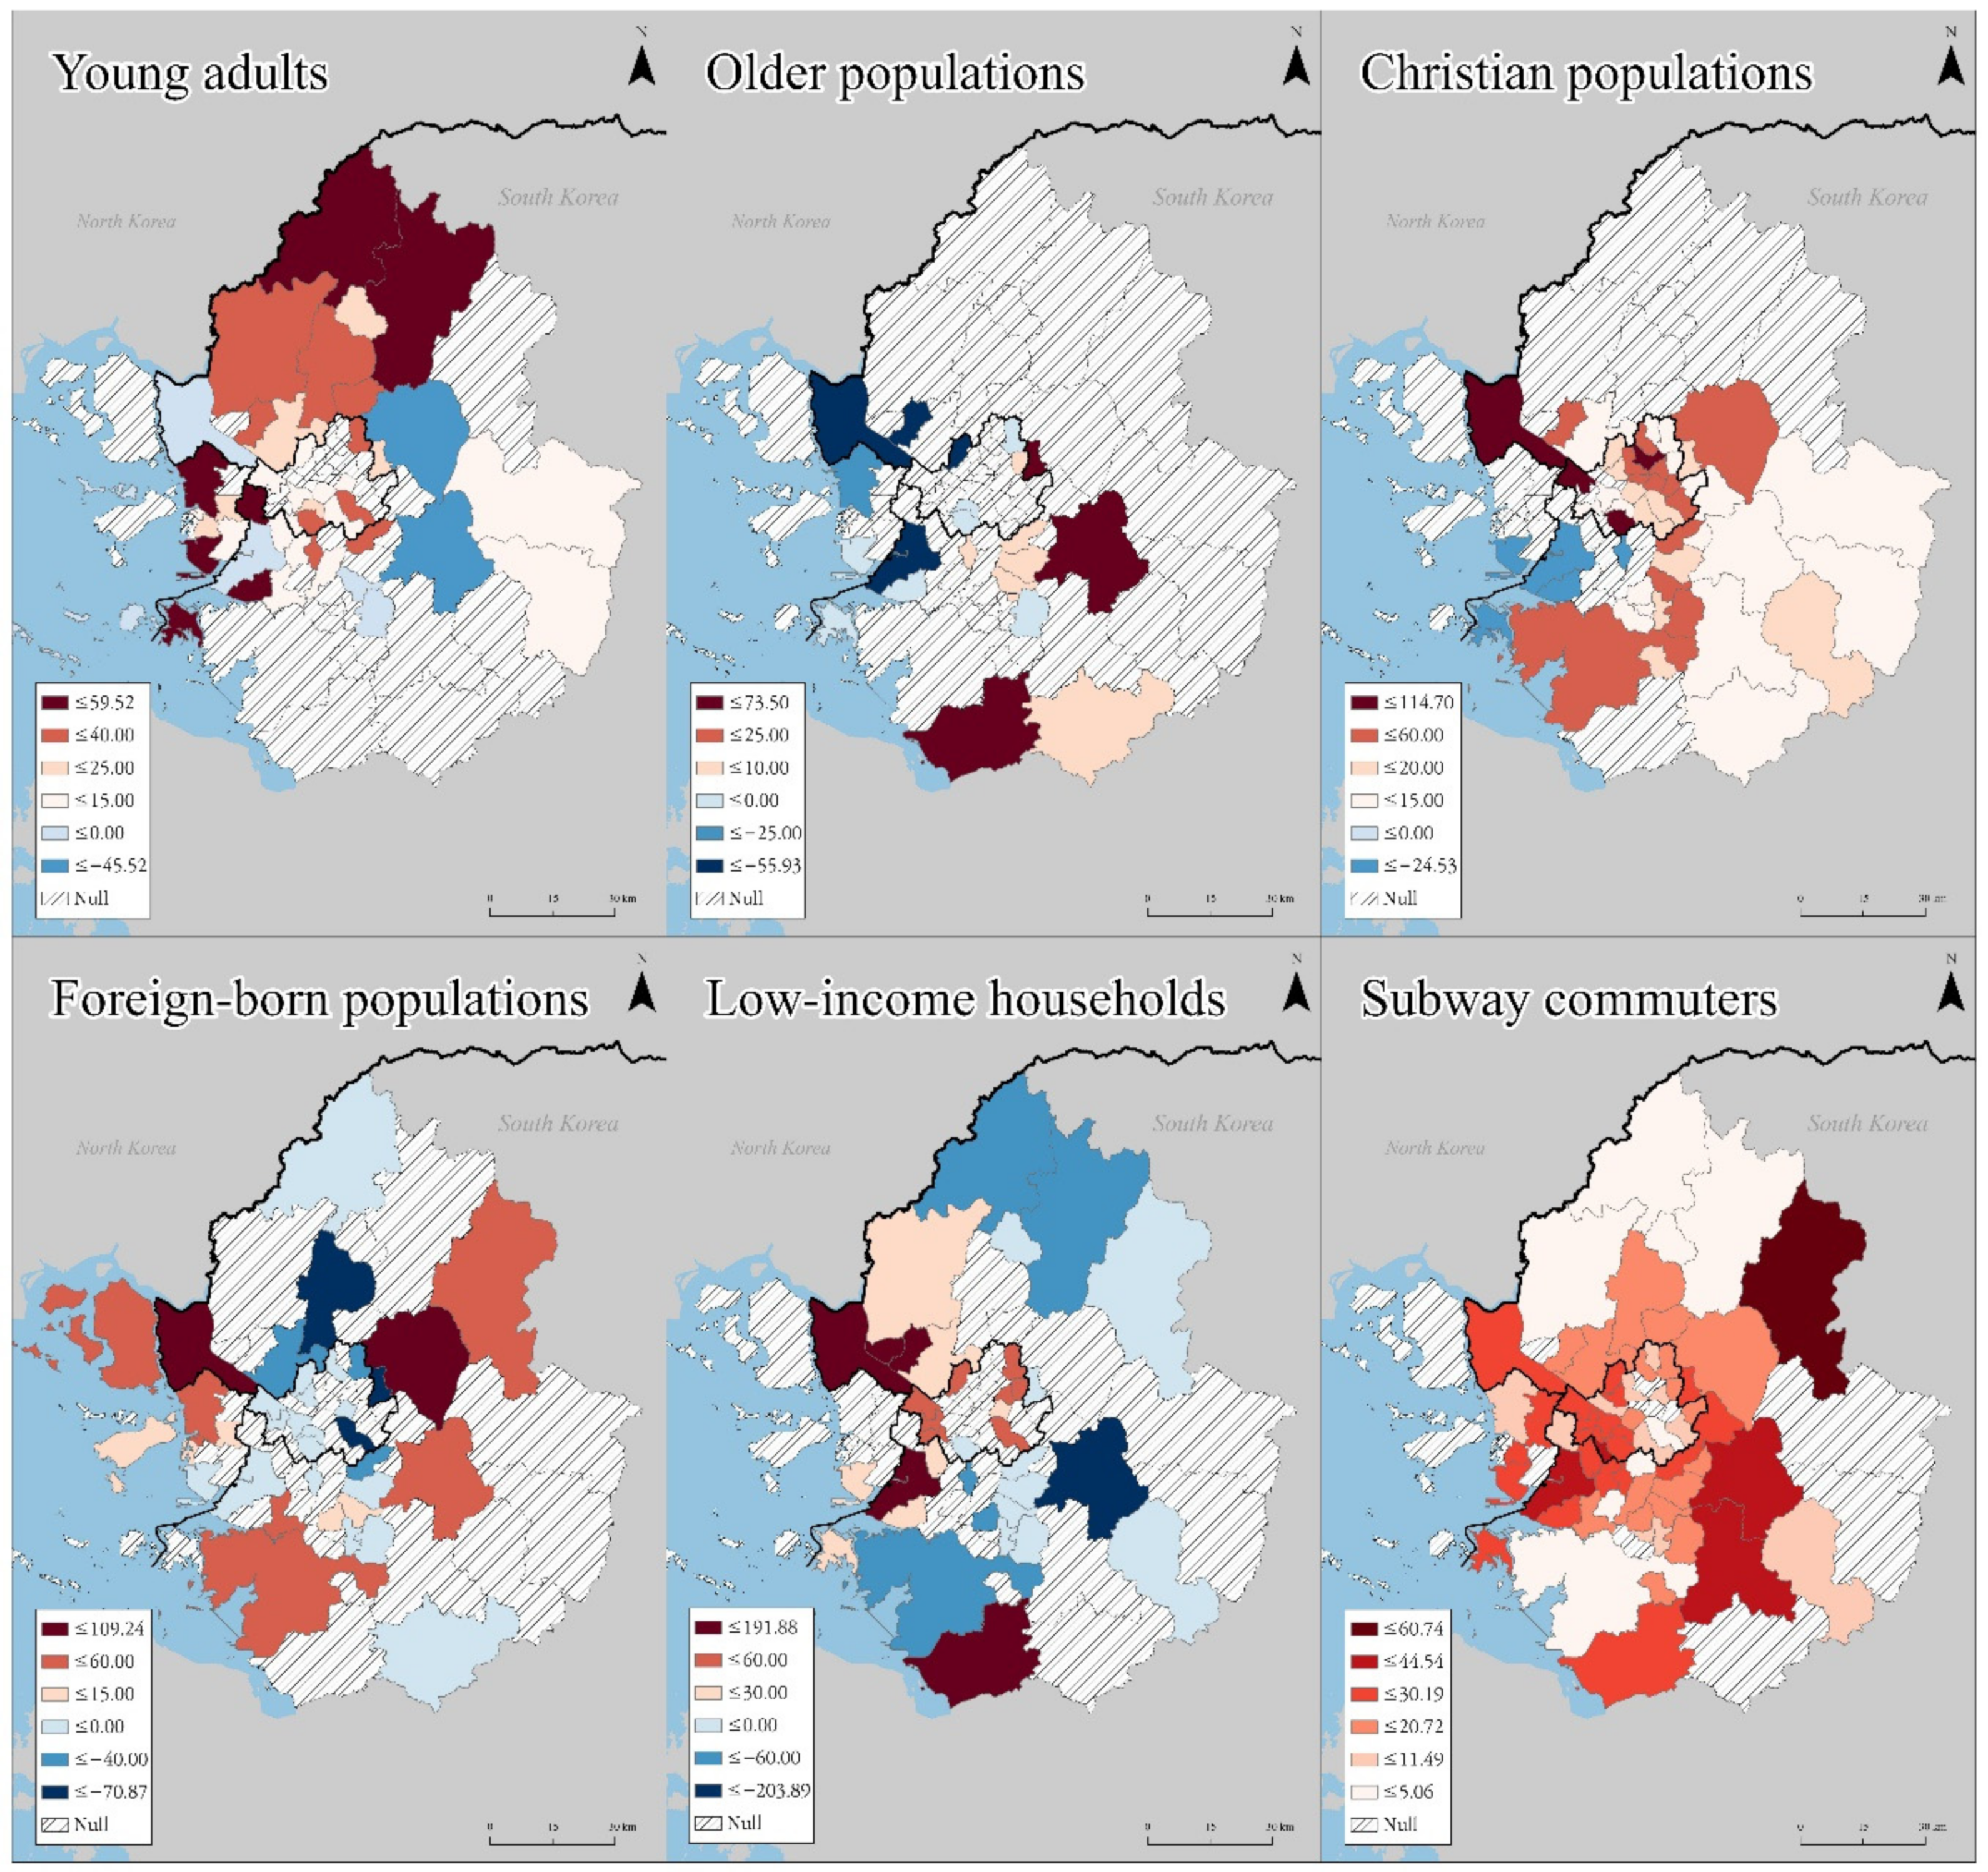
2.1.3. Demographic and Socio-Economic Variables
- Young adults (aged 19 to 34 years)
- Older population (aged 65 years and above)
- Christian population
- Foreign-born population
- Low-income households
- Subway commuters
2.2. Method
2.2.1. Poisson Regression Model
2.2.2. Geographically Weighted Lasso (GWL)
3. Results and Discussion
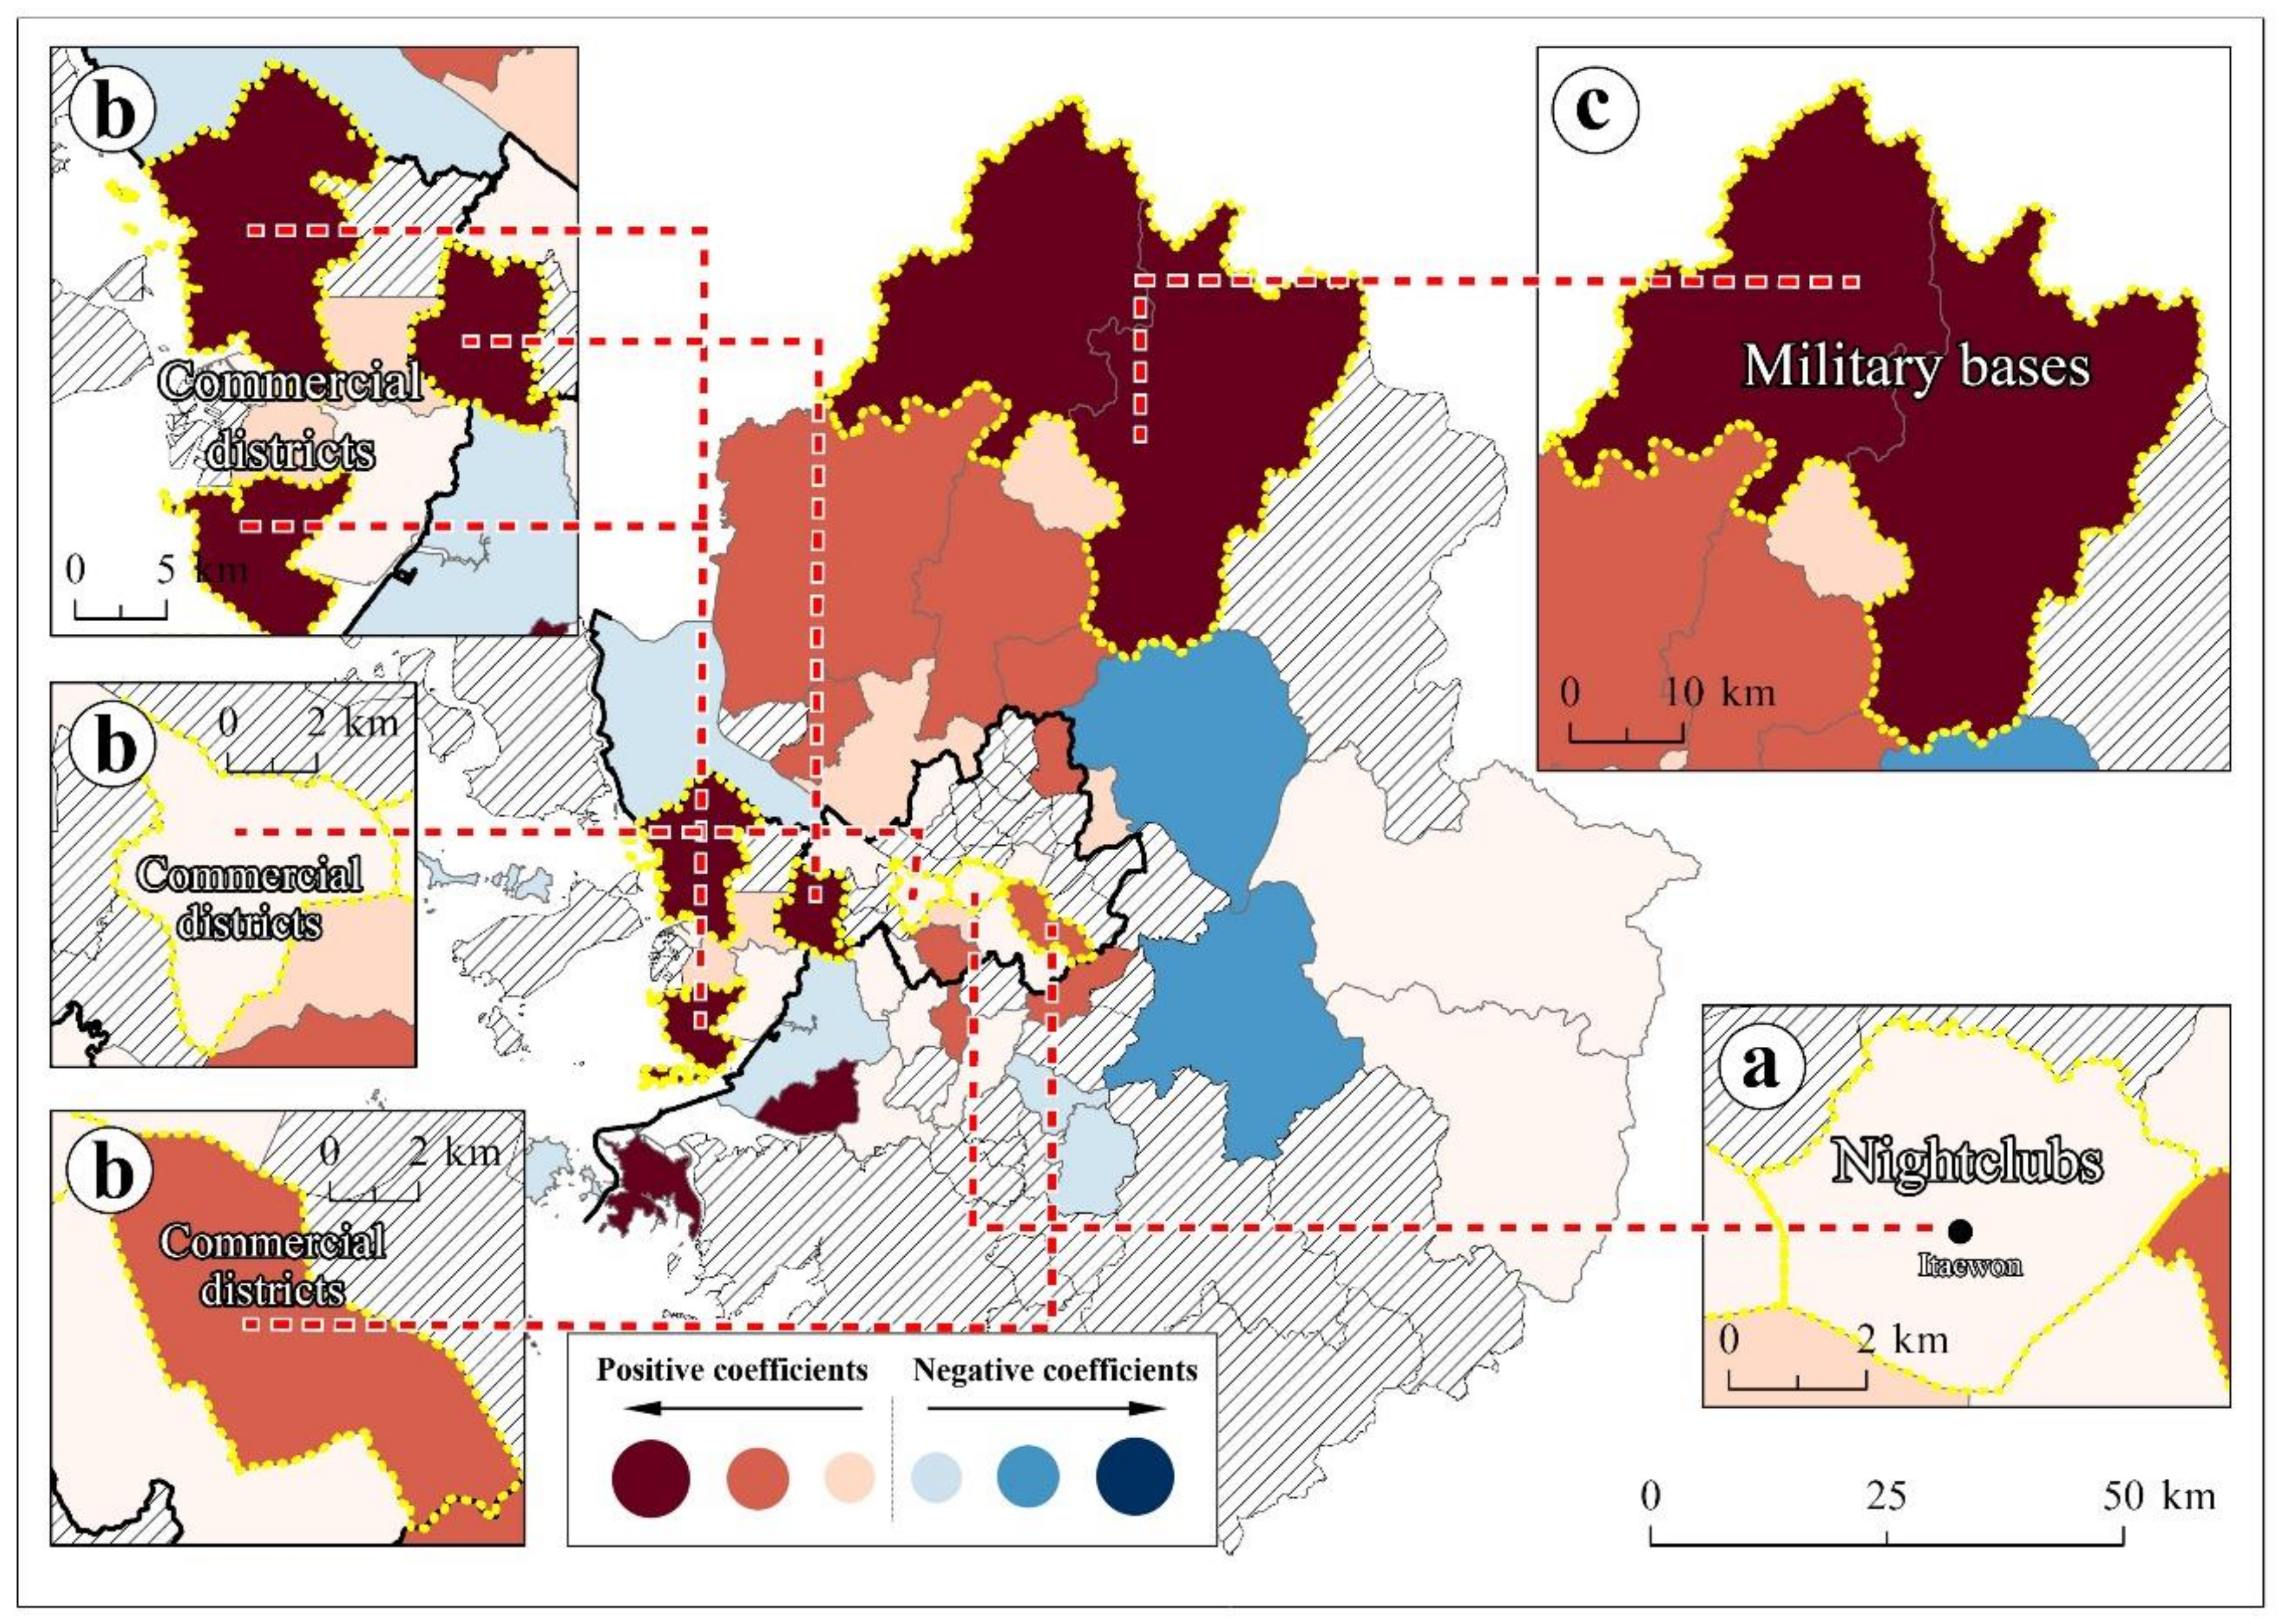
- (1)
- Young adults (aged 19 to 34 years)
- (2)
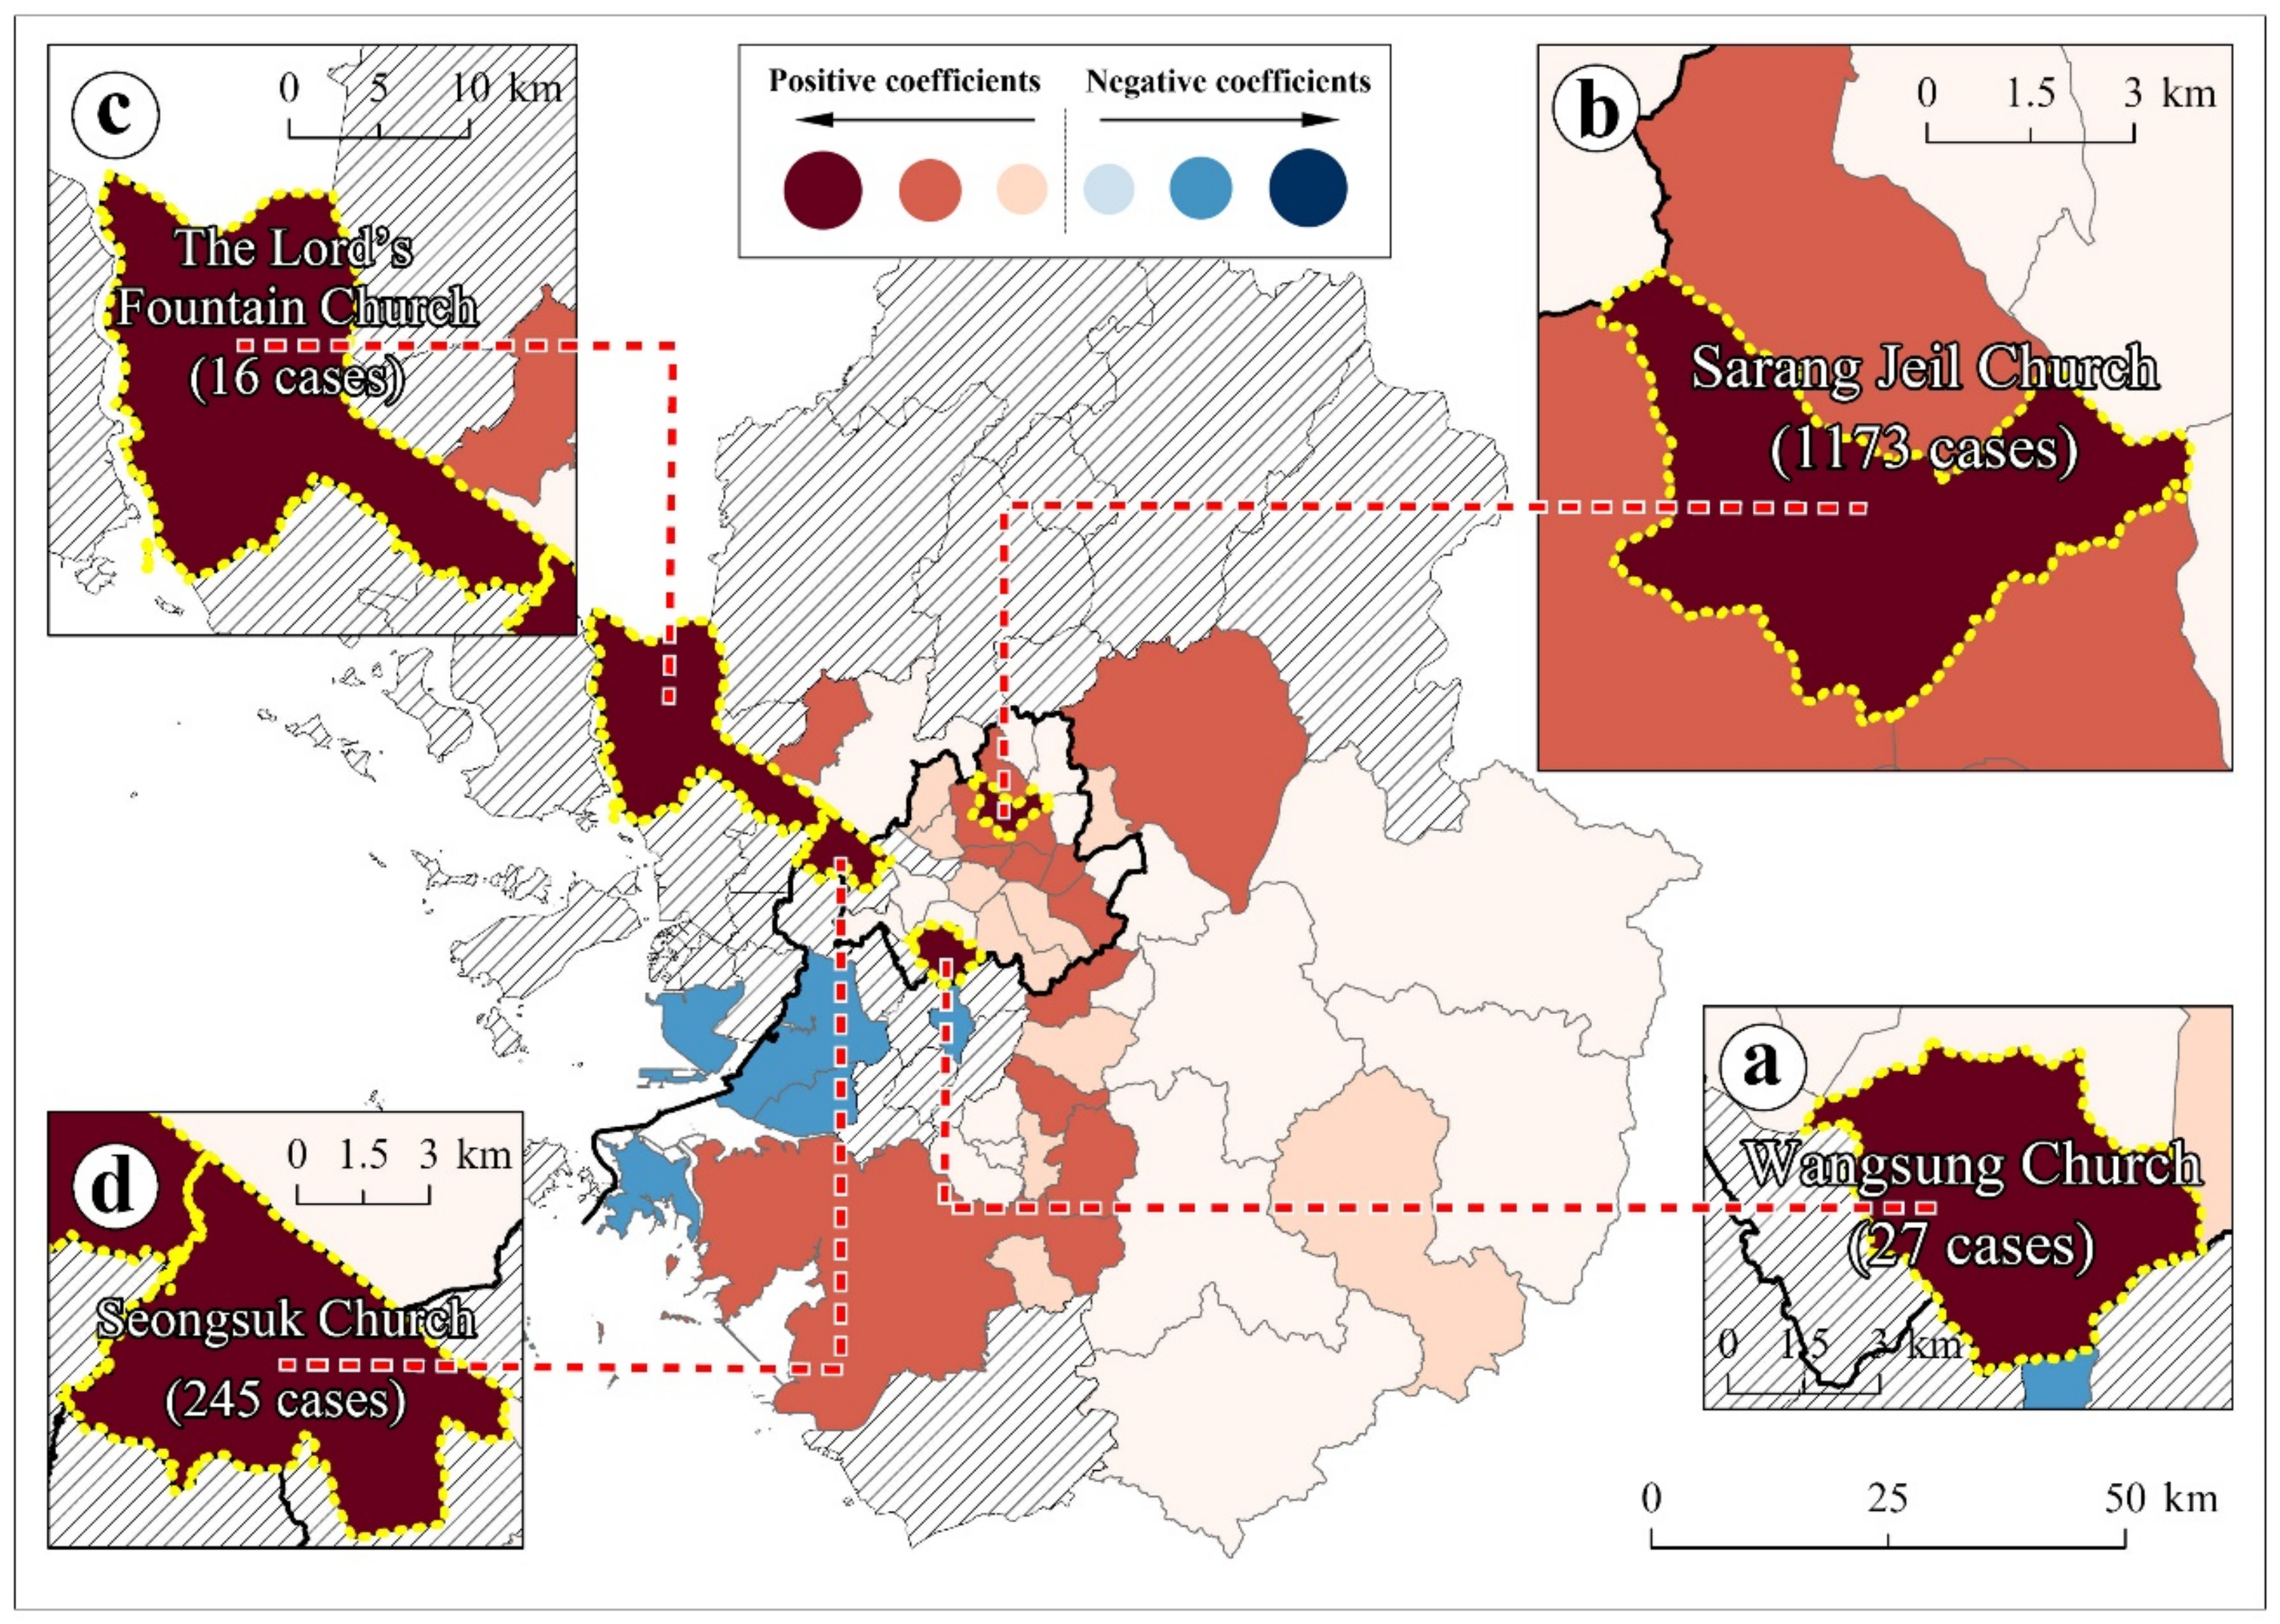
- Christian population
- (3)
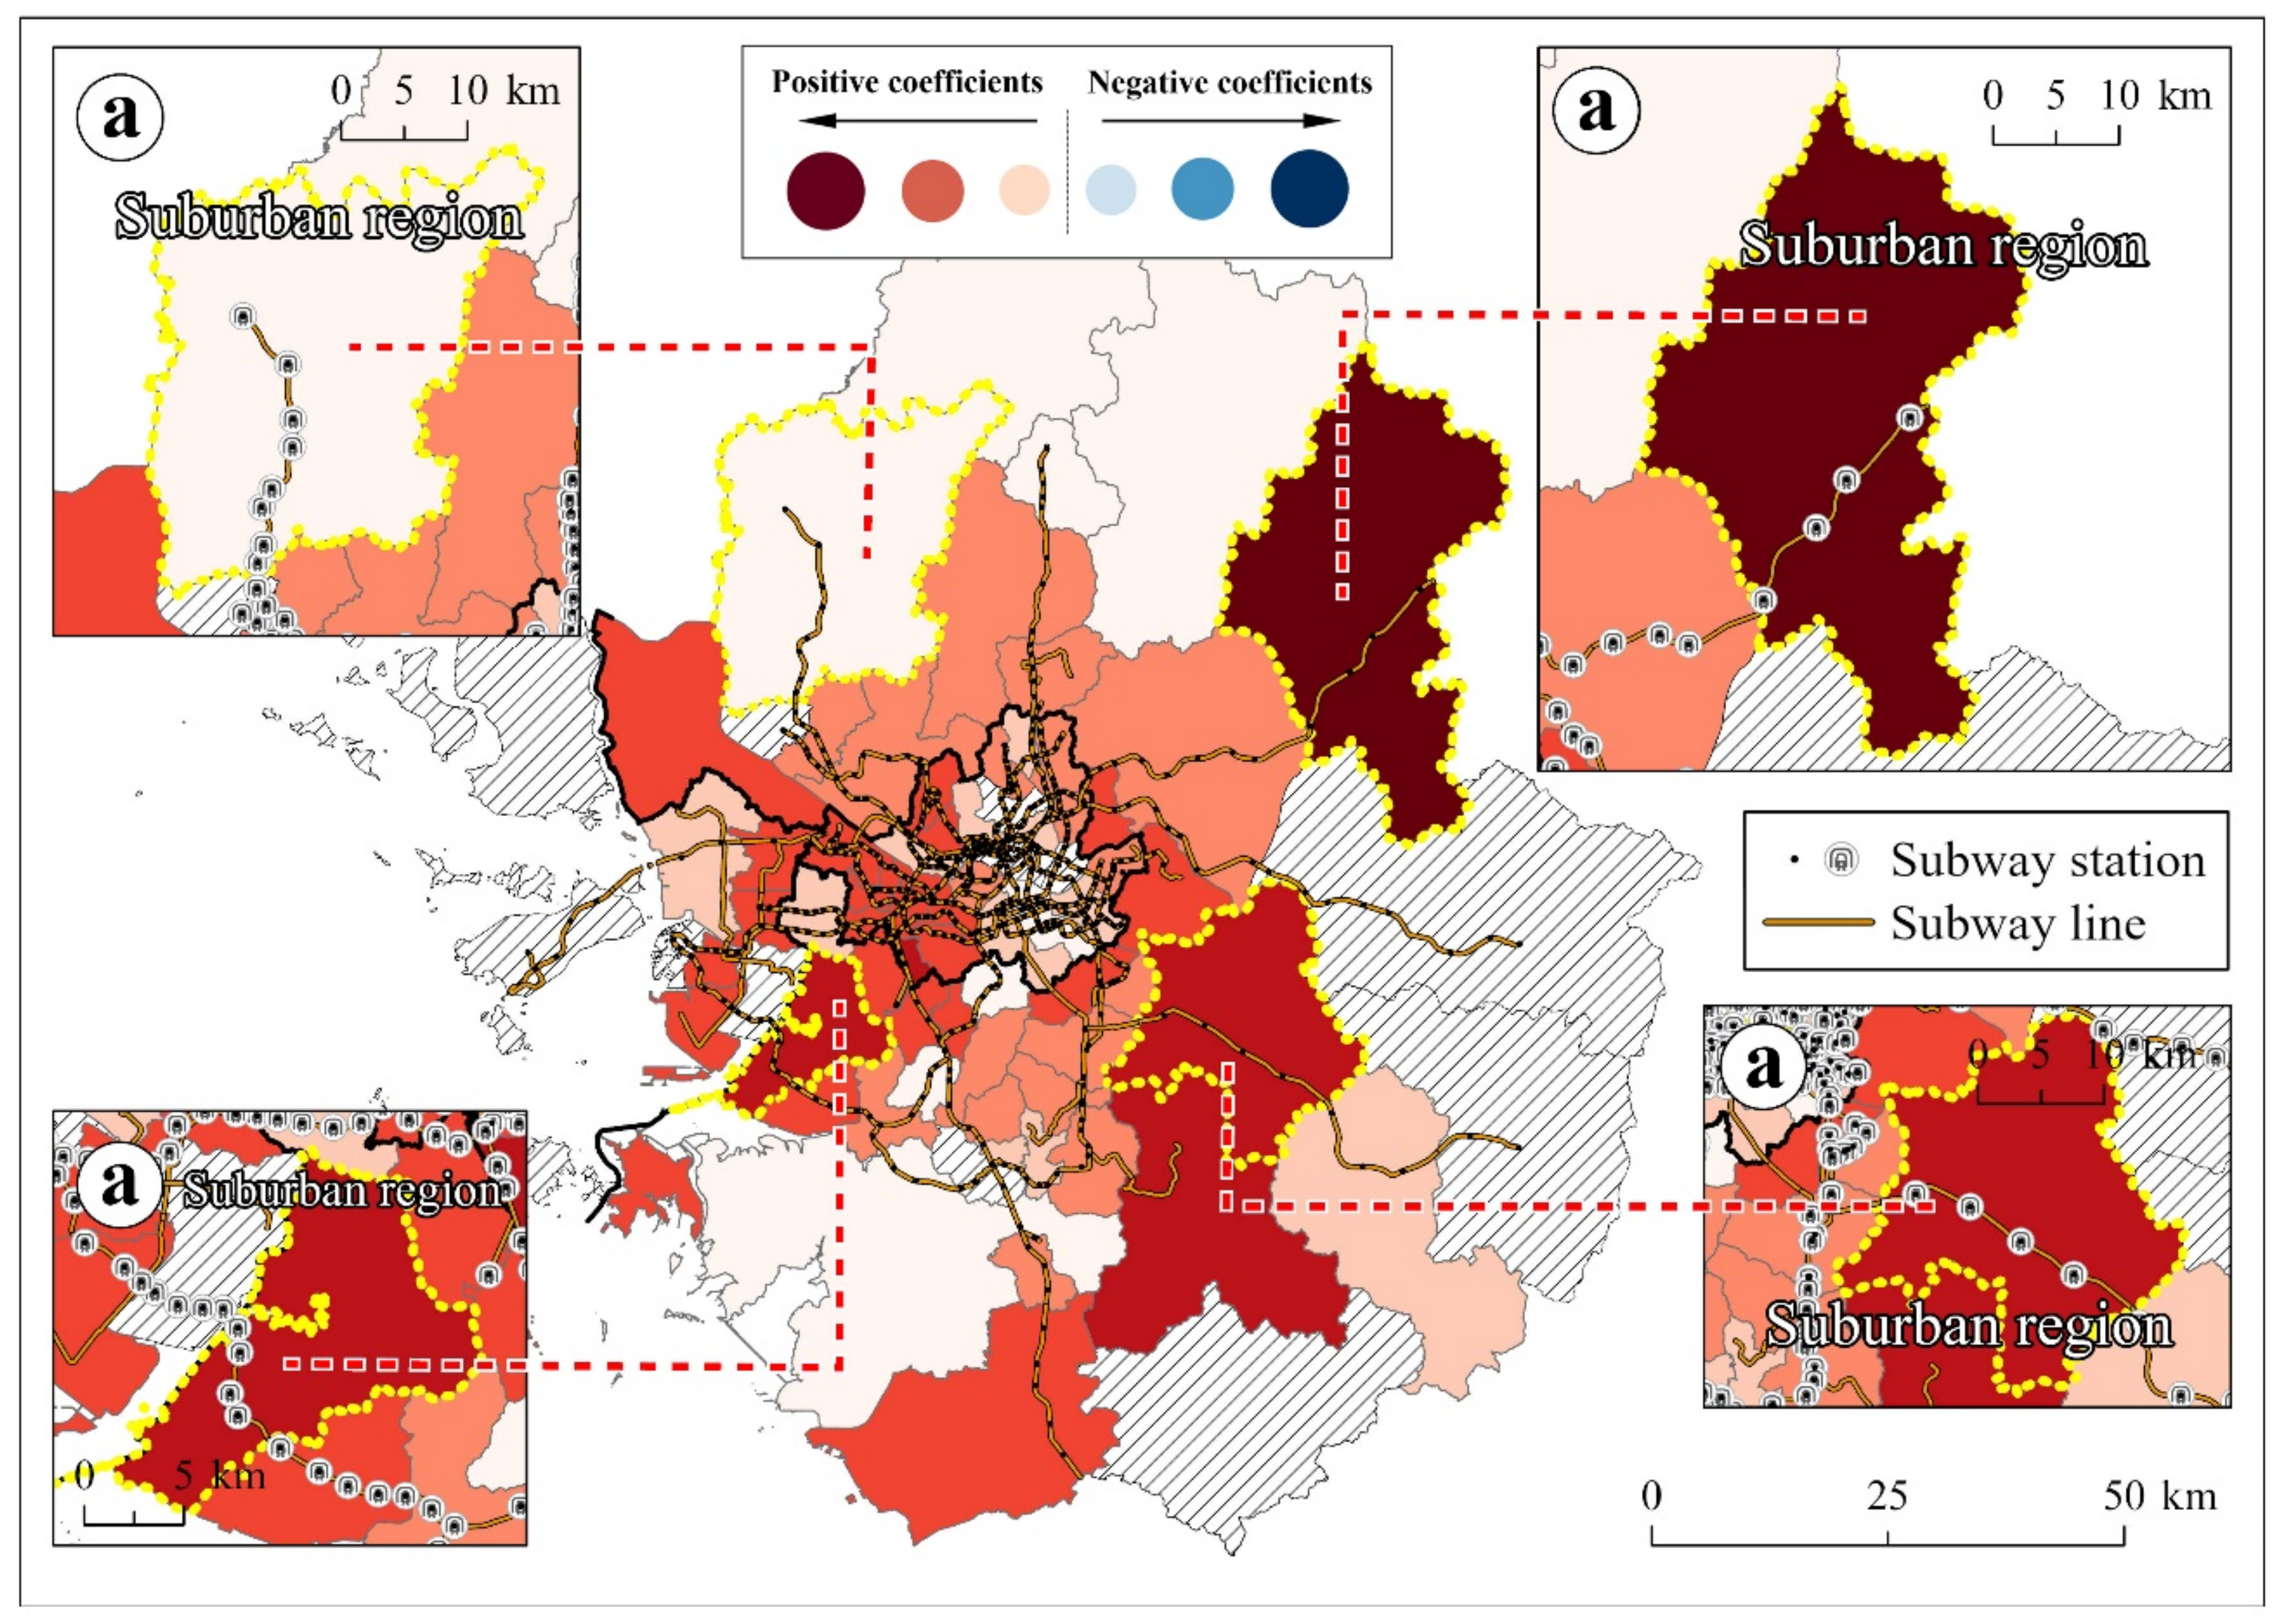
- Subway commuters
- (4)
- Socially vulnerable group variables: older population (aged 65 years and above), foreign-born population, and low-income households
4. Conclusions
Author Contributions
Funding
Institutional Review Board Statement
Informed Consent Statement
Conflicts of Interest
References
- Prather, K.A.; Wang, C.C.; Schooley, R.T. Reducing transmission of SARS-CoV-2. Science 2020, 368, 1422. [Google Scholar] [CrossRef] [PubMed]
- Zhang, C.H.; Schwartz, G.G. Spatial Disparities in Coronavirus Incidence and Mortality in the United States: An Ecological Analysis as of May 2020. J. Rural Health 2020, 36, 433–445. [Google Scholar] [CrossRef] [PubMed]
- OECD. Population Density of the Core Area (Inhabitants per km2); Organization for Economic Cooperation and Development: Paris, France, 2020. [Google Scholar]
- Yoo, M.; Kim, Y.; Baek, S.; Kwon, D. The Concept of Reproduction Number and Changes According to Government Response Policies; Korea Disease Control and Prevention Agency: Cheongju-si, Korea, 2021; pp. 282–289. [Google Scholar]
- Chen, Y.-Y.; Assefa, Y. The heterogeneity of the COVID-19 pandemic and national responses: An explanatory mixed-methods study. BMC Public Health 2021, 21, 835. [Google Scholar] [CrossRef] [PubMed]
- Thomas, L.J.; Huang, P.; Yin, F.; Luo, X.I.; Almquist, Z.W.; Hipp, J.R.; Butts, C.T. Spatial heterogeneity can lead to substantial local variations in COVID-19 timing and severity. Proc. Natl. Acad. Sci. USA 2020, 117, 24180. [Google Scholar] [CrossRef]
- Wang, Y.; Teunis, P. Strongly Heterogeneous Transmission of COVID-19 in Mainland China: Local and Regional Variation. Front. Med. 2020, 7, 329. [Google Scholar] [CrossRef]
- Qiu, Y.; Chen, X.; Shi, W. Impacts of social and economic factors on the transmission of coronavirus disease 2019 (COVID-19) in China. J. Popul. Econ. 2020, 33, 1127–1172. [Google Scholar] [CrossRef]
- Wang, H.; Ghosh, A.; Ding, J.; Sarkar, R.; Gao, J. Heterogeneous interventions reduce the spread of COVID-19 in simulations on real mobility data. Sci. Rep. 2021, 11, 7809. [Google Scholar] [CrossRef]
- Keeling, M.J.; White, P.J. Targeting vaccination against novel infections: Risk, age and spatial structure for pandemic influenza in Great Britain. J. R. Soc. Interface 2011, 8, 661–670. [Google Scholar] [CrossRef] [Green Version]
- Liu, J.; Zhou, J.; Yao, J.; Zhang, X.; Li, L.; Xu, X.; He, X.; Wang, B.; Fu, S.; Niu, T.; et al. Impact of meteorological factors on the COVID-19 transmission: A multi-city study in China. Sci. Total Environ. 2020, 726, 138513. [Google Scholar] [CrossRef]
- Kwok, C.Y.T.; Wong, M.S.; Chan, K.L.; Kwan, M.-P.; Nichol, J.E.; Liu, C.H.; Wong, J.Y.H.; Wai, A.K.C.; Chan, L.W.C.; Xu, Y.; et al. Spatial analysis of the impact of urban geometry and socio-demographic characteristics on COVID-19, a study in Hong Kong. Sci. Total Environ. 2021, 764, 144455. [Google Scholar] [CrossRef]
- Gupta, A.; Banerjee, S.; Das, S. Significance of geographical factors to the COVID-19 outbreak in India. Model Earth Syst. Environ. 2020, 6, 2645–2653. [Google Scholar] [CrossRef]
- Mollalo, A.; Vahedi, B.; Rivera, K.M. GIS-based spatial modeling of COVID-19 incidence rate in the continental United States. Sci. Total Environ. 2020, 728, 138884. [Google Scholar] [CrossRef]
- Wu, X.; Zhang, J. Exploration of spatial-temporal varying impacts on COVID-19 cumulative case in Texas using geographically weighted regression (GWR). Environ. Sci. Pollut. Res. 2021, 28, 43732–43746. [Google Scholar] [CrossRef]
- Islam, A.; Sayeed, M.A.; Rahman, M.K.; Ferdous, J.; Islam, S.; Hassan, M.M. Geospatial dynamics of COVID-19 clusters and hotspots in Bangladesh. Transbound. Emerg. Dis. 2021, 68, 3643–3657. [Google Scholar] [CrossRef]
- Mansour, S.; Al Kindi, A.; Al-Said, A.; Al-Said, A.; Atkinson, P. Sociodemographic determinants of COVID-19 incidence rates in Oman: Geospatial modelling using multiscale geographically weighted regression (MGWR). Sustain. Cities Soc. 2021, 65, 102627. [Google Scholar] [CrossRef]
- Han, Y.; Yang, L.; Jia, K.; Li, J.; Feng, S.; Chen, W.; Zhao, W.; Pereira, P. Spatial distribution characteristics of the COVID-19 pandemic in Beijing and its relationship with environmental factors. Sci. Total Environ. 2021, 761, 144257. [Google Scholar] [CrossRef]
- Li, X.; Zhou, L.; Jia, T.; Peng, R.; Fu, X.; Zou, Y. Associating COVID-19 severity with urban factors: A case study of Wuhan. Int. J. Environ. Res. Public Health 2020, 17, 6712. [Google Scholar] [CrossRef]
- Liu, M.; Liu, M.; Li, Z.; Zhu, Y.; Liu, Y.; Wang, X.; Tao, L.; Guo, X. The spatial clustering analysis of COVID-19 and its associated factors in mainland China at the prefecture level. Sci. Total Environ. 2021, 777, 145992. [Google Scholar] [CrossRef]
- Maiti, A.; Zhang, Q.; Sannigrahi, S.; Pramanik, S.; Chakraborti, S.; Cerda, A.; Pilla, F. Exploring spatiotemporal effects of the driving factors on COVID-19 incidences in the contiguous United States. Sustain. Cities Soc. 2021, 68, 102784. [Google Scholar] [CrossRef]
- Xie, Z.; Qin, Y.; Li, Y.; Shen, W.; Zheng, Z.; Liu, S. Spatial and temporal differentiation of COVID-19 epidemic spread in mainland China and its influencing factors. Sci. Total Environ. 2020, 744, 140929. [Google Scholar] [CrossRef]
- Brunsdon, C.; Fotheringham, A.S.; Charlton, M.E. Geographically Weighted Regression: A Method for Exploring Spatial Nonstationarity. Geogr. Anal. 1996, 28, 281–298. [Google Scholar] [CrossRef]
- Wheeler, D.C. Simultaneous Coefficient Penalization and Model Selection in Geographically Weighted Regression: The Geographically Weighted Lasso. Environ. Plan. A Econ. Space 2009, 41, 722–742. [Google Scholar] [CrossRef] [Green Version]
- Andersen, L.M.; Harden, S.R.; Sugg, M.M.; Runkle, J.D.; Lundquist, T.E. Analyzing the spatial determinants of local Covid-19 transmission in the United States. Sci. Total Environ. 2021, 754, 142396. [Google Scholar] [CrossRef]
- Ehlert, A. The socio-economic determinants of COVID-19: A spatial analysis of German county level data. Socio-Econ. Plan. Sci. 2021, 101083. [Google Scholar] [CrossRef]
- Im, C.; Kim, Y. Spatial pattern of tuberculosis (TB) and related socio-environmental factors in South Korea, 2008–2016. PLoS ONE 2021, 16, e0255727. [Google Scholar] [CrossRef]
- Im, C.; Kim, Y. Spatially Filtered Multilevel Analysis on Spatial Inequality of Tuberculosis in Gyeongsangbuk-do, Korea. J. Health Inform. Stat. 2021, 46, 88–99. [Google Scholar] [CrossRef]
- Im, C.; Kim, Y. Spatial Socio-environmental Analysis of Tuberculosis in South Korea Using Eigenvector Spatial Filtering Methodology. J. Korean Cartogr. Assoc. 2016, 16, 89–101. [Google Scholar] [CrossRef]
- Gao, F.; Languille, C.; Karzazi, K.; Guhl, M.; Boukebous, B.; Deguen, S. Efficiency of fine scale and spatial regression in modelling associations between healthcare service spatial accessibility and their utilization. Int. J. Health Geogr. 2021, 20, 22. [Google Scholar] [CrossRef]
- Bradley, E.; Trevor, H.; Iain, J.; Robert, T. Least angle regression. Ann. Stat. 2004, 32, 407–499. [Google Scholar]
- Wheeler, D.; Tiefelsdorf, M. Multicollinearity and correlation among local regression coefficients in geographically weighted regression. J. Geogr. Syst. 2005, 7, 161–187. [Google Scholar] [CrossRef]
- MOHW. Updates on COVID-19 in Republic of Korea (as of 1 November); Ministry of Health and Welfare: Seoul, Korea, 2020.
- KCDC. Updates on COVID-19 in Republic of Korea (as of 8 September); Korea Centers for Disease Control & Prevention: Seoul, Korea, 2020. [Google Scholar]
- Kang, C.R.; Lee, J.Y.; Park, Y.; Huh, I.S.; Ham, H.J.; Han, J.K.; Kim, J.I.; Na, B.J.; Seoul Metropolitan Government, C.-R.R.T. Coronavirus Disease Exposure and Spread from Nightclubs, South Korea. Emerg. Infect. Dis. 2020, 26, 2499–2501. [Google Scholar] [CrossRef] [PubMed]
- Monod, M.; Blenkinsop, A.; Xi, X.; Hebert, D.; Bershan, S.; Tietze, S.; Baguelin, M.; Bradley, V.C.; Chen, Y.; Coupland, H.; et al. Age groups that sustain resurging COVID-19 epidemics in the United States. Science 2021, 371, eabe8372. [Google Scholar] [CrossRef] [PubMed]
- Boehmer, T.K.; DeVies, J.; Caruso, E.; van Santen, K.L.; Tang, S.; Black, C.L.; Hartnett, K.P.; Kite-Powell, A.; Dietz, S.; Lozier, M. Changing age distribution of the COVID-19 pandemic—United States, May–August 2020. MMWR Morb Mortal Wkly Rep 2020, 69, 1404. [Google Scholar] [CrossRef] [PubMed]
- Kim, S.Y.; Lee, K.; Tussey, J.B.; Dougherty, E.J.; Williams, S.C.; Abrams, R.B.; Murray, C.K. Responding to COVID-19 Among U.S. Military Units in South Korea: The U.S. Forces Korea’s Operation Kill the Virus. Mil. Med. 2021, usab013. [Google Scholar] [CrossRef]
- Bazaid, A.S.; Aldarhami, A.; Binsaleh, N.K.; Sherwani, S.; Althomali, O.W. Knowledge and practice of personal protective measures during the COVID-19 pandemic: A cross-sectional study in Saudi Arabia. PLoS ONE 2020, 15, e0243695. [Google Scholar] [CrossRef]
- Davies, N.G.; Klepac, P.; Liu, Y.; Prem, K.; Jit, M.; Pearson, C.A.B.; Quilty, B.J.; Kucharski, A.J.; Gibbs, H.; Clifford, S.; et al. Age-dependent effects in the transmission and control of COVID-19 epidemics. Nat. Med. 2020, 26, 1205–1211. [Google Scholar] [CrossRef]
- Holt, N.R.; Neumann, J.T.; McNeil, J.J.; Cheng, A.C. Implications of COVID-19 for an ageing population. Med. J. Aust. 2020, 213, 342–344.e1. [Google Scholar] [CrossRef]
- Park, C.; Kim, K. Covid-19 and Korean Buddhism: Assessing the Impact of South Korea’s Coronavirus Epidemic on the Future of Its Buddhist Community. Religions 2021, 12, 147. [Google Scholar] [CrossRef]
- Haynes, J. Donald Trump, the Christian Right and COVID-19: The Politics of Religious Freedom. Laws 2021, 10, 6. [Google Scholar] [CrossRef]
- Martínez-Torrón, J. COVID-19 and Religious Freedom: Some Comparative Perspectives. Laws 2021, 10, 39. [Google Scholar] [CrossRef]
- Vermeer, P.; Kregting, J. Religion and the Transmission of COVID-19 in The Netherlands. Religions 2020, 11, 393. [Google Scholar] [CrossRef]
- Acevedo-Garcia, D. Residential segregation and the epidemiology of infectious diseases. Soc. Sci. Med. 2000, 51, 1143–1161. [Google Scholar] [CrossRef]
- Greenaway, C.; Hargreaves, S.; Barkati, S.; Coyle, C.M.; Gobbi, F.; Veizis, A.; Douglas, P. COVID-19: Exposing and addressing health disparities among ethnic minorities and migrants. J. Travel Med. 2020, 27, taaa113. [Google Scholar] [CrossRef]
- Vignier, N.; Bouchaud, O. Travel, Migration and Emerging Infectious Diseases. EJIFCC 2018, 29, 175–179. [Google Scholar]
- Barnett, E.D.; Walker, P.F. Role of Immigrants and Migrants in Emerging Infectious Diseases. Med. Clin. N. Am. 2008, 92, 1447–1458. [Google Scholar] [CrossRef]
- Oh, T.K.; Choi, J.-W.; Song, I.-A. Socioeconomic disparity and the risk of contracting COVID-19 in South Korea: An NHIS-COVID-19 database cohort study. BMC Public Health 2021, 21, 144. [Google Scholar] [CrossRef]
- Li, M.; Zhang, Z.; Cao, W.; Liu, Y.; Du, B.; Chen, C.; Liu, Q.; Uddin, M.N.; Jiang, S.; Chen, C.; et al. Identifying novel factors associated with COVID-19 transmission and fatality using the machine learning approach. Sci. Total Environ. 2021, 764, 142810. [Google Scholar] [CrossRef]
- Hawkins, R.B.; Charles, E.J.; Mehaffey, J.H. Socio-economic status and COVID-19–related cases and fatalities. Public Health 2020, 189, 129–134. [Google Scholar] [CrossRef]
- Quinn, S.C.; Kumar, S. Health Inequalities and Infectious Disease Epidemics: A Challenge for Global Health Security. Biosecurity Bioterrorism Biodefense Strategy Pract. Sci. 2014, 12, 263–273. [Google Scholar] [CrossRef] [Green Version]
- Woodward, A.; Kawachi, I. Why reduce health inequalities? J. Epidemiol. Community Health 2000, 54, 923–929. [Google Scholar] [CrossRef]
- Hamidi, S.; Hamidi, I. Subway Ridership, Crowding, or Population Density: Determinants of COVID-19 Infection Rates in New York City. Am. J. Prev. Med. 2021, 60, 614–620. [Google Scholar] [CrossRef]
- Harris, J.E. The Subways Seeded the Massive Coronavirus Epidemic in New York City. SSRN Electron. J. 2020. [Google Scholar] [CrossRef]
- Figueroa, J.F.; Wadhera, R.K.; Mehtsun, W.T.; Riley, K.; Phelan, J.; Jha, A.K. Association of race, ethnicity, and community-level factors with COVID-19 cases and deaths across U.S. counties. Healthcare 2021, 9, 100495. [Google Scholar] [CrossRef]
- Zheng, R.; Xu, Y.; Wang, W.; Ning, G.; Bi, Y. Spatial transmission of COVID-19 via public and private transportation in China. Travel Med. Infect Dis. 2020, 34, 101626. [Google Scholar] [CrossRef]
- Gaskin, D.J.; Zare, H.; Delarmente, B.A. Geographic disparities in COVID-19 infections and deaths: The role of transportation. Transp. Policy 2021, 102, 35–46. [Google Scholar] [CrossRef]
- Hu, M.; Lin, H.; Wang, J.; Xu, C.; Tatem, A.J.; Meng, B.; Zhang, X.; Liu, Y.; Wang, P.; Wu, G.; et al. Risk of Coronavirus Disease 2019 Transmission in Train Passengers: An Epidemiological and Modeling Study. Clinical Infect. Dis. 2020, 72, 604–610. [Google Scholar] [CrossRef]
- MOHW Cases in Korea. Available online: http://ncov.mohw.go.kr/en/bdBoardList.do?brdId=16&brdGubun=161&dataGubun=&ncvContSeq=&contSeq=&board_id=&gubun= (accessed on 30 May 2021).
- KCDC. Updates on COVID-19 in Republic of Korea (as of 8 July); Korea Centers for Disease Control & Prevention: Seoul, Korea, 2020. [Google Scholar]
- KDCA. Updates on COVID-19 in Republic of Korea (as of 21 January); Korea Disease Control and Prevention Agency: Seoul, Korea, 2021. [Google Scholar]
- KDCA. Updates on COVID-19 in Republic of Korea (as of 15 March); Korea Disease Control and Prevention Agency: Seoul, Korea, 2021. [Google Scholar]
- KOSIS. The Number of Foreign Residents. Ministry of Justice: Seoul, Korea, 2021. [Google Scholar]
- Kim, S.; Kim, Y. Spatially Filtered Multilevel Analysis on Spatial Determinants for Malaria Occurrence in Korea. Int. J. Environ. Res. Public Health 2019, 16, 1250. [Google Scholar] [CrossRef] [Green Version]
- Coxe, S.; West, S.G.; Aiken, L.S. The Analysis of Count Data: A Gentle Introduction to Poisson Regression and Its Alternatives. J. Personal. Assess. 2009, 91, 121–136. [Google Scholar] [CrossRef]
- Bender, R. Introduction to the Use of Regression Models in Epidemiology. In Cancer Epidemiology; Verma, M., Ed.; Humana Press: Totowa, NJ, USA, 2009; pp. 179–195. [Google Scholar]
- Fotheringham, A.S.; Chris, B.; Martin, C. Geographically Weighted Regression: The Analysis of Spatially Varying Relationships; Wiley: Chichester, UK, 2002. [Google Scholar]
- Griffith, D.A. Spatial-Filtering-Based Contributions to a Critique of Geographically Weighted Regression (GWR). Environ. Plan. A Econ. Space 2008, 40, 2751–2769. [Google Scholar] [CrossRef]
- Tibshirani, R. Regression Shrinkage and Selection Via the Lasso. J. R. Stat. Soc. Ser. B Methodol. 1996, 58, 267–288. [Google Scholar] [CrossRef]
- Setiyorini, A.; Suprijadi, J.; Handoko, B. Implementations of geographically weighted lasso in spatial data with multicollinearity (Case study: Poverty modeling of Java Island). AIP Conf. Proc. 2017, 1827, 020003. [Google Scholar]
- Jin, C.; Lee, G. Spatial hedonic modeling using geographically weighted LASSO model. J. Korean Geogr. Soc. 2014, 49, 917–934. [Google Scholar]
- He, Y.; Zhao, Y.; Tsui, K.L. An adapted geographically weighted LASSO (Ada-GWL) model for predicting subway ridership. Transportation 2020, 48, 1185–1216. [Google Scholar] [CrossRef]
- Kianifard, F.; Gallo, P.P. Poisson regression analysis in clinical research. J. Biopharm. Stat. 1995, 5, 115–129. [Google Scholar] [CrossRef] [PubMed]
- Frome, E.L.; Checkoway, H. Epidemiologic programs for computers and calculators. Use of Poisson regression models in estimating incidence rates and ratios. Am. J. Epidemiol. 1985, 121, 309–323. [Google Scholar] [CrossRef] [PubMed]
- Kock, N. Common Method Bias in PLS-SEM: A Full Collinearity Assessment Approach. Int. J. e-Collab. 2015, 11, 1–10. [Google Scholar] [CrossRef] [Green Version]
- KOSIS. Land Use by Provinces. Regional Statistics Division; Statistics Korea: Seoul, Korea, 2021. [Google Scholar]
- KDCA. Updates on COVID-19 in Republic of Korea (as of 30 November); Korea Disease Control and Prevention Agency: Seoul, Korea, 2020. [Google Scholar]
- KDCA. Updates on COVID-19 in Republic of Korea (as of 1 November); Korea Disease Control and Prevention Agency: Seoul, Korea, 2021. [Google Scholar]
- James, A.; Eagle, L.; Phillips, C.; Hedges, D.S.; Bodenhamer, C.; Brown, R.; Wheeler, J.G.; Kirking, H. High COVID-19 Attack Rate Among Attendees at Events at a Church—Arkansas, March 2020. MMWR Morb. Mortal Wkly. Rep. 2020, 69, 632–635. [Google Scholar] [CrossRef]
- KCDC. Updates on COVID-19 in Republic of Korea (as of 23 July); Korea Centers for Disease Control & Prevention: Seoul, Korea, 2020. [Google Scholar]
- Yoosefi Lebni, J.; Ziapour, A.; Mehedi, N.; Irandoost, S.F. The Role of Clerics in Confronting the COVID-19 Crisis in Iran. J. Relig. Health 2021, 60, 2387–2394. [Google Scholar] [CrossRef]
- Seoul Metro. Subway Ridership for 2020; Seoul Metro: Seoul, Korea, 2021. [Google Scholar]
- KOSIS. Commuting Population by Transportations; Statistics Korea: Seoul, Korea, 2015. [Google Scholar]
- OECD. How’s Life? OECD: Paris, France, 2011. [Google Scholar]
- Mikolai, J.; Keenan, K.; Kulu, H. Intersecting household-level health and socio-economic vulnerabilities and the COVID-19 crisis: An analysis from the UK. SSM—Popul. Health 2020, 12, 100628. [Google Scholar] [CrossRef]
- Jeong, J.E.; Jun, M.I. Spatial Concentrations of the Elderly and Its Characteristics in the Seoul Metropolitan Area. J. Korean Reg. Sci. Assoc. 2013, 29, 3–18. [Google Scholar]
- KOSIS. The Number of Business Establishment by Industrial Classification. In Regional Statistics Division; Statistics Korea: Seoul, Korea, 2021. [Google Scholar]
- Wahab, A. The outbreak of Covid-19 in Malaysia: Pushing migrant workers at the margin. Soc. Sci. Humanit. Open 2020, 2, 100073. [Google Scholar] [CrossRef]
- Yee, K.; Peh, H.P.; Tan, Y.P.; Teo, I.; Tan, E.U.T.; Paul, J.; Rangabashyam, M.; Ramalingam, M.B.; Chow, W.; Tan, H.K. Stressors and coping strategies of migrant workers diagnosed with COVID-19 in Singapore: A qualitative study. BMJ Open 2021, 11, e045949. [Google Scholar] [CrossRef]
- WHO. Promoting the Health of Migrant Workers in the WHO European Region during COVID-19. Interim Guidance, 6 November 2020; World Health Organization Regional Office for Europe: Copenhagen, Denmark, 2020. [Google Scholar]
- KOSIS. The Number of Medical Doctors per 1,000 People. In Regional Statistics Division; Statistics Korea: Seoul, Korea, 2021. [Google Scholar]
- Emanuel, E.J.; Persad, G.; Upshur, R.; Thome, B.; Parker, M.; Glickman, A.; Zhang, C.; Boyle, C.; Smith, M.; Phillips, J.P. Fair Allocation of Scarce Medical Resources in the Time of COVID-19. N. Engl. J. Med. 2020, 382, 2049–2055. [Google Scholar] [CrossRef]
- Report on the Social Survey in Gyeonggi-Do; Gyeonggi-do, Korea. 2020.
- Ahn, J.; Kang, I.-S. A Study on Congestion Improvement on Seoul Subway Line 9 using Cost-Effect Analysis. Korean Public Manag. Rev. 2017, 31, 105–128. [Google Scholar]


| Categories | Variables | Unit | Mean | References | Source |
|---|---|---|---|---|---|
| Dependent variable | COVID-19 cases | Case | 667.36 | - | Seoul, https://data.seoul.go.kr, Gyeonggi-do, https://www.gidcc.or.kr, Incheon, https://www.incheon.go.kr |
| Independent variables | Young adults (aged 19 to 34 years) | % | 20.47 | [35,36,37] | KOSIS, http://www.kosis.kr |
| Older populations (aged 65 years and above) | % | 15.50 | [38,39,40,41] | KOSIS, http://www.kosis.kr | |
| Christian population | % | 23.24 | [42,43,44,45] | KOSIS, http://www.kosis.kr | |
| Foreign-born population | % | 3.17 | [46,47,48,49] | KOSIS, http://www.kosis.kr | |
| Low-income households | % | 3.74 | [50,51,52,53,54] | KOSIS, http://www.kosis.kr | |
| Subway commuters | % | 12.48 | [55,56,57,58,59,60] | KOSIS, http://www.kosis.kr |
| Poisson Regression Results (Global Model) | ||||||||
|---|---|---|---|---|---|---|---|---|
| Variables | First Period (January~July 2020) | Second Period (August~November 2020) | Third Period (December 2020~February 2021) | Entire Period (January~February 2021) | ||||
| Estimate | p-Value | Estimate | p-Value | Estimate | p-Value | Estimate | p-Value | |
| Young adults (aged 19 to 34 years) | 2.16 * | 0.01 | 0.43 | 0.33 | 1.10 ** | <0.01 | 0.73 ** | <0.01 |
| Older population (aged 65 years and above) | −10.87 ** | <0.01 | −6.26 ** | <0.01 | −8.63 ** | <0.01 | −8.11 ** | <0.01 |
| Christian population | 3.70 ** | <0.01 | 3.43 ** | <0.01 | 3.35 ** | <0.01 | 3.43 ** | <0.01 |
| Foreign-born population | 1.83 * | 0.01 | −3.31 ** | <0.01 | 1.96 ** | <0.01 | 0.68 ** | <0.01 |
| Low-income households | 3.32 * | 0.04 | 3.35 ** | <0.01 | 3.85 ** | <0.01 | 3.72 ** | <0.01 |
| Subway commuters | 3.62 ** | <0.01 | 3.73 ** | <0.01 | 4.09 ** | <0.01 | 3.96 ** | <0.01 |
| R2 | 0.3646 | 0.4122 | 0.4957 | 0.4848 | ||||
| AIC | 1718.35 | 4083.27 | 7069.57 | 10,561.96 | ||||
| Moran’s I of the residuals | 0.03 | 0.11 | 0.13 | 0.02 | 0.14 | 0.02 | 0.11 | 0.02 |
| GWL Coefficient Estimates (Local Model) | ||||||||
| Variables | Max | Mean | Min | |||||
| Young adults (aged 19 to 34 years) | 59.52 | 14.89 | −76.68 | |||||
| Christian population | 114.70 | 14.28 | −64.62 | |||||
| Older population (aged 65 years and above) | 73.50 | −8.21 | −101.59 | |||||
| Foreign-born population | 109.24 | −5.01 | −80.91 | |||||
| Low-income households | 191.88 | 8.43 | −203.89 | |||||
| Subway commuters | 60.74 | 18.81 | 1.08 | |||||
Publisher’s Note: MDPI stays neutral with regard to jurisdictional claims in published maps and institutional affiliations. |
© 2021 by the authors. Licensee MDPI, Basel, Switzerland. This article is an open access article distributed under the terms and conditions of the Creative Commons Attribution (CC BY) license (https://creativecommons.org/licenses/by/4.0/).
Share and Cite
Im, C.; Kim, Y. Local Characteristics Related to SARS-CoV-2 Transmissions in the Seoul Metropolitan Area, South Korea. Int. J. Environ. Res. Public Health 2021, 18, 12595. https://doi.org/10.3390/ijerph182312595
Im C, Kim Y. Local Characteristics Related to SARS-CoV-2 Transmissions in the Seoul Metropolitan Area, South Korea. International Journal of Environmental Research and Public Health. 2021; 18(23):12595. https://doi.org/10.3390/ijerph182312595
Chicago/Turabian StyleIm, Changmin, and Youngho Kim. 2021. "Local Characteristics Related to SARS-CoV-2 Transmissions in the Seoul Metropolitan Area, South Korea" International Journal of Environmental Research and Public Health 18, no. 23: 12595. https://doi.org/10.3390/ijerph182312595