
Measuring the Built Environment in Studies of Child Health—A Meta-Narrative Review of Associations

 , , ,
, , ,
Abstract
:
1. Introduction
2. Methods
2.1. Review Team Characteristics
2.2. Meta-Narrative Review Principles
- Pragmatism: the review was guided by the authors’ expertise to define the search concepts considered to be relevant in the association between the BE and child health outcomes to bring about the most useful evidence for public health, transport, and planning researchers and practitioners.
- Pluralism: the topic of the review was informed by the results of all the studies that fulfilled the search and inclusion criteria, and this resulted in a wide evidence base drawing on several disciplines: architecture and planning, environmental sciences, epidemiology, geography, medicine, psychology, public health and transport, among others.
- Historicity: the search covered research published in the last ten years to take into account how the topic has been shaped over a large enough time frame that would capture the variety of relevant methods that have emerged in recent years and that have not been captured in similar reviews completed in recent times, while being pragmatic regarding scope (the initial returns from the search were over 2000).
- Contestation: the review included studies from different disciplines that looked at different health outcomes or activities; this inevitably resulted in several heterogeneous outcomes to be analysed. However, this panoramic view of the associations enabled a deeper analysis of observed conflicting results.
- Reflexivity: throughout the review stages, the researchers reflected on the findings individually when analysing the data and collectively when reporting and discussing the results.
- Peer review: the emerging findings were presented to the research programme’s executive group comprising a multidisciplinary team of experts—their feedback guided further analysis.
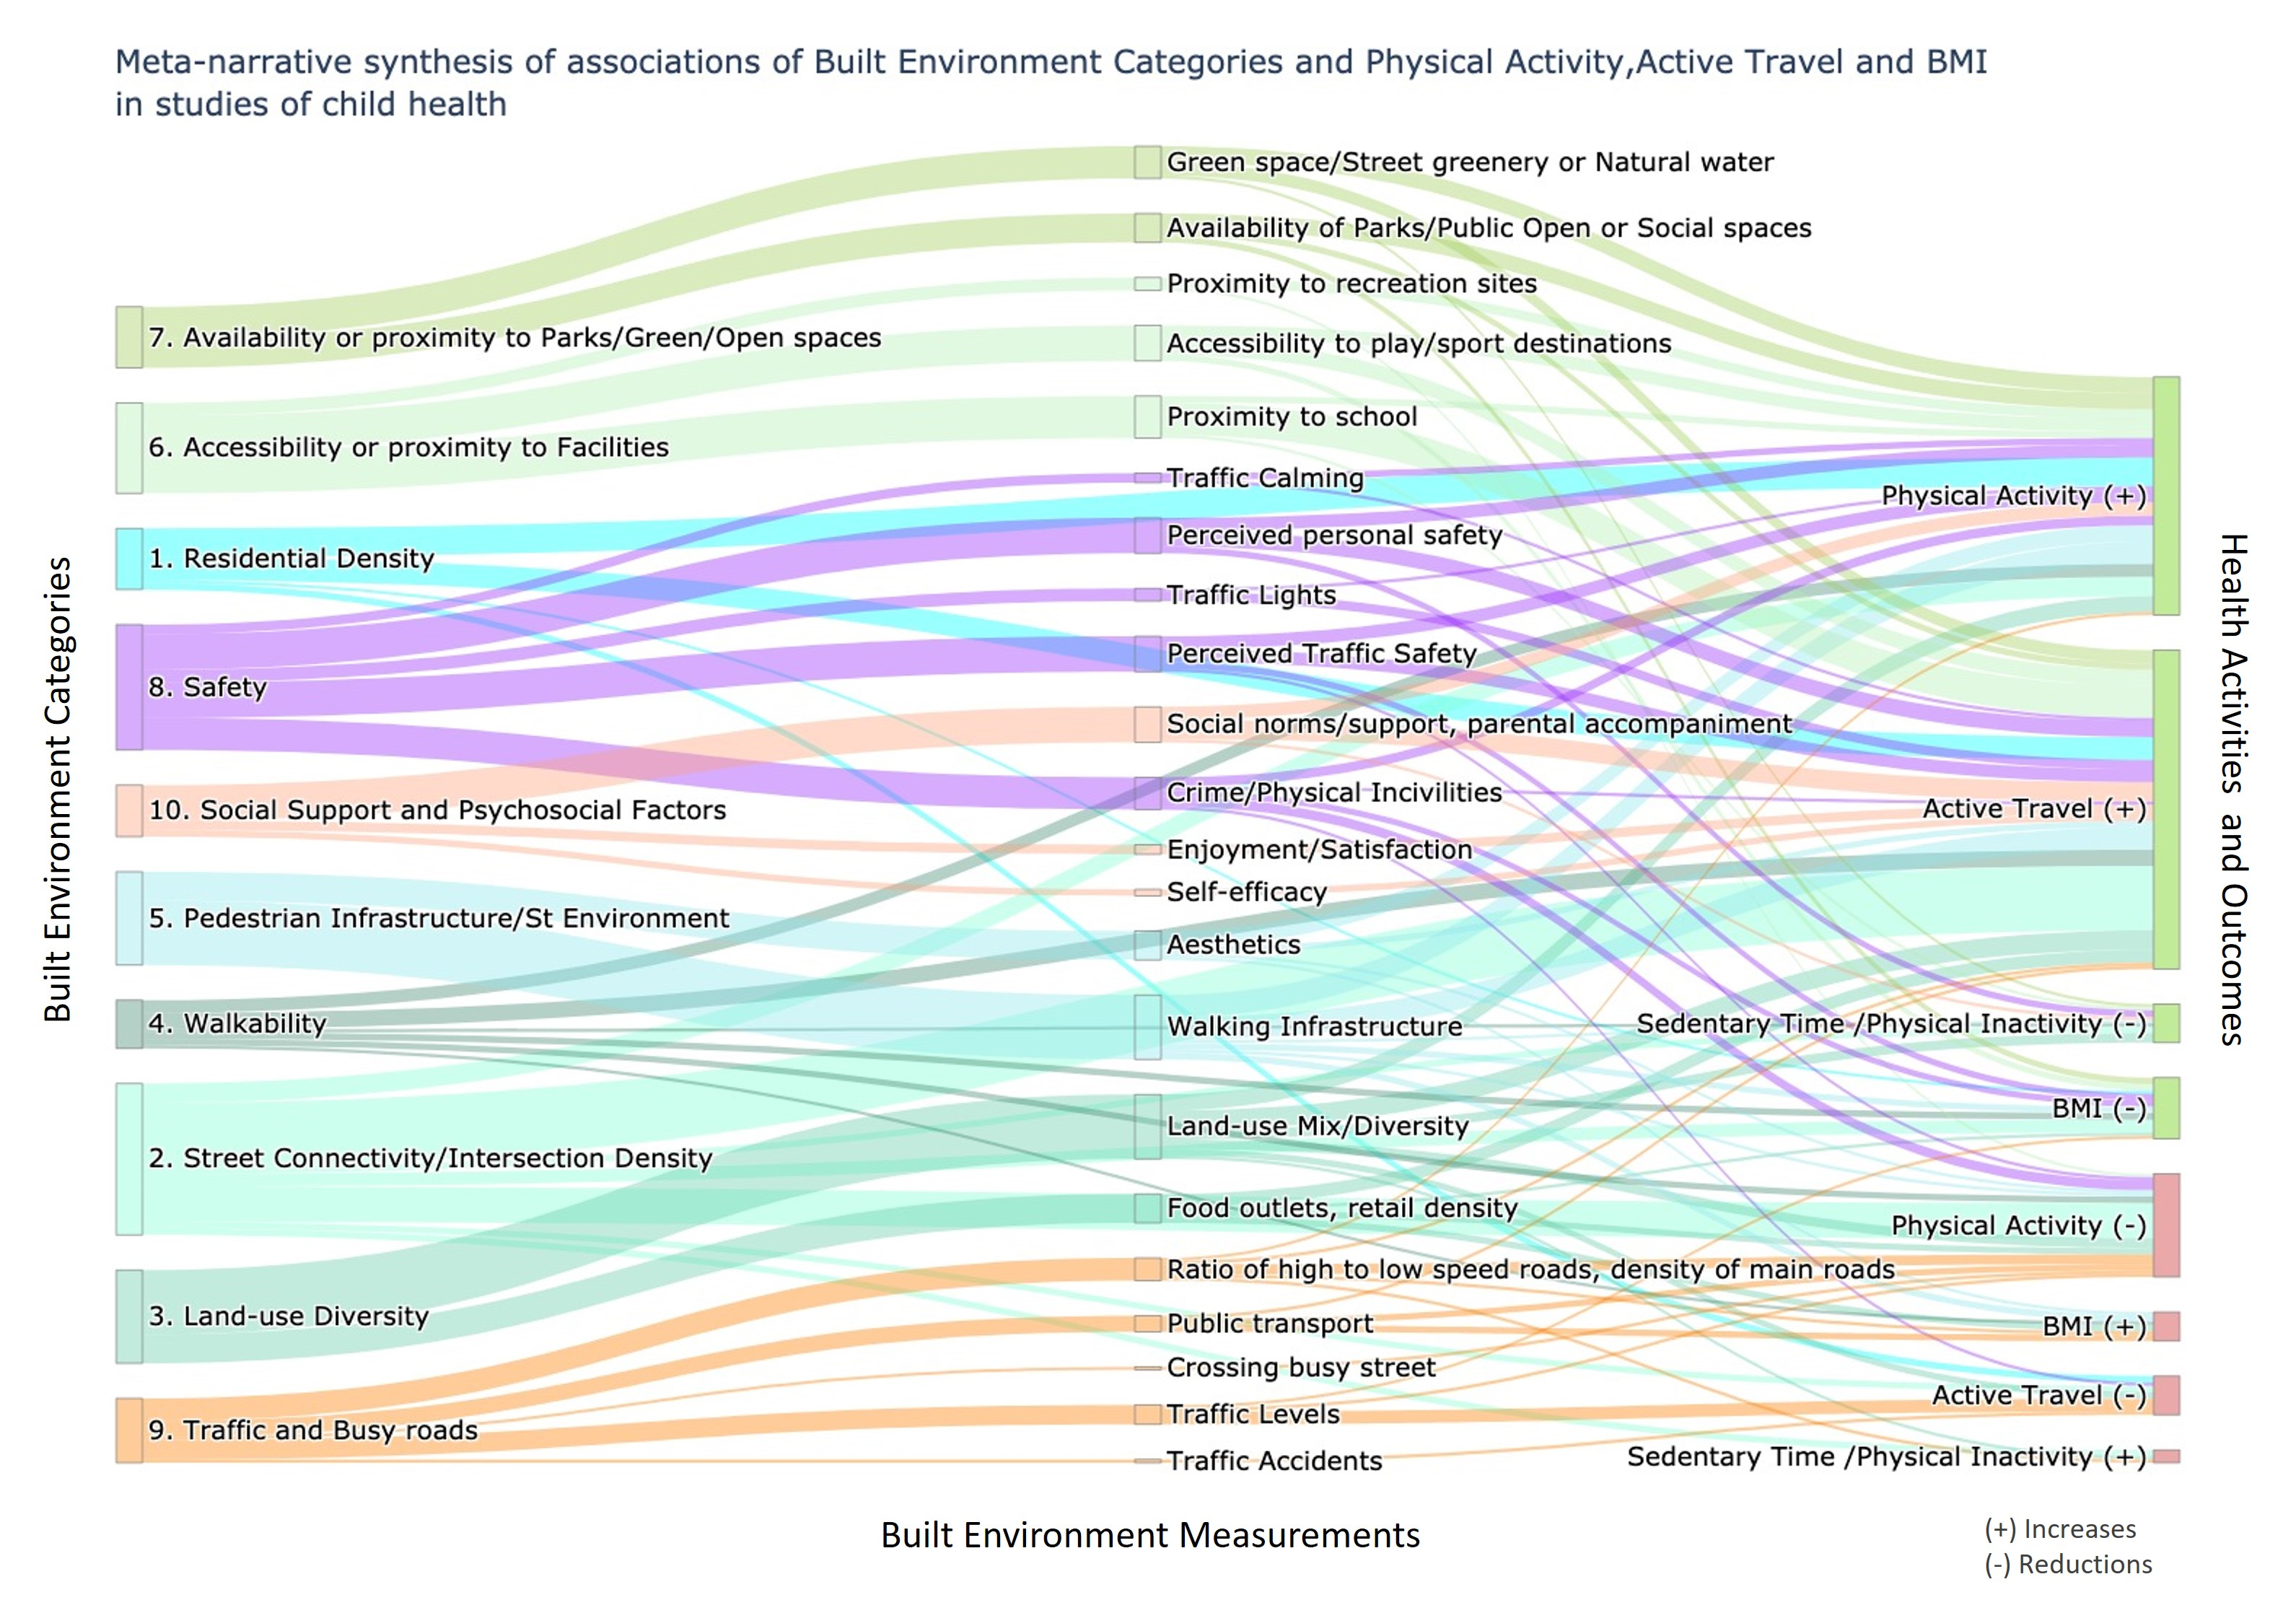
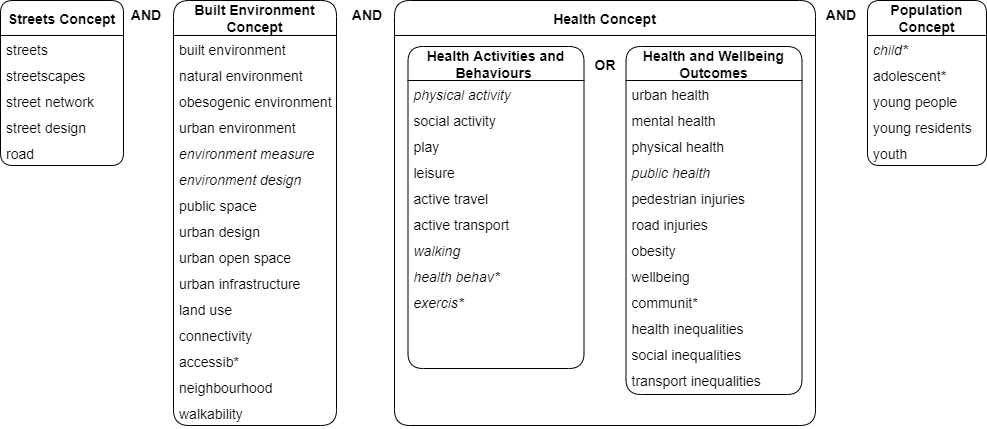
2.3. Information Sources, and Search Strategy
- Objective or standardised measures of the urban BE;
- Objective, observed, or self-reported measures of physical or social activities such as walking, cycling, active travel, recreation walking or playing OR Objective or self-reported measures of physical or mental health and wellbeing outcomes;
- Studies measuring health outcomes and health behaviours in relation to children and young people.
2.4. Evaluation and Coding for Title, Abstract, and Keywords
3. Study Characteristics
3.1. Geographical Location
3.2. Study Design and Sample Size
3.3. Social Factors
3.4. Study Area
3.5. Built Environment (BE) Measures
3.6. Health Activities, Behaviours and Outcomes, Measurements and Tools
4. Results: Associations between Built Environment and Health Outcomes
4.1. Built Environment (BE) Correlates of Physical Activity
4.1.1. Physical Activity (PA)
4.1.2. Parent-Reported Play or Park Use
4.2. Increased Sedentary Time (ST) or Physical Inactivity
4.3. Built Environment (BE) Correlates of Travel (Including Objective and Self-Reported Active Travel to School and Parent and Self-Reported Travel for Other Purposes)
4.3.1. Active Travel to School
4.3.2. Non-School Active Travel
4.4. Built Environment (BE) Correlates of Obesity and Other Health Outcomes
5. Discussion
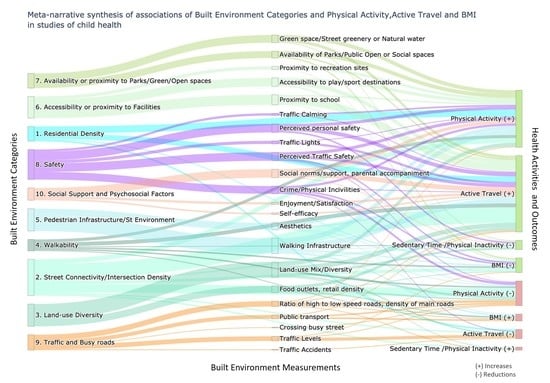
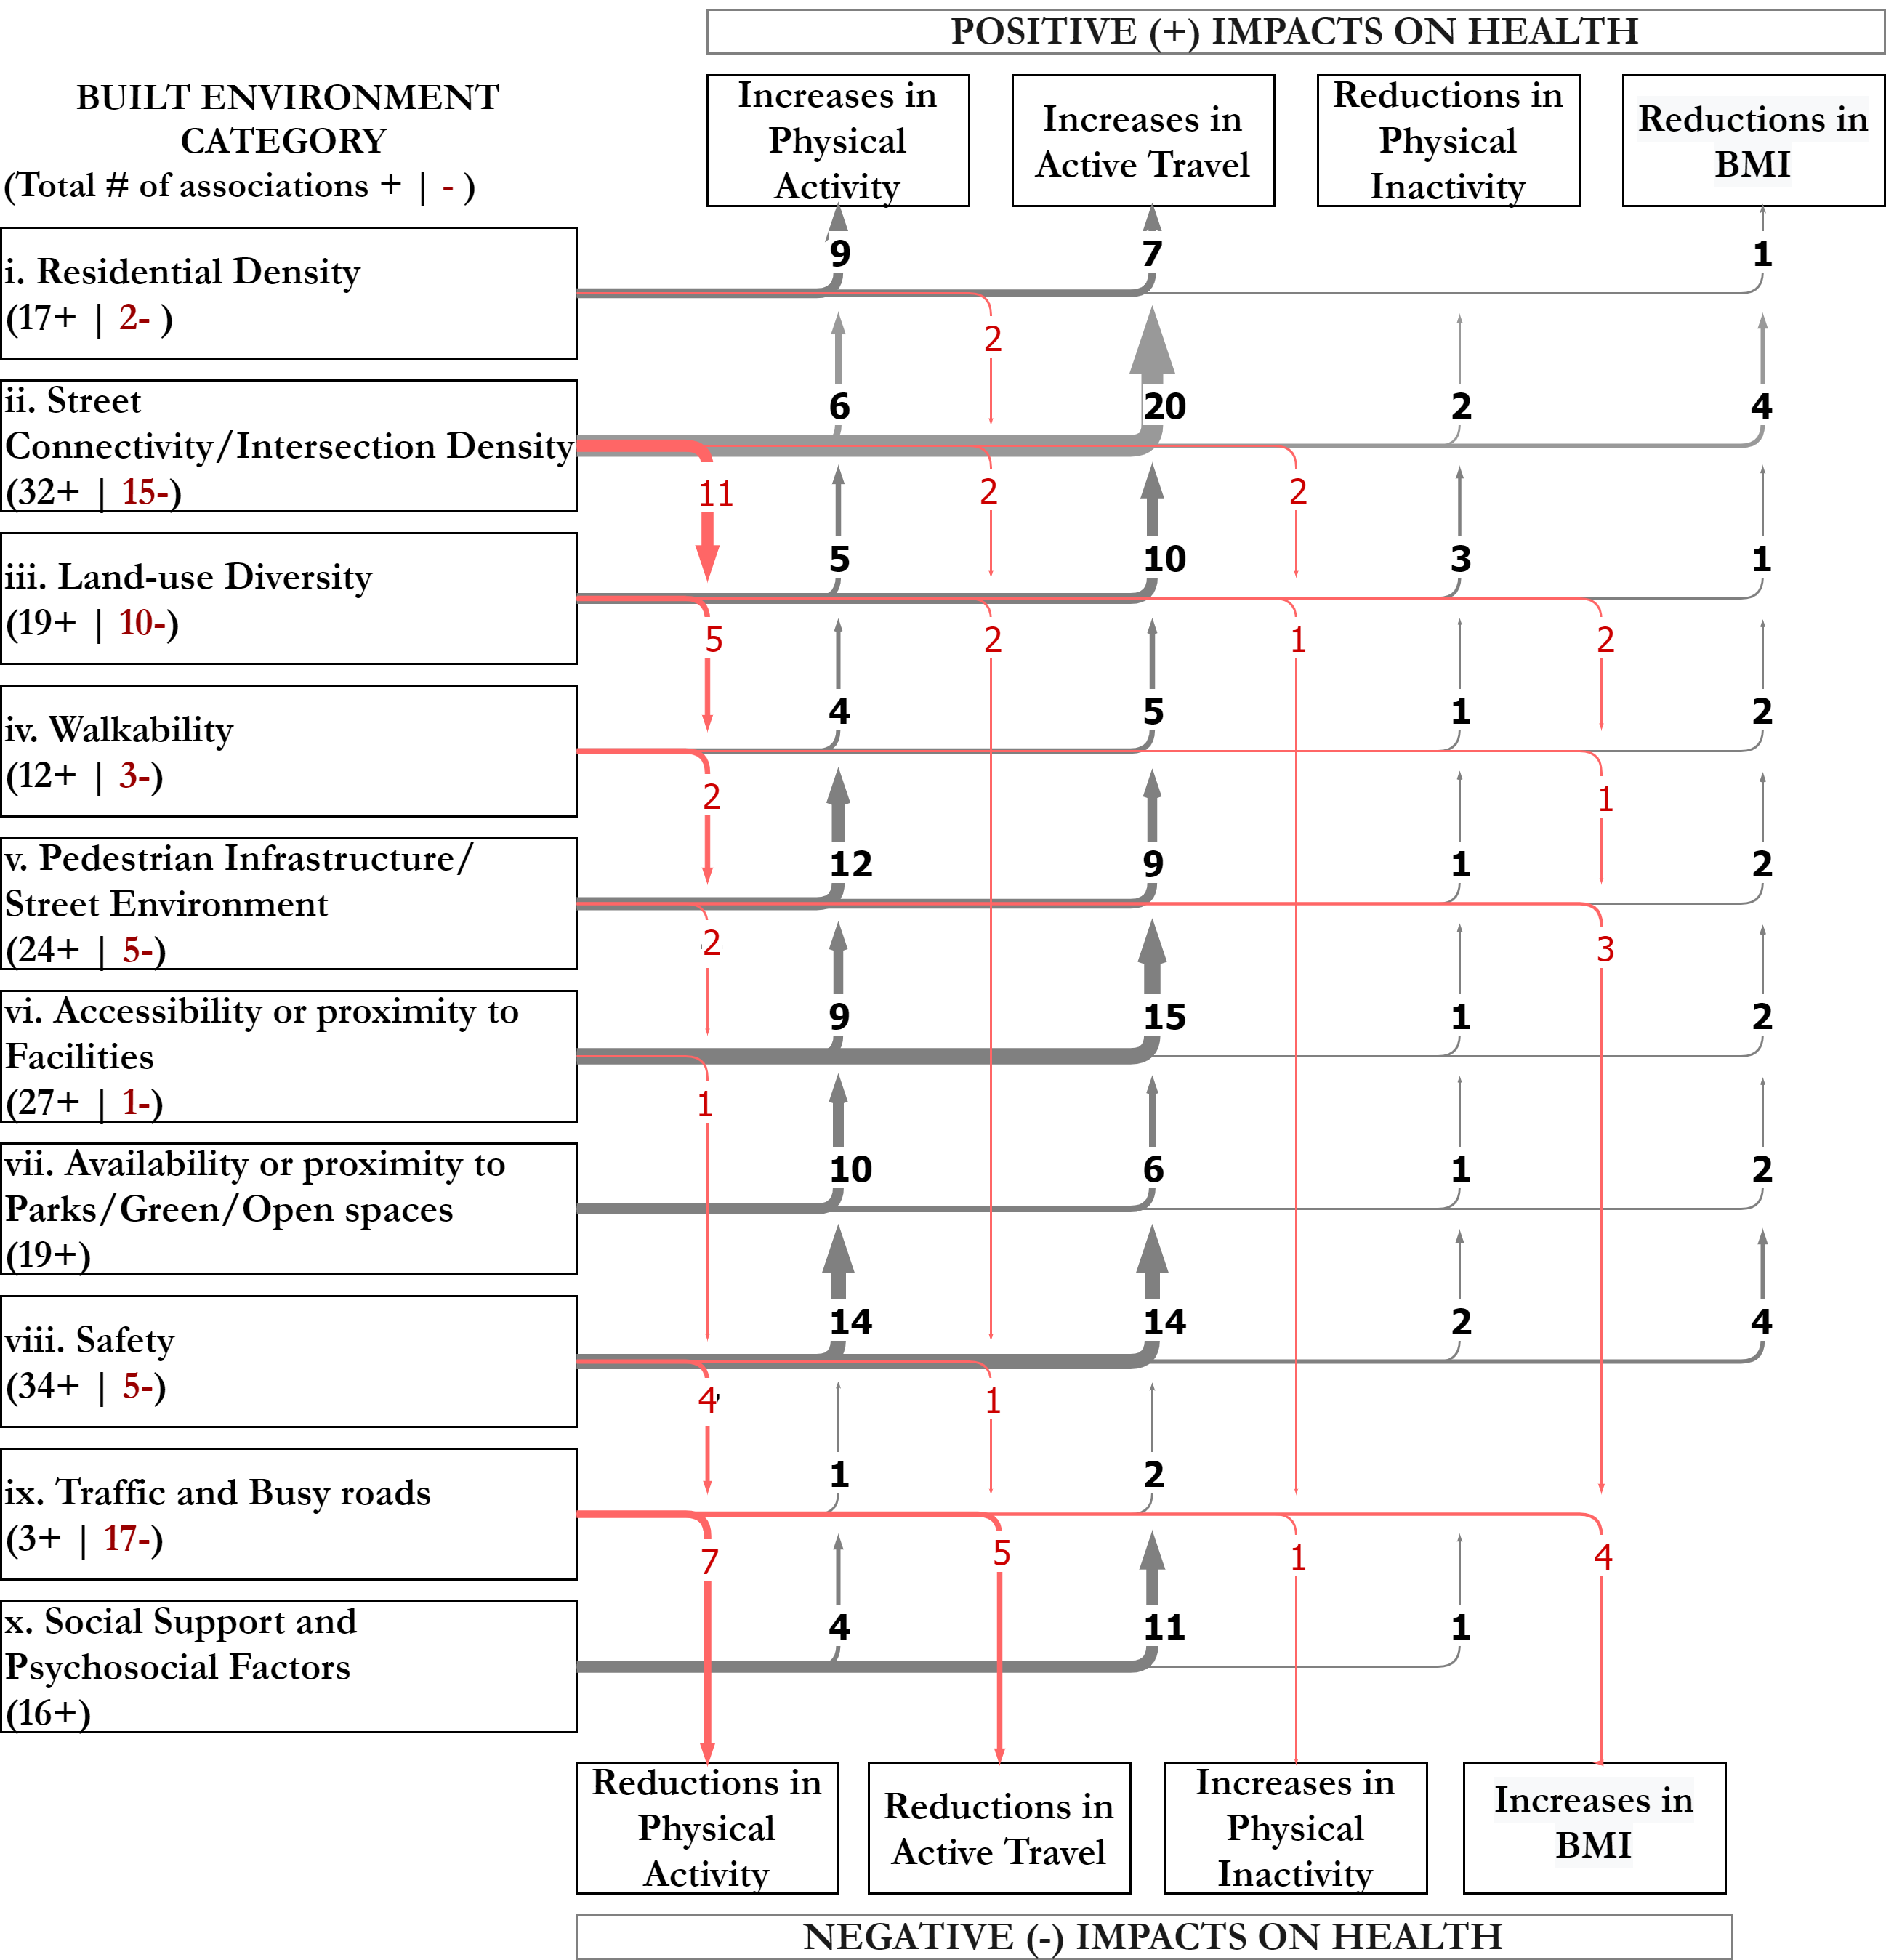
- Residential density (which in some cases measures child population density) was found to be an enabler mostly positively associated with both physical activity and active travel—linked to the presence of more people who can complete activities in the area or who can move around to connect with other people.
- Land-use diversity (mostly measured as a mix of different types of uses) was considered a physical activity enabler, namely as opportunities to move around or potentially as a proxy for characteristics of street vitality and safety. It was commonly related to active facades and “eyes on the street”, which urban design research has found to provide protection against crime (and fear of crime). Similarly, the presence of uses such as food and retail outlets or convenience stores was identified as a potential reason to engage in active travel. Conversely, in some contexts, mixed land-use was also considered as a proxy for overcrowding and potentially increased traffic, which create a less safe and pleasant environment, thus unsupportive to children’s physical activity. Land-use diversity was also considered a measure of risk for increased BMI, especially when it signalled increased exposure to fast food outlets.
- Street connectivity (measured as intersection density, or type, or street linearity, or block size) was generally identified as an enabler for active travel (walking) to school and objective physical activity, as greater connectivity normally leads to shorter routes from a to b. However, many other studies, as with land-use measures, identified increased street connectivity as a deterrent to child-reported physical activity or parent-reported play. This is because more connectivity—especially when measured as intersection density or the number of three- or four-way intersections—is likely to lead to an increase in the speed and volume of motorised traffic. In line with this, reduced street connectivity, which results in reductions in traffic levels and speeds, was seen as an enabler for objective and self-reported physical activity. This evidence suggests that increases in street connectivity can be considered proxy measures for reductions in traffic safety, in which case, reducing through traffic (e.g., via designed cul-de-sacs or planned school streets) creates “quiet ways”, which improve the perception of traffic safety and are therefore seen as better suited for encouraging physical activity and play [107].
- Walkability (namely the composite index) was mostly found to be an enabler of walking for active travel.
- Walking infrastructure and aesthetics assessed at the street level—via street audits or street perception questionnaires—were identified as enablers of active travel, physical activity, and play.
- Availability and proximity to green and blue infrastructure emerged as key enablers mainly of physical activity and play. Access to parks and open spaces was identified as one of the most protective environmental factor for children’s physical activity [40]. For travel, proximity to schools was the strongest enabler for active travel to school, in line with previous research [89].
- As in previous studies, positive perceptions of traffic and personal safety in the area (by both children and parents) were found to be mostly enablers for physical activity and active travel.
- Public transport or transit accessibility, which can be seen as a proxy for access to places beyond the neighbourhood—so generally expected to be an enabler—was measured in 20% of our reviewed studies, but with only three reported associations, two as barriers to children’s physical activity and one as an enabler of active travel. This may indicate that public transport accessibility, usually measured as the density of train stations or bus stops, can be, as land-use diversity, a proxy for high levels of street activity that lead to barriers to physical activity such as overcrowding and increased traffic.
6. Implications
6.1. For Research
6.2. For Practice and Policy
7. Strengths and Limitations
8. Conclusions
Supplementary Materials
Author Contributions
Funding
Data Availability Statement
Acknowledgments
Conflicts of Interest
References
- Villanueva, K.; Pereira, G.; Knuiman, M.; Bull, F.; Wood, L.; Christian, H.; Foster, S.; Boruff, B.J.; Beesley, B.; Hickey, S.; et al. The Impact of the Built Environment on Health across the Life Course: Design of a Cross-Sectional Data Linkage Study. BMJ Open 2013, 3, e002482. [Google Scholar] [CrossRef] [PubMed] [Green Version]
- Racioppi, F.; Dora, C.; Rutter, H. Urban Settings and Opportunities for Healthy Lifestyles: Rediscovering Walking and Cycling and Understanding Their Health Benefits. Built Environ. 2005, 31, 302–314. [Google Scholar] [CrossRef]
- Townshend, T.; Lake, A. Obesogenic Environments: Current Evidence of the Built and Food Environments. Perspect. Public Health 2017, 137, 38–44. [Google Scholar] [CrossRef] [PubMed] [Green Version]
- Sallis, J.F.; Glanz, K. The Role of Built Environments in Physical Activity, Eating, and Obesity in Childhood. Child. Obes. 2006, 16, 89–108. [Google Scholar] [CrossRef] [PubMed]
- Pineo, H.; Zimmermann, N.; Cosgrave, E.; Aldridge, R.W.; Acuto, M.; Rutter, H. Promoting a Healthy Cities Agenda through Indicators: Development of a Global Urban Environment and Health Index. Cities Health 2018, 2, 27–45. [Google Scholar] [CrossRef] [Green Version]
- Lachapelle, U.; Cloutier, M.-S. On the Complexity of Finishing a Crossing on Time: Elderly Pedestrians, Timing and Cycling Infrastructure. Transp. Res. Part. Policy Pract. 2017, 96, 54–63. [Google Scholar] [CrossRef]
- Blackwell, D.L.; Hayward, M.D.; Crimmins, E.M. Does Childhood Health Affect Chronic Morbidity in Later Life? Soc. Sci. Med. 2001, 52, 1269–1284. [Google Scholar] [CrossRef]
- Jacob, C.M.; Baird, J.; Barker, M.; Cooper, C.; Hanson, M. The Importance of a Life Course Approach to Health: Chronic Disease Risk from Preconception through Adolescence and Adulthood; World Health Organization White Paper; WHO: Geneva, Switzerland, 2017; p. 41. [Google Scholar]
- Gluckman, P.D.; Hanson, M.A.; Cooper, C.; Thornburg, K.L. Effect of In Utero and Early-Life Conditions on Adult Health and Disease. N. Engl. J. Med. 2008, 359, 61–73. [Google Scholar] [CrossRef] [Green Version]
- Masters, R.; Anwar, E.; Collins, B.; Cookson, R.; Capewell, S. Return on Investment of Public Health Interventions: A Systematic Review. J. Epidemiol. Community Health 2017, 71, 827–834. [Google Scholar] [CrossRef] [Green Version]
- Lambert, A.; Vlaar, J.; Herrington, S.; Brussoni, M. What Is the Relationship between the Neighbourhood Built Environment and Time Spent in Outdoor Play? A Systematic Review. Int. J. Environ. Res. Public Health 2019, 16, 3840. [Google Scholar] [CrossRef] [Green Version]
- Rothman, L.; Buliung, R.; Macarthur, C.; To, T.; Howard, A.; Health, C. Walking and Child Pedestrian Injury: A Systematic Review of Built Environment Correlates of Safe Walking. Inj. Prev. 2014, 20, 41–49. [Google Scholar] [CrossRef]
- Audrey, S.; Batista-Ferrer, H. Healthy Urban Environments for Children and Young People: A Systematic Review of Intervention Studies. Health Place 2015, 36, 97–117. [Google Scholar] [CrossRef] [Green Version]
- D’haese, S.; Vanwolleghem, G.; Hinckson, E.; De Bourdeaudhuij, I.; Deforche, B.; Van Dyck, D.; Cardon, G. Cross-Continental Comparison of the Association between the Physical Environment and Active Transportation in Children: A Systematic Review. Int. J. Behav. Nutr. Phys. Act. 2015, 12, 145. [Google Scholar] [CrossRef] [PubMed] [Green Version]
- Larouche, R.; Saunders, T.J.; Faulkner, G.E.J.; Colley, R.; Tremblay, M. Associations between Active School Transport and Physical Activity, Body Composition, and Cardiovascular Fitness: A Systematic Review of 68 Studies. J. Phys. Act. Health 2014, 11, 206–227. [Google Scholar] [CrossRef] [PubMed]
- Frank, L.; Giles-Corti, B.; Ewing, R. The Influence of the Built Environment on Transport and Health. J. Transp. Health 2016, 3, 423–425. [Google Scholar] [CrossRef]
- Wong, B.; Faulkner, G.; Buliung, R. GIS Measured Environmental Correlates of Active. Int. J. Behav. Nutr. Phys. Act. 2011, 8, 39. [Google Scholar] [CrossRef] [Green Version]
- Nordbø, E.C.A.; Nordh, H.; Raanaas, R.K.; Aamodt, G. GIS-Derived Measures of the Built Environment Determinants of Mental Health and Activity Participation in Childhood and Adolescence: A Systematic Review. Landsc. Urban. Plan. 2018, 177, 19–37. [Google Scholar] [CrossRef]
- Smith, M.; Cui, J.; Ikeda, E.; Mavoa, S.; Hasanzadeh, K.; Zhao, J.; Rinne, T.E.; Donnellan, N.; Kyttä, M. Objective Measurement of Children’s Physical Activity Geographies: A Systematic Search and Scoping Review. Health Place 2021, 67, 102489. [Google Scholar] [CrossRef]
- Pliakas, T.; Hawkesworth, S.; Silverwood, R.J.; Nanchahal, K.; Grundy, C.; Armstrong, B.; Casas, J.P.; Morris, R.W.; Wilkinson, P.; Lock, K. Optimising Measurement of Health-Related Characteristics of the Built Environment: Comparing Data Collected by Foot-Based Street Audits, Virtual Street Audits and Routine Secondary Data Sources. Health Place 2017, 43, 75–84. [Google Scholar] [CrossRef] [Green Version]
- Ozbil, A.; Yesiltepe, D.; Argin, G.; Rybarczyk, G. Children’s Active School Travel: Examining the Combined Perceived and Objective Built-Environment Factors from Space Syntax. Int. J. Environ. Res. Public. Health 2021, 18, 286. [Google Scholar] [CrossRef]
- Ewing, R. Can the Physical Environment Determine Physical Activity Levels? Exerc. Sport Sci. Rev. 2005, 33, 69–75. [Google Scholar] [CrossRef] [PubMed]
- Burton, E.J.; Mitchell, L.; Stride, C.B. Good Places for Ageing in Place: Development of Objective Built Environment Measures for Investigating Links with Older People’s Wellbeing. BMC Public Health 2011, 11, 839. [Google Scholar] [CrossRef] [PubMed] [Green Version]
- Wong, G.; Greenhalgh, T.; Westhorp, G.; Buckingham, J.; Pawson, R. RAMESES Publication Standards: Meta-Narrative Reviews. BMC Med. 2013, 11, 22. [Google Scholar] [CrossRef] [Green Version]
- Wright, J.; Hayward, A.C.; West, J.; Pickett, K.E.; Mceachan, R.M.; Mon-Williams, M.; Christie, N.; Vaughan, L.; Sheringham, J.; Haklay, M.; et al. ActEarly: A City Collaboratory Approach to Early Promotion of Good Health and Wellbeing [Version 1; Peer Review: 2 Approved] Open Peer Review. Wellcome Open Res. 2019, 4, 156. [Google Scholar] [CrossRef] [PubMed] [Green Version]
- Kaplan, S.; Sick Nielsen, T.A.; Prato, C.G. Walking, Cycling and the Urban Form: A Heckman Selection Model of Active Travel Mode and Distance by Young Adolescents. Transp. Res. Part Transp. Environ. 2016, 44, 55–65. [Google Scholar] [CrossRef] [Green Version]
- Belur, J.; Tompson, L.; Thornton, A.; Simon, M. Interrater Reliability in Systematic Review Methodology: Exploring Variation in Coder Decision-Making. Sociol. Methods Res. 2018, 50, 837–865. [Google Scholar] [CrossRef] [Green Version]
- Gwet, K.L. An Evaluation of the Impact of Design on the Analysis of Nominal-Scale Inter-Rater Reliability Studies; Advanced Analytics, LLC: Gaithersburg, MD, USA, 2018. [Google Scholar]
- Gehl, J. Cities for People; Island Press: Washington, DC, USA; London, UK, 2010; ISBN 1597269840. [Google Scholar]
- Department for Transport. Great Britain. Manual for Streets; Thomas Telford Publishing, Thomas Telford Ltd.: London, UK, 2007.
- Langdon, P. Within Walking Distance: Creating Livable Communities for All; Island Press: Washington, DC, USA, 2017; ISBN 1610917715. [Google Scholar]
- Da Silva, I.C.M.; Hino, A.A.; Lopes, A.; Ekelund, U.; Brage, S.; Gonçalves, H.; Menezes, A.B.; Reis, R.S.; Hallal, P.C. Built Environment and Physical Activity: Domain-and Activity-Specific Associations among Brazilian Adolescents. BMC Public Health 2017, 17, 616. [Google Scholar] [CrossRef] [Green Version]
- Bejarano, C.M.; Carlson, J.A.; Cushing, C.C.; Kerr, J.; Saelens, B.E.; Frank, L.D.; Glanz, K.; Cain, K.L.; Conway, T.L.; Sallis, J.F. Neighborhood Built Environment Associations with Adolescents’ Location-Specific Sedentary and Screen Time. Health Place 2019, 56, 147–154. [Google Scholar] [CrossRef]
- Hinckson, E.; Cerin, E.; Mavoa, S.; Smith, M.; Badland, H.; Stewart, T.; Duncan, S.; Schofield, G. Associations of the Perceived and Objective Neighborhood Environment with Physical Activity and Sedentary Time in New Zealand Adolescents. Int. J. Behav. Nutr. Phys. Act. 2017, 14, 145. [Google Scholar] [CrossRef] [Green Version]
- Engelberg, J.K.; Carlson, J.A.; Conway, T.L.; Cain, K.L.; Saelens, B.E.; Glanz, K.; Frank, L.D.; Sallis, J.F. Dog Walking among Adolescents: Correlates and Contribution to Physical Activity. Prev. Med. 2016, 82, 65–72. [Google Scholar] [CrossRef] [Green Version]
- Noonan, R.J.; Boddy, L.M.; Knowles, Z.R.; Fairclough, S.J. Cross-Sectional Associations between High-Deprivation Home and Neighbourhood Environments, and Health-Related Variables among Liverpool Children. BMJ Open 2016, 6, e008693. [Google Scholar] [CrossRef] [PubMed] [Green Version]
- Datar, A.; Nicosia, N.; Wong, E.; Shier, V. Neighborhood Environment and Children’s Physical Activity and Body Mass Index: Evidence from Military Personnel Installation Assignments. Child. Obes. 2015, 11, 130–138. [Google Scholar] [CrossRef] [PubMed] [Green Version]
- Carlson, J.A.; Sallis, J.F.; Kerr, J.; Conway, T.L.; Cain, K.; Frank, L.D.; Saelens, B.E. Built Environment Characteristics and Parent Active Transportation Are Associated with Active Travel to School in Youth Age 12–15. Br. J. Sports Med. 2014, 48, 1634–1639. [Google Scholar] [CrossRef] [PubMed]
- Oliver, M.; Mavoa, S.; Badland, H.; Parker, K.; Donovan, P.; Kearns, R.A.; Lin, E.Y.; Witten, K. Associations between the Neighbourhood Built Environment and out of School Physical Activity and Active Travel: An Examination from the Kids in the City Study. Health Place 2015, 36, 57–64. [Google Scholar] [CrossRef] [Green Version]
- Buck, C.; Eiben, G.; Lauria, F.; Konstabel, K.; Page, A.; Ahrens, W. Urban Moveability and Physical Activity in Children: Longitudinal Results from the IDEFICS and I.Family Cohort. Int. J. Behav. Nutr. Phys. Act. 2019, 16, 128. [Google Scholar] [CrossRef] [PubMed] [Green Version]
- Van Loon, J.; Frank, L.D.; Nettlefold, L.; Naylor, P.-J. Youth Physical Activity and the Neighbourhood Environment: Examining Correlates and the Role of Neighbourhood Definition. Soc. Sci. Med. 2014, 104, 107–115. [Google Scholar] [CrossRef]
- Timperio, A.; Crawford, D.; Ball, K.; Salmon, J. Associations between Neighbourhood Typologies and Physical Activity, Sedentary Time and TV Viewing among Children. J. Sci. Med. Sport 2014, 18, e153. [Google Scholar] [CrossRef]
- Queralt, A.; Molina-García, J. Physical Activity and Active Commuting in Relation to Objectively Measured Built-Environment Attributes among Adolescents. J. Phys. Act. Health 2019, 16, 371–374. [Google Scholar] [CrossRef]
- Autran, R.; Teixeira, H.; Ribeiro, A.I.; De Fatima De Pina, M.; Mota, J.; Dygryn, J.; Santos, M.P. Correlation between Neighborhood Walkability, Residential Density, Land-Use Mix with Moderate Physical Activity and Sedentary Time: An Exploratory Study in Porto. In Proceedings of the European Journal of Epidemiology.Conference: 8th European Congress of Epidemiology, Maastricht, The Netherlands, 25–27 June 2015; pp. 863–864. [Google Scholar]
- Rodríguez, D.A.; Cho, G.-H.; Evenson, K.R.; Conway, T.L.; Cohen, D.; Ghosh-Dastidar, B.; Pickrel, J.L.; Veblen-Mortenson, S.; Lytle, L.A. Out and about: Association of the Built Environment with Physical Activity Behaviors of Adolescent Females. Health Place 2012, 18, 55–62. [Google Scholar] [CrossRef] [Green Version]
- Cain, K.L.; Millstein, R.A.; Sallis, J.F.; Conway, T.L.; Gavand, K.A.; Frank, L.D.; Saelens, B.E.; Geremia, C.M.; Chapman, J.; Adams, M.A.; et al. Contribution of Streetscape Audits to Explanation of Physical Activity in Four Age Groups Based on the Microscale Audit of Pedestrian Streetscapes (MAPS). Soc. Sci. Med. 2014, 116, 82–92. [Google Scholar] [CrossRef]
- Lovasi, G.S.; Jacobson, J.S.; Quinn, J.W.; Neckerman, K.M.; Ashby-Thompson, M.N.; Rundle, A. Is the Environment near Home and School Associated with Physical Activity and Adiposity of Urban Preschool Children? J. Urban. Health 2011, 88, 1143–1157. [Google Scholar] [CrossRef] [PubMed] [Green Version]
- Macfarlane, D.; Lee, J.; Cerin, E. Associations between Walkability, Physical Activity and Body Fat in Hong Kong Adolescents. J. Sci. Med. Sport 2012, 15, S43–S44. [Google Scholar] [CrossRef] [Green Version]
- Molina-García, J.; Queralt, A. Neighborhood Built Environment and Socioeconomic Status in Relation to Active Commuting to School in Children. J. Phys. Act. Health 2017, 14, 761–765. [Google Scholar] [CrossRef]
- McGrath, L.J.; Hinckson, E.A.; Hopkins, W.G.; Mavoa, S.; Witten, K.; Schofield, G. Associations Between the Neighborhood Environment and Moderate-to-Vigorous Walking in New Zealand Children: Findings from the URBAN Study. Sports Med. 2016, 46, 1003–1017. [Google Scholar] [CrossRef]
- Carver, A.; Timperio, A.; Hesketh, K.; Crawford, D. Are Safety-Related Features of the Road Environment Associated with Smaller Declines in Physical Activity among Youth? J. Urban. Health 2010, 87, 29–43. [Google Scholar] [CrossRef] [Green Version]
- Bringolf-Isler, B.; Schindler, C.; de Hoogh, K.; Kayser, B.; Suggs, L.S.; Dössegger, A.; Probst-Hensch, N. Association of Objectively Measured and Perceived Environment with Accelerometer-Based Physical Activity and Cycling: A Swiss Population-Based Cross-Sectional Study of Children. Int. J. Public Health 2019, 64, 499–510. [Google Scholar] [CrossRef]
- Tappe, K.A.; Glanz, K.; Sallis, J.F.; Zhou, C.; Saelens, B.E. Children’s Physical Activity and Parents’ Perception of the Neighborhood Environment: Neighborhood Impact on Kids Study. Int. J. Behav. Nutr. Phys. Act. 2013, 10, 39. [Google Scholar] [CrossRef] [Green Version]
- Colabianchi, N.; Clennin, M.N.; Dowda, M.; Mciver, K.L.; Dishman, R.K.; Porter, D.E.; Pate, R.R. Moderating Effect of the Neighbourhood Physical Activity Environment on the Relation between Psychosocial Factors and Physical Activity in Children: A Longitudinal Study. J. Epidemiol. Community Health 2019, 73, 598–604. [Google Scholar] [CrossRef] [Green Version]
- Deforche, B.; Van Dyck, D.; Verloigne, M.; De Bourdeaudhuij, I. Perceived Social and Physical Environmental Correlates of Physical Activity in Older Adolescents and the Moderating Effect of Self-Efficacy. Prev. Med. 2010, 50, S24–S29. [Google Scholar] [CrossRef] [PubMed]
- Crawford, D.; Cleland, V.; Timperio, A.; Salmon, J.; Andrianopoulos, N.; Roberts, R.; Giles-Corti, B.; Baur, L.; Ball, K. The Longitudinal Influence of Home and Neighbourhood Environments on Children’s Body Mass Index and Physical Activity over 5 Years: The CLAN Study. Int. J. Obes. 2010, 34, 1177–1187. [Google Scholar] [CrossRef] [Green Version]
- Kaczynski, A.T.; Besenyi, G.M.; Child, S.; Morgan Hughey, S.; Colabianchi, N.; McIver, K.L.; Dowda, M.; Pate, R.R. Relationship of Objective Street Quality Attributes with Youth Physical Activity: Findings from the Healthy Communities Study. Pediatr. Obes. 2018, 13, 7–13. [Google Scholar] [CrossRef] [Green Version]
- Lin, J.-J.; Ting, T.-C. Built Environments and Physical Activities in Adolescents Aged 13–15. In Proceedings of the 17th International Conference of Hong Kong Society for Transportation Studies, HKSTS 2012: Transportation and Logistics Management, Hong Kong, China, 15–17 December 2012. [Google Scholar]
- Mcdonald, K.; Hearst, M.; Farbakhsh, K.; Patnode, C.; Forsyth, A.; Sirard, J.; Lytle, L. Adolescent Physical Activity and the Built Environment: A Latent Class Analysis Approach. Health Place 2011, 18, 191–198. [Google Scholar] [CrossRef]
- Miller, J.M.; Pereira, M.A.; Wolfson, J.; Laska, M.N.; Nelson, T.F.; Neumark-Sztainer, D. Are Correlates of Physical Activity in Adolescents Similar across Ethnicity/Race and Sex: Implications for Interventions. J. Phys. Act. Health 2019, 16, 1163–1174. [Google Scholar] [CrossRef] [PubMed]
- Boone-Heinonen, J.; Gordon-Larsen, P. Life Stage and Sex Specificity in Relationships between the Built and Socioeconomic Environments and Physical Activity. J. Epidemiol. Community Health 2011, 65, 847–852. [Google Scholar] [CrossRef] [PubMed]
- Mecredy, G.; Pickett, W.; Janssen, I. Street Connectivity Is Negatively Associated with Physical Activity in Canadian Youth. Int. J. Environ. Res. Public. Health 2011, 8, 3333–3350. [Google Scholar] [CrossRef]
- Barnett, T.; Henderson, M.; Contreras, G. Friends Make Children Less Sedentary but Neighborhoods Make Them More Active. In Proceedings of the Obesity Facts Conference: 24th Congress of the European Congress on Obesity, ECO 2017, Porto, Portugal, 17–20 May 2017; p. 236. [Google Scholar]
- French, S.A.; Sherwood, N.E.; Mitchell, N.R.; Fan, Y. Park Use Is Associated with Less Sedentary Time among Low-Income Parents and Their Preschool Child: The NET-Works Study. Prev. Med. Rep. 2017, 5, 7–12. [Google Scholar] [CrossRef] [Green Version]
- Lee, R.E.; Soltero, E.G.; Jáuregui, A.; Mama, S.K.; Barquera, S.; Jauregui, E.; Lopez Y Taylor, J.; Ortiz-Hernández, L.; Lévesque, L. Disentangling Associations of Neighborhood Street Scale Elements With Physical Activity in Mexican School Children. Environ. Behav. 2016, 48, 150–171. [Google Scholar] [CrossRef] [Green Version]
- Aarts, M.J.; de Vries, S.I.; van Oers, H.A.M.; Schuit, A.J. Outdoor Play among Children in Relation to Neighborhood Characteristics: A Cross-Sectional Neighborhood Observation Study. Int. J. Behav. Nutr. Phys. Act. 2012, 9, 1. [Google Scholar] [CrossRef] [Green Version]
- Bringolf-Isler, B.; Grize, L.; Mäder, U.; Ruch, N.; Sennhauser, F.H.; Braun-Fahrländer, C.; Team, S. Built Environment, Parents’ Perception, and Children’s Vigorous Outdoor Play. Prev. Med. 2010, 50, 251–256. [Google Scholar] [CrossRef] [PubMed]
- Yoon, J.; Lee, C. Neighborhood Outdoor Play of White and Non-White Hispanic Children: Cultural Differences and Environmental Disparities. Landsc. Urban Plann. 2019, 187, 11–22. [Google Scholar] [CrossRef]
- Molina-García, J.; Queralt, A.; Adams, M.A.; Conway, T.L.; Sallis, J.F. Neighborhood Built Environment and Socio-Economic Status in Relation to Multiple Health Outcomes in Adolescents. Prev. Med. J. 2017, 105, 88–94. [Google Scholar] [CrossRef]
- Bringolf-Isler, B.; de Hoogh, K.; Schindler, C.; Kayser, B.; Suzanne Suggs, L.; Dössegger, A.; Probst-Hensch, N.; SOPHYA Study Group, T. Sedentary Behaviour in Swiss Children and Adolescents: Disentangling Associations with the Perceived and Objectively Measured Environment. Int. J. Environ. Res. Public Health Artic. 2018, 15, 918. [Google Scholar] [CrossRef] [PubMed] [Green Version]
- Cerin, E.; Nathan, A.; van Cauwenberg, J.; Barnett, D.W.; Barnett, A. The Neighbourhood Physical Environment and Active Travel in Older Adults: A Systematic Review and Meta-Analysis. Int. J. Behav. Nutr. Phys. Act. 2017, 14, 15. [Google Scholar] [CrossRef] [PubMed] [Green Version]
- Katapally, T.R.; Rainham, D.; Muhajarine, N. The Influence of Weather Variation, Urban Design and Built Environment on Objectively Measured Sedentary Behaviour in Children. AIMS Public Health 2016, 3, 663–681. [Google Scholar] [CrossRef]
- Campos-Sánchez, F.S.; Abarca-Álvarez, F.J.; Molina-García, J.; Chillón, P. A GIS-Based Method for Analysing the Association Between School-Built Environment and Home-School Route Measures with Active Commuting to School in Urban Children and Adolescents. Int. J. Environ. Res. Public. Health 2020, 17, 2295. [Google Scholar] [CrossRef] [Green Version]
- Bosch, L.S.; Wells, J.C.; Lum, S.; Reid, A.M. Associations of the Objective Built Environment along the Route to School with Children’s Modes of Commuting: A Multilevel Modelling Analysis (the SLIC Study). PLoS ONE 2020, 15, e0231478. [Google Scholar] [CrossRef] [PubMed] [Green Version]
- Khalid, N.S.; Nasrudin, N.; Osman, N. Evaluating Neighbourhood Accessibility: A Spatial Analysis of Walking Preferences. Int. J. Psychosoc. Rehabil. 2020, 24, 2395–2409. [Google Scholar] [CrossRef]
- Molina-García, J.; García-Massó, X.; Estevan, I.; Queralt, A. Built Environment, Psychosocial Factors and Active Commuting to School in Adolescents: Clustering a Self-Organizing Map Analysis. Int. J. Environ. Res. Public Health Artic. 2019, 16, 83. [Google Scholar] [CrossRef] [Green Version]
- Tewahade, S.; Li, K.; Goldstein, R.B.; Haynie, D.; Iannotti, R.J.; Simons-Morton, B. Association between the Built Environment and Active Transportation among U.S. Adolescents. J. Transp. Health 2019, 15, 100629. [Google Scholar] [CrossRef]
- Argin, G.; Ozbil, A. Walking to School: The Effects of Street Network Configuration and Urban Design Qualities on Route Selection Behaviour of Elementary School Students. In Proceedings of the 10th International Space Syntax Symposium, London, UK, 17 July 2015; p. 118. [Google Scholar]
- Marwa, N.; Muhajarine, N. Understanding the Effects of Neighborhood Design and Built Environment on Active Transportation among Children in the City of Saskatoon. In Proceedings of the American Journal of Epidemiology, Conference: 2012 National Student Conference of the Canadian Society for Epidemiology and Biostatics, CSEB 2012, Saskatoon, SK, Canada, 13–14 May 2012; p. 82. [Google Scholar]
- Christiansen, L.B.; Toftager, M.; Schipperijn, J.; Ersbøll, A.K.; Giles-Corti, B.; Troelsen, J. School Site Walkability and Active School Transport-Association, Mediation and Moderation. J. Transp. Geogr. 2014, 34, 7–15. [Google Scholar] [CrossRef]
- Lee, J.S. Urban Form, Children’s Active Travel to/from School, and Travel Related Physical Activity. Int. Rev. Spat. Plan. Sustain. Dev. 2020, 8, 21–38. [Google Scholar] [CrossRef] [Green Version]
- Helbich, M.; van Emmichoven, M.J.Z.; Dijst, M.J.; Kwan, M.P.; Pierik, F.H.; de Vries, S.I. Natural and Built Environmental Exposures on Children’s Active School Travel: A Dutch Global Positioning System-Based Cross-Sectional Study. Health Place 2016, 39, 101–109. [Google Scholar] [CrossRef]
- Carver, A.; Panter, J.R.; Jones, A.P.; van Sluijs, E.M.F. Independent Mobility on the Journey to School: A Joint Cross-Sectional and Prospective Exploration of Social and Physical Environmental Influences. J. Transp. Health 2014, 1, 25–32. [Google Scholar] [CrossRef]
- Argın, G.; Yeşiltepe, D.; Özbil, A. The Effects of Street Network Configuration and Street-Level Urban Design on Route Choice Behaviour: An Analysis of Elementary School Students Walking to/from School in Istanbul. In Proceedings of the 11th International Space Syntax Symposium, Lisbon, Portugal, 3–7 July 2017. [Google Scholar]
- Macdonald, L.; Mccrorie, P.; Nicholls, N.; Olsen, J.R. Active Commute to School: Does Distance from School or Walkability of the Home Neighbourhood Matter? A National Cross-Sectional Study of Children Aged 10-11 Years, Scotland, UK. BMJ Open 2019, 9, e033628. [Google Scholar] [CrossRef] [PubMed] [Green Version]
- Wang, X.; Conway, T.L.; Cain, K.L.; Frank, L.D.; Saelens, B.E.; Geremia, C.; Kerr, J.; Glanz, K.; Carlson, J.A.; Sallis, J.F. Interactions of Psychosocial Factors with Built Environments in Explaining Adolescents’ Active Transportation. Prev. Med. 2017, 100, 76–83. [Google Scholar] [CrossRef] [PubMed]
- Veitch, J.; Carver, A.; Salmon, J.; Abbott, G.; Ball, K.; Crawford, D.; Cleland, V.; Timperio, A. What Predicts Children’s Active Transport and Independent Mobility in Disadvantaged Neighborhoods? Health Place 2017, 44, 100–109. [Google Scholar] [CrossRef] [PubMed]
- Mitra, R.; Buliung, R.N. Exploring Differences in School Travel Mode Choice Behaviour between Children and Youth. Transp. Policy 2015, 42, 4–11. [Google Scholar] [CrossRef]
- Larsen, K.; Gilliland, J.; Hess, P.M. Route-Based Analysis to Capture the Environmental Influences on a Child’s Mode of Travel between Home and School. Ann. Assoc. Am. Geogr. 2012, 102, 1348–1365. [Google Scholar] [CrossRef]
- Rodríguez, D.A.; Merlin, L.; Prato, C.G.; Conway, T.L.; Cohen, D.; Elder, J.P.; Evenson, K.R.; Mckenzie, T.L.; Pickrel, J.L.; Veblen-Mortenson, S. Influence of the Built Environment on Pedestrian Route Choices of Adolescent Girls. Environ. Behav. 2015, 47, 359–394. [Google Scholar] [CrossRef] [Green Version]
- Ghekiere, A.; Carver, A.; Veitch, J.; Salmon, J.; Deforche, B.; Timperio, A. Does Parental Accompaniment When Walking or Cycling Moderate the Association between Physical Neighbourhood Environment and Active Transport among 10–12 Year Olds? J. Sci. Med. Sport 2016, 19, 149–153. [Google Scholar] [CrossRef]
- Dessing, D.; De Vries, S.I.; Hegeman, G.; Verhagen, E.; Van Mechelen, W.; Pierik, F.H. Children’s Route Choice during Active Transportation to School: Difference between Shortest and Actual Route. Int. J. Behav. Nutr. Phys. Act. 2016, 13, 48. [Google Scholar] [CrossRef] [Green Version]
- Yesiltepe, D.; Ozbil, A. The Effects of Perceived and Objective Measures of Home-Environment on Transportation and Recreational Walking among Children the Effects of Perceived and Objective. In Proceedings of the 10th International Space Syntax Symposium, London, UK, 13–17 July 2015; pp. 87:1–87:15. [Google Scholar]
- Giles-Corti, B.; Wood, G.; Pikora, T.; Learnihan, V.; Bulsara, M.; Van Niel, K.; Timperio, A.; McCormack, G.; Villanueva, K. School Site and the Potential to Walk to School: The Impact of Street Connectivity and Traffic Exposure in School Neighborhoods. Health Place 2011, 17, 545–550. [Google Scholar] [CrossRef]
- Dzhambov, A.; Hartig, T.; Markevych, I.; Tilov, B.; Dimitrova, D. Urban Residential Greenspace and Mental Health in Youth: Different Approaches to Testing Multiple Pathways Yield Different Conclusions. Environ. Res. 2018, 160, 47–59. [Google Scholar] [CrossRef]
- Özbil, A.; Yeşiltepe, D.; Argın, G. Home and School Environmental Correlates of Childhood BMI. J. Transp. Health 2020, 16, 100823. [Google Scholar] [CrossRef]
- Jia, P.; Xue, H.; Cheng, X.; Wang, Y.; Wang, Y. Association of Neighborhood Built Environments with Childhood Obesity: Evidence from a 9-Year Longitudinal, Nationally Representative Survey in the US. Environ. Int. 2019, 128, 158–164. [Google Scholar] [CrossRef]
- Duncan, D.T.; Castro, M.C.; Gortmaker, S.L.; Aldstadt, J.; Melly, S.J.; Bennett, G.G. Racial Differences in the Built Environment-Body Mass Index Relationship? A Geospatial Analysis of Adolescents in Urban Neighborhoods. Int. J. Health Geogr. 2012, 11, 11. [Google Scholar] [CrossRef] [PubMed] [Green Version]
- Timperio, A.; Jeffery, R.W.; Crawford, D.; Roberts, R.; Giles-Corti, B.; Ball, K. Neighbourhood Physical Activity Environments and Adiposity in Children and Mothers: A Three-Year Longitudinal Study. Int. J. Behav. Nutr. Phys. Act. 2010, 7, 18. [Google Scholar] [CrossRef] [PubMed] [Green Version]
- Thielman, J.; Copes, R.; Rosella, L.C.; Chiu, M.; Manson, H. Is Neighbourhood Walkability Related to Body Mass Index among Different Age Groups? A Cross-Sectional Study of Canadian Urban Areas. BMJ Open 2019, 9, e032475. [Google Scholar] [CrossRef] [PubMed]
- Gose, M.; Plachta-Danielzik, S.; Willié, B.; Johannsen, M.; Landsberg, B.; Müller, M.J. Longitudinal Influences of Neighbourhood Built and Social Environment on Children’s Weight Status. Int. J. Environ. Res. Public. Health 2013, 10, 5083–5096. [Google Scholar] [CrossRef] [PubMed]
- Ghenadenik, A.E.; Kakinami, L.; Van Hulst, A.; Henderson, M.; Barnett, T.A. Neighbourhoods and Obesity: A Prospective Study of Characteristics of the Built Environment and Their Association with Adiposity Outcomes in Children in Montreal, Canada. Prev. Med. 2018, 111, 35–40. [Google Scholar] [CrossRef]
- Gilliland, J.A.; Rangel, C.Y.; Healy, M.A.; Tucker, P.; Loebach, J.E.; Hess, P.M.; He, M.; Irwin, J.D.; Wilk, P. Linking Childhood Obesity to the Built Environment: A Multi-Level Analysis of Home and School Neighbourhood Factors Associated with Body Mass Index. J. Public Health Rev. Can. St. Publique 2012, 103, 15–21. [Google Scholar] [CrossRef]
- Barnett, T.A.; Van Hulst, A.; Kestens, Y.; Chaix, B.; Henderson, M. Neighbourhood Built Environment Typologies and Adiposity in School Age Children. In Proceedings of the Obesity Facts. Conference: 22nd Congress of the European Congress on Obesity, ECO 2015, Prague, Czech Republic, 6–9 May 2015. [Google Scholar]
- Hoyt, L.T.; Kushi, L.H.; Leung, C.W.; Nickleach, D.C.; Adler, N.; Laraia, B.A.; Hiatt, R.A.; Yen, I.H. Neighborhood Influences on Girls’ Obesity Risk Across the Transition to Adolescence. Pediatrics 2014, 134, 942–949. [Google Scholar] [CrossRef] [PubMed] [Green Version]
- Amram, O.; Amiri, S.; Lutz, R.B.; Crowley, A.; Monsivais, P. The Association Between Obesity, Socio-Economic Status, and Neighborhood Environment: A Multi-Level Analysis of Spokane Public Schools. J. Community Health 2020, 45, 41–47. [Google Scholar] [CrossRef] [PubMed]
- Rothman, L.; Buliung, R.; To, T.; Macarthur, C.; Macpherson, A.; Howard, A. Associations between Parents Perception of Traffic Danger, the Built Environment and Walking to School. J. Transp. Health 2015, 2, 327–335. [Google Scholar] [CrossRef]
- De Meester, F.; Van Dyck, D.; De Bourdeaudhuij, I.; Deforche, B.; Cardon, G. Do Psychosocial Factors Moderate the Association between Neighborhood Walkability and Adolescents’ Physical Activity? Soc. Sci. Med. 2013, 81, 1–9. [Google Scholar] [CrossRef]
- Verhoeven, H.; Simons, D.; Van Dyck, D.; Van Cauwenberg, J.; Clarys, P.; De Bourdeaudhuij, I.; De Geus, B.; Vandelanotte, C.; Deforche, B. Psychosocial and Environmental Correlates of Walking, Cycling, Public Transport and Passive Transport to Various Destinations in Flemish Older Adolescents. PLoS ONE 2016, 11, e0147128. [Google Scholar] [CrossRef] [Green Version]
- De Vries, S.; Van Dillen, S.M.E.; Groenewegen, P.P.; Spreeuwenberg, P. Streetscape Greenery and Health: Stress, Social Cohesion and Physical Activity as Mediators. Soc. Sci. Med. 2013, 94, 26–33. [Google Scholar] [CrossRef] [Green Version]
- Roberts, H.; McEachan, R.; Margary, T.; Conner, M.; Kellar, I. Identifying Effective Behavior Change Techniques in Built Environment Interventions to Increase Use of Green Space: A Systematic Review. Environ. Behav. 2018, 50, 28–55. [Google Scholar] [CrossRef]
- Carmona, M.; Gabrieli, T.; Hickman, R.; Laopoulou, T.; Livingstone, N. Street Appeal. The Value of Street Improvements. Prog. Plan. 2018, 126, 1–51. [Google Scholar] [CrossRef]
- Sampson, R.J.; Raudenbush, S.W. Seeing Disorder: Neighborhood Stigma and the Social Construction of “Broken Windows”. Soc. Psychol. Q. 2004, 67, 319–342. [Google Scholar] [CrossRef] [Green Version]
- Mackett, R.; Brown, B.; Gong, Y.; Kitazawa, K. Children’s Independent Movement in the Local Environment. Child. Young People Built Environ. 2007, 33, 454–468. [Google Scholar] [CrossRef]
- Cervero, R.; Kockelman, K. Travel demand and the 3ds: Density, diversity, and design. Transpn Res. D 1997, 2, 199–219. [Google Scholar] [CrossRef]
- Ewing, R.; Cervero, R. Travel and the Built Environment A Synthesis. Transp. Res. Rec. 2001, 1780, 87–114. [Google Scholar] [CrossRef] [Green Version]
- Ewing, R.; Cervero, R. Travel and the Built Environment a Meta-Analysis. J. Am. Plann. Assoc. 2010, 76, 265–294. [Google Scholar] [CrossRef]
- United Nations. Planning and Design for Sustainable Urban Mobility; Routledge: New York, NY, USA, 2013; ISBN 9780415723183.
- Dhanani, A.; Tarkhanyan, L.; Vaughan, L. Estimating Pedestrian Demand for Active Transport Evaluation and Planning. Transp. Res. Part. Policy Pract. 2017, 103, 54–69. [Google Scholar] [CrossRef] [Green Version]
- Frank, L.D.; Schmid, T.L.; Sallis, J.F.; Chapman, J.; Saelens, B.E. Linking Objectively Measured Physical Activity with Objectively Measured Urban Form. Am. J. Prev. Med. 2005, 28, 117–125. [Google Scholar] [CrossRef]
- Ettema, D.; Schekkerman, M. How Do Spatial Characteristics Influence Well-Being and Mental Health ? Comparing the Effect of Objective and Subjective Characteristics at Different Spatial Scales. Travel Behav. Soc. 2016, 5, 56–67. [Google Scholar] [CrossRef]
- McEachan, R.R.C.; Yang, T.C.; Roberts, H.; Pickett, K.E.; Arseneau-Powell, D.; Gidlow, C.J.; Wright, J.; Nieuwenhuijsen, M. Availability, Use of, and Satisfaction with Green Space, and Children’s Mental Wellbeing at Age 4 Years in a Multicultural, Deprived, Urban Area: Results from the Born in Bradford Cohort Study. Lancet Planet. Health 2018, 2, e244–e254. [Google Scholar] [CrossRef]
- Burton, E. The Importance of the Built Environment to Children’s Wellbeing. In Proceedings of the Urban Age Conference, Cities, Health and Well-Being, Hong Kong, China, 16–17 November 2011. [Google Scholar]
- Guha, M.; Channon, B. Mental Health in the Built Environment. J. Ment. Health 2020, 29, 611–613. [Google Scholar] [CrossRef]
- Greer, A.E.; Martinez-Carrasco, A.; Goldsman, D.; Knausenberger, A.-U. Walking Toward a Brighter Future: A Participatory Research Process to Advocate for Improved Walk-to-School Corridors. Health Promot. Pract. 2019, 22, 248–256. [Google Scholar] [CrossRef]


| Characteristics | No/% Articles | Characteristics | No/% Articles | ||
|---|---|---|---|---|---|
| Geographical Region | Built Environment Measures | ||||
| Australia and New Zealand | 14 | 13% | Street connectivity/intersection density | 62 | 57% |
| Canada | 16 | 15% | Land-use diversity | 45 | 42% |
| Central Asia | 5 | 5% | Residential density | 41 | 38% |
| East Asia | 3 | 3% | Public transport accessibility | 20 | 19% |
| Europe and UK | 29 | 27% | Walkability | 28 | 26% |
| Latin America | 3 | 3% | Street audit | 30 | 28% |
| Middle East | 2 | 2% | Distance to PA destinations | 24 | 22% |
| US | 36 | 33% | Distance to school | 22 | 20% |
| Study Design | Traffic calming measures | 12 | 11% | ||
| Cross-sectional | 85 | 79% | Traffic levels | 12 | 11% |
| Longitudinal | 13 | 12% | Crime levels | 9 | 8% |
| Other | 10 | 9% | Greenness and/or vegetation or tree cover | 5 | 5% |
| Sample Size | Health Activities and Behaviours | ||||
| <100 | 3 | 3% | Observed MVPA/PA (accelerometer) | 29 | 27% |
| 100–500 | 38 | 35% | Self-Reported MVPA/PA | 11 | 10% |
| 501–1000 | 20 | 19% | Observed ST/PIA (accelerometer) | 3 | 3% |
| 1001–3000 | 25 | 23% | Self-Reported ST/PIA | 1 | 1% |
| 3001–10,000 | 12 | 11% | Observed PA/street or park use | 4 | 4% |
| >10,000 | 6 | 6% | Parent-Reported Play | 3 | 3% |
| Age | Parent-Reported Active Travel/PA | 6 | 6% | ||
| Adolescents (12–18 years old) | 32 | 30% | Observed Active Travel to School | 2 | 2% |
| Children (5–11 years old) | 27 | 25% | Self-Reported Active Travel to School | 10 | 9% |
| Children and Adolescents (5–18 years old) | 46 | 43% | Self-Reported travel to school (trips, mode) | 12 | 11% |
| Early years (0–4 years old) | 3 | 3% | Observed travel (mode, route) | 3 | 3% |
| Study Area (Size) | Self-Reported active travel non-school | 2 | 2% | ||
| 100 m–2 km (mode 800 m, n = 21) | 55 | 51% | Self-Reported travel (trips, mode, route) | 1 | 1% |
| 2 km–5 km | 53 | 49% | Self-Reported energy intake and expenditure | 1 | 1% |
| Study Area (Definition) | No health activity measure | 20 | 19% | ||
| Home and school (Euclidian) | 4 | 4% | Health Outcome | ||
| Home and school (network) | 3 | 3% | No health outcome | 66 | 61% |
| Home (Euclidian) | 27 | 25% | Asthma-related | 2 | 2% |
| Home (network) | 11 | 10% | Birth weight | 1 | 1% |
| Route (home to school) | 12 | 11% | Depression | 1 | 1% |
| School (Euclidian) | 12 | 11% | Mental health | 1 | 1% |
| School (network) | 1 | 1% | Positive child development | 1 | 1% |
| Pre-determined areas (e.g., census tract) | 27 | 25% | Objective BMI | 21 | 19% |
| Other | 11 | 10% | Reported BMI | 12 | 11% |
| Reported school performance | 1 | 2% | |||
| Reported street injuries | 1 | 1% | |||
| Reported child pedestrian crashes | 1 | 1% | |||
| Standardised Self-Reported Tools to Measure Physical Activity and Active Travel | Studies |
| International Physical Activity Questionnaire (IPAQ) or (IPAQ short) | 2 |
| Short Questionnaire to Assess Health-enhancing PA (SQUASH) | 1 |
| Physical Activity Questionnaire for Older Children (PAQ-C) | 1 |
| Global Physical Activity Questionnaire (GPAQ) | 1 |
| Flemish Physical Activity Questionnaire | 1 |
| Up4it Physical activity survey | 1 |
| School Physical Activity and Nutrition Environment Tool (SPAN-ET) | 1 |
| Physical Activity Location Measurement System (PALMS) | 1 |
| Various types of travel diaries | 2 |
| Objective Tools to Measure Physical Activity and Active Travel | |
| Accelerometers or GPS instruments | 30 |
| System for Observing Play and Recreation in Communities (SOPARC) | 4 |
| Standardised Street Environment Audit Instruments (Objective) | |
| Abbreviated Pedestrian Environment Data Scan (PEDS) | 1 |
| Active Neighbourhood Checklist (ANC) | 1 |
| Community Park Audit Tool (CPAT) | 1 |
| Irvine-Minnesota Inventory | 2 |
| Microscale Audit of Pedestrian Streetscapes (MAPS) | 3 |
| Neighbourhood Destination accessibility—children (NDAI-C) | 1 |
| Neighbourhood Active Living Potential (NALP) | 2 |
| Neighbourhood Destination Accessibility Index (NDAI) | 1 |
| Neighbourhood Inventory for Environmental Typology (NIfETy) | 1 |
| Neighbourhood PA environment (NPAE) windshield survey | 1 |
| Physical Activity Resource Assessment (PARA) | 2 |
| PIN3 Neighbourhood Audit Instrument | 1 |
| School Site Audits (Delaware Department of Transportation) | 1 |
| SPACES or New Zealand SPACES (NZ-SPACES) | 2 |
| Street Design Environmental Audit Tool (modified ANC) | 1 |
| Standardised Self-Reported Street Environment Perceptions Questionnaires (Subjective) | |
| Australian Children Living in Active Neighbourhoods study questionnaire (CLAN) | 2 |
| Neighbourhood Environment Walkability Scale (NEWS) | 2 |
| Neighbourhood Environment Walkability Scale—Youth Version (NEWS-Y) | 6 |
| Barriers for Active Travel to the Centre of Education (BATACE) Spanish questionnaire | 1 |
| PHYSICAL ACTIVITY | PHYSICAL INACTIVITY | |||||||||||||||||||||||||
| Total PA | Objective MVPA/PA | Self-Reported MVPA/PA | Objective Play or Park Use | Parent-Report Play or Park Use | Total Objective Sedentary Time/Physical Inactivity | |||||||||||||||||||||
| BUILT ENVIRONMENT ATTRIBUTES | ▲ | ▼ | ◂▸ | ▲ | ▼ | ◂▸ | ▲ | ▼ | ◂▸ | ▲ | ▼ | ◂▸ | ▲ | ▼ | ◂▸ | ▲ | ▼ | ◂▸ | ||||||||
| (i) | Residential Density/Use | 9 | 6 | 1, L4, 11, 20, 21, 24 | 2 | 34, 30 | 1 | 43 | ||||||||||||||||||
| (ii) | Land Use Mix/Diversity | 5 | 3 | 3 | 5, 11, 13 | 2 | 10, 23 | 1 1 | 1 | 30 | 1 41 | 1 | 43 | 1 35 | 3 | L2, 12, 35 | 2 1, 15 | |||||||||
| Food outlets, retail density, commercial activities | 2 | 1 | 21 | 1 | 42 | |||||||||||||||||||||
| (iii) | Intersection Density or Street connectivity | 6 | 11 | 6 | L4, L6, 10, 11, 23, 24 | 2 | 24, 8 | 1 1 | 7 | 22, 25, 26, 28, 30, 32, 33 | 2 | 39, 43 | 2 35, 36 | 2 | 12, 35 | 1 1 | ||||||||||
| (iv) | Walkability | 4 | 2 | 1 | 4 | L4, 10, 14, 18 | 1 | 16 | 1 1 | 1 | 18 | 2 1, 15 | ||||||||||||||
| (v) | Walking Infrastructure | 7 | 1 | 2 | 5, 9, 19 | 1 | 16 | 1 41 | 4 | 22, 38, 40, 42 | 1 | 39 | 1 | 35 | ||||||||||||
| Aesthetics | 5 | 1 | 3 | 5,11, 16 | 2 | 22, 34 | 1 | 29 | ||||||||||||||||||
| (vi) | Accessibility to Destinations (Play/Sport Destinations) | 4 | 2 | 5, 23 | 2 | 30, 57 | ||||||||||||||||||||
| Proximity to school | 2 | 2 | 16, 24 | 1 | 37 | |||||||||||||||||||||
| Proximity to recreation sites | 3 | 1 | 1 | 2 | 22, 24 | 1 | 26 | 1 31 | 1 | 22 | ||||||||||||||||
| (vii) | Availability of Parks/Public Open Spaces or Social Spaces | 5 | 5 | L4, 7, 11, 21, 24 | ||||||||||||||||||||||
| Green Space/Street Greenery or Natural Water | 5 | 5 | 3, 9, 13, 16, 20 | 1 | 36 | |||||||||||||||||||||
| (viii) | Personal Safety | 4 | 1 | 3 | 1 | 26 | 2 | 22, 43 | 2 | L2, 36 | ||||||||||||||||
| Crime/Physical Incivilities | 3 | 3 | 1 | 23 | 1 | 7 | 1 | 34 | 1 | 25 | 1 41 | 1 | 40 | |||||||||||||
| Traffic Safety | 4 | 1 | 1 | 24 | 1 | 10 | 2 | 34, 57 | 1 | 39 | ||||||||||||||||
| Traffic Calming | 2 | 1 | L6 | 1 | 38 | |||||||||||||||||||||
| Traffic Lights | 1 | 1 | 38 | |||||||||||||||||||||||
| (ix) | Traffic Levels | 1 | 1 | 23 | ||||||||||||||||||||||
| Traffic Accidents | ||||||||||||||||||||||||||
| Crossing busy street | 1 | 1 | 40 | |||||||||||||||||||||||
| Ratio of high to low-speed roads, proportion/density of main roads | 1 | 3 | 3 | 19, 21, 24 | 1 | 30 | 1 36 | |||||||||||||||||||
| Public transport | 2 | 1 | 30 | 1 41 | ||||||||||||||||||||||
| Pollution (air, noise) | ||||||||||||||||||||||||||
| Housing (Living in a house) | 1 | 1 | 10 | |||||||||||||||||||||||
| Parental Socio-economic Status | 1 | 1 | 10 | |||||||||||||||||||||||
| Access to motorized vehicles at home, travel by motorized transport | 1 37 | |||||||||||||||||||||||||
| (x) | Social Norms/Support, Parental Accompaniment | 4 | 4 | 7, 8, 10, 24 | 1 | L2 | ||||||||||||||||||||
| Self-efficacy | ||||||||||||||||||||||||||
| Enjoyment/Satisfaction | ||||||||||||||||||||||||||
| ACTIVE TRAVEL | OBESITY | |||||||||||||||||||||||
| Total Active Travel | Objective Active Travel to School | Self-Reported Active Travel to School | Parent-Reported Active Travel | Self-Reported Active Travel | Total Objective BMI | |||||||||||||||||||
| BUILT ENVIRONMENT ATTRIBUTES | ▲ | ▼ | ◂▸ | ▲ | ▼ | ◂▸ | ▲ | ▼ | ◂▸ | ▲ | ▼ | ◂▸ | ▲ | ▼ | ◂▸ | ▲ | ▼ | ◂▸ | ||||||
| (i) | Residential Density/Use | 7 | 2 | 1 | 44 | 5 | 51, 65, L69, 53, 63 | 1 61 | 1 | 72 | 1 74 | 1 | 91 | |||||||||||
| (ii) | Land Use Mix/Diversity | 6 | 2 | 1 | 47 | 4 | 52, L69, L54, 57 | 2 52, 61 | 1 | 5 | ||||||||||||||
| Food Outlets, Retail Density, Commercial Activities | 4 | 3 | 51, 50, 64 | 1 | 74 | 2 87, 89 | 1 | 86 | ||||||||||||||||
| (iii) | Intersection Density or Street Connectivity | 20 | 2 | 3 | 47, 45, 46 | 10 | 52, 51, 60, 65, L69, 49, 53,55, 63, 57 | 1 52 | 3 | 72, 76, 73 | 4 | 20, 19, 5, L6 | 1 19 | 4 | 67, 91, 84, L96 | |||||||||
| (iv) | Walkability | 5 | 5 | 55, 62, 66, L69, 71 | 1 80 | 2 | L88, 95 | |||||||||||||||||
| (v) | Walking Infrastructure | 7 | 2 | 47, 48 | 3 | 50, L70, 71 | 2 | 5, L6 | 2 84 | 2 | 86, L96 | |||||||||||||
| Aesthetics | 2 | 1 | 57 | 1 | 76 | 1 34 | ||||||||||||||||||
| (vi) | Accessibility to Destinations (Play/Sport Destinations) | 5 | 1 | 48 | 2 | 60, 57 | 2 | 72, 76 | 2 | 87, L96 | ||||||||||||||
| Proximity to School | 10 | 3 | 46, 47, 48 | 7 | 49, 51, 52, 61, 62, 64, 65 | |||||||||||||||||||
| Proximity to recreation sites | ||||||||||||||||||||||||
| (vii) | Availability of Parks/Public Open spaces or social spaces | 2 | 2 | L69, 71 | 2 | 13, L96 | ||||||||||||||||||
| Green Space/Street Greenery or Natural Water | 4 | 2 | 44, 48 | 1 | 61 | 1 | 76 | |||||||||||||||||
| (viii) | Personal Safety | 5 | 1 | 48 | 3 | 65, L70, 63 | 1 | L70 | ||||||||||||||||
| Crime/Physical Incivilities | 1 | 1 | 1 | 56 | 1 51 | 2 80, 89 | ||||||||||||||||||
| Traffic Safety | 4 | 2 | 53, 57 | 1 | 75 | 1 | 19 | 2 | 13, 81 | |||||||||||||||
| Traffic Calming | 1 | 1 | 1 | 46 | 1 44 | |||||||||||||||||||
| Traffic Lights | 3 | 1 | 44 | 1 | 76 | 1 | L6 | |||||||||||||||||
| (ix) | Traffic Levels | 4 | 1 46 | 2 55, 61 | 1 73 | 1 L88 | ||||||||||||||||||
| Traffic Accidents | 1 | 1 51 | ||||||||||||||||||||||
| Crossing busy street | ||||||||||||||||||||||||
| Ratio of high to low-speed roads, proportion/density of main roads | 1 | 1 | 68 | 1 80 | ||||||||||||||||||||
| Public transport | 1 | 1 | 64A | 2 13, 84 | ||||||||||||||||||||
| Pollution (air, noise) | ||||||||||||||||||||||||
| Housing (Living in a house) | 1 | 1 | 46 | |||||||||||||||||||||
| Parental Socio-economic Status | ||||||||||||||||||||||||
| Access to motorized vehicles at home, travel by motorized transport | 2 | 2 L54, 65 | ||||||||||||||||||||||
| (x) | Social Norms/Support, Parental Accompaniment | 6 | 1 | 46 | 3 | L70, L54, 71 | 1 | 72 | 1 | L70 | ||||||||||||||
| Self-efficacy | 2 | 2 | 65, 71 | |||||||||||||||||||||
| Enjoyment/Satisfaction | 3 | 3 | L70, 57, 71 | |||||||||||||||||||||
| Category | Example Measures |
|---|---|
| i. Residential or population density | Number of residents within a buffer around home, school, and/or specific route. |
| ii. Street connectivity/Intersection density | Number of intersections (e.g., total intersections, or cul-de-sacs, or 4-way intersections) within a buffer. |
| iii. Land-use mix/diversity | Proportion of different land-uses within a buffer. Entropy Index (using formulas that combine land-use classifications and the proportion of land dedicated to a specific land-use). |
| iv. Walkability | Walkability Index (using formulas that combine residential density, intersection density, and land-use mix, and other attributes such as public transit density or retail floor area ratio) within a buffer. |
| v. Pedestrian infrastructure and road/street environment design | Total length of footpaths or pavements or sidewalks (and/or width of the same) within a buffer. Network distance to nearest footpath. Parental or children’s perceived pedestrian friendliness, cleanliness, and aesthetics (e.g., interesting architecture or sights) of a street segment. Or, perceptions of the hostility of the environment (graffiti, etc.). |
| vi. Accessibility or proximity to physical activity facilities | Network distance to nearest physical activity centre, or playground, or school. |
| vii. Availability or proximity to parks, public open and social spaces, and natural environments (green and blue) | Number or total area of parks/green space/open space within a buffer. Mean NDVI (Normalised Difference Vegetation Index) within a buffer. Network distance to nearest green/blue space. Number of street trees along a street segment/route. Parent-perceived access/quality of green/blue spaces. |
| viii. Safety from traffic and crime | Parent and/or child-perceived safety from traffic and crime. Number of safety-related measures (e.g., zebra or pedestrian crossings with traffic light, slow points, speed bumps) within a buffer. |
| ix. Traffic levels, presence of main roads, and characteristics of crossings | Proportion of high-speed roads to low-speed streets within a buffer. Total length of different road types divided by the total road length within a buffer. Presence of major/arterial roads near the child’s home or school street. Density of bus stops and/or metro stations. |
| x. Social support and psychosocial factors | Reported parental or peer support for active travel to school or playing in the neighbourhood. Reported enjoyment of physical activity or active travel to school. |
Publisher’s Note: MDPI stays neutral with regard to jurisdictional claims in published maps and institutional affiliations. |
© 2021 by the authors. Licensee MDPI, Basel, Switzerland. This article is an open access article distributed under the terms and conditions of the Creative Commons Attribution (CC BY) license (https://creativecommons.org/licenses/by/4.0/).
Share and Cite
Ortegon-Sanchez, A.; McEachan, R.R.C.; Albert, A.; Cartwright, C.; Christie, N.; Dhanani, A.; Islam, S.; Ucci, M.; Vaughan, L. Measuring the Built Environment in Studies of Child Health—A Meta-Narrative Review of Associations. Int. J. Environ. Res. Public Health 2021, 18, 10741. https://doi.org/10.3390/ijerph182010741
Ortegon-Sanchez A, McEachan RRC, Albert A, Cartwright C, Christie N, Dhanani A, Islam S, Ucci M, Vaughan L. Measuring the Built Environment in Studies of Child Health—A Meta-Narrative Review of Associations. International Journal of Environmental Research and Public Health. 2021; 18(20):10741. https://doi.org/10.3390/ijerph182010741
Chicago/Turabian StyleOrtegon-Sanchez, Adriana, Rosemary R. C. McEachan, Alexandra Albert, Chris Cartwright, Nicola Christie, Ashley Dhanani, Shahid Islam, Marcella Ucci, and Laura Vaughan. 2021. "Measuring the Built Environment in Studies of Child Health—A Meta-Narrative Review of Associations" International Journal of Environmental Research and Public Health 18, no. 20: 10741. https://doi.org/10.3390/ijerph182010741