
Microbial Air Monitoring in Turbulent Airflow Operating Theatres: Is It Possible to Calculate and Hypothesize New Benchmarks for Microbial Air Load?


Abstract
:1. Introduction
2. Materials and Methods
2.1. Setting
2.2. Sampling
2.3. Airborne Bacterial Contamination in Operating and at Rest Conditions
2.4. Number of Efficacious Air Exchanges
2.5. Quality Improvement Protocol
2.6. Statistical Analysis
3. Results
4. Discussion
5. Conclusions
Author Contributions
Funding
Institutional Review Board Statement
Informed Consent Statement
Data Availability Statement
Conflicts of Interest
References
- De Simone, B.; Sartelli, M.; Coccolini, F.; Ball, C.G.; Brambillasca, P.; Chiarugi, M.; Campanile, F.B.; Nita, G.; Corbella, D.; Leppaniemi, A.; et al. Intraoperative surgical site infection control and prevention: A position paper and future addendum to WSES intra-abdominal infections guidelines. World J. Emerg. Surg. 2020, 15, 10. [Google Scholar] [CrossRef] [Green Version]
- Wloch, C.; Van Hoek, A.J.; Green, N.; Conneely, J.; Harrington, P.; Sheridan, E.; Wilson, J.; Lamagni, T. Cost–benefit analysis of surveillance for surgical site infection following caesarean section. BMJ Open 2020, 10, e036919. [Google Scholar] [CrossRef]
- Murrell, L.J.; Hamilton, E.K.; Johnson, H.B.; Spencer, M. Influence of a visible-light continuous environmental disinfection system on microbial contamination and surgical site infections in an orthopedic operating room. Am. J. Infect. Control 2019, 47, 804–810. [Google Scholar] [CrossRef] [PubMed] [Green Version]
- Pasquarella, C.; Vitali, P.; Saccani, E.; Manotti, P.; Boccuni, C.; Ugolotti, M.; Signorelli, C.; Mariotti, F.; Sansebastiano, G.E.; Albertini, R. Microbial air monitoring in operating theatres: Experience at the University Hospital of Parma. J. Hosp. Infect. 2012, 81, 50–57. [Google Scholar] [CrossRef] [PubMed]
- Abbo, L.M.; Grossi, P.A. AST ID Community of Practice. Surgical site infections: Guidelines from the American Society of Transplantation Infectious Diseases Community of Practice. Clin. Transplant. 2019, 33, e13589. [Google Scholar] [CrossRef] [PubMed]
- Lo Giudice, D.; Trimarchi, G.; La Fauci, V.; Squeri, R.; Calimeri, S. Hospital infection control and behaviour of operating room staff. Cent. Eur. J. Public Health 2019, 27, 292–295. [Google Scholar] [CrossRef] [PubMed]
- Bediako-Bowan, A.A.A.; Mølbak, K.; Kurtzhals, J.A.L.; Owusu, E.; Debrah, S.; Newman, M.J. Risk factors for surgical site infections in abdominal surgeries in Ghana: Emphasis on the impact of operating rooms door openings. Epidemiol. Infect. 2020, 148, e147. [Google Scholar] [CrossRef]
- World Health Organization. Global Guidelines for the Prevention of Surgical Site Infection. Geneva: World Health Organization. 2016. Available online: https://apps.who.int/iris/bitstream/handle/10665/250680/9789241549882-eng.pdf?sequence=8 (accessed on 9 July 2021).
- Dharan, S.; Pittet, D. Environmental controls in operating theatres. J. Hosp. Infect. 2002, 51, 79–84. [Google Scholar] [CrossRef]
- Cristina, M.L.; Spagnolo, A.M.; Sartini, M.; Panatto, D.; Gasparini, R.; Orlando, P.; Ottria, G.; Perdelli, F. Can Particulate Air Sampling Predict Microbial Load in Operating Theatres for Arthroplasty? PLoS ONE 2012, 7, e52809. [Google Scholar] [CrossRef]
- Cristina, M.L.; Sartini, M.; Schinca, E.; Ottria, G.; Spagnolo, A.M. Operating room environment and surgical site infections in arthroplasty procedures. J. Prev. Med. Hyg. 2016, 57, 142–148. [Google Scholar]
- Persson, M. Airborne contamination and surgical site infection: Could a thirty-year-old idea help solve the problem? Med. Hypotheses 2019, 132, 109351. [Google Scholar] [CrossRef]
- Pasquarella, C.; Balocco, C.; Colucci, M.E.; Saccani, E.; Paroni, S.; Albertini, L.; Vitali, P.; Albertini, R. The Influence of Surgical Staff Behavior on Air Quality in a Conventionally Ventilated Operating Theatre during a Simulated Arthroplasty: A Case Study at the University Hospital of Parma. Int. J. Environ. Res. Public Health 2020, 17, 452. [Google Scholar] [CrossRef] [Green Version]
- Krause, M.; Dolák, F. Antibacterial Treatment of Selected High-Touch Objects and Surfaces within Provision of Nursing Care in Terms of Prevention of Healthcare-Associated Infections. Healthcare 2021, 9, 675. [Google Scholar] [CrossRef]
- Lidwell, O.M.; Lowbury, E.J.L.; Whyte, W.; Blowers, R.; Stanley, S.J.; Lowe, D. Effect of ultraclean air in operating rooms on deep sepsis in the joint after total hip or knee replacement: A randomised study. Br. Med. J. 1982, 285, 10–14. [Google Scholar] [CrossRef] [Green Version]
- Lidwell, O.M. Air, antibiotics and sepsis in replacement joints. J. Hosp. Infect. 1988, 11, 18–40. [Google Scholar] [CrossRef]
- Whyte, W.; Lidwell, O.M.; Lowbury, E.J.; Blowers, R. Suggested bacteriological standards for air in ultra-clean operating rooms. J. Hosp. Infect. 1983, 4, 133–139. [Google Scholar] [CrossRef]
- Stauning, M.A.; Bediako-Bowan, A.; Bjerrum, S.; Andersen, L.P.; Andreu-Sánchez, S.; Labi, A.K.; Kurtzhals, J.A.L.; Marvig, R.L.; Opintan, J.A. Genetic relationship between bacteria isolated from intraoperative air samples and surgical site infections at a major teaching hospital in Ghana. J. Hosp. Infect. 2020, 104, 309–320. [Google Scholar] [CrossRef] [PubMed]
- D’Alicandro, A.C.; Massarotti, M.; Mauro, A. Aerosol hazards in operating rooms: A review of numerical and experimental studies. J. Aerosol Sci. 2021, 158, 105823. [Google Scholar] [CrossRef]
- Agodi, A.; Auxilia, F.; Barchitta, M.; Cristina, M.L.; D’Alessandro, D.; Mura, I.; Nobile, M.; Pasquarella, C.; Italian Study Group of Hospital Hygiene. Operating theatre ventilation systems and microbial air contamination in total joint replacement surgery: Results of the GISIO-ISChIA study. J. Hosp. Infect. 2015, 90, 213–219. [Google Scholar] [CrossRef] [PubMed]
- Bonadonna, L.; Briancesco, R.; Coccia, A.M.; Meloni, P.; La Rosa, G.; Moscato, U. Microbial Air Quality in Healthcare Facilities. Int J. Environ. Res. Public Health 2021, 18, 6226. [Google Scholar] [CrossRef] [PubMed]
- ISPESL. Linee Guida Sugli Standard di Sicurezza e di Igiene del Lavoro nel Reparto Operatorio. Available online: https://www.inail.it/cs/internet/docs/linee-guida-igiene-reparto-operatorio.pdf?section=attivita (accessed on 9 July 2021).
- National Health Service. Ventilation in Healthcare Premises. In Health Technical Memorandum 2025; NHS: London, UK, 2007. [Google Scholar]
- Agence Française de Normalisation. Norme NF S 90-351-Etablissements de Santé-Salles Propres et Environnements Apparentés-Exigences Relatives Pour la Maîtrise de la Contamination Aéroportée; AFNOR: Paris, France, 2003. [Google Scholar]
- Sehulster, L.; Chinn, R.Y.; CDC; HICPAC. Guidelines for environmental infection control in health-care facilities. Recommendations of CDC and the Healthcare Infection Control Practices Advisory Committee (HICPAC). MMWR Recomm. Rep. 2003, 52, 1–42. [Google Scholar]
- Societé Française D’hygiène Hospitalière. Qualité de L’air au Bloc Opératoire et Autres Secteurs Interventionnels. Lion, France, 2015. Available online: https://www.sf2h.net/wp-content/uploads/2015/05/SF2H_recommandations_qualite-de-l-air-au-bloc-operatoire-et-autres-secteurs-interventionnels-2015.pdf (accessed on 9 July 2021).
- Spagnolo, A.M.; Ottria, G.; Amicizia, D.; Perdelli, F.; Cristina, M.L. Operating theatre quality and prevention of surgical site infections. J. Prev. Med. Hyg. 2013, 54, 131–137. [Google Scholar]
- Masia, M.D.; Dettori, M.; Deriu, G.M.; Soddu, S.; Deriu, M.; Arghittu, A.; Azara, A.; Castiglia, P. Microbial Monitoring as a Tool for Preventing Infectious Risk in the Operating Room: Results of 10 Years of Activity. Atmosphere 2021, 12, 19. [Google Scholar] [CrossRef]
- INAIL. Il monitoraggio microbiologico negli ambienti di lavoro Campionamento e analisi. In Linee Guida CONTARP; INAIL: Roma, Italy, 2010; Available online: https://www.inail.it/cs/internet/docs/alg-il-monitoraggio-microbiologico-negli-ambienti-lavoropdf.pdf (accessed on 27 August 2021).
- Sartini, M.; Ottria, G.; Dallera, M.; Spagnolo, A.M.; Cristina, M.L. Nitrous oxide pollution on operating theatres in relation to the type of leakage and the number of efficacious air exchanges per hour. J. Prev. Med. Hyg. 2006, 47, 155–159. [Google Scholar]
- Sartini, M.; Spagnolo, A.M.; Panatto, D.; Perdelli, F.; Cristina, M.L. Improving environmental quality in an operating room: Clinical outcomes and economic implications. J. Prev. Med. Hyg. 2013, 54, 75–79. [Google Scholar]
- Mangram, A.J.; Horan, T.C.; Pearson, M.L.; Silver, L.C.; Jarvis, W.R. Guideline for Prevention of Surgical Site Infection, 1999. Centers for Disease Control and Prevention (CDC) Hospital Infection Control Practices Advisory Committee. Am. J. Infect. Control 1999, 27, 97–132. [Google Scholar] [CrossRef]


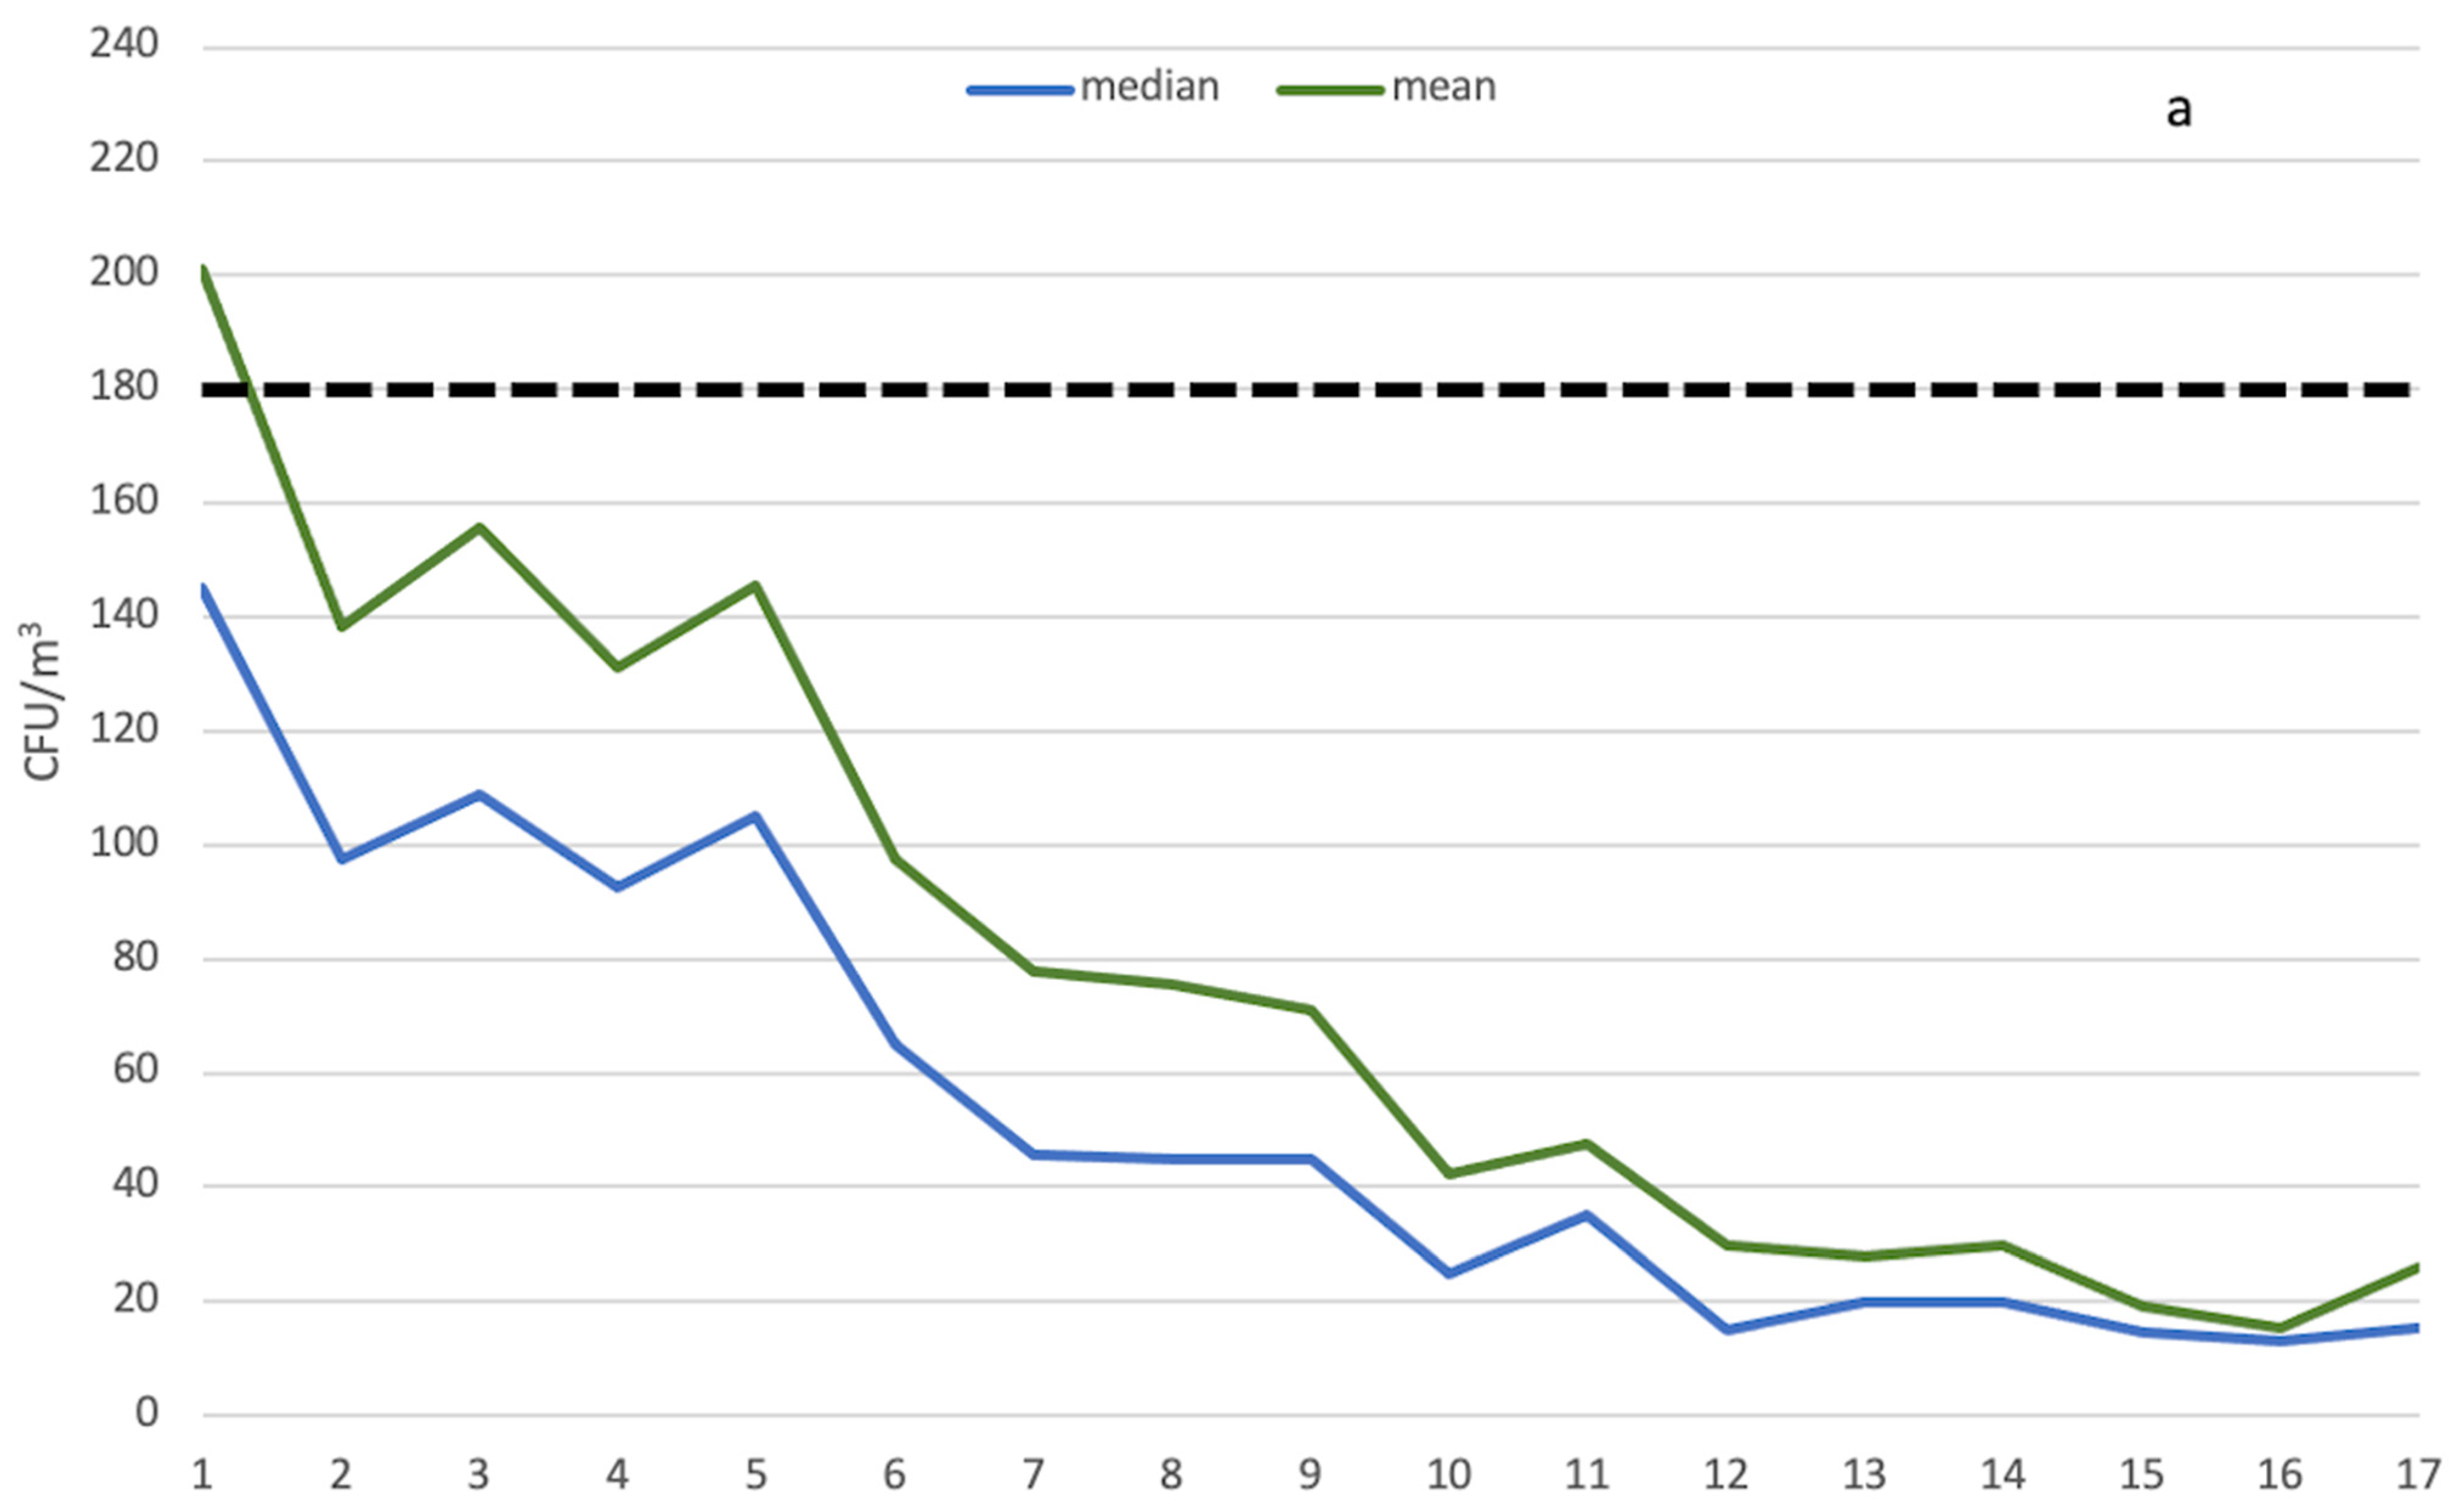
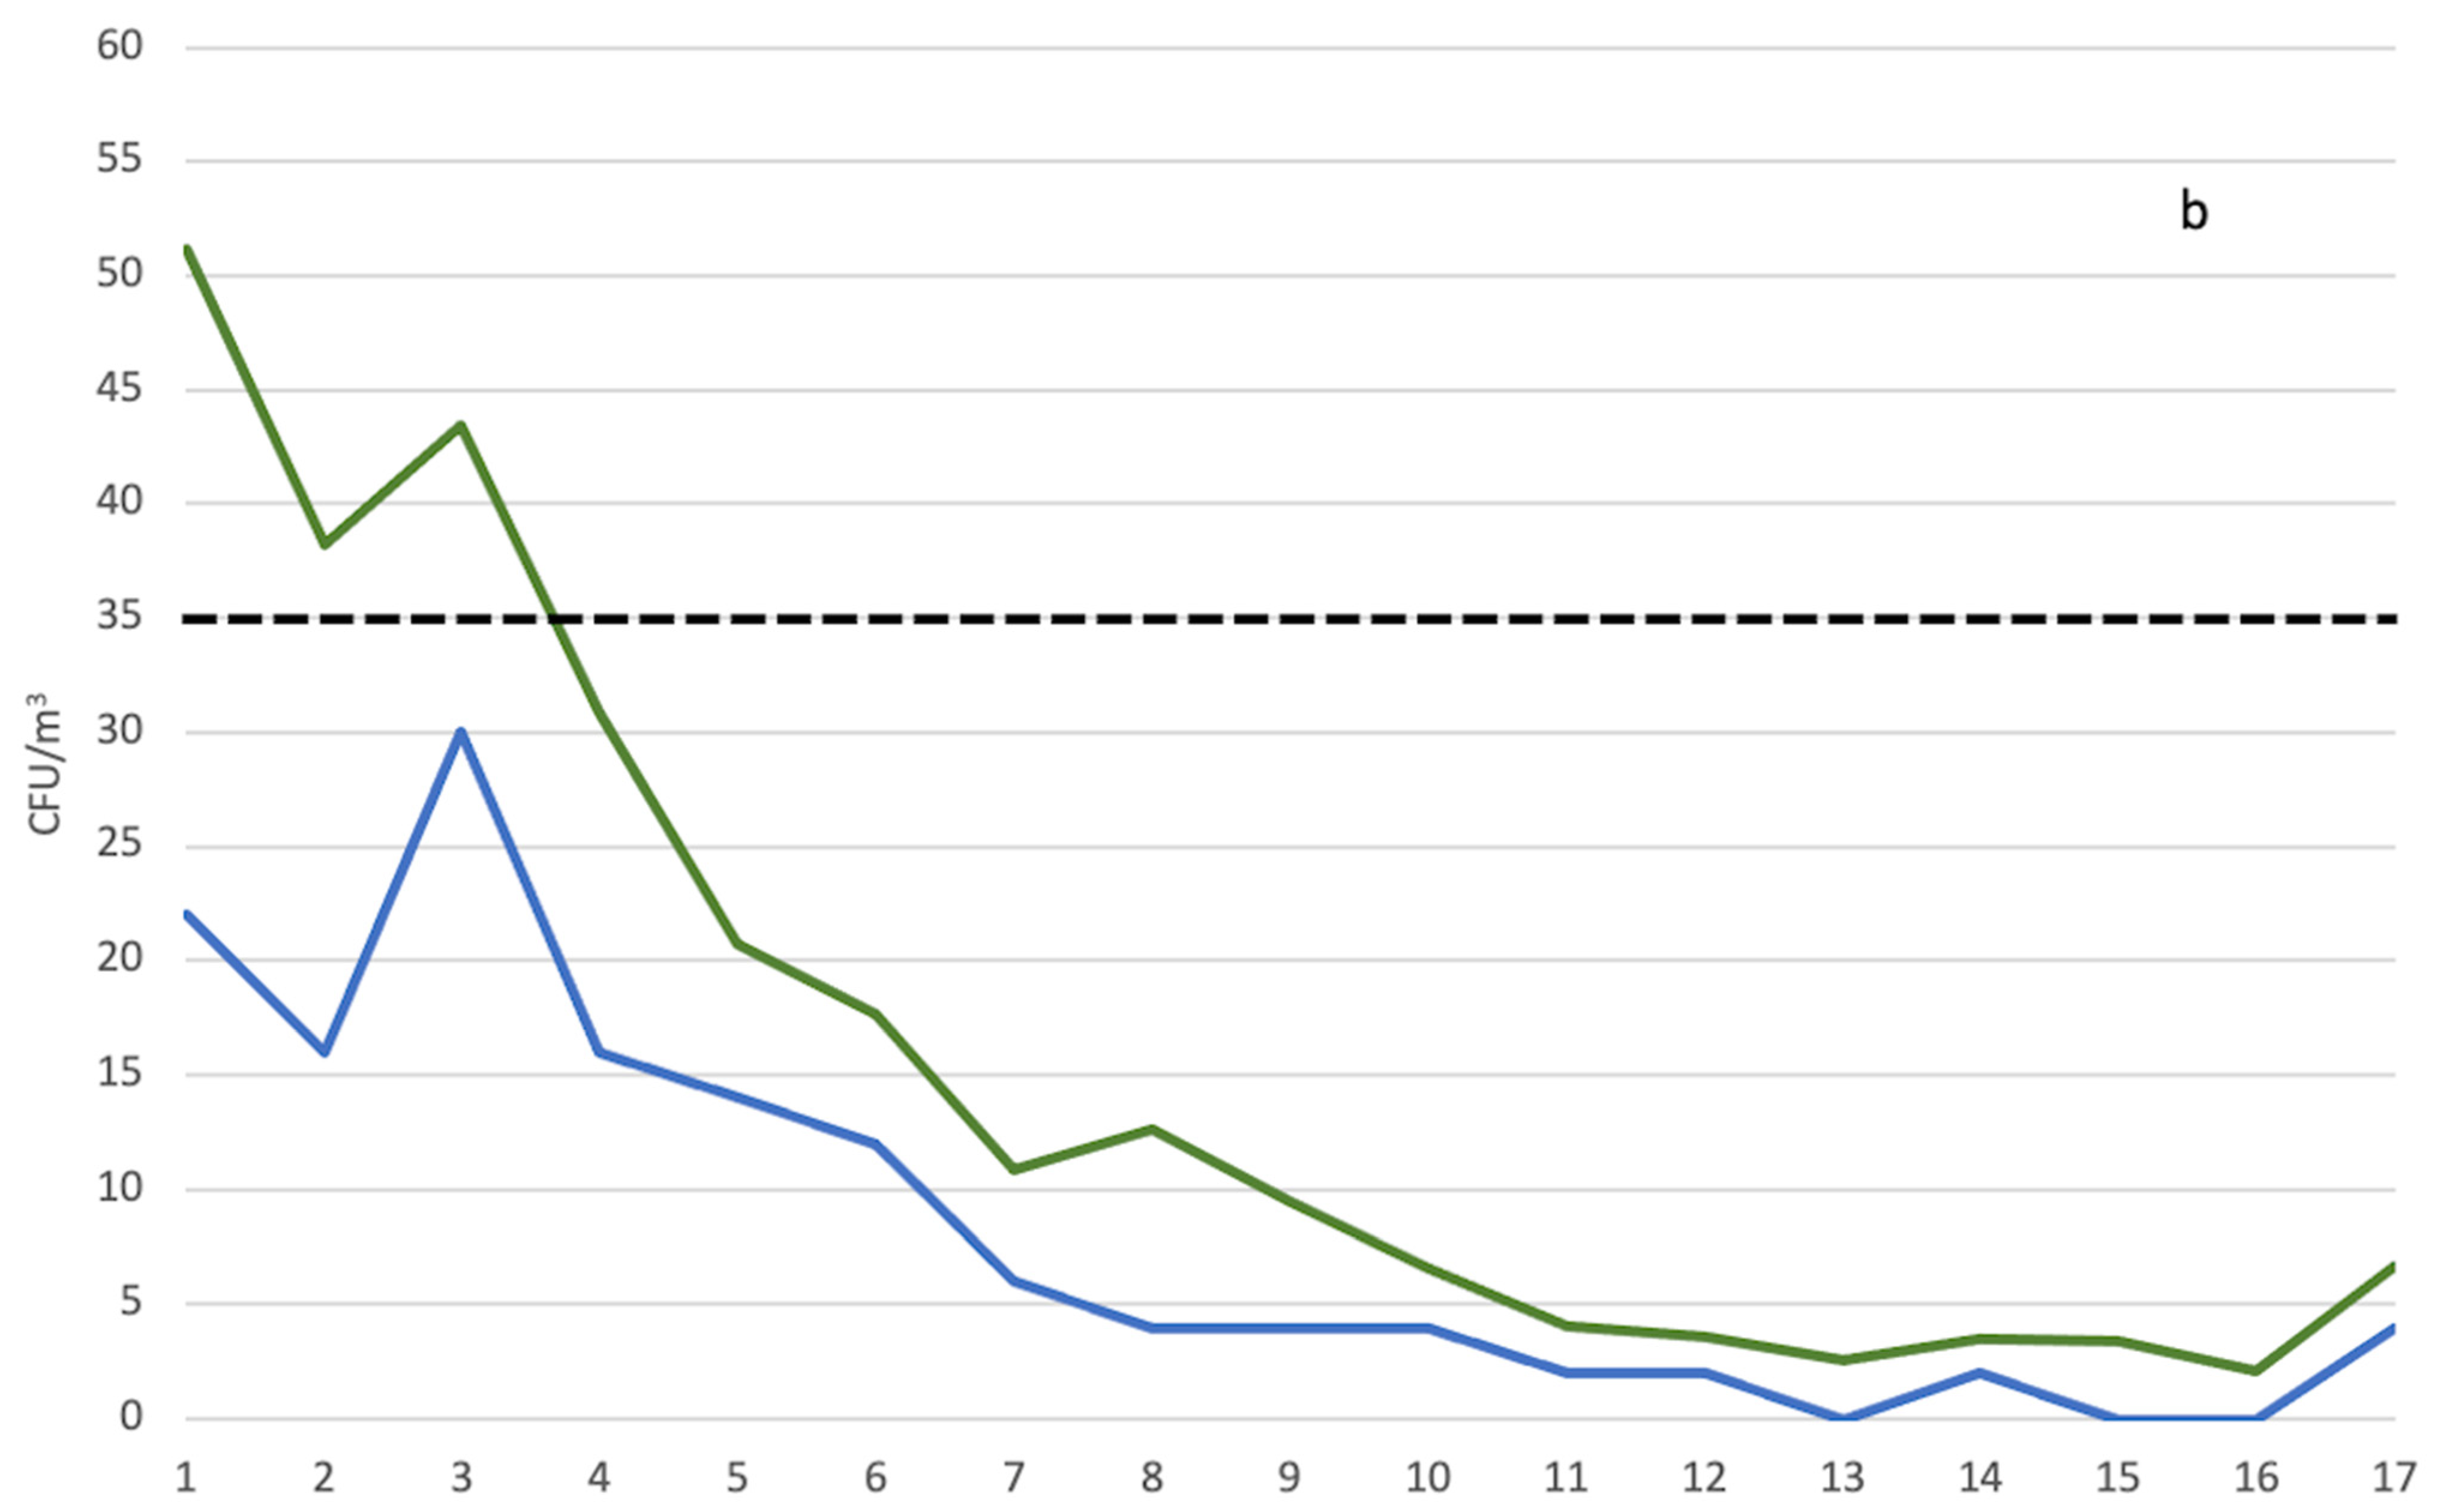
| Operational | At Rest | |
|---|---|---|
| Year | Nonconformity Percentage (%) | Nonconformity Percentage (%) |
| 1 | 36.17 | 34.19 |
| 2 | 26.12 | 28.06 |
| 3 | 27.08 | 41.72 |
| 4 | 23.19 | 27.78 |
| 5 | 27.94 | 13.79 |
| 6 | 13.04 | 11.26 |
| 7 | 8.21 | 7.53 |
| 8 | 8.20 | 8.89 |
| 9 | 8.82 | 4.69 |
| 10 | 1.80 | 3.62 |
| 11 | 3.15 | 0.70 |
| 12 | 0.99 | 1.61 |
| 13 | 0 | 0 |
| 14 | 0 | 0 |
| 15 | 0 | 0 |
| 16 | 0 | 0 |
| 17 | 0 | 0 |
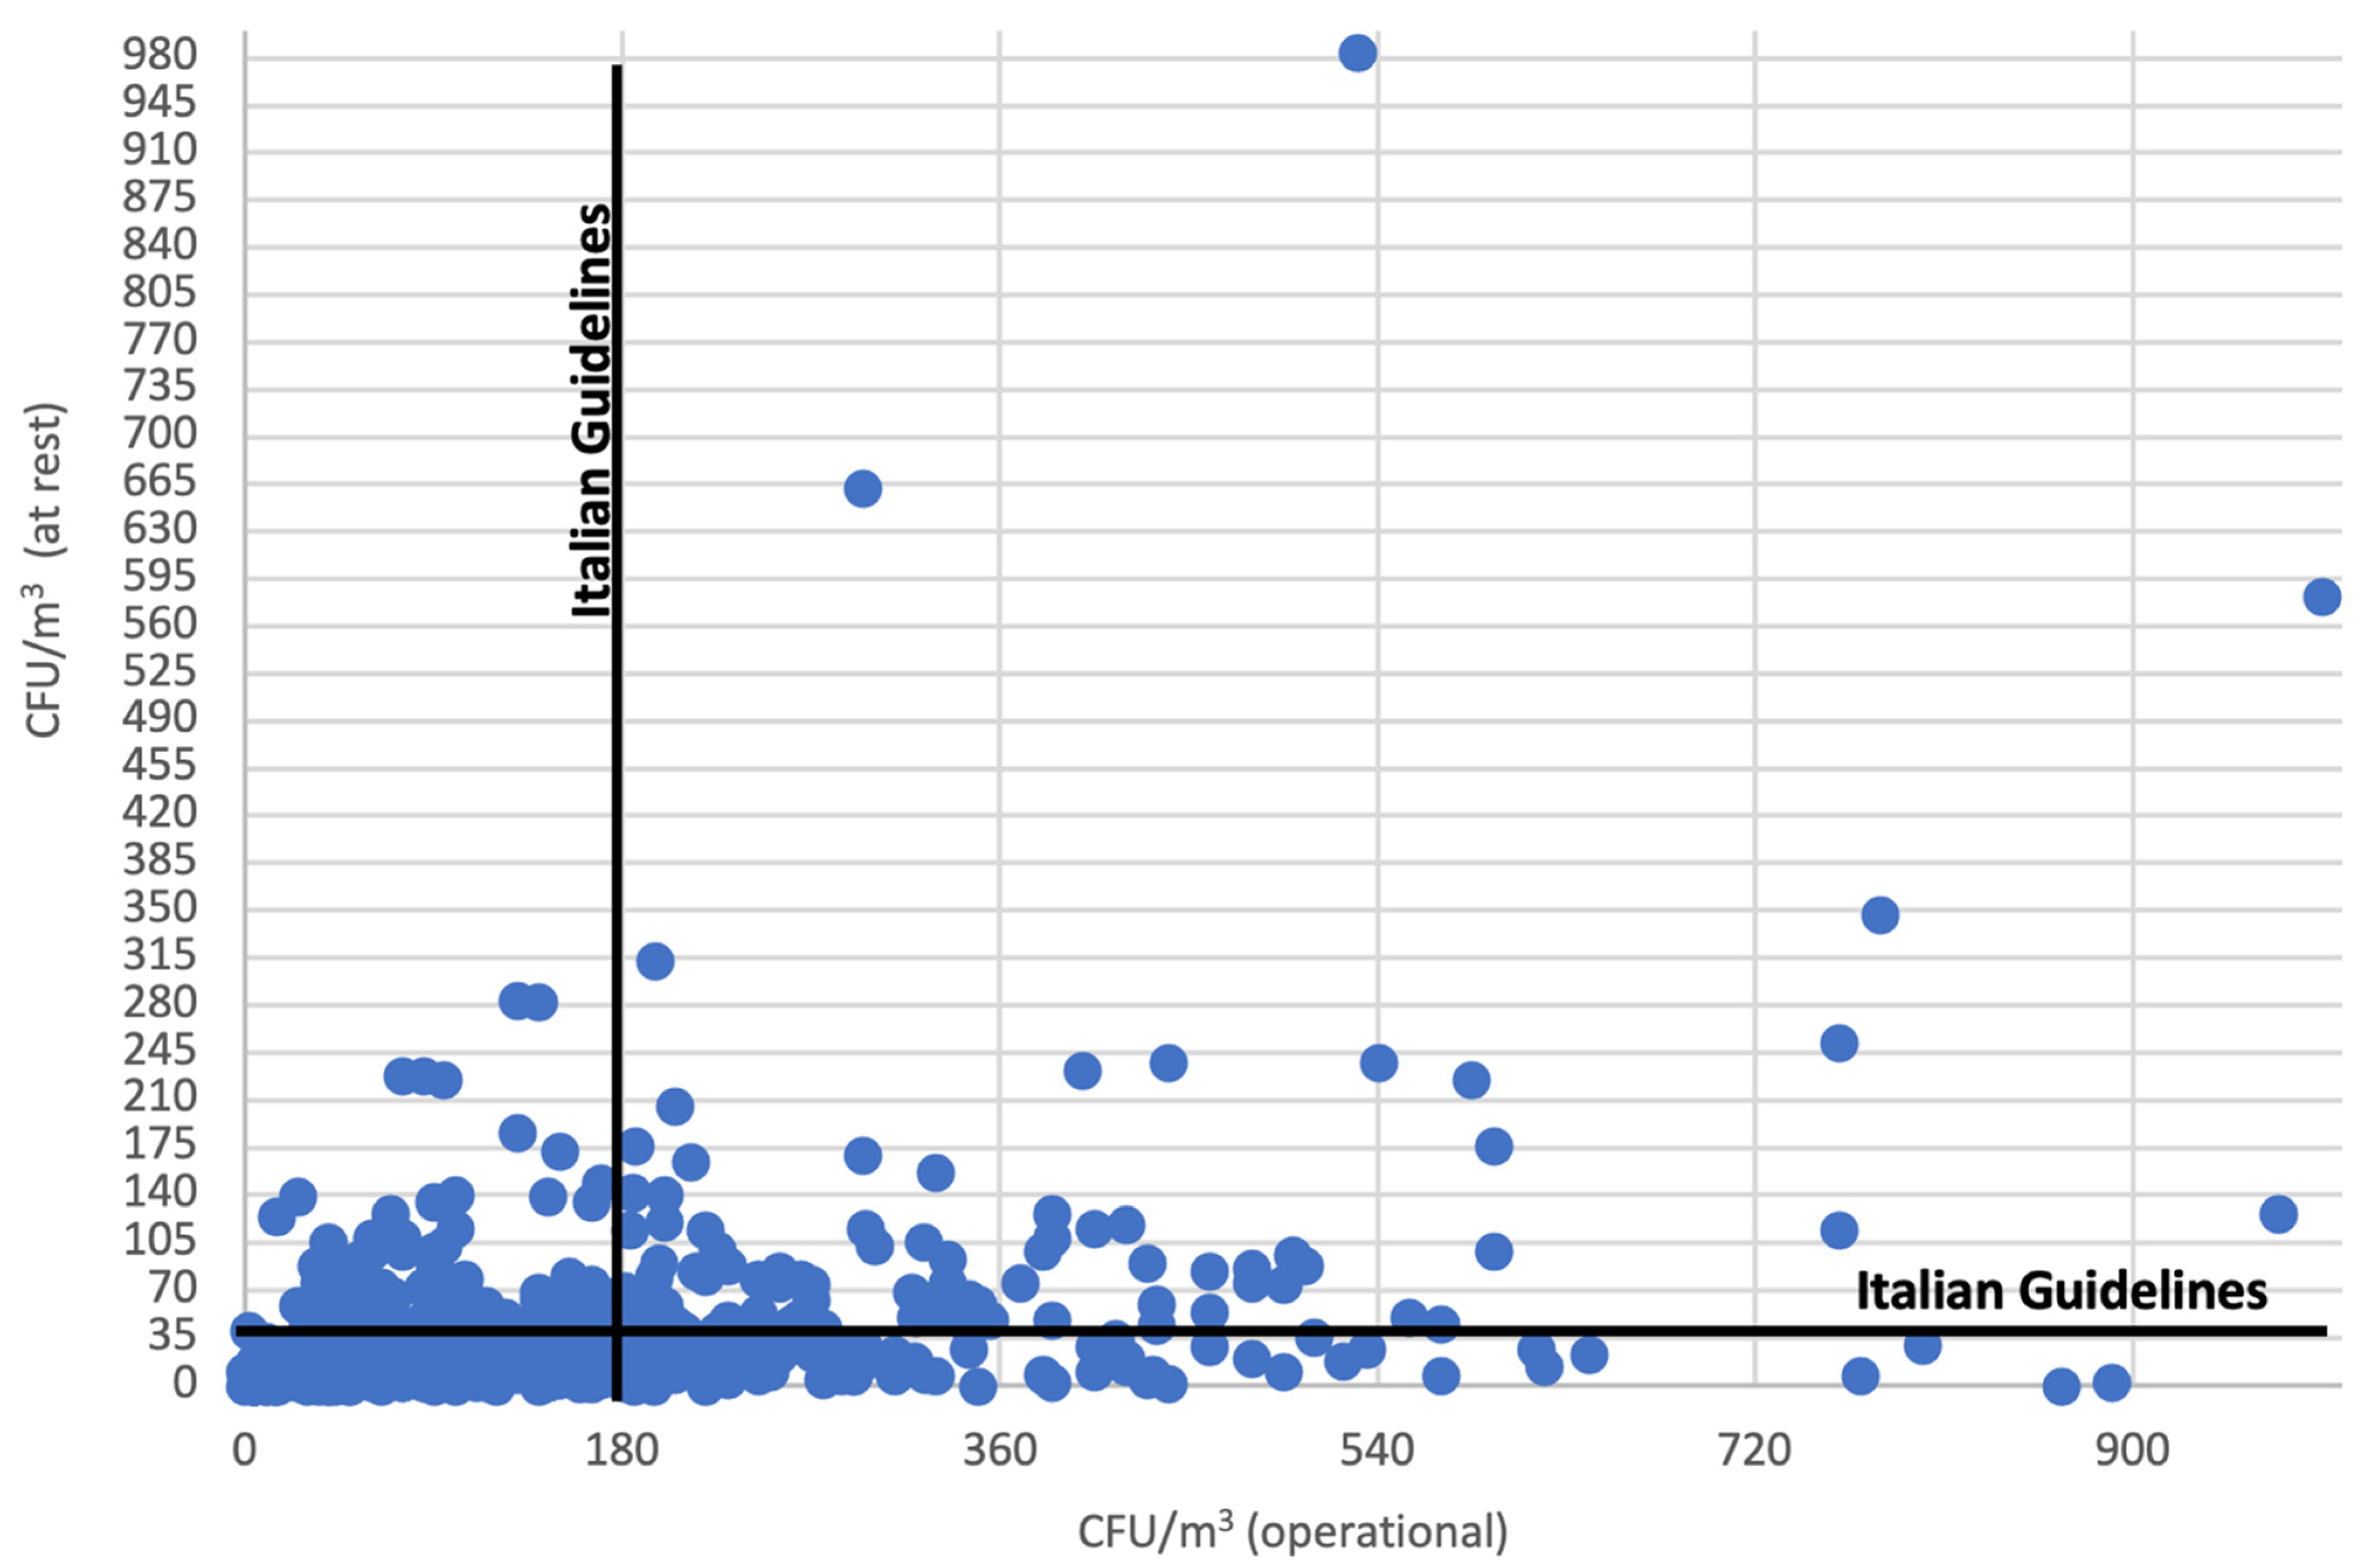
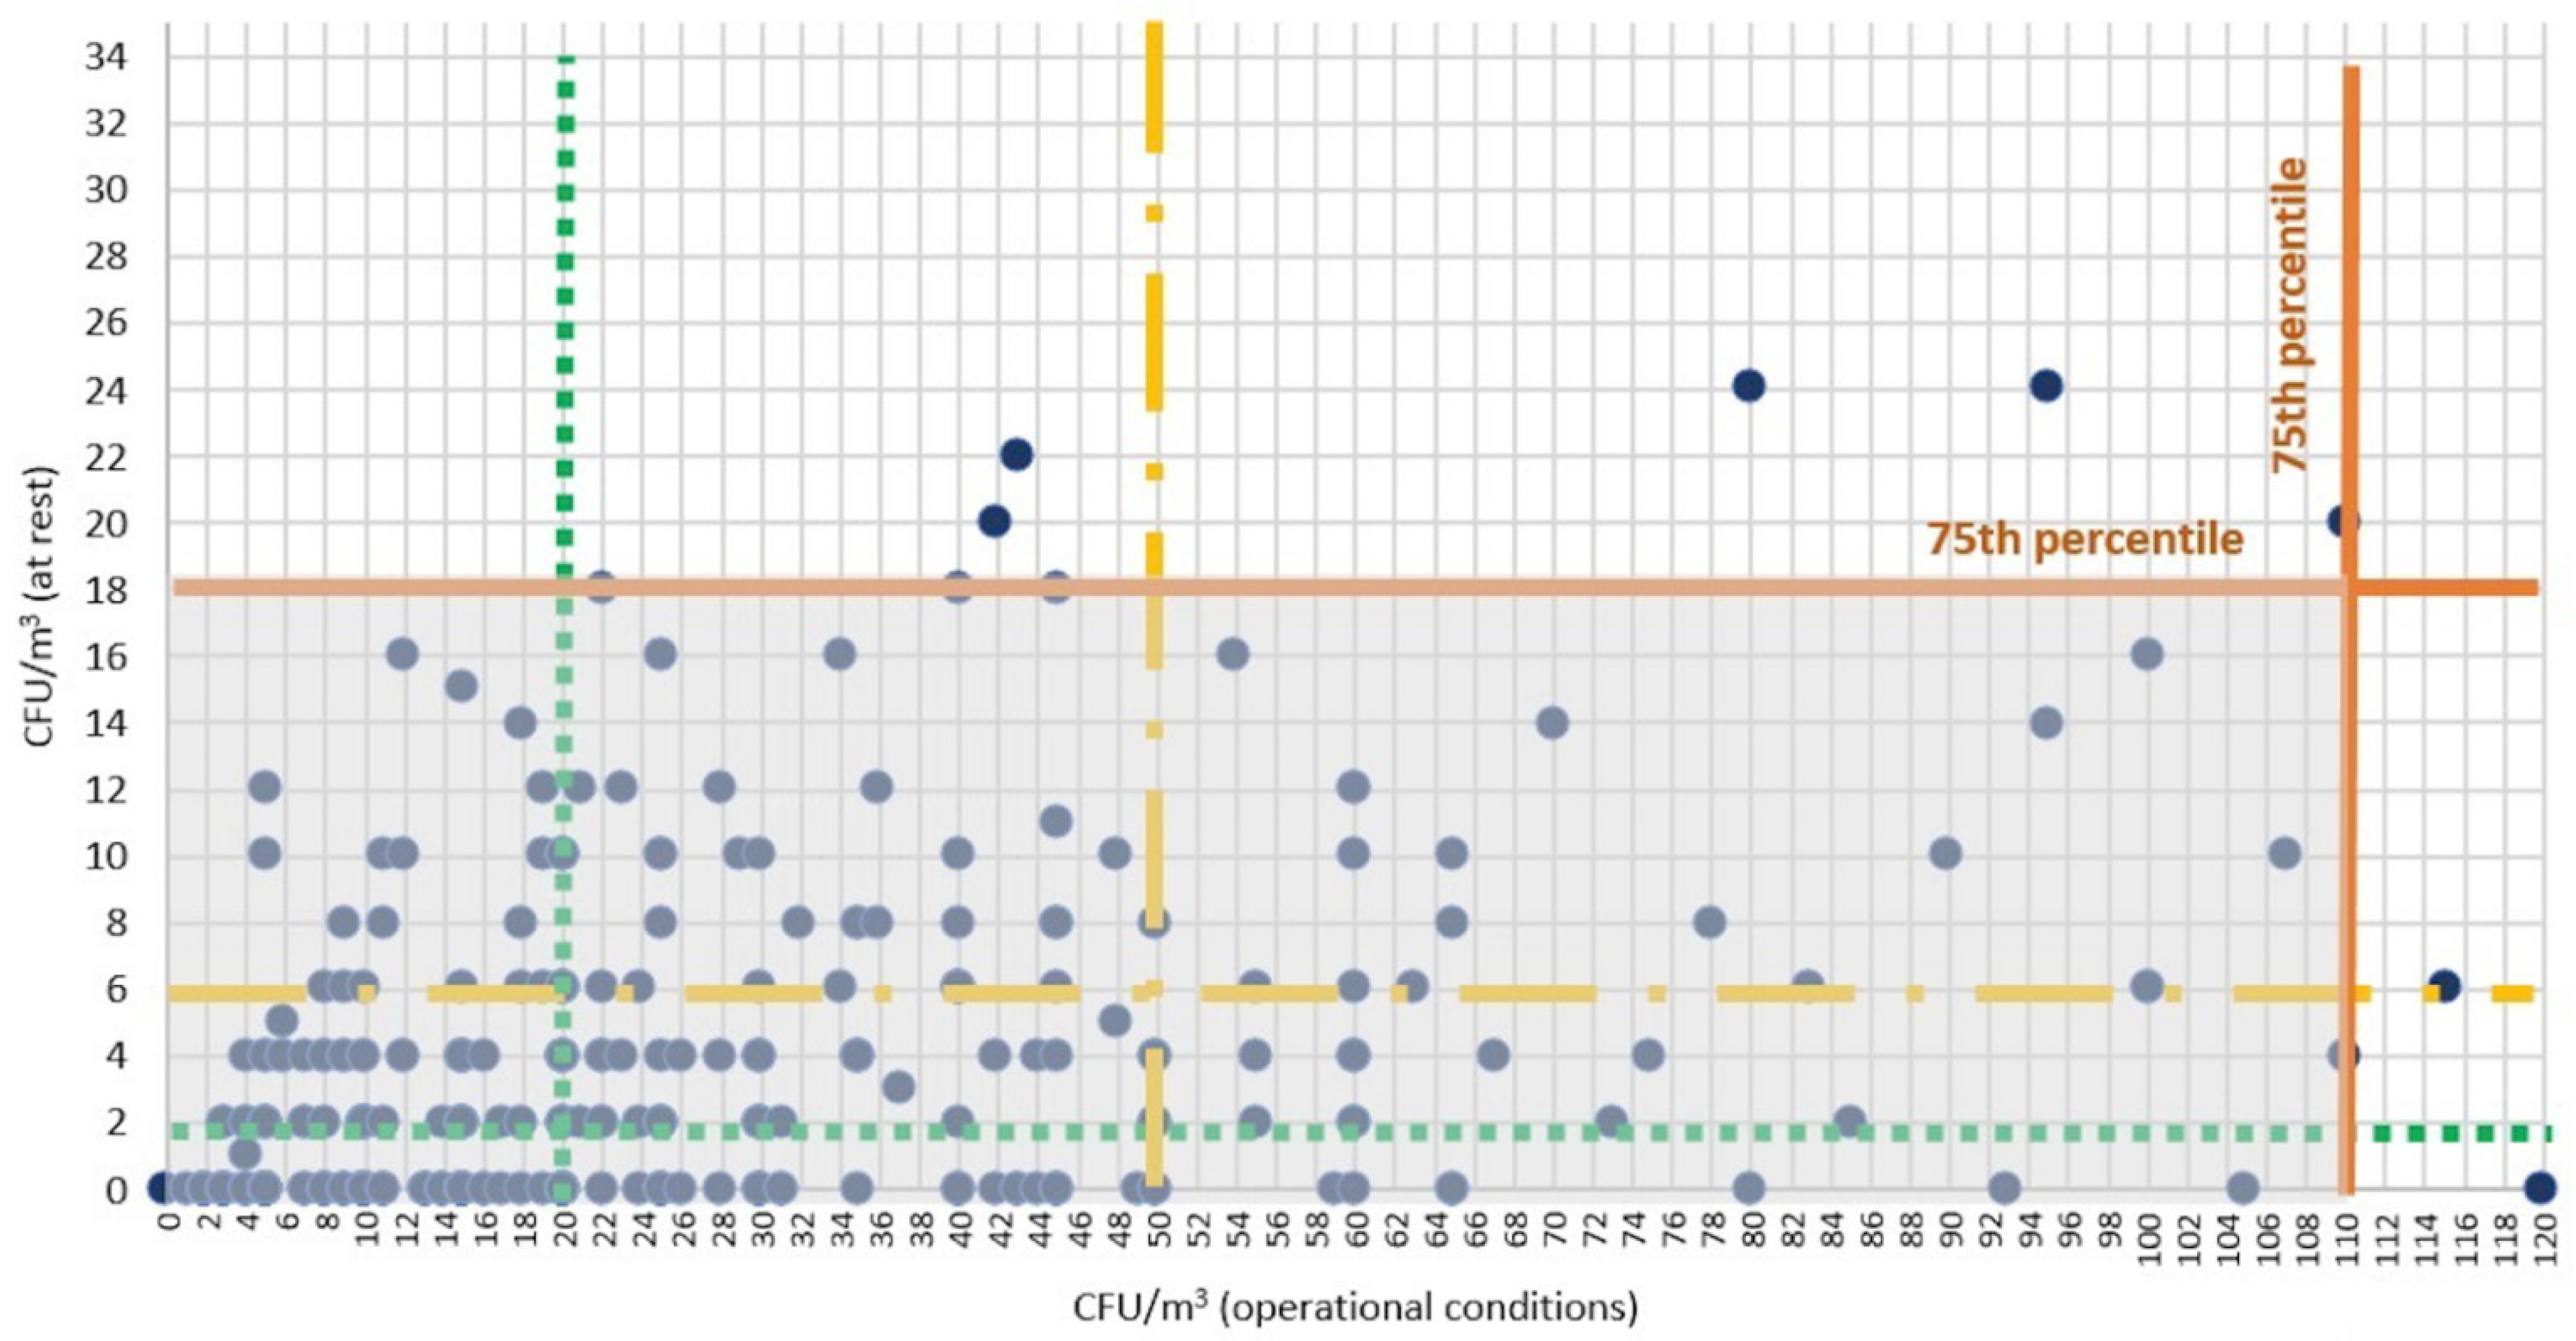
| Percentile | Concentration in Operational Conditions | Concentration in at Rest Conditions | ||
|---|---|---|---|---|
| CFU/m3 | IC 95% (CFU/m3) | CFU/m3 | IC 95% (CFU/m3) | |
| 0 | 0.00 | 0.00–0.00 | 0.00 | 0.00–0.00 |
| 5 | 5.00 | 5.00–5.00 | 0.00 | 0.00–0.00 |
| 10 | 9.00 | 7.00–10.00 | 0.00 | 0.00–0.00 |
| 15 | 10.00 | 10.00–11.00 | 0.00 | 0.00–0.00 |
| 20 | 15.00 | 15.00–15.00 | 1.00 | 0.00–2.00 |
| 25 | 20.00 | 15.00–20.00 | 2.00 | 2.00–2.00 |
| 30 | 24.00 | 20.00–25.00 | 2.00 | 2.00–2.00 |
| 35 | 30.00 | 25.00–30.00 | 2.00 | 2.00–4.00 |
| 40 | 35.00 | 30.00–35.00 | 4.00 | 4.00–4.00 |
| 45 | 40.00 | 40.00–45.00 | 4.00 | 4.00–4.00 |
| 50 | 50.00 | 45.00–50.00 | 6.00 | 5.00–6.00 |
| 55 | 55.00 | 50.00–60.00 | 6.00 | 6.00–8.00 |
| 60 | 65.00 | 60.00–71.00 | 8.00 | 8.00–10.00 |
| 65 | 80.00 | 75.00–86.66 | 10.00 | 10.00–12.00 |
| 70 | 95.00 | 90.00–100.00 | 14.00 | 12.00–14.00 |
| 75 | 110.00 | 105.00–115.00 | 18.00 | 16.00–20.00 |
| 80 | 135.00 | 120.08–145.00 | 22.00 | 20.00–24.00 |
| 85 | 165.00 | 155.00–180.00 | 30.00 | 26.00–30.00 |
| 90 | 214.00 | 195.00–230.00 | 43.20 | 38.86–46.00 |
| 95 | 319.00 | 290.00–345.00 | 74.00 | 66.00–84.00 |
| 100 | 1000.00 | 1000.00–1000 | 983.00 | 983.00–983.00 |
| Year | Mean Value ± SD. (v/h) | Median (v/h) | Range (v/h) |
|---|---|---|---|
| 1 | 12.27 ± 9.90 | 11.50 | 2.52–27 |
| 2 | 11.46 ± 4.30 | 10.80 | 2–20.7 |
| 3 | 11.73 ± 5.16 | 11.50 | 1.6–28.4 |
| 4 | 11.66 ± 3.81 | 12.00 | 2.7–19 |
| 5 | 12.73 ± 3.93 | 13.00 | 5–19 |
| 6 | 13.13 ± 3.46 | 13.00 | 5–27 |
| 7 | 13.85 ± 3.53 | 13.50 | 6–28 |
| 8 | 14.33 ± 3.67 | 14.00 | 7–27 |
| 9 | 14.89 ± 3.44 | 15.00 | 8–26 |
| 10 | 14.44 ± 2.08 | 15.00 | 9–21 |
| 11 | 15.63 ± 3.02 | 15.00 | 9–27 |
| 12 | 15.65 ± 2.61 | 15.00 | 11–24 |
| 13 | 15.07 ± 2.49 | 15.00 | 9–21 |
| 14 | 16.81 ± 2.17 | 16.00 | 13–22 |
| 15 | 16.84 ± 2.67 | 16.00 | 13–22 |
| 16 | 17.73 ± 2.05 | 17.00 | 15–21 |
| 17 | 20.25 ± 0.89 | 20.50 | 19–21 |
Publisher’s Note: MDPI stays neutral with regard to jurisdictional claims in published maps and institutional affiliations. |
© 2021 by the authors. Licensee MDPI, Basel, Switzerland. This article is an open access article distributed under the terms and conditions of the Creative Commons Attribution (CC BY) license (https://creativecommons.org/licenses/by/4.0/).
Share and Cite
Cristina, M.L.; Spagnolo, A.M.; Ottria, G.; Schinca, E.; Dupont, C.; Carbone, A.; Oliva, M.; Sartini, M. Microbial Air Monitoring in Turbulent Airflow Operating Theatres: Is It Possible to Calculate and Hypothesize New Benchmarks for Microbial Air Load? Int. J. Environ. Res. Public Health 2021, 18, 10379. https://doi.org/10.3390/ijerph181910379
Cristina ML, Spagnolo AM, Ottria G, Schinca E, Dupont C, Carbone A, Oliva M, Sartini M. Microbial Air Monitoring in Turbulent Airflow Operating Theatres: Is It Possible to Calculate and Hypothesize New Benchmarks for Microbial Air Load? International Journal of Environmental Research and Public Health. 2021; 18(19):10379. https://doi.org/10.3390/ijerph181910379
Chicago/Turabian StyleCristina, Maria Luisa, Anna Maria Spagnolo, Gianluca Ottria, Elisa Schinca, Chiara Dupont, Alessio Carbone, Martino Oliva, and Marina Sartini. 2021. "Microbial Air Monitoring in Turbulent Airflow Operating Theatres: Is It Possible to Calculate and Hypothesize New Benchmarks for Microbial Air Load?" International Journal of Environmental Research and Public Health 18, no. 19: 10379. https://doi.org/10.3390/ijerph181910379