1. Introduction
As the most critical component in urban infrastructures, the metro system plays a crucial role in promoting a city’s economy and society development. Compared with other modes of transportation, such as buses, taxis, and private cars, the metro system has many advantages and benefits, such as environment protection, better travel safety and efficiency, and high travel punctuality [
1,
2], while raising a positive stimulating effect on urban transport planning, intelligent transport system, and energy resources [
1,
3,
4,
5], so, more and more countries are willing to develop metro construction. By the end of 2020, 178 cities from 57 nations, mainly in Asian areas, European areas, and North American areas, had built metro systems, with a total length of 17,584.77 km and 12,567 stations [
6]. As the biggest developing country globally, China has also been building metro systems, particularly in its big cities, to solve traffic congestion induced by the growth of the urban population. It was reported by the China Association of Metros (2021) that, by the end of 2020, 45 cities had built metro systems in China, with a total length of 7969.7 km and a total number of 244 lines in the whole country [
7]. Twenty additional cities are planning for building metro systems. In total, about 7085.5 km of new metro lines will be built in China in the future.
However, it is possible that these ambitious metro plans will encounter many challenges, such as financial resources and the efficiency of utilizing these metro plans. It is appreciated that considerable investment is needed to build the metro system. For example, it is reported that the average cost of metro construction rose to 800 million CNY per kilometer in urban areas in China [
8]. Furthermore, operating the metro system costs are higher than the construction costs from the whole system lifecycle. Some city governments cannot even afford the operation costs, although they can construct the metro system. In this case, the city government has to provide support to cover high operation costs. According to the statistic data from 2007 to 2014 from the Beijing Municipal Finance Bureau, the operation of the Beijing metro system is primarily supported by the fiscal subsidy, accounting for more than 5% of the revenue of the Beijing government. Therefore, the finance resource is a big challenge to implement the 7085.5 km metro systems planned in China’s future years. On the other hand, the efficiency of using metro systems is different between different cities as they have a different scale of the metro system and management skills. Some cities have the problem of shortage of the metro system, and others face oversupply. For example, it was found that the scale of the metro system in Kunming has over-supply capacity [
9], indicating that the metro system in this city has low utility efficiency. Meanwhile in other cities, such as Beijing, the scale of the metro system is undersupplied, evidenced by the crowded ridership.
According to the definition of sustainable development, it emphasizes the ability to meet society’s current needs without compromising the capacity to satisfy future generations’ demands [
10]. In addition, various dimensions of objectives, including economy, society, environment, resources, must be coordinated and developed in harmony [
11]. The metro system’s sustainable development also needs to solve various problems such as financial resources, utility efficiency, and other natural hazards associated with urban mass transport systems [
12]. Therefore, it is crucial to correctly evaluate the urban metro system’s development condition for the sustainable development of the urban metro system. For the development process for the metro system, as pointed out in other studies, the factors affecting the development condition of the metro system can be summarized from the perspective of supply and demand [
13]. Specifically, the supply of the metro system is the support of human, material, and financial resources that a city can provide for the development of the metro system. For instance, Loo et al. [
3] proposed the benchmarks to evaluate the readiness of a city for metro development from the perspective of economy, which is that a city with a Gross Domestic Product (GDP) of 74,080 CNY per capita can be identified as the city ready for building metro lines. In addition, Sharav et al. [
4] emphasized the importance of assessing the investment accurately for metro construction by demonstrating a methodological approach. Besides economy, technology is also considered necessary support for metro construction consisting of hardware and software [
14]. The demand for the metro system refers to the purpose that a city needs to build a metro system to reduce urban traffic congestion, environmental pollution, and citizens’ travel demand. For example, The National Development and Reform Commission in China (2018) advised that the local governments must consider some critical parameters when planning the metro system network, including the distribution of population within a city, the city traffic demand, land use and others. Loo et al. [
14] pointed out that population, space constraint, cost constraint, and environmental considerations all encouraged the development of public transport networks such as metro systems. Moreover, fares, quality of service, and car ownership also contribute to the development of the metro system from the perspective of demand [
15,
16]. Among them, fares and quality of service belong to the attributes of the metro system, which can influence demand directly because higher fares or worse quality of service will cause lower passenger flow volume. At the same time, it is also considered that if an increase in car ownership occurs, the demand for the metro system will be reduced [
16].
Therefore, there is a need for coordinated development between supply and demand conditions for developing the metro system. It is considered very important to plan the scale of metro systems properly. Suppose the scale of the metro system is too small compared to the population scale of a city. In that case, it will not meet the transportation demand of the urban population [
17]. On the other hand, if a metro system is too big, that is oversupply, there will be low utility efficiency, which will result in the consequences of investment waste and the waste of land resources [
17,
18]. Different transport system models are raised to explore the relationship between demand and supply in urban mass transport. For example, Chen et al. [
19] identified the relative spatial gaps in public transport supply and demand from seniors by calculating the public transport supply and public transport demand indices. Hörcher and Graham [
20] investigated public transport supply conditions when facing independent but nonidentical demand conditions using a baseline model based on the crowding multiplier approach and the crowding cost function. Konečný et al. [
21] concluded that the supply of connections is not a statistically significant indicator that refers to demand in some cases using correlation analysis and covariance methods. In addition, Malavenda et al. [
22] simulated the two-way relationship between land use and transport systems in urban areas based on Land Use and Transport Interaction (LUTI) models. Croce et al. [
23] constructed the path and route choice model of commercial vehicles travelling on a road network due to the demand conditions.
Although previous studies have paid attention to the supply and demand of the metro system by using various transport system models from different perspectives, few studies focus on the coordination problem of the demand and supply. In fact, the coupling coordination degree model has vast advantages in studying the coordination problem. Coupling, a concept in physics, refers to the phenomenon that several physical systems interact with each other through internal connection, so coupling degree is proposed to describe the degree of interaction among systems [
24]. In addition, the coordination degree is raised to measure the status or level of coordination of systems. Therefore, combining the concepts of coupling degree and coordination degree, the coupling coordination degree is used to measure whether the internal systems are in harmony with each other in the development process, considering interaction and coordination [
25]. The coupling coordination degree has been widely used to analyze urban development, and most studies concentrate on the subsystems of the whole city, especially between economy and ecology. For example, Sun and Cui [
26] applied a coupling coordination degree model to analyze the development in harmony with the economic, social, and environmental benefits of urban public transportation infrastructure to improve the coordinated development level. Li and Yi [
27] evaluated the sustainability of cities by calculating coordination among economy, society, and environment with the coupling coordination degree model. Shen et al. [
28] introduced an improved coupling coordination degree model to evaluate the coordination between socio-economy and carbon emissions for sustainable urban planning. Xing et al. [
29] assessed the coordinated results in the economy-resource-environment system based on the coupling coordination degree model for sustainable urban development.
The above discussions demonstrate a small existing study assessing the coupling coordination degree of metro systems from a perspective between supply and demand conditions. Therefore, in this study, an assessment model is developed to evaluate the coupling coordination degree between the supply and demand conditions for developing the metro system. And then, the coupling coordination conditions of 35 cities in China are analyzed. The contributions of this paper are as follows. First, while some scholars have researched demand or supply conditions of the metro system, previous studies mainly concern the factors affecting development conditions from the perspective of demand or supply [
3,
4,
14,
15,
16], and empirical analysis of demand or supply conditions in the background of seniors [
19], independent but nonidentical demand conditions [
20], and normal cases [
21]. In this study, under the background of sustainable development, coupling coordination conditions between demand and supply can provide a new angle for developing the metro system. Second, in the case study results, the categories of the coupling coordination degree of the metro system between demand and supply are identified. The suggestions to improve the development of the metro system are also discussed. The research results in this study can provide a reference for other coupling coordination problems in sustainable urban development.
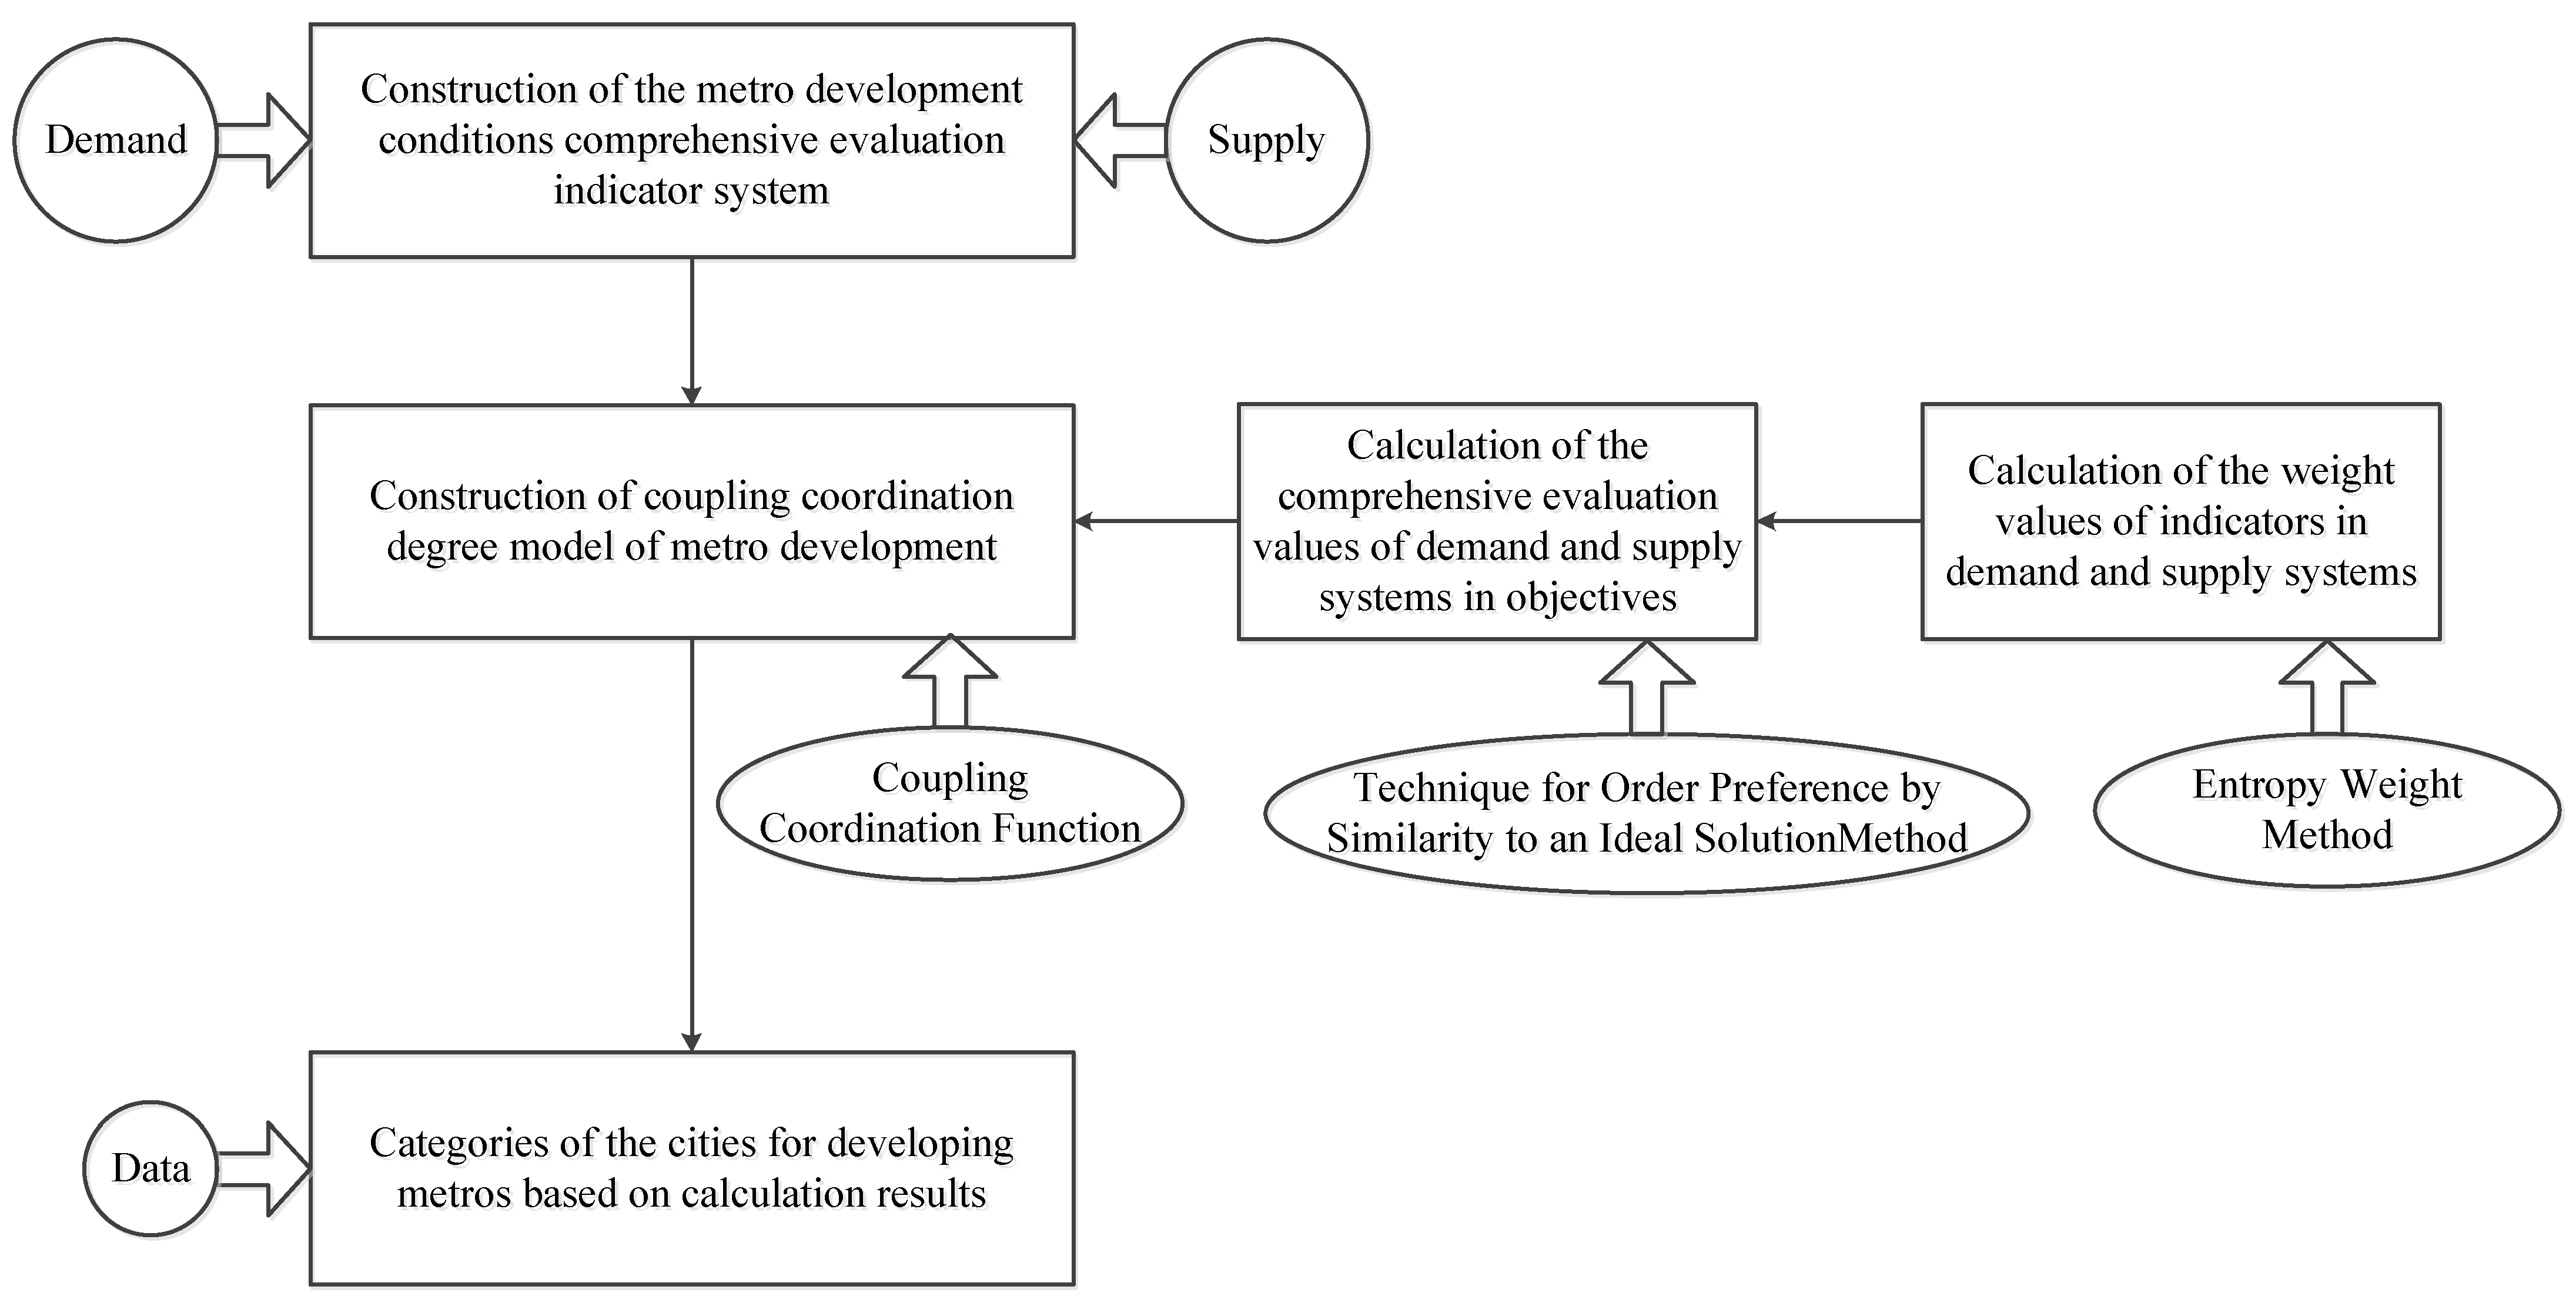
2. Construction of the Metro Development Conditions Comprehensive Evaluation Indicator System
Demand can be defined as the amount of all services and products currently utilized, consumed, or expected to be obtained by the human society in a particular area [
30]. Similarly, the demand for the metro system means the number of metros to adapt to the conditions currently, even in the future. After collecting and consolidating the literatures of factors affecting metro system demand [
3,
4,
14,
15,
16,
31], four dimensions, including satisfaction of people’s going out (D1), improvement of urban environmental conditions (D2), improvement of urban traffic conditions (D3), and perfection of the development of metro (D4), are proposed to reflect the level of the demand for the metro system. Among them, the satisfaction of people’s going out mainly considers the amount and the density of population because a higher amount or density will lead to the possibility that more metro systems are needed to accommodate the passengers. As for the improvement of urban environmental conditions, compared to other modes of transportation, the metro system can reduce both exhaust pollution and noise pollution from cars, significantly contributing to the people’s living environment. In the dimension of improving urban traffic conditions, taking road facilities and other transportation infrastructures into account, the metro system can reduce the traffic congestion and the pressure of operation of mass traffic. Finally, the metro’s current construction condition and operational condition can directly report whether the metro system needs to be continuously constructed. Therefore, through a further analysis on the relevance, comparability, and data availability of indicators, 16 demand indicators are selected, as shown in
Table 1.
Supply refers to the capacity to provide services and goods for human society [
30]. Similarly, the supply of the metro system can be defined as the services and goods that the local government or city can provide. Through considering the relevant references [
3,
4,
14,
15,
16,
31], three dimensions, including finance (S1), manpower (S2), and land (S3), are proposed to reflect the level of supply for the metro system. Finance (S1) and manpower (S2) represent the expense and workers that the government can afford or offer in the construction and operation of the metro system. A more excellent level of finance or manpower means a more outstanding development environment in terms of supply conditions. Land (S3) can provide the space for construction and the passenger flow for the operation indirectly. Hence, through a further analysis on the relevance, comparability, and data availability of indicators, 9 supply indicators are selected, as shown in
Table 1.
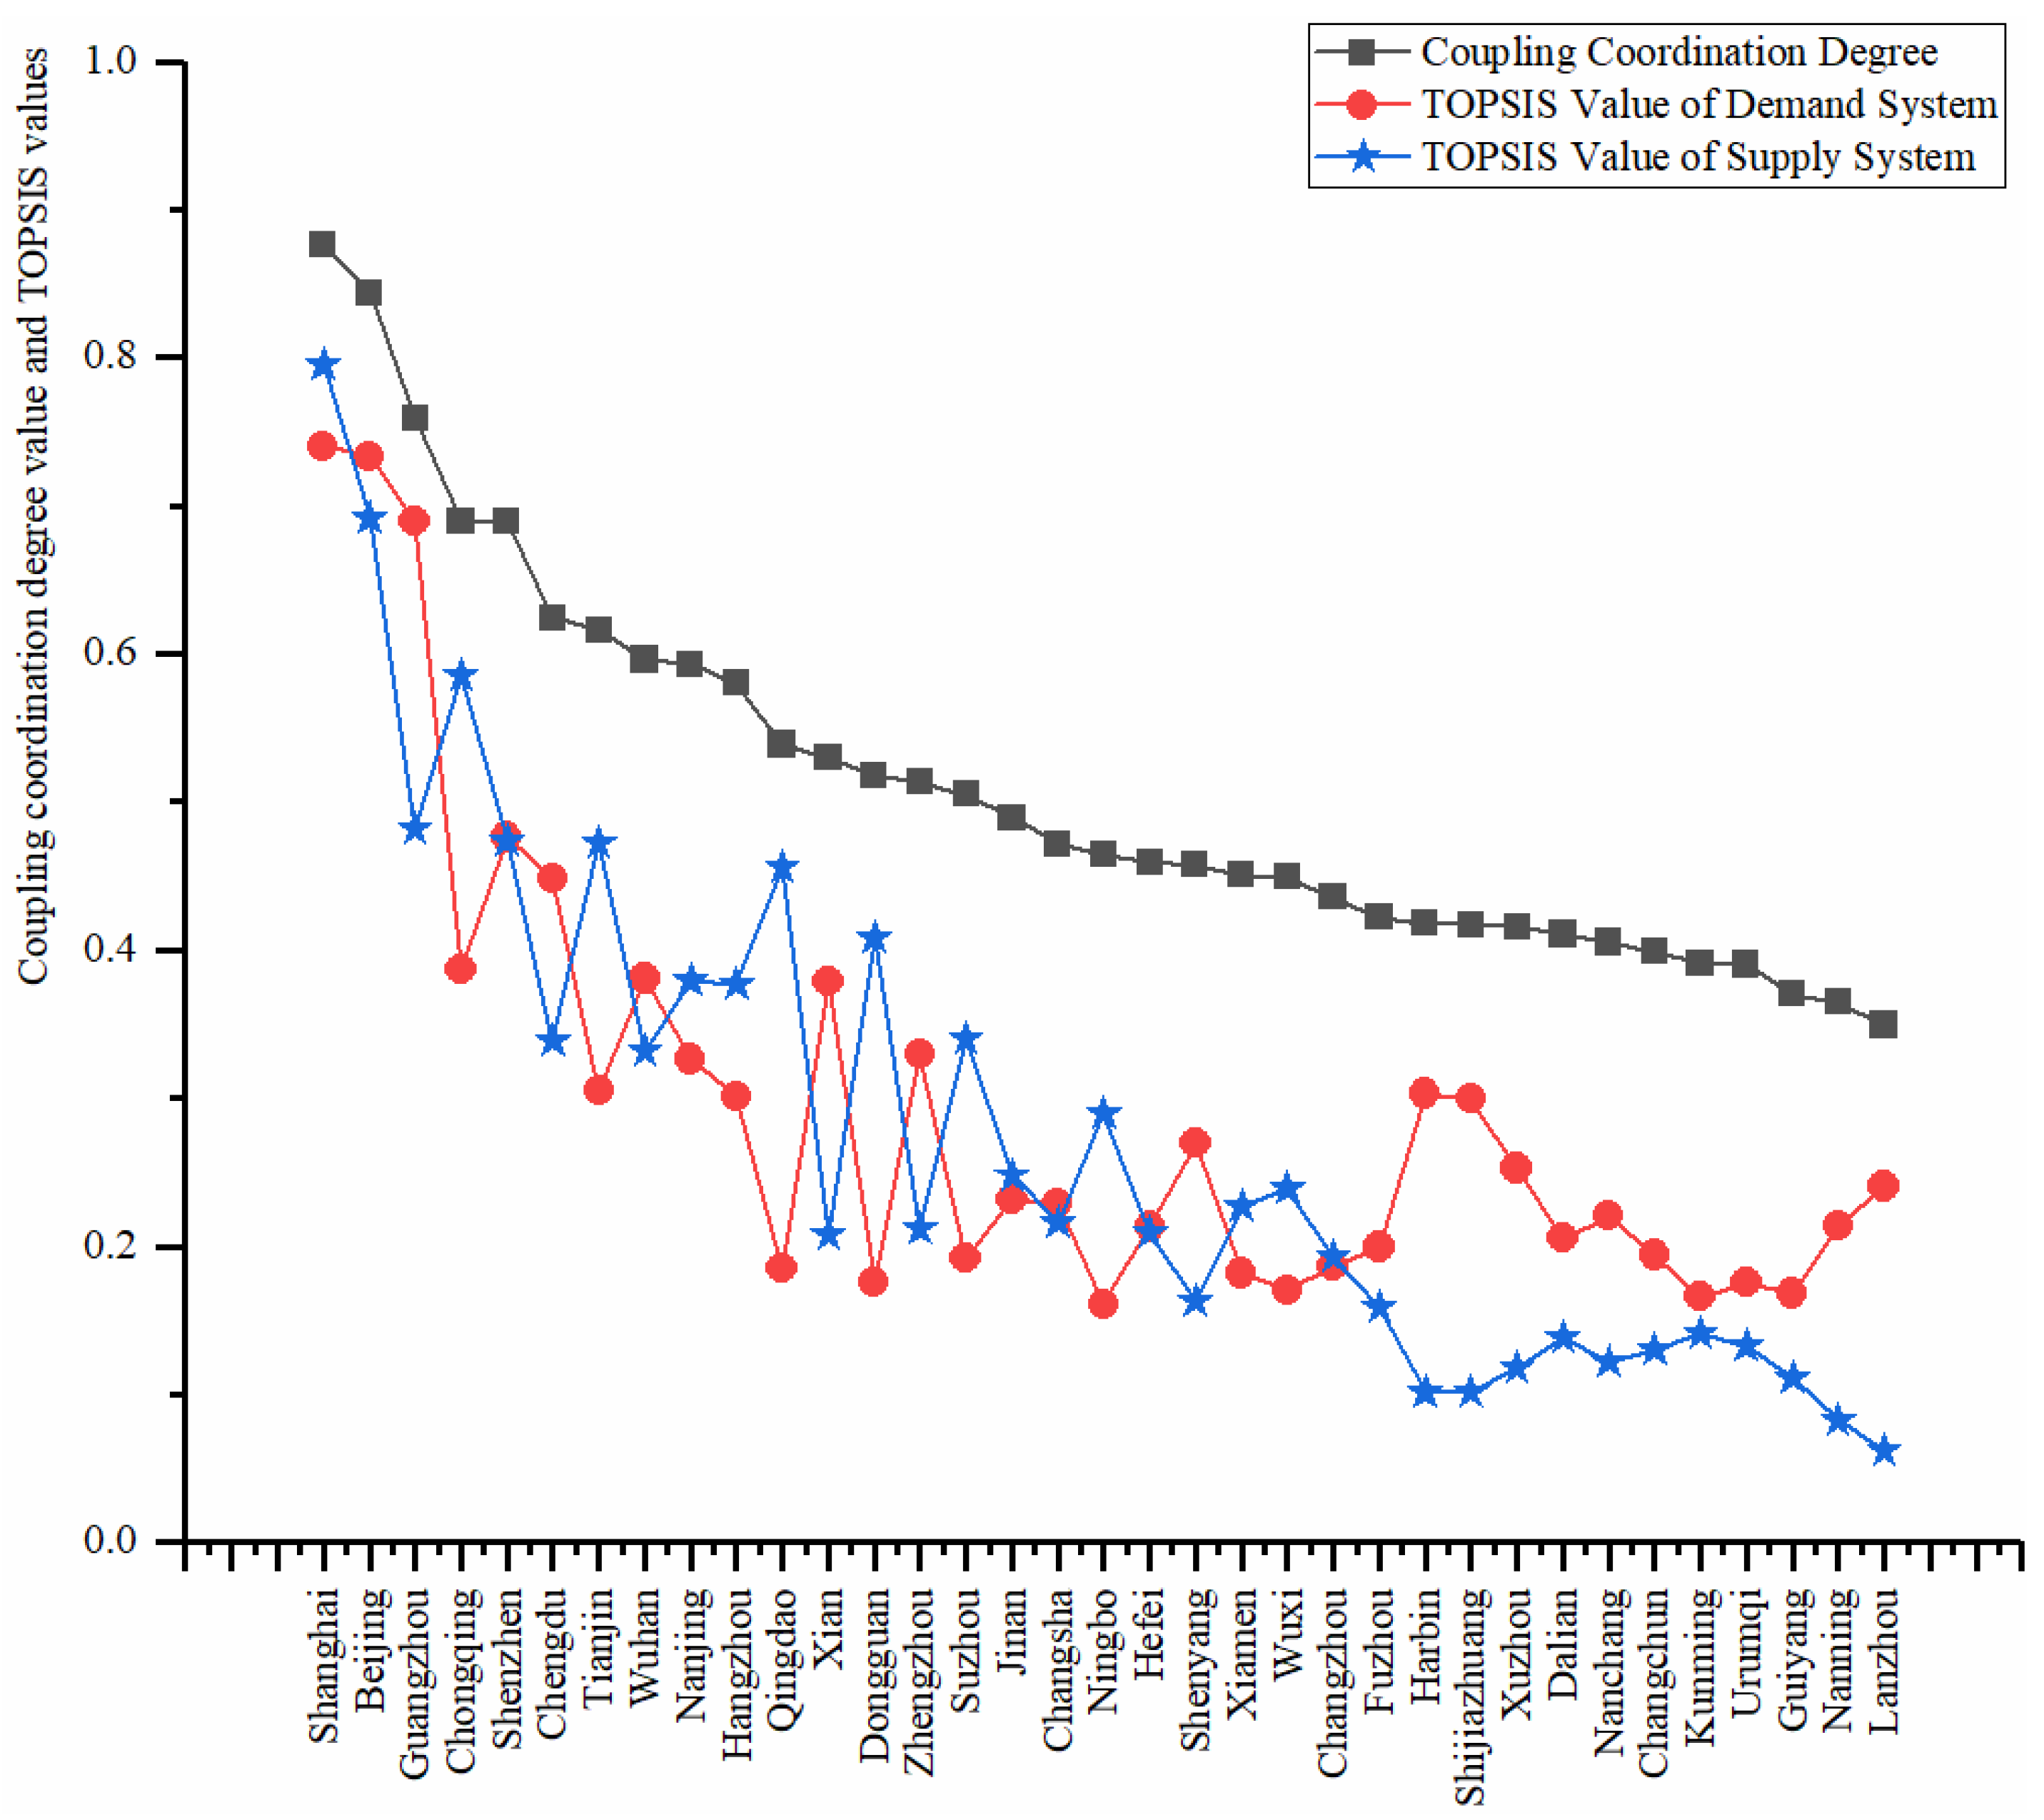
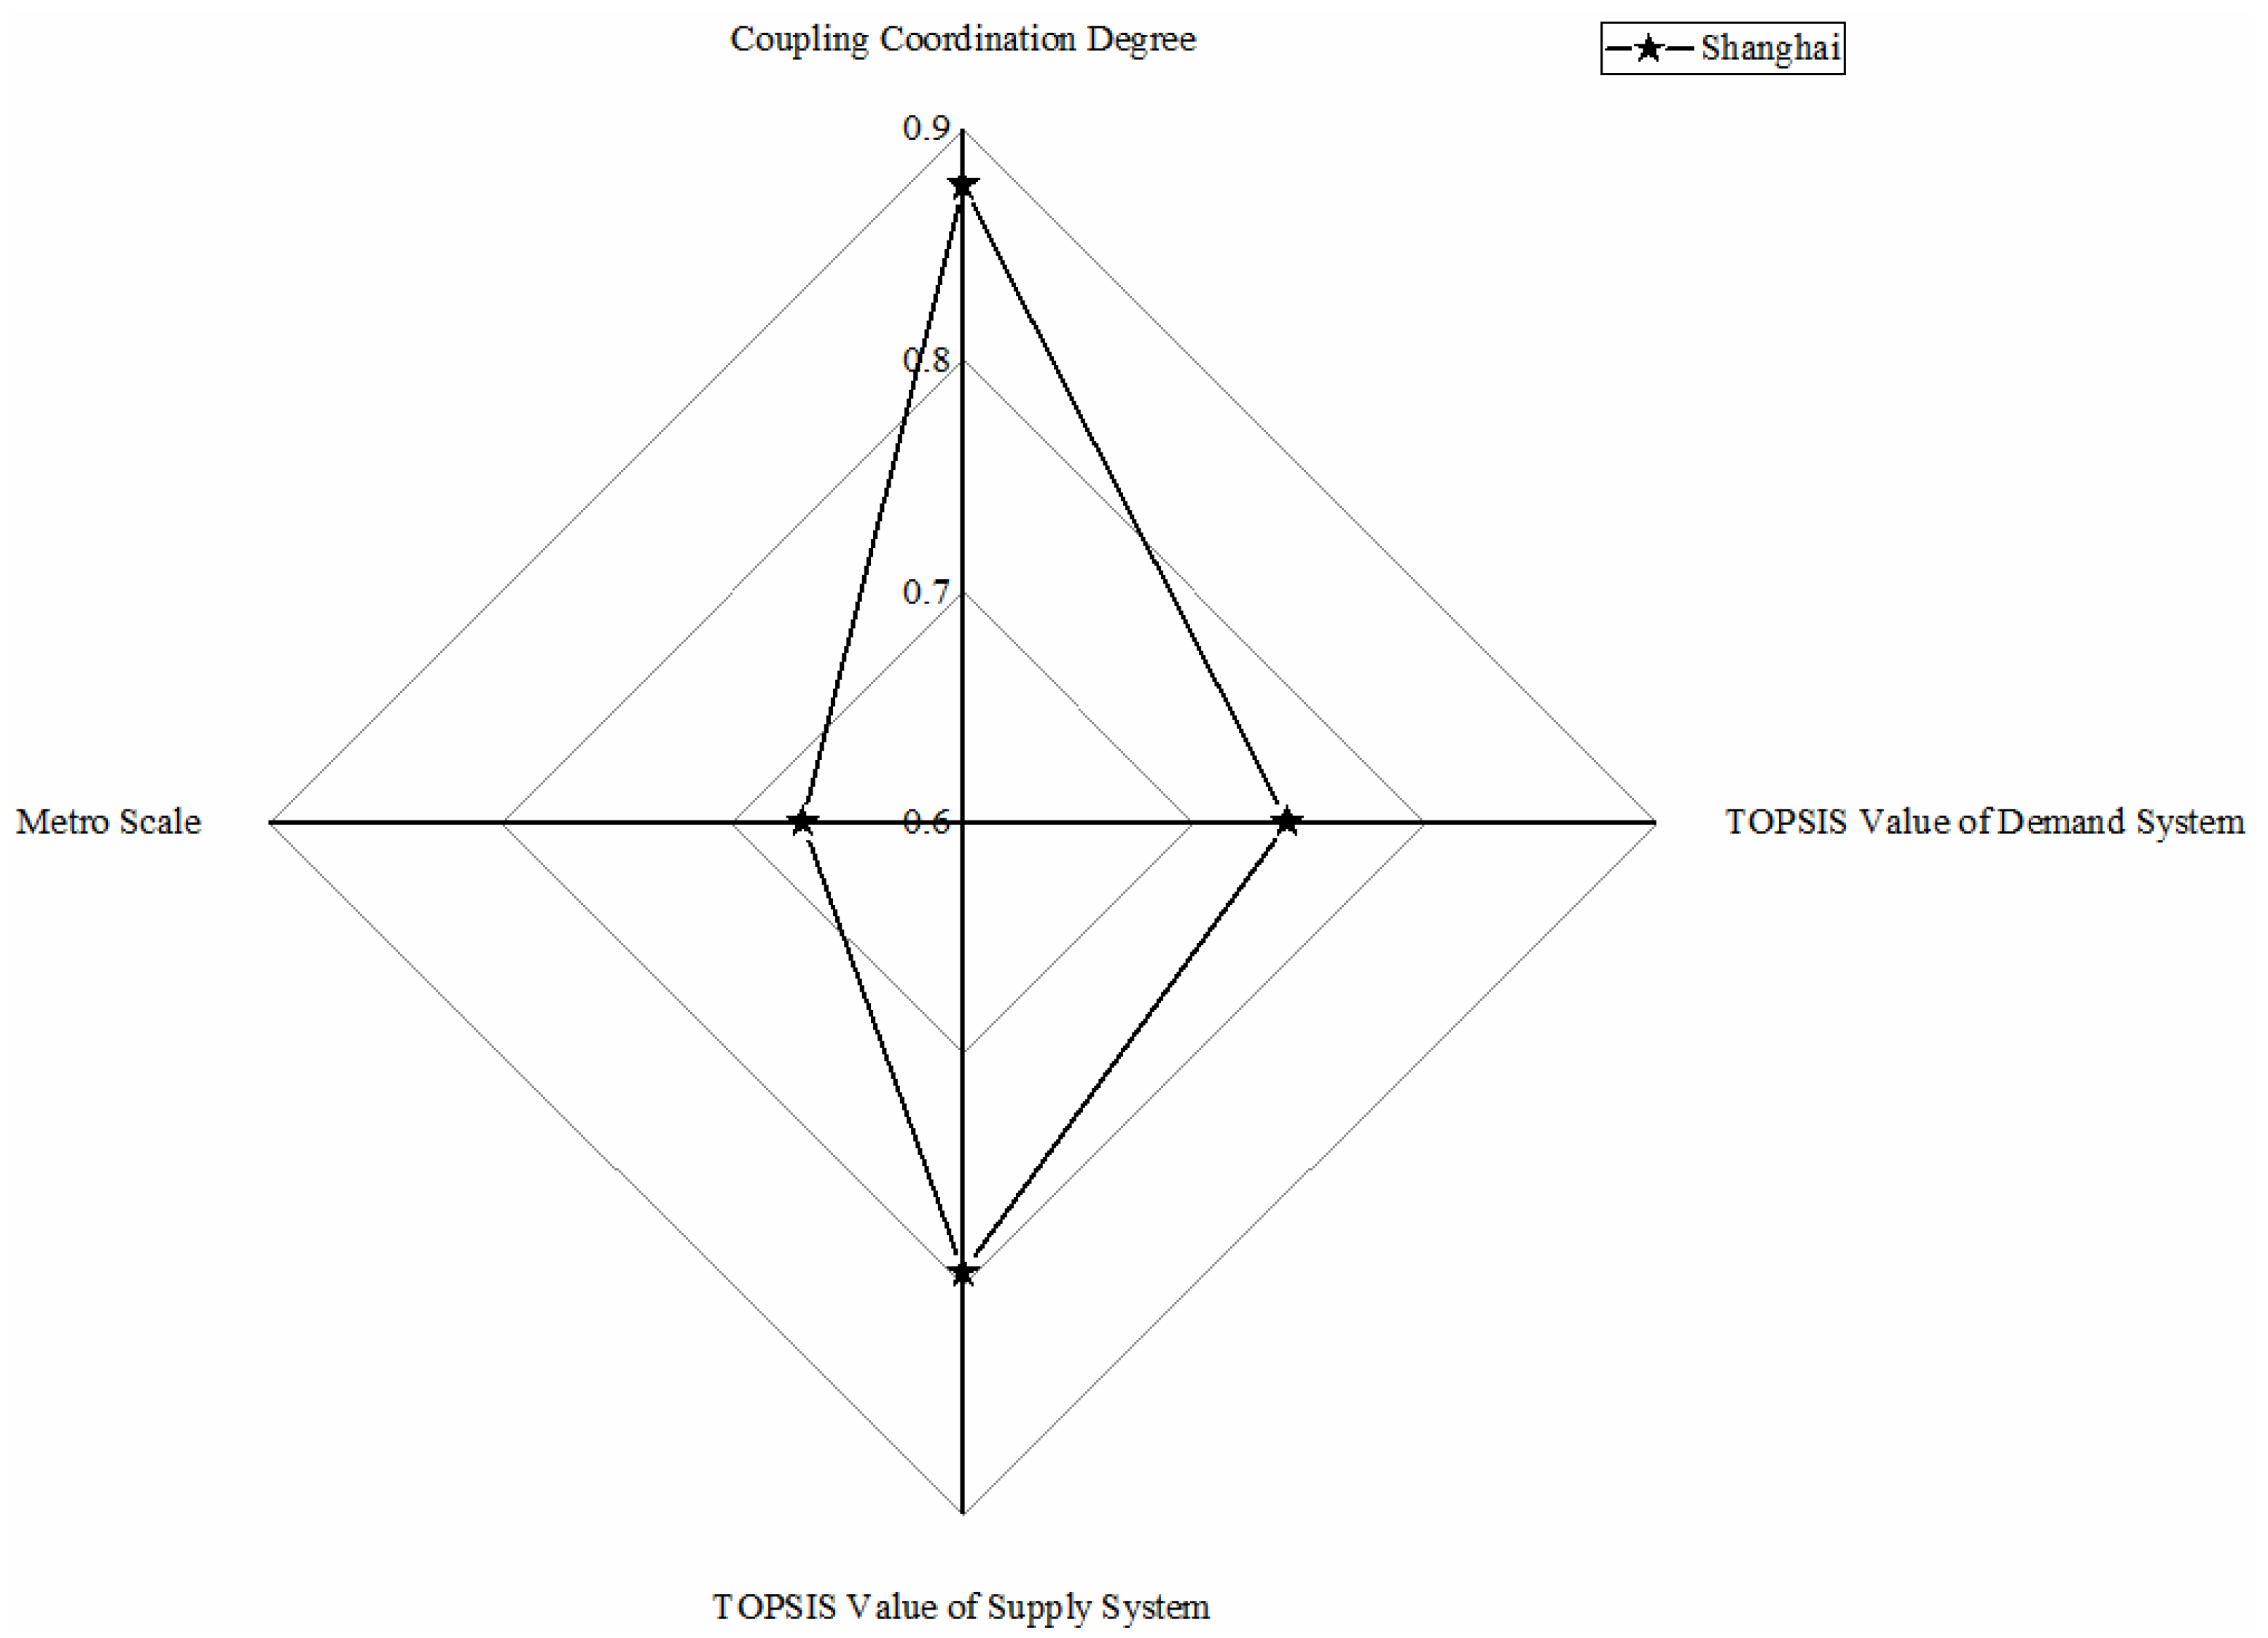
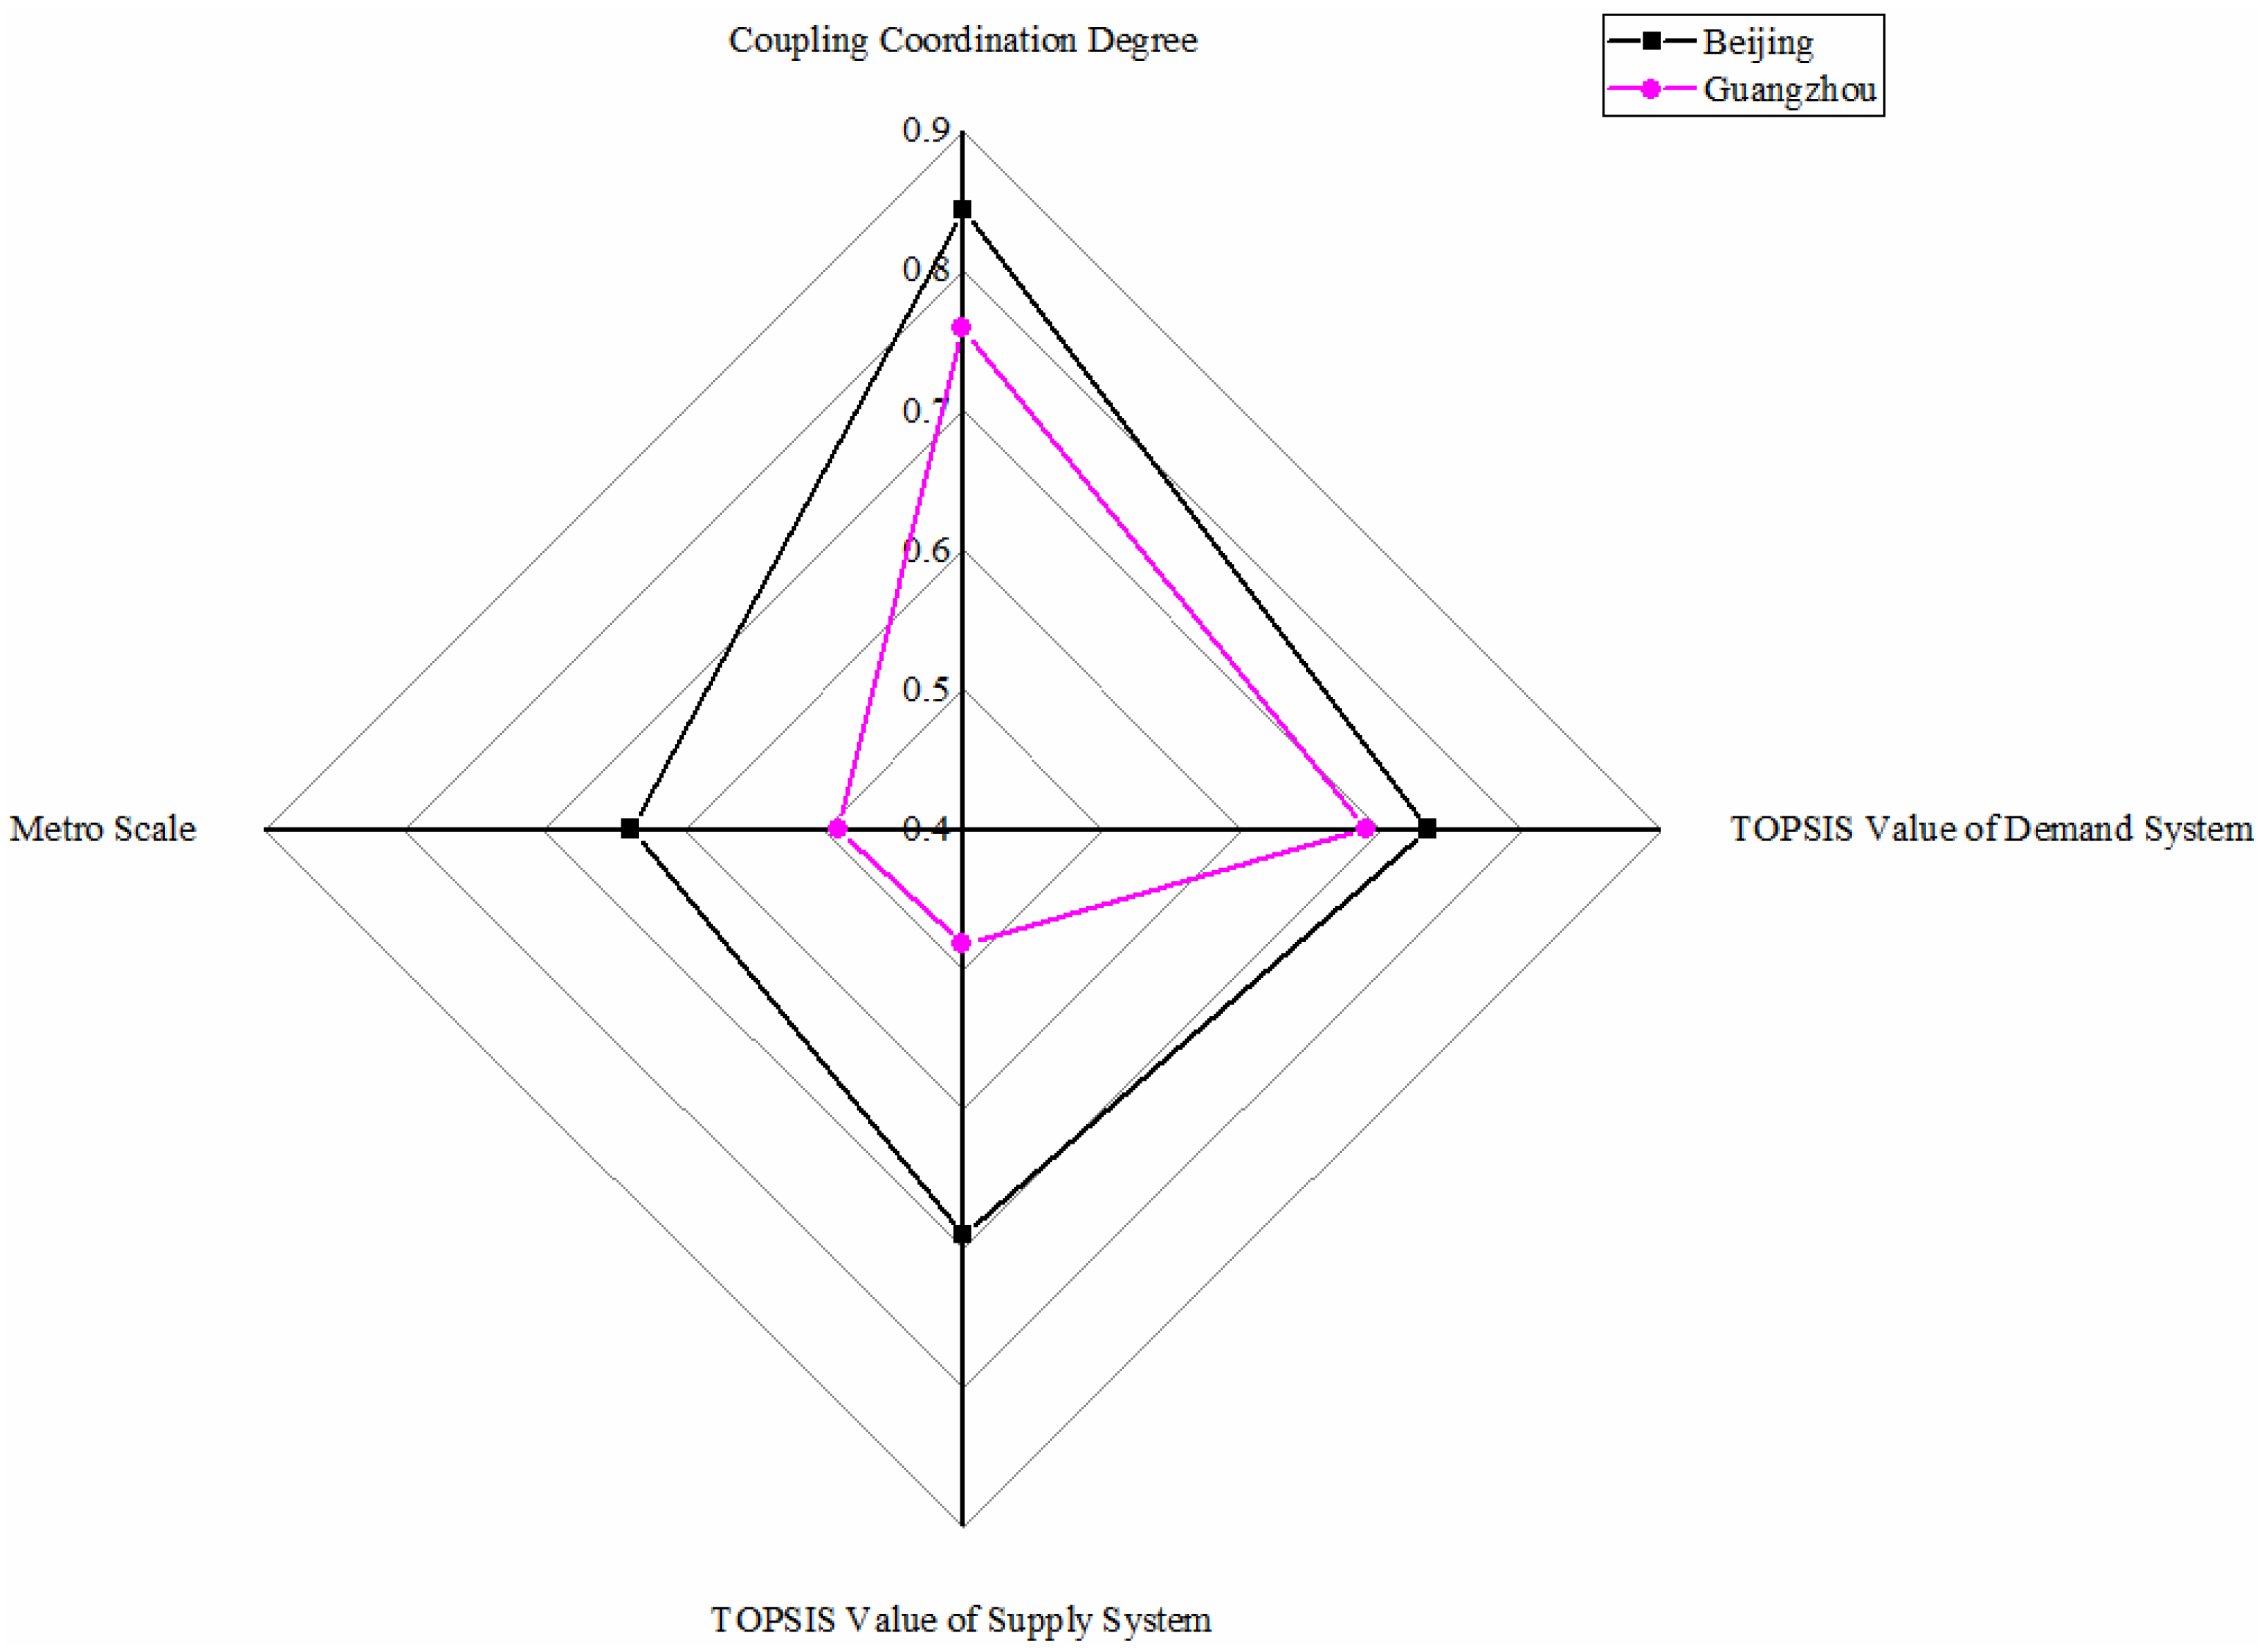
6. Conclusions
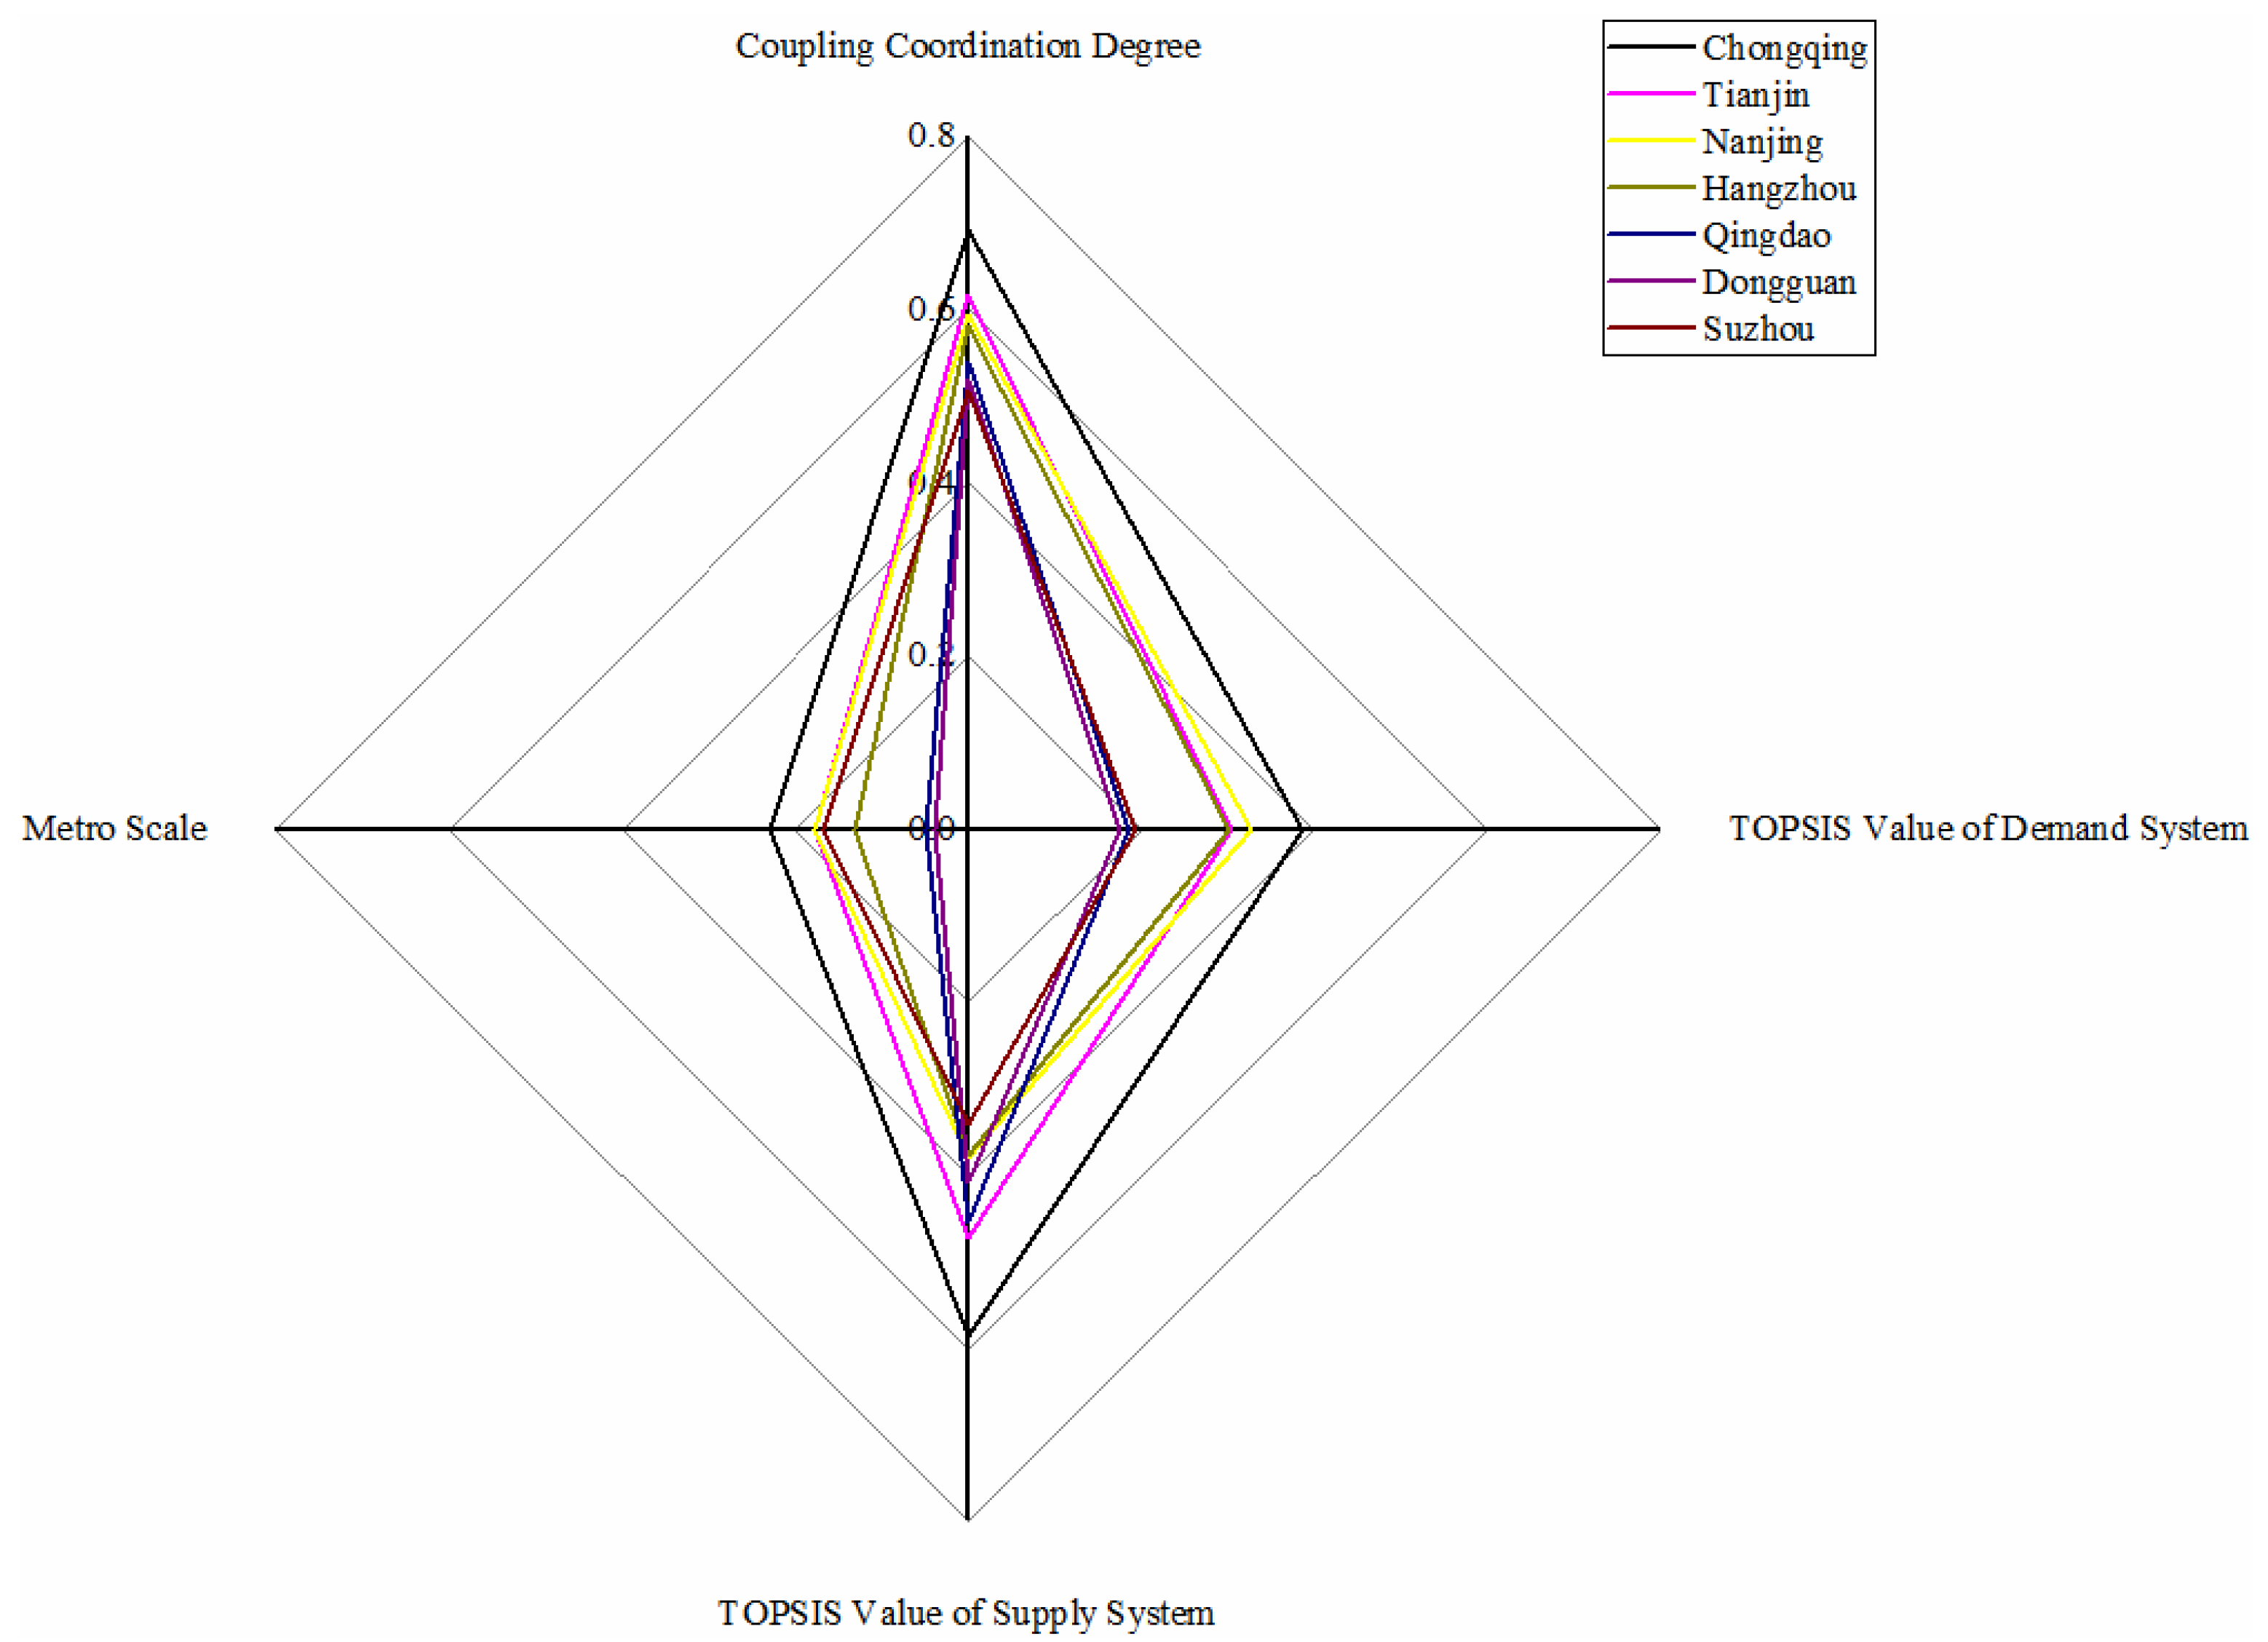
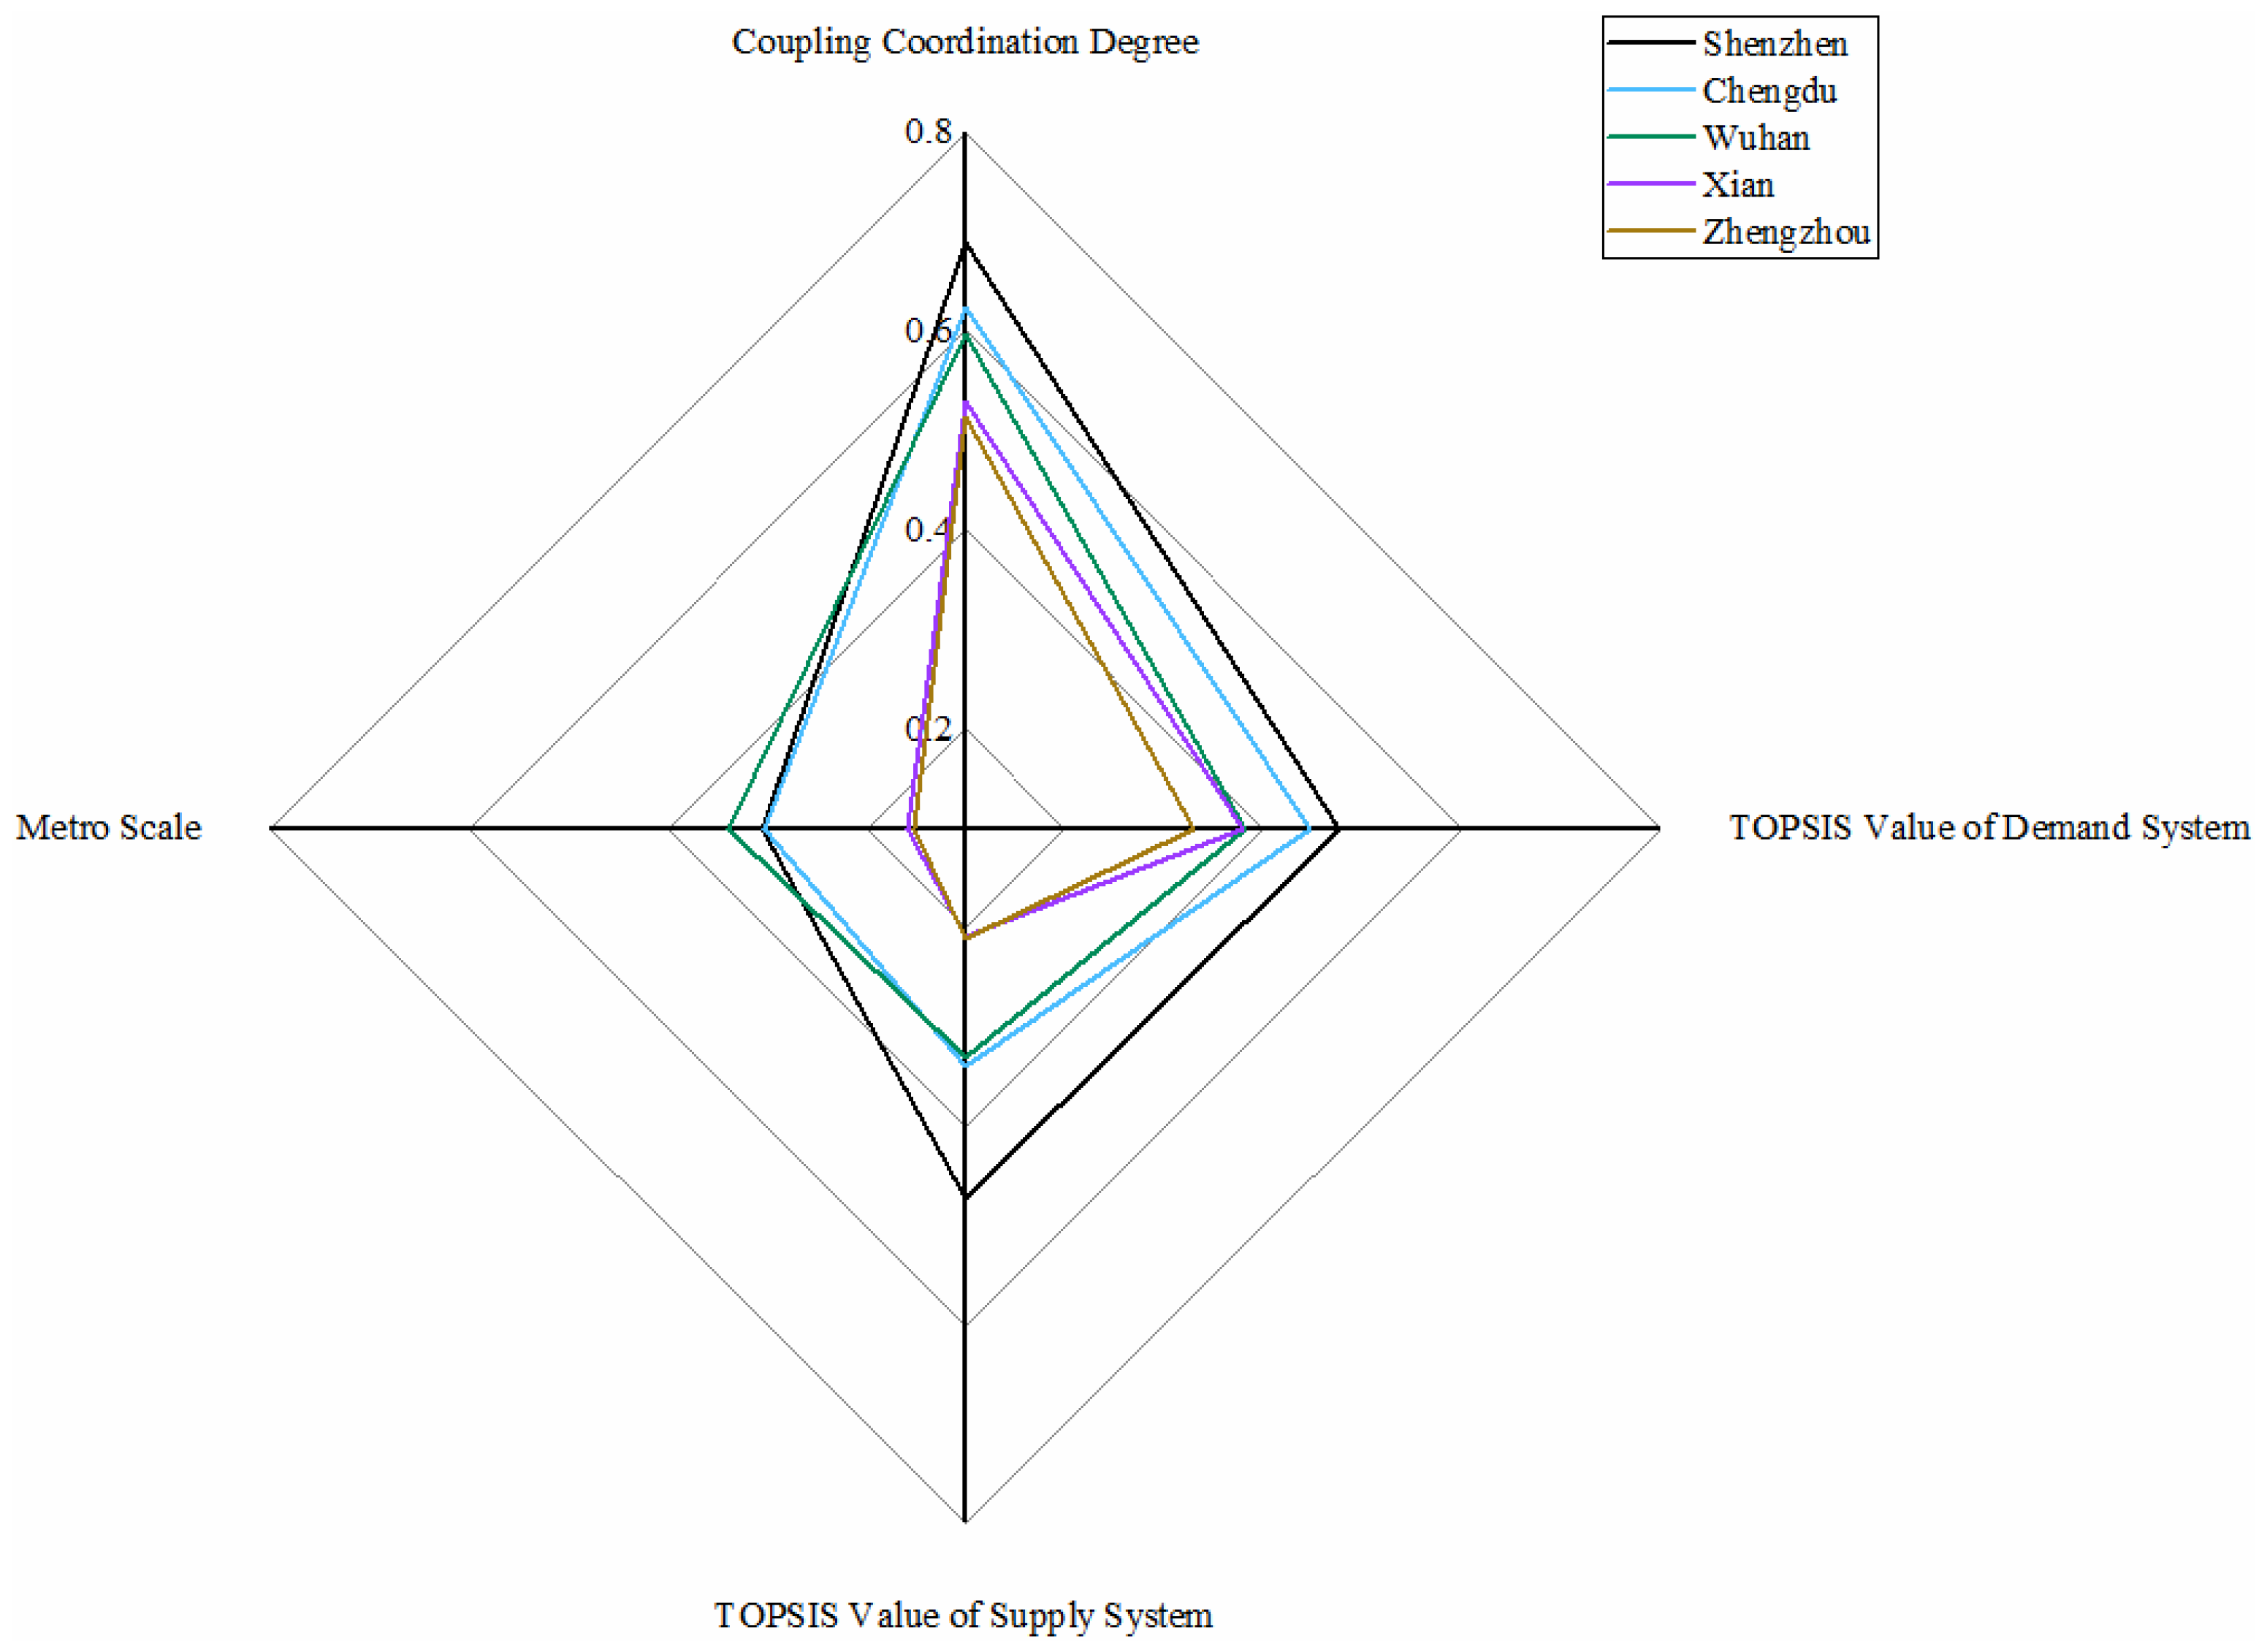
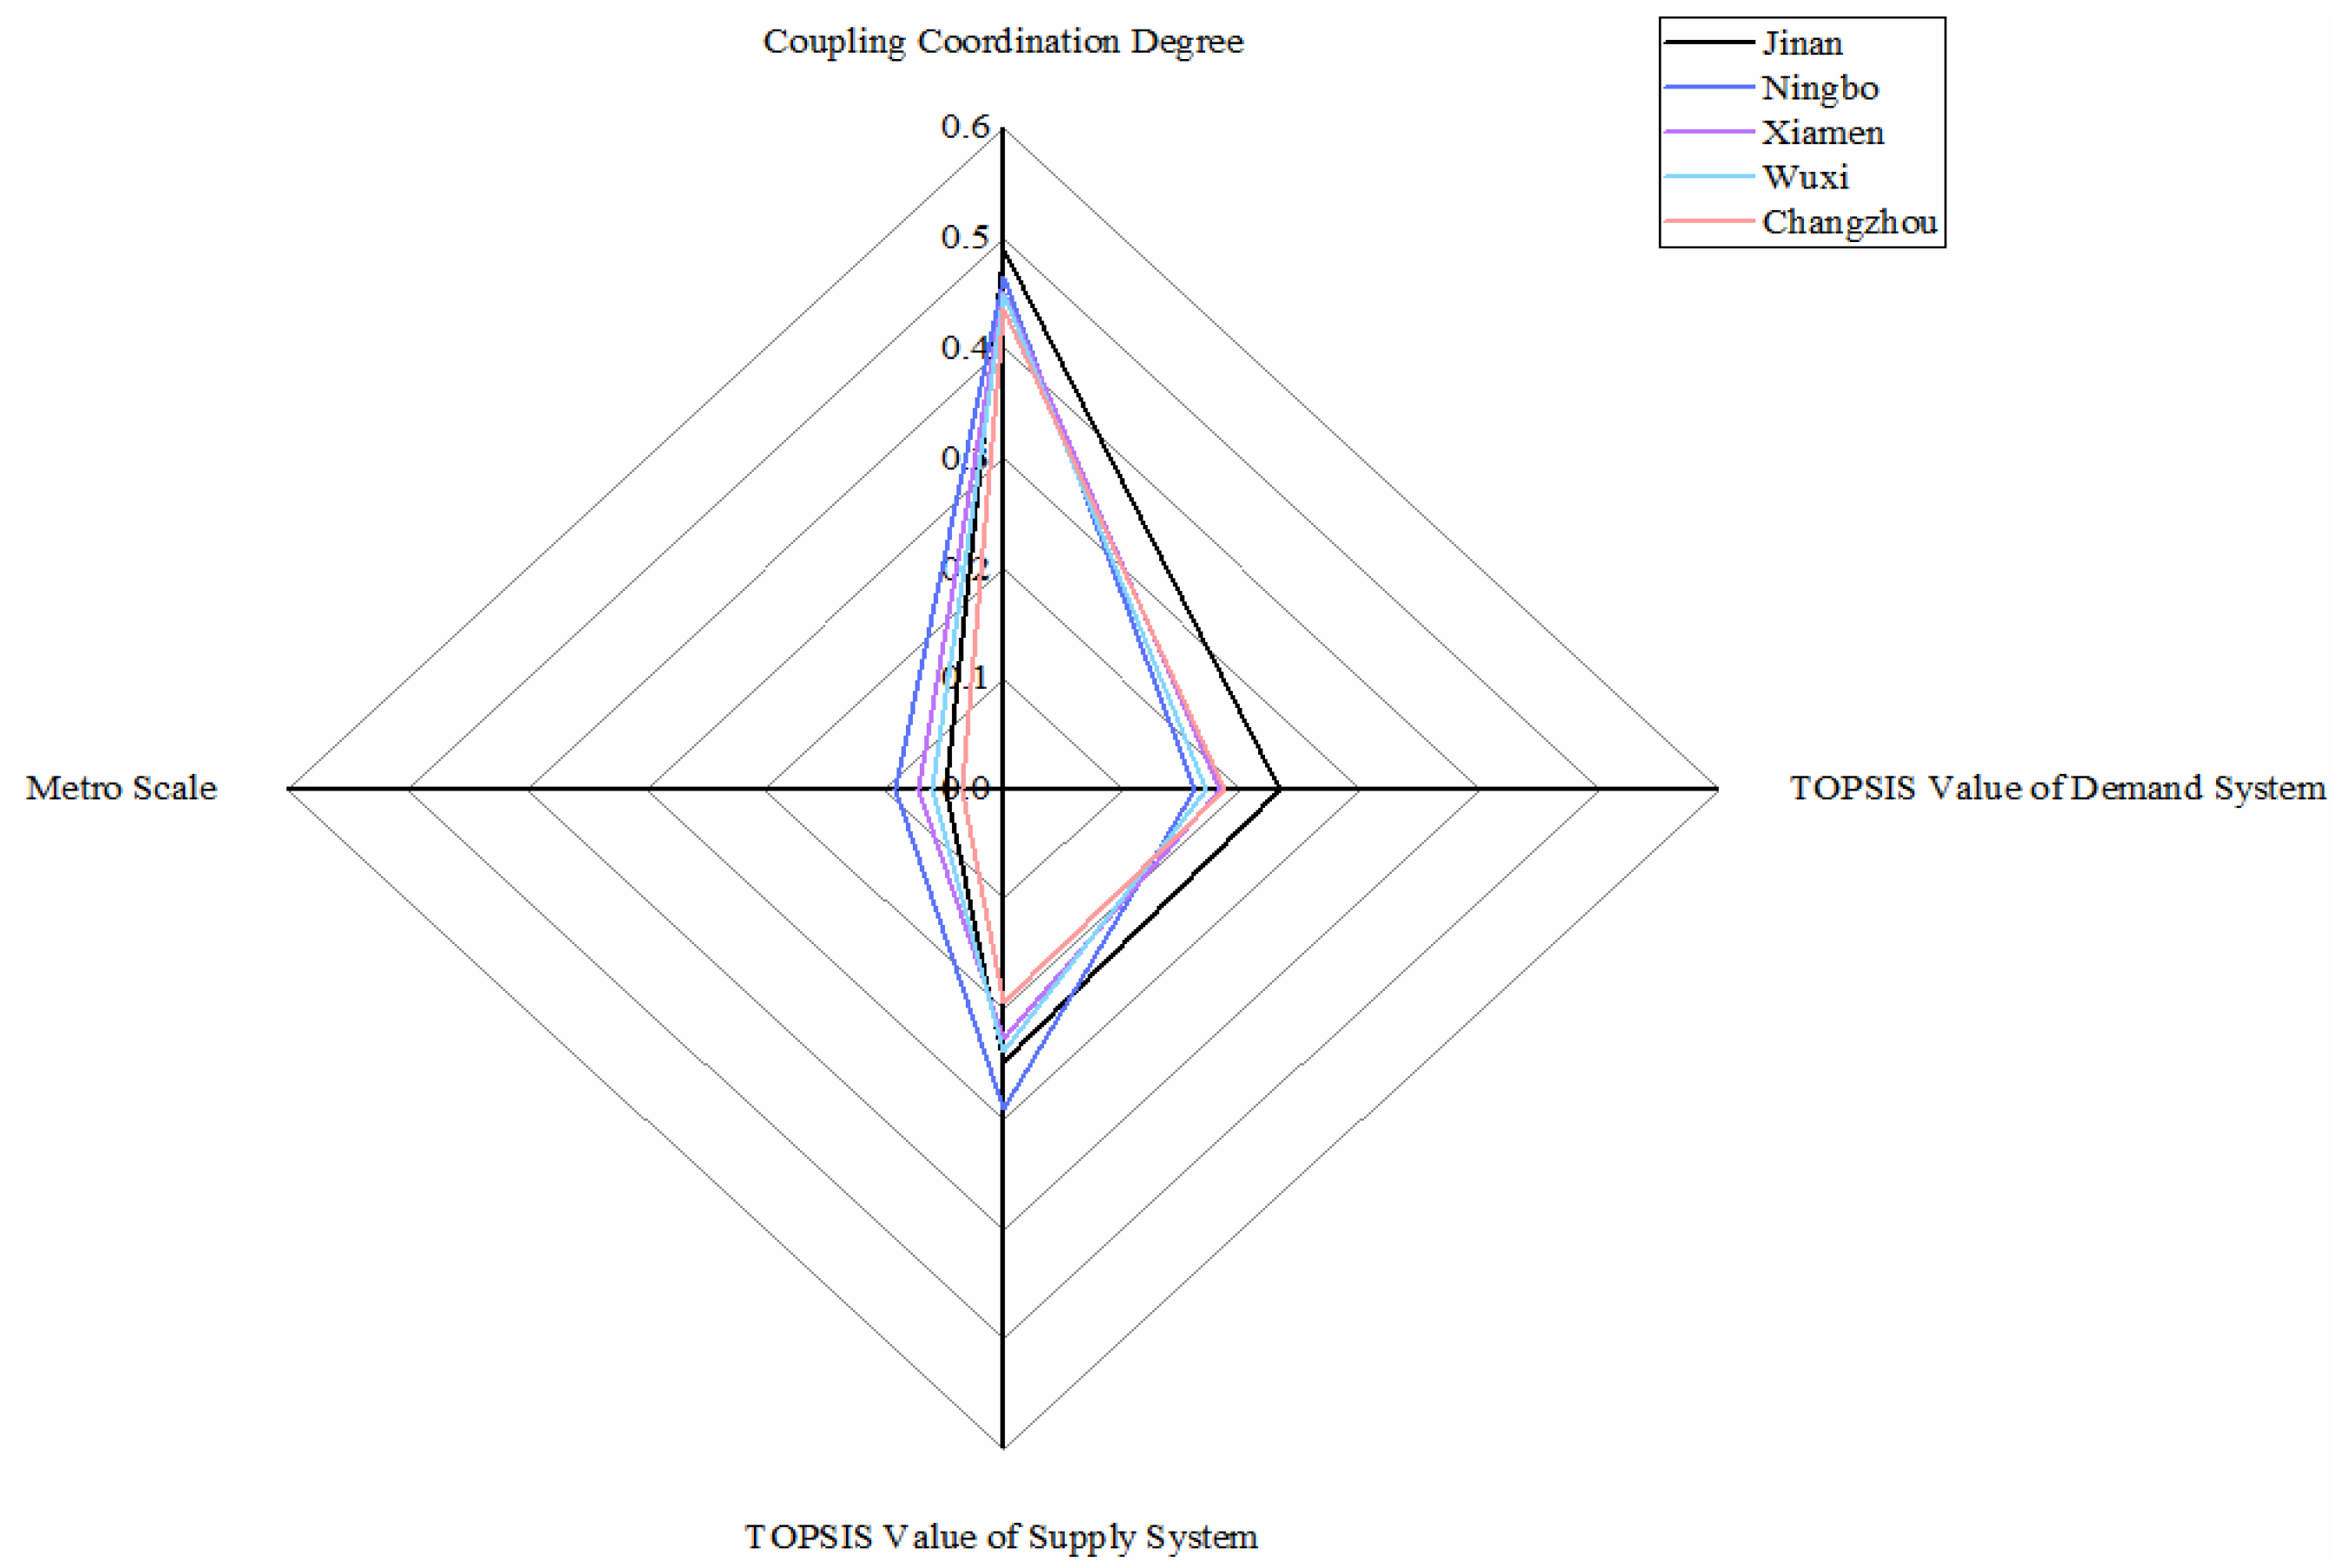
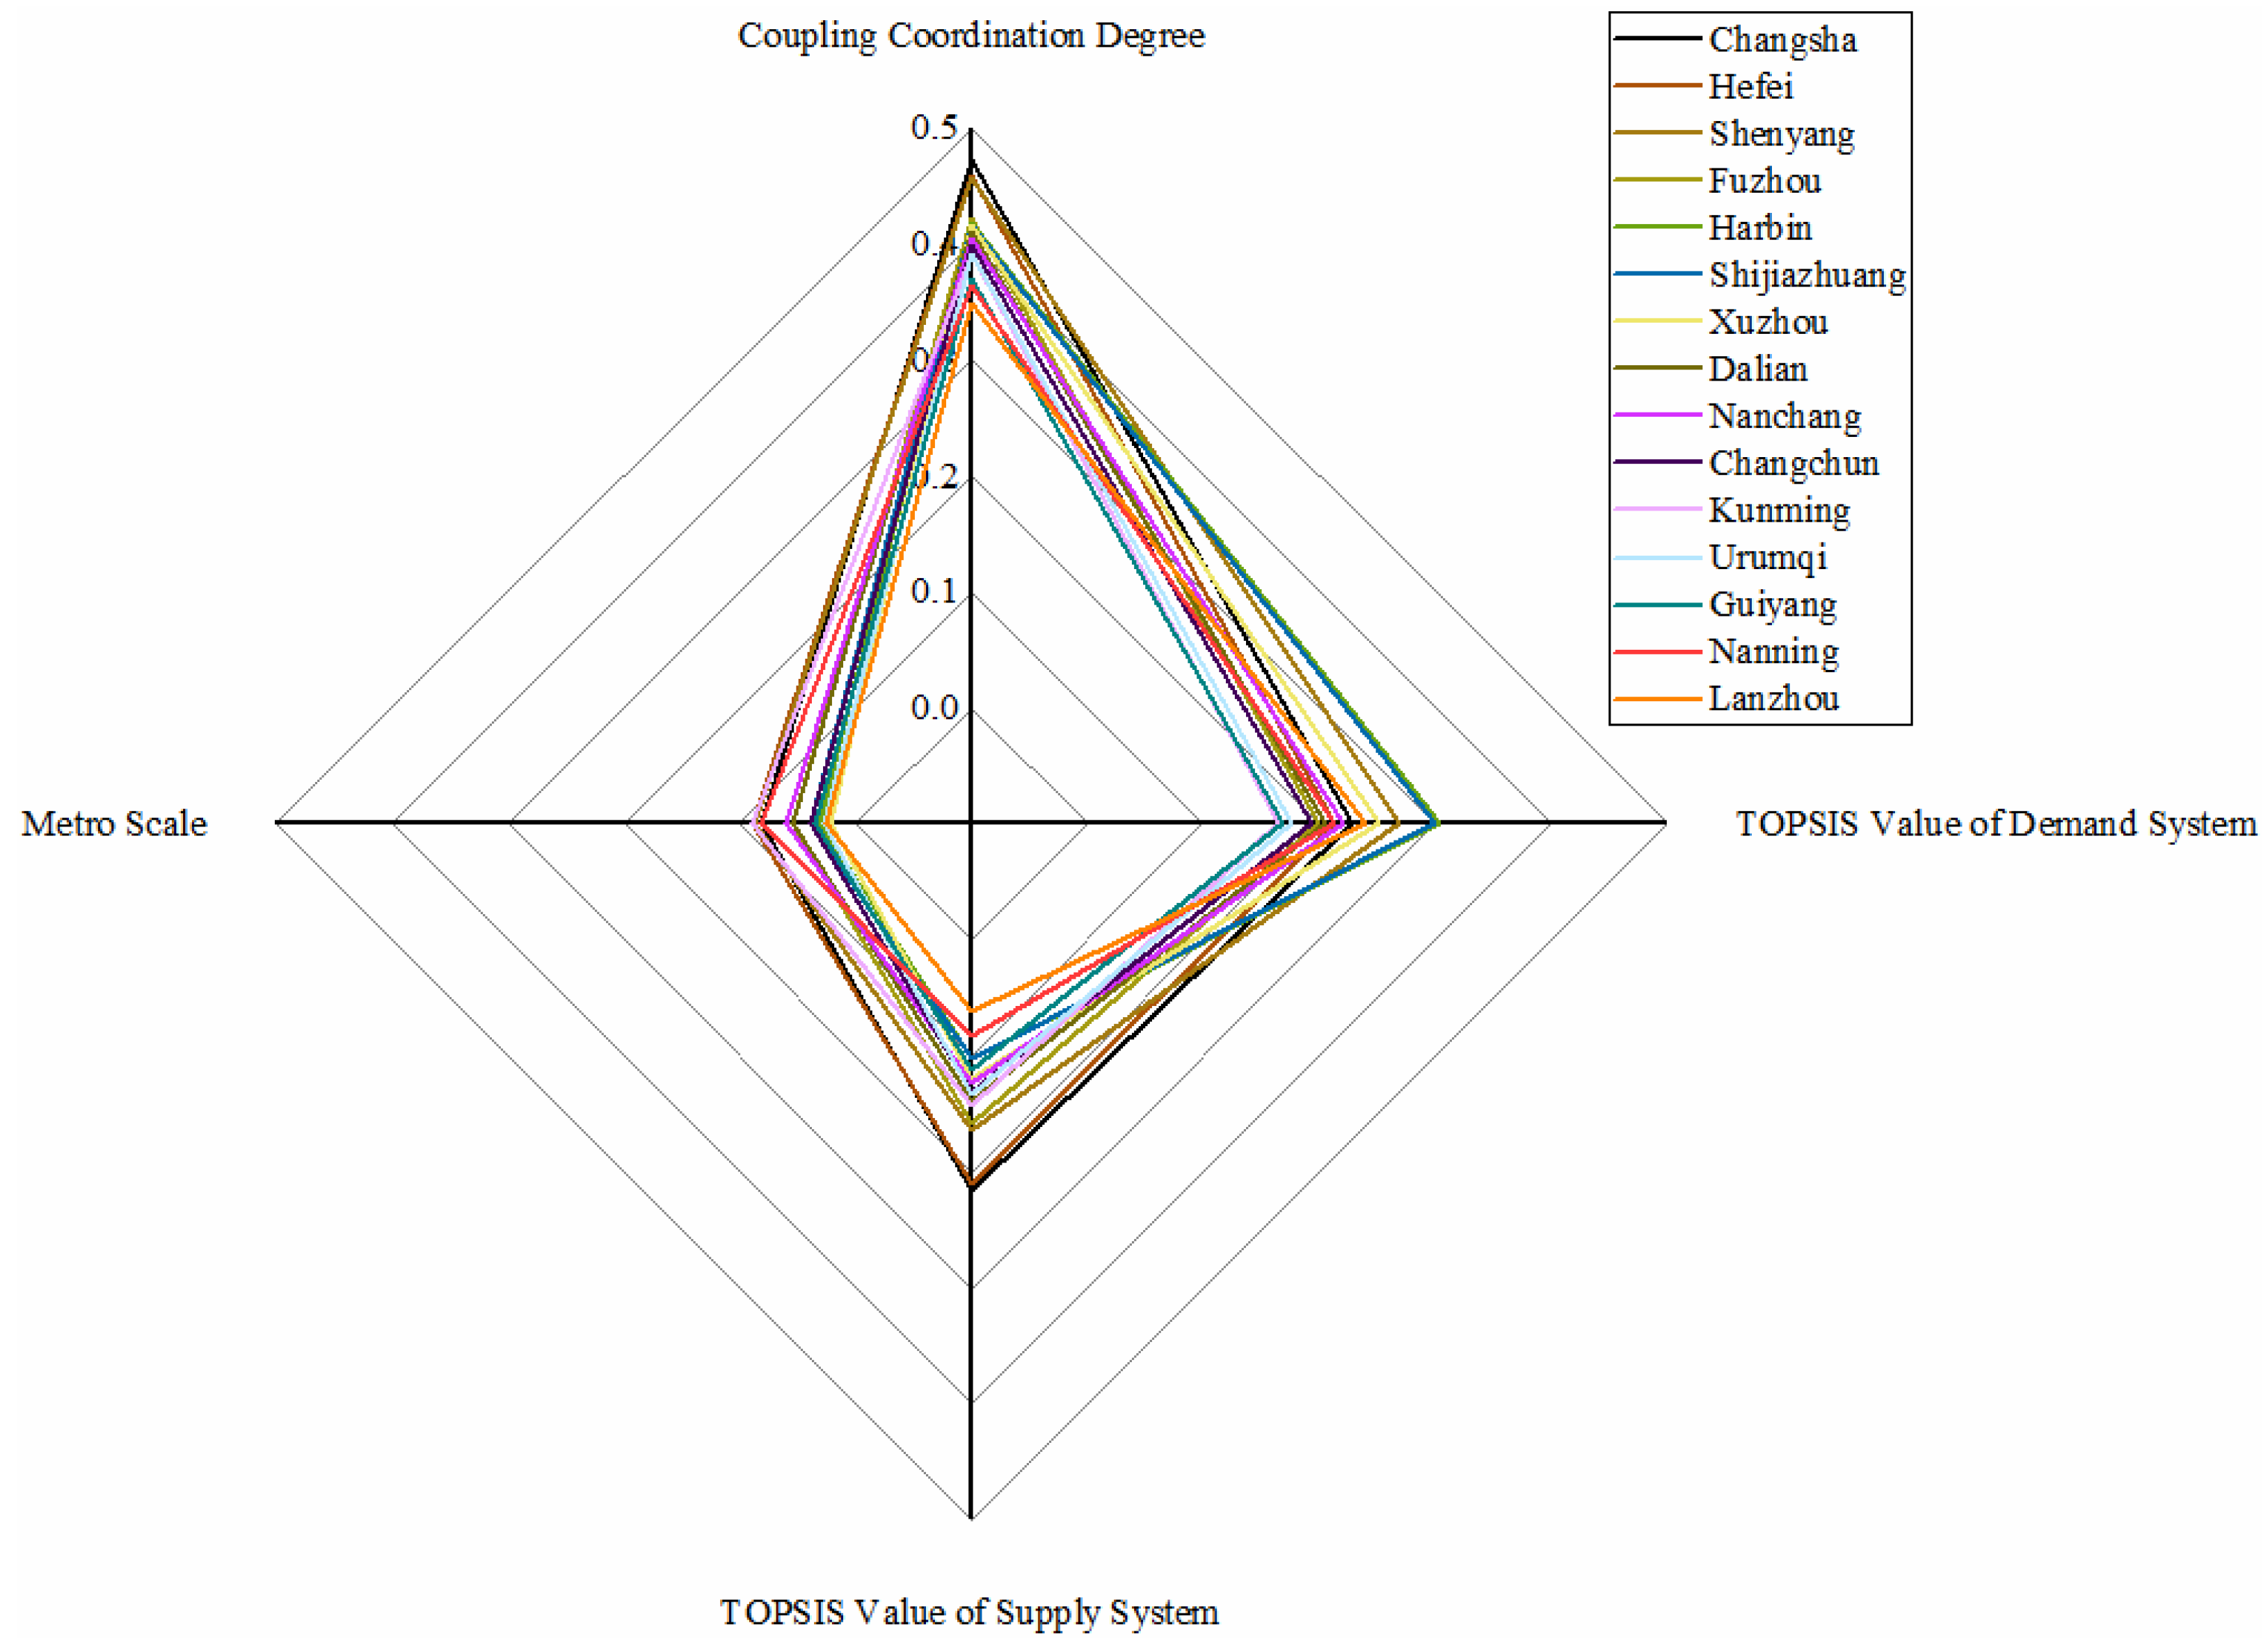
The coupling coordination degree of 35 cities in China is measured by the indicator system and coupling coordination degree model established in this study. From the results and the discussion, firstly, the comprehensive evaluation indicator system of metro development conditions and the coupling coordination degree model can be well used to evaluate the coupling and coordination of the metro system. Secondly, the development conditions of the metro system among the 35 cities in China are quite different according to the calculation results due to the individual differences in the specific socio-economic condition in all the cities. Finally, the category of coupling coordination degree and the comparison of demand and supply conditions can offer specific suggestions for metro development in the future. For example, the metro systems of slightly unbalanced cities should put urban development first because only favorable demand and supply conditions will benefit the metro development. Moreover, cities’ metro systems in the types of barely balanced and highly balanced should improve the demand or supply conditions based on the results, keep harmony between the two systems, and finally realize sustainable development for the metro system.
This study has yet to consider the availability of data for other countries in the constructed model, which is a limitation. However, suppose the constructed model is applied to other cases. In that case, the parameters of the model will be appropriately modified according to the data characteristics of other countries. This is also the following research focus of the research team, through optimizing the established model and collecting more data for analysis of more metro systems in the world. In addition, sustainable development for the metro system is not only the improvement in demand and supply conditions, but also the sustainability parameters regarding risk management, the environmental impacts of its construction, the comparison with other mass transport systems with lower emissions or fewer infrastructure requirements, and the damage from natural disasters. Hence, there is still considerable space for improvement for model parameters to analyze the sustainable development of the metro system.


