
Using Systems Dynamics for Capturing the Multicausality of Factors Affecting Health System Capacity in Latin America while Responding to the COVID-19 Pandemic

 ,
,  ,
,  ,
,
Abstract
:1. Introduction
2. Materials and Methods
2.1. System Dynamics (SD)–Group Model Building (GMB)
2.2. Validation Phase
3. Results
3.1. GMB Models
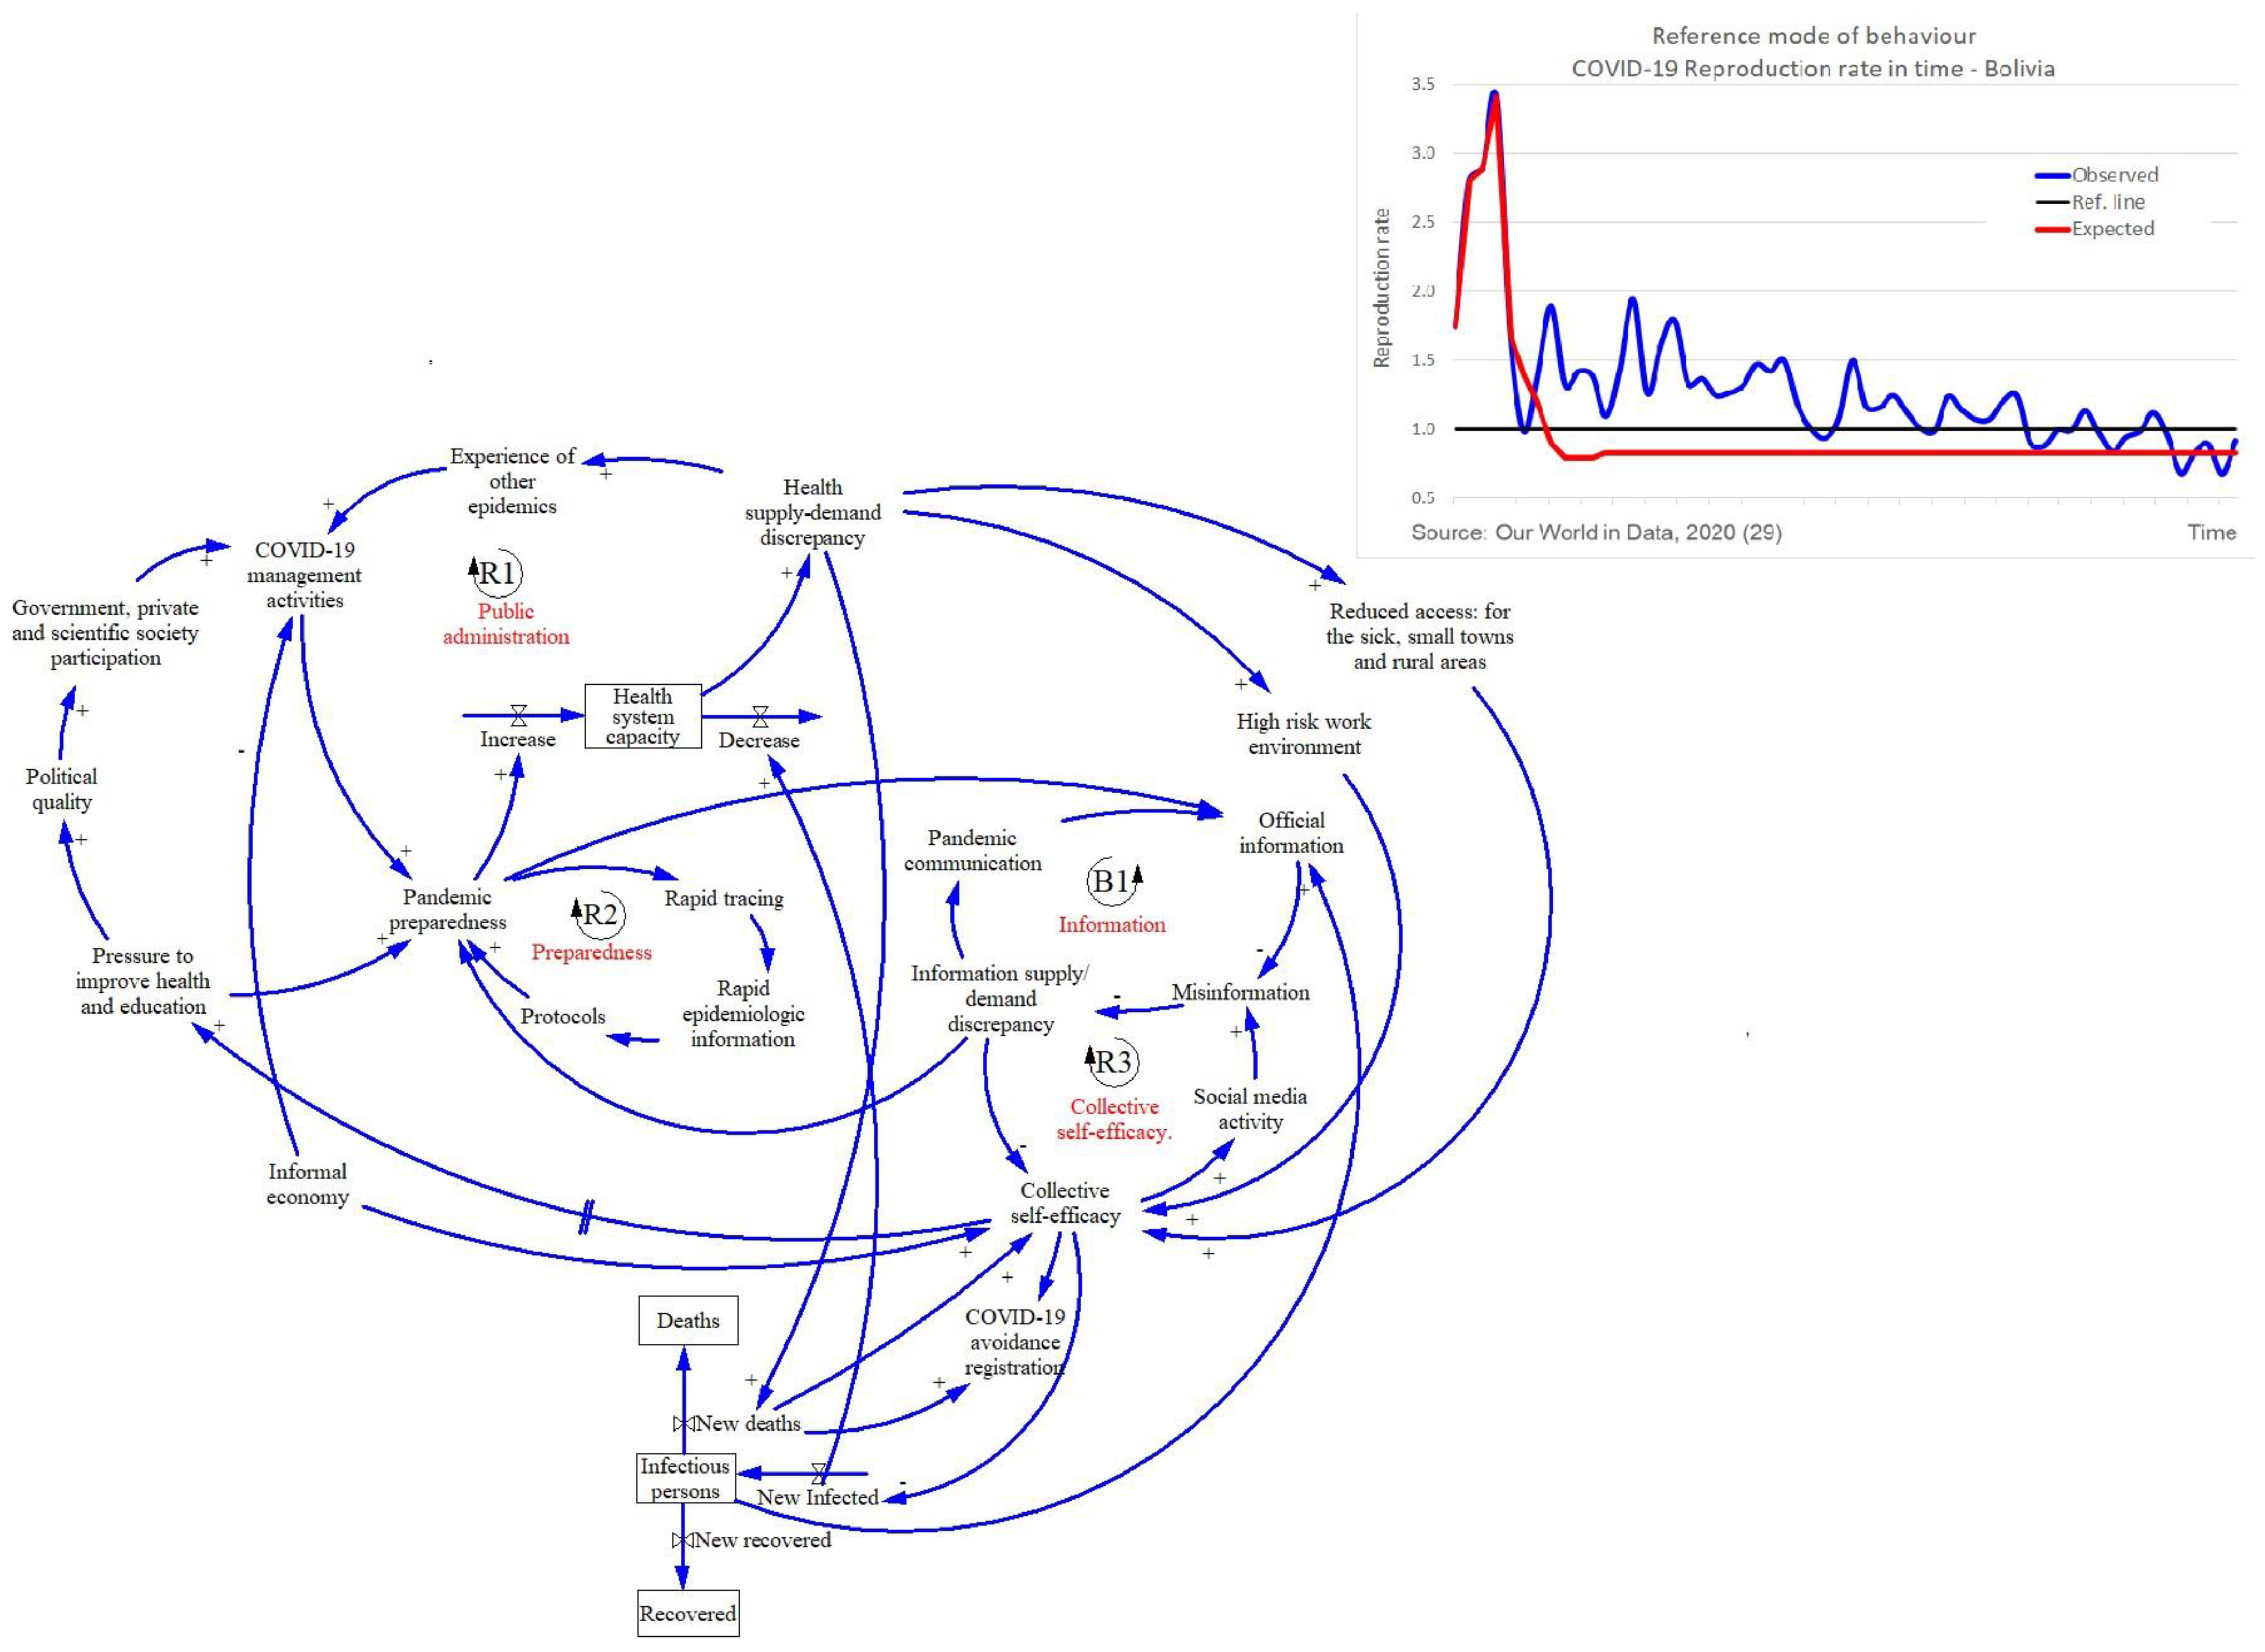
3.1.1. Bolivia
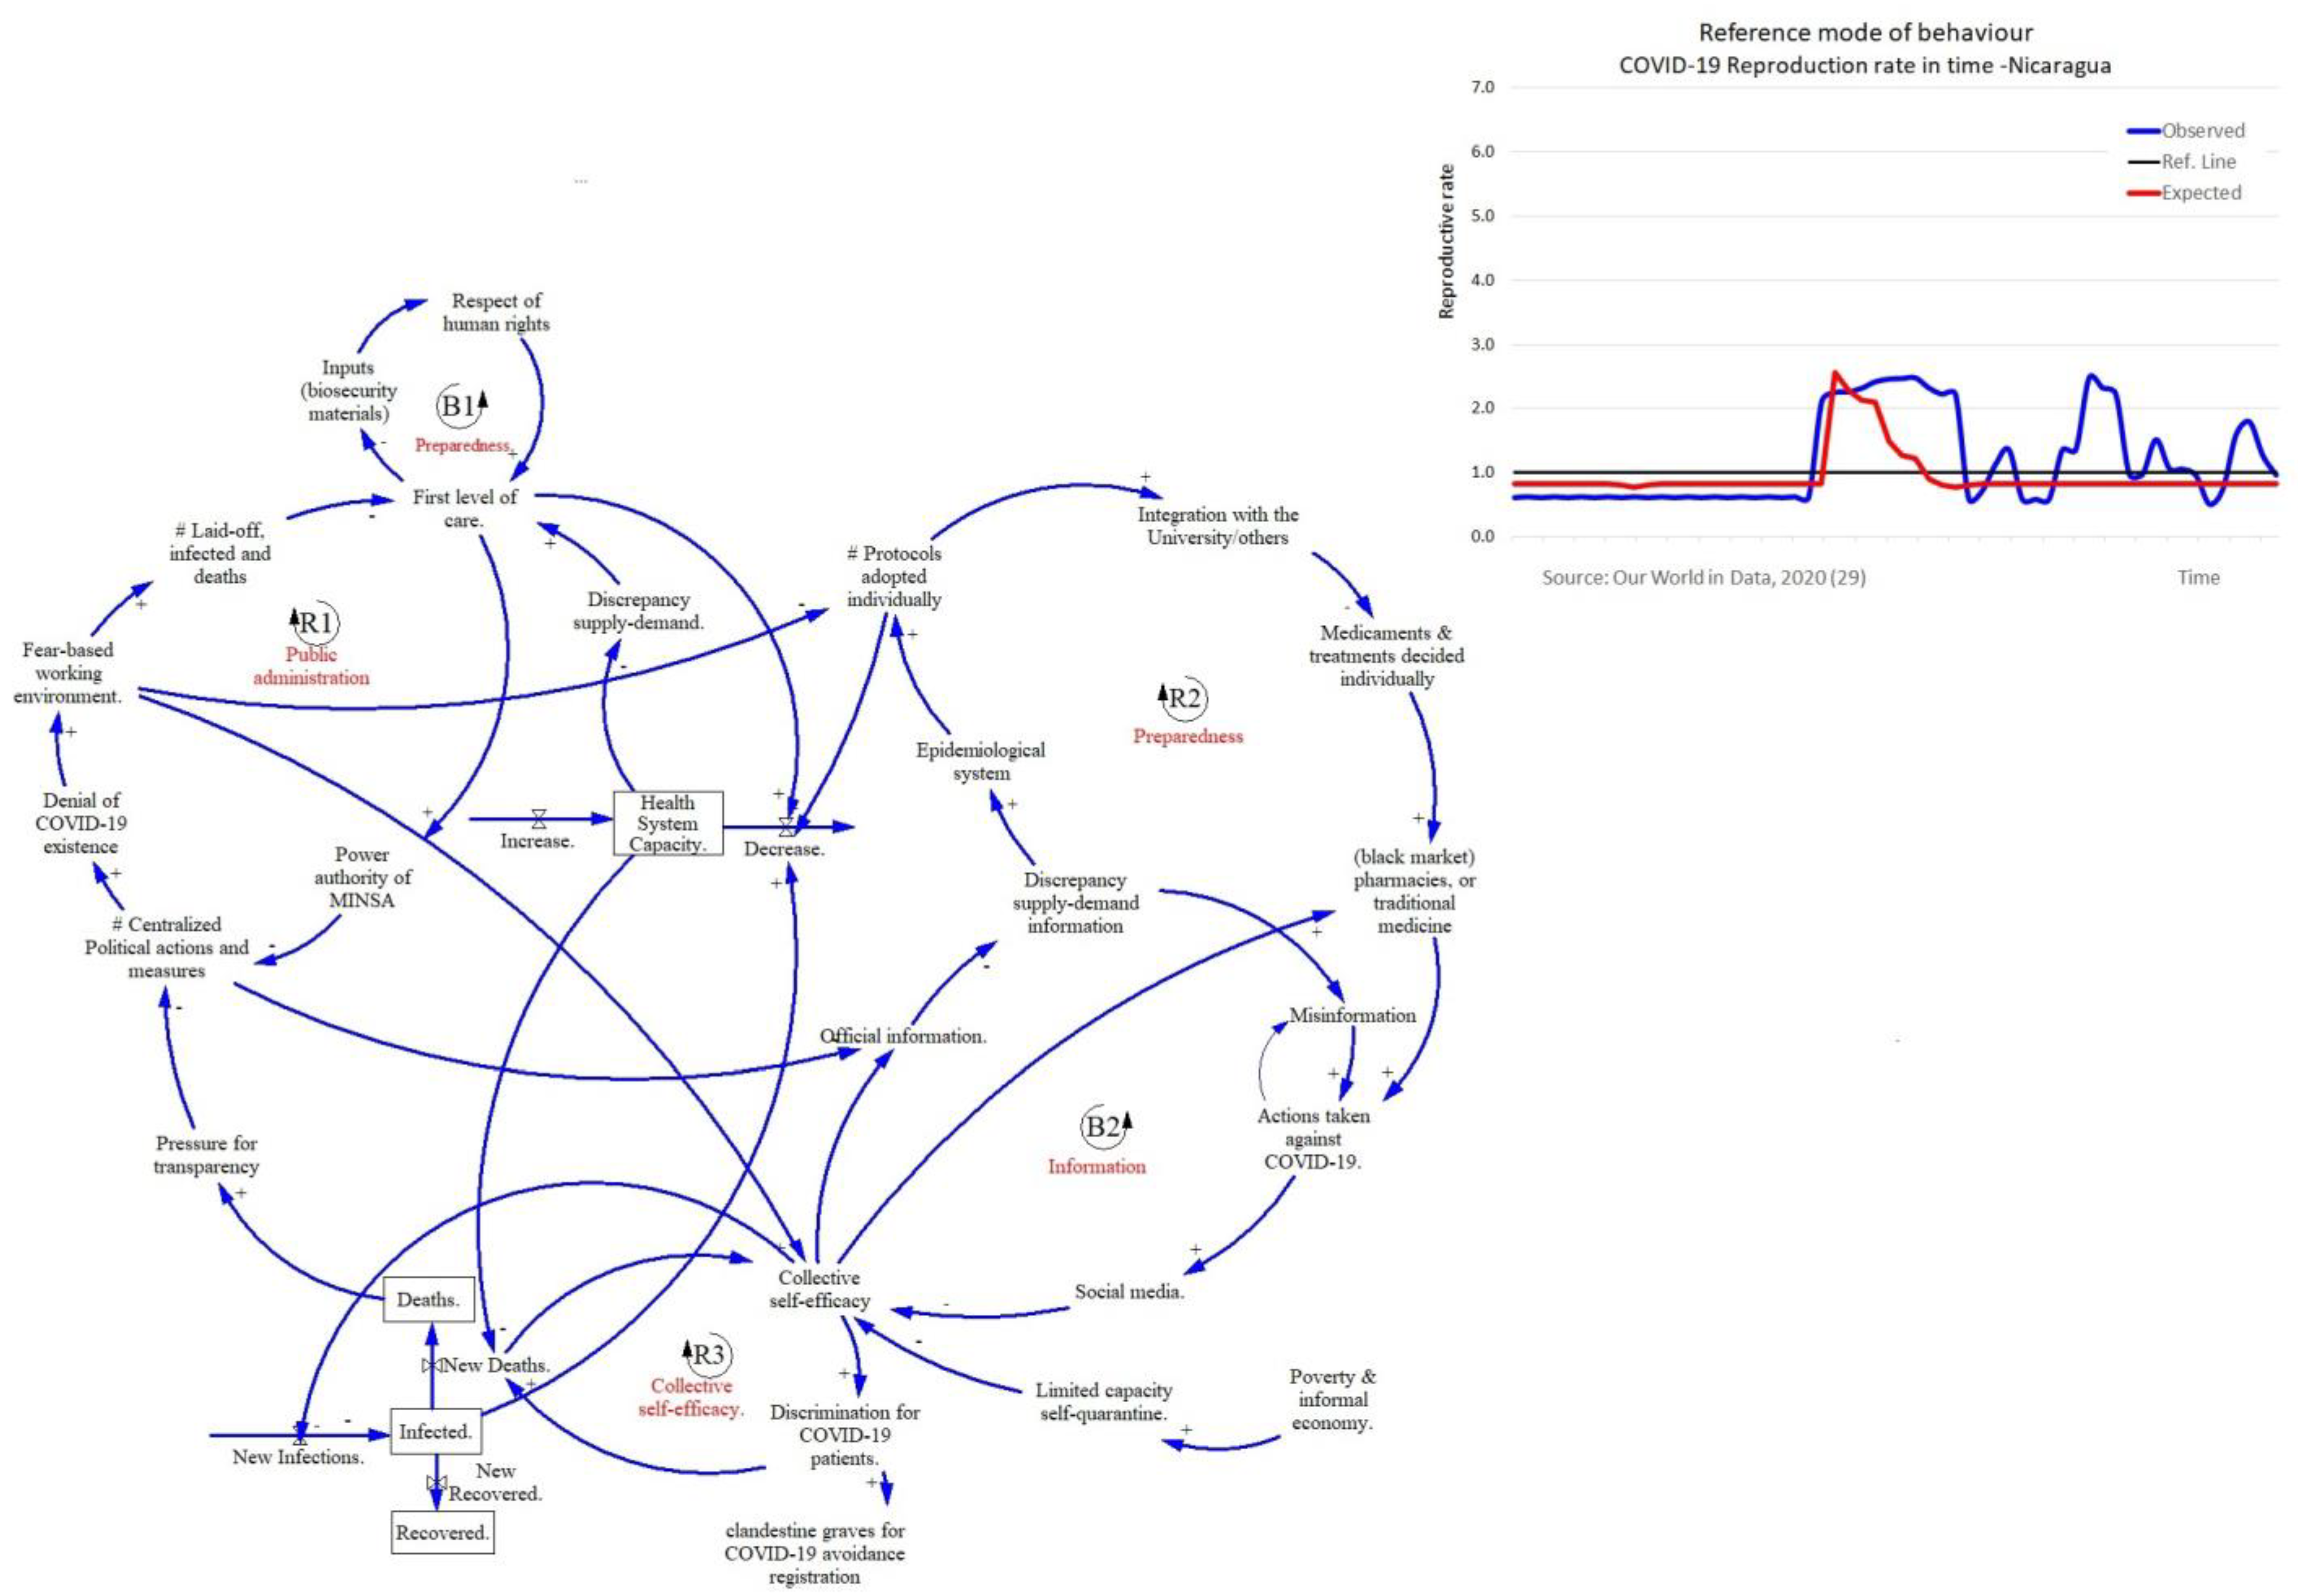
3.1.2. Nicaragua
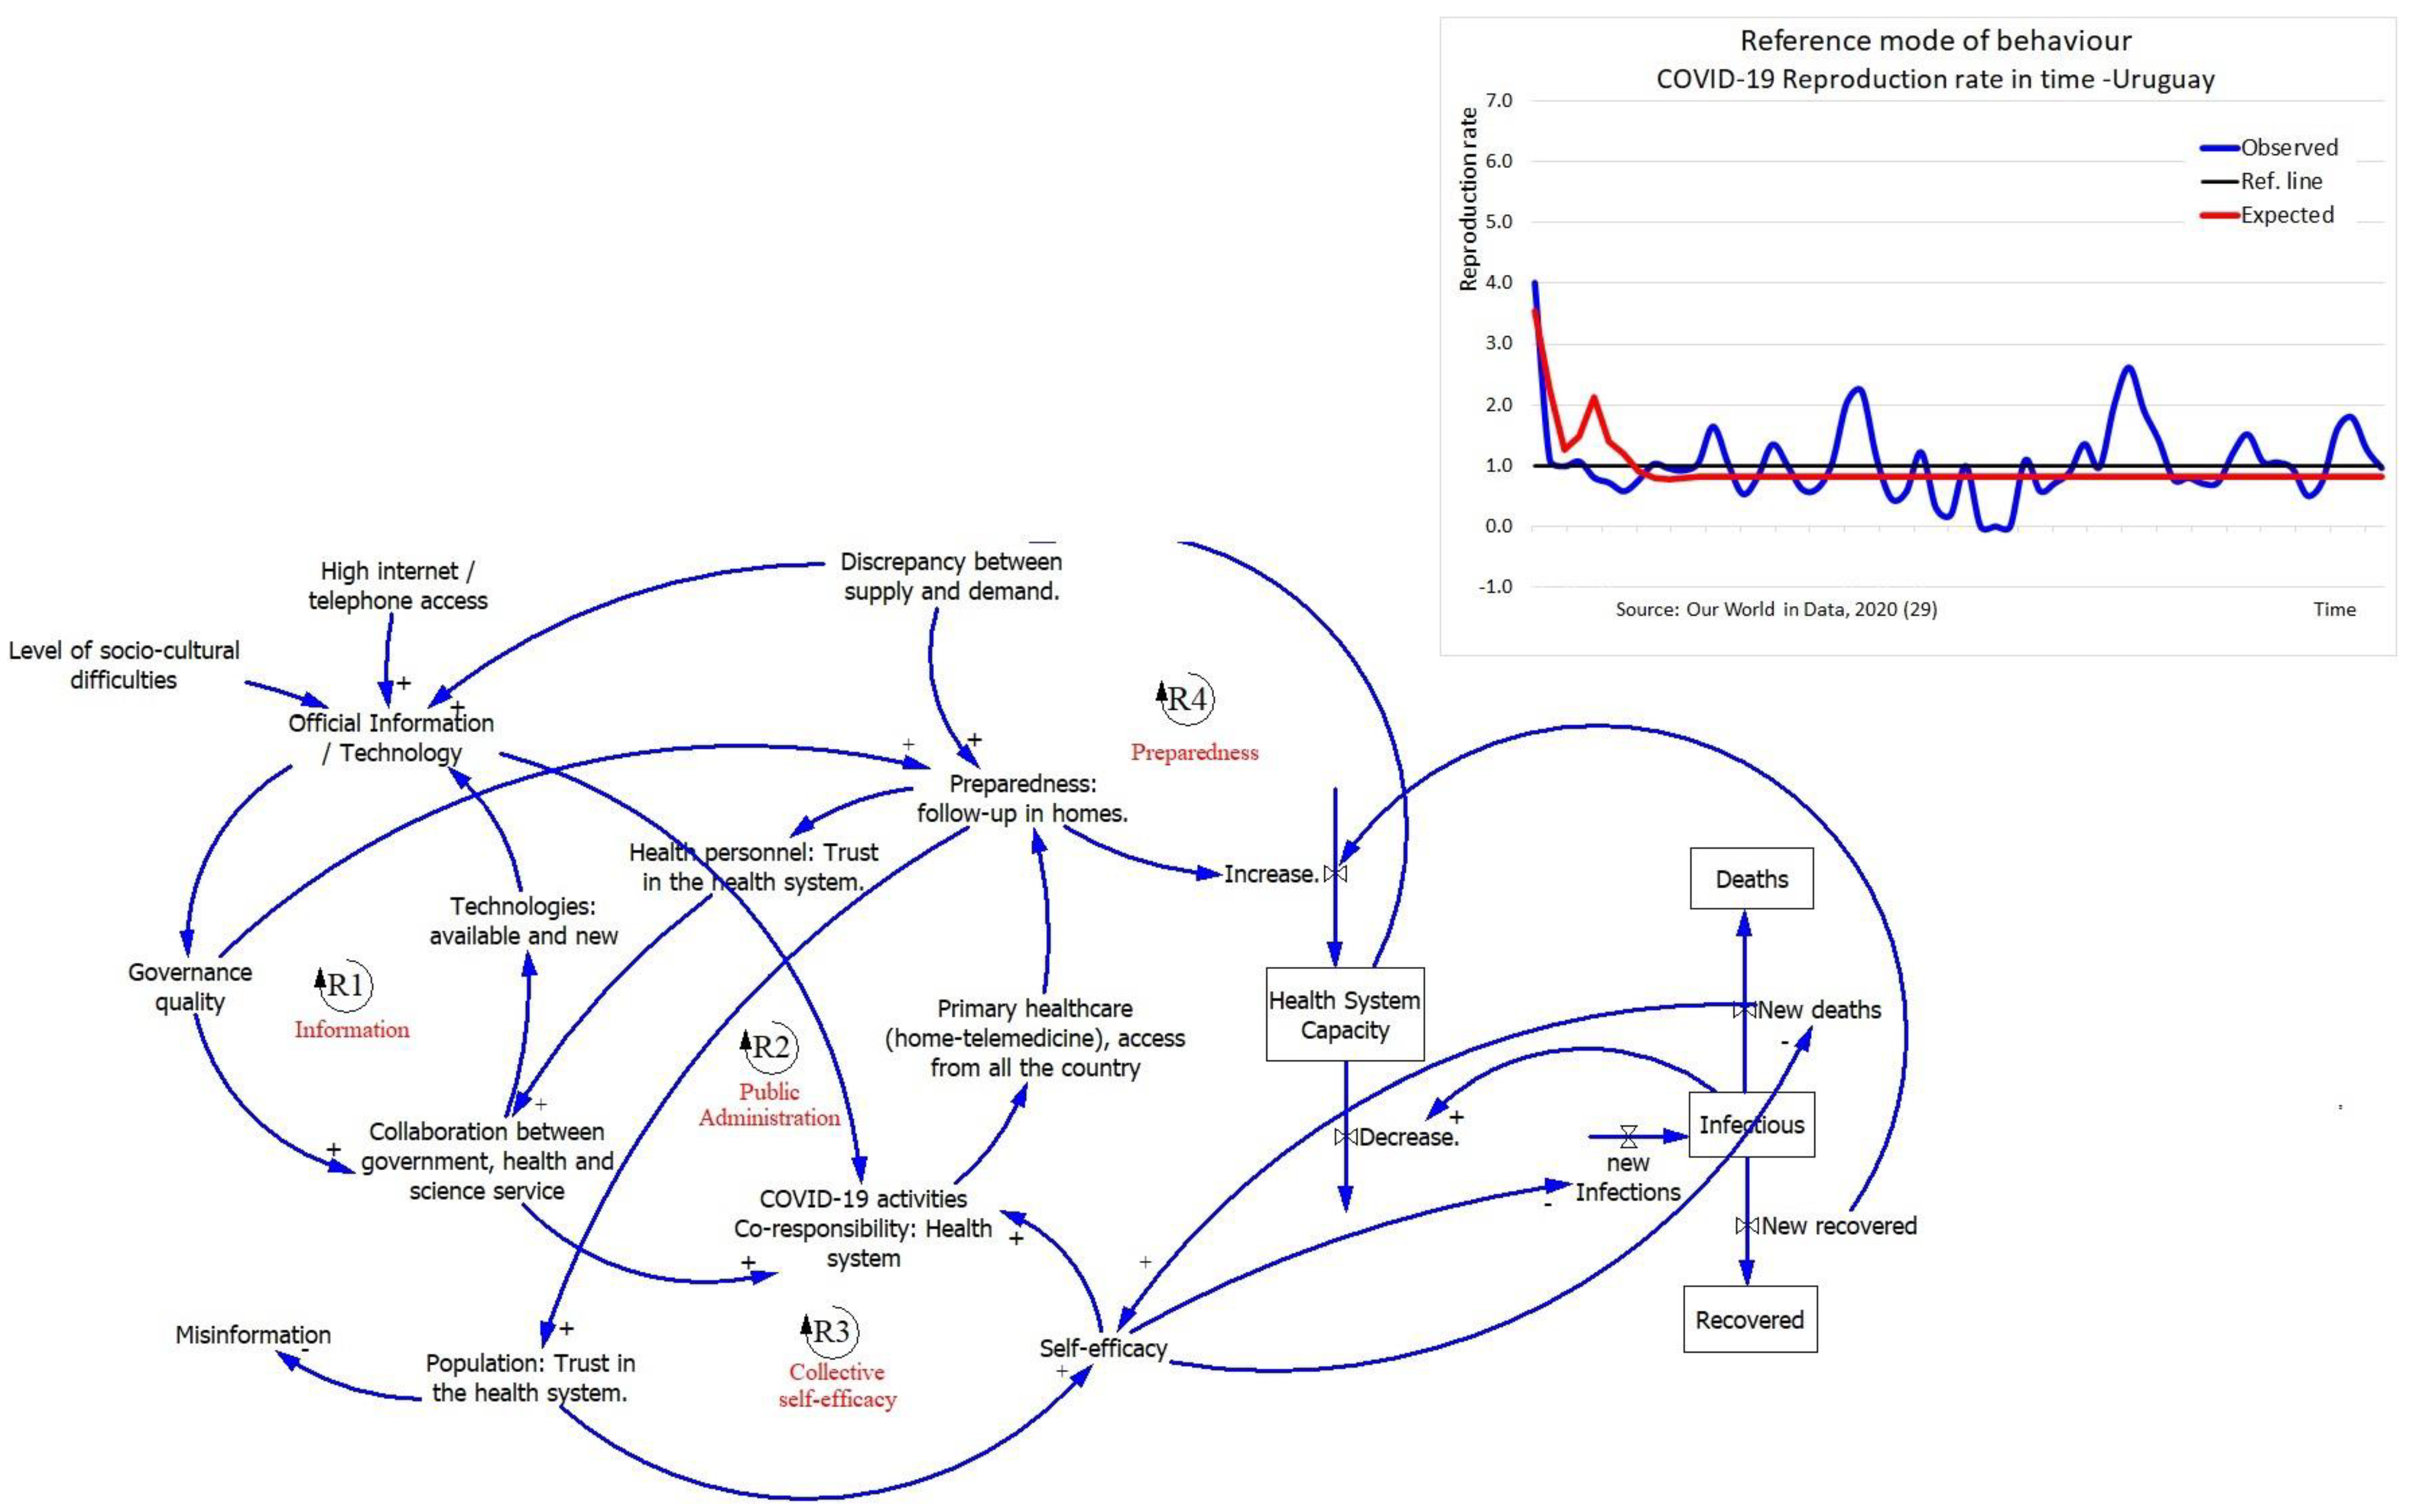
3.1.3. Uruguay
3.1.4. Main Outcomes
3.2. EFA: Comparative Analysis and Validation
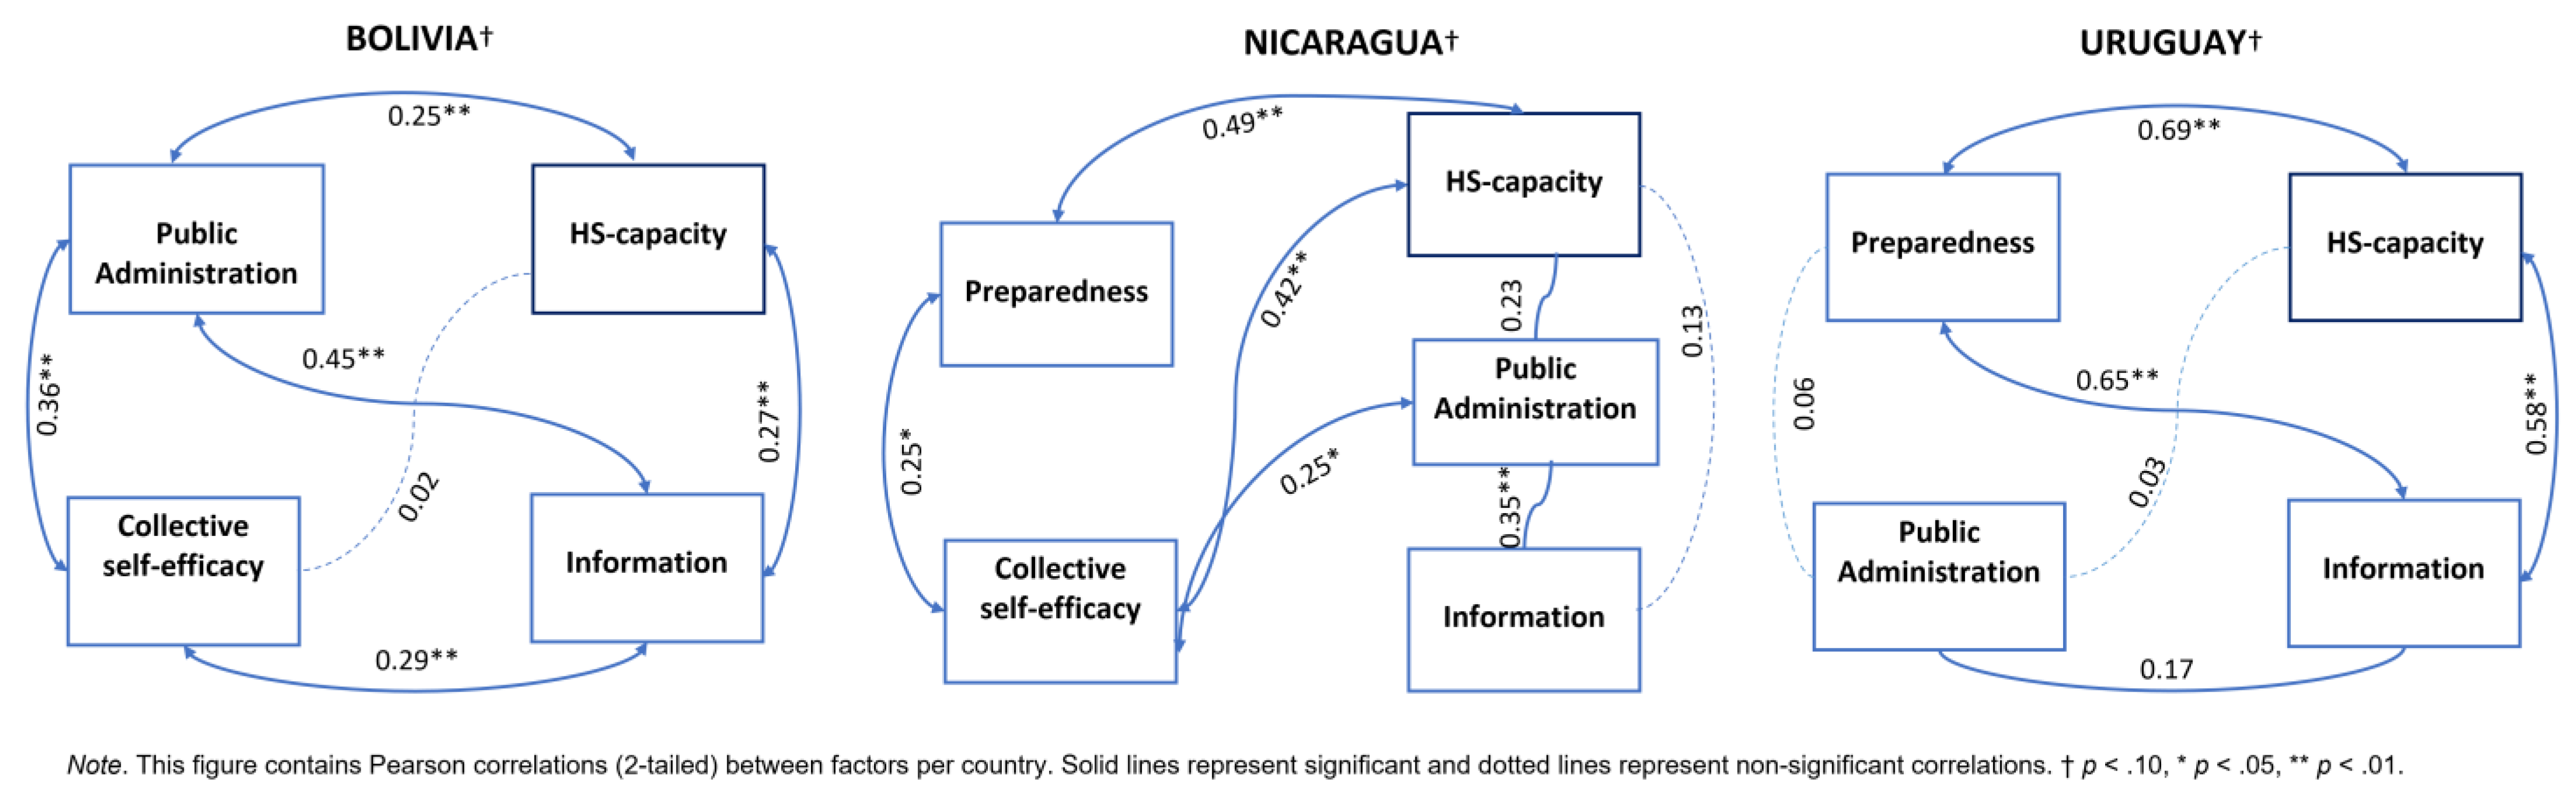
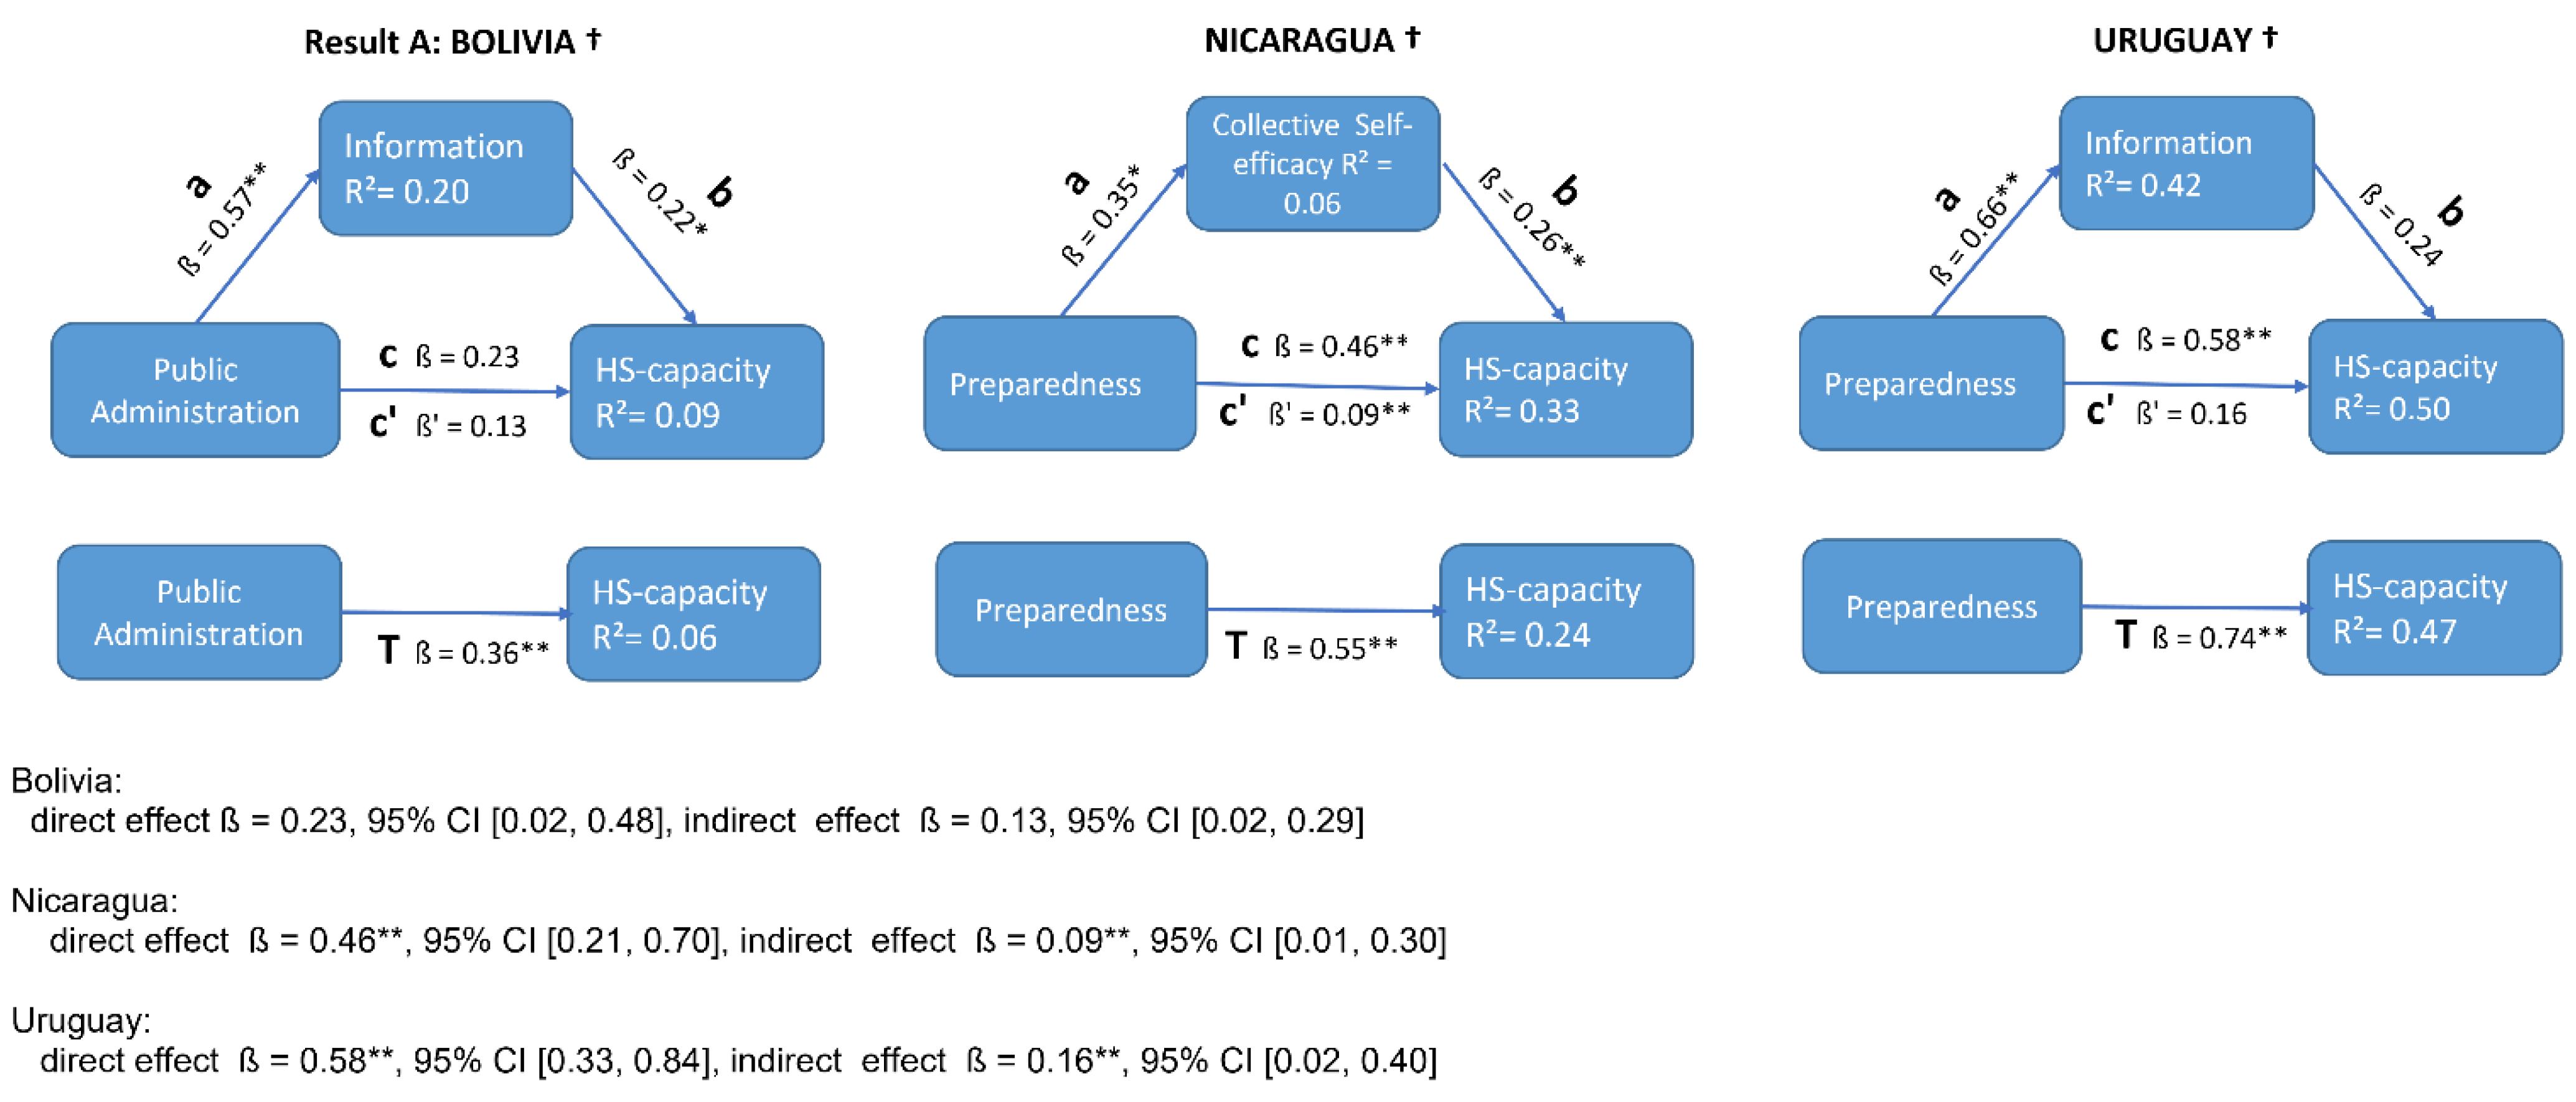
3.2.1. The Correlations among Factors
3.2.2. Mediating Effects
4. Discussion
5. Conclusions
Author Contributions
Funding
Institutional Review Board Statement
Informed Consent Statement
Data Availability Statement
Acknowledgments
Conflicts of Interest
Appendix A

| Indicator | Bolivia | Nicaragua | Uruguay | Latin America and Caribbean | Source |
|---|---|---|---|---|---|
| Income-classification | Lower middle income | Lower middle income | High income | - | World Bank (data.worldbank.org) |
| GDP, PPP (current international $)-2020 | 97,672,053 | 36,899,427 | 79,183,811 | 10,350,590 | World Bank (data.worldbank.org) |
| GDP per capita, PPP (current international $)-2020 | 8367 | 5570 | 22,795 | 15,868 | World Bank (data.worldbank.org) |
| Informal economy-2020 | 73% | 76% | 23% | 50% | International Labor organization |
| Total population | 11,513,101 | 6,545,502 | 3,461,731 | 652,276,325 | Populationpyramid.net |
| Urban population (% of total population)-2020 | 70 | 59 | 96 | 81 | World Bank (data.worldbank.org) |
| Total population density (people per Km2 of land area)-2018 | 10 | 54 | 20 | 32 | World Bank (data.worldbank.org) |
| Range of density in the major cities (habitants/ Km2) | 1810–4464 | 1186–4000 | 2194–6726 | - | Wikipedia |
| Domestic general government health expenditure (% of current health expenditure)-2018 | 71% | 60% | 73% | 51% | World Bank (data.worldbank.org) |
| Life expectancy at birth, total (years) | 72 | 74 | 78 | 76 | World Bank (data.worldbank.org) |
| Poverty headcount ratio at $1.90 a day (2011 PPP) (% of population)-2019 † | 3.2% | 3.4% | 0.1% | 3.7% | World Bank (data.worldbank.org) |
Appendix B
| Bolivia N = 7 | Nicaragua N = 7 | Uruguay N = 6 | |
|---|---|---|---|
| Place of work | |||
| Department of Health Services | 1 | --- | 2 |
| Public health facility | 3 | 6 | 4 |
| Health insurance facility | 3 | --- | --- |
| University | 2 | 1 | 1 |
| NGO-dedicated to health | --- | 1 | --- |
| Positions at work | |||
| Family doctor | 1 | ||
| Intensive care | 1 | ||
| Nurse | 1 | 1 | 1 |
| Medical doctor | 3 | 4 | 2 |
| University docent | 2 | 1 | 1 |
| HIV-unit coordinator at SEDES, Province level | 1 | ||
| Physiotherapeutic | 1 | ||
| Community building & researcher | 1 | ||
| Psychologist | 1 | ||
| Emergency doctor | 1 | ||
| Health coordinator at ASSE, national level | 2 | ||
| Advanced degree | |||
| health professional (doctor, nurse, psychologist) | 7 | 7 | 6 |
| Clinical medicine experience | |||
| minimum 10 years | yes | yes | yes |
| Experience in epidemiology | |||
| work in primary care, or knowledge | yes | yes | yes |
| Outbreak response experience | |||
| currently or in the past | yes | yes | yes |
| Health system capacity building experience | yes | yes | yes |
| Work experience in Latin American countries | yes | yes | yes |
Appendix C


Appendix D
| BOLIVIA | Mean | SD | NICARAGUA | Mean | SD | URUGUAY | Mean | SD |
|---|---|---|---|---|---|---|---|---|
| Construct and Item Description | Factors and Variable Description | Factors and Variable Description | ||||||
| Health system capacity | Health system capacity | Health system capacity | ||||||
| Non-Risky working environment | 4.00 | 1.34 | Non-threatened health personnel | 4.49 | 1.03 | Decongestion | 4.46 | 0.83 |
| Access to health care | 3.76 | 1.41 | Availability of COVID-19 training | 4.09 | 1.28 | Use of technology (HS) | 4.15 | 1.05 |
| Transparent statistics | 4.54 | 1.09 | Private and public collaboration | 4.46 | 0.89 | |||
| Continuous information | 4.32 | 1.09 | ||||||
| Average variance extracted (AVE) | 0.78 | Average variance extracted (AVE) | 0.52 | Average variance extracted (AVE) | 0.61 | |||
| Composite reliability (CR) | 0.87 | Composite reliability (CR) | 0.75 | Composite reliability (CR) | 0.76 | |||
| Public administration-Preparedness | Public administration | Public Administration-risk | ||||||
| Planning and coordination | 3.95 | 1.30 | Scientific collaboration | 4.14 | 1.27 | Non Self-medication | 2.17 | 1.34 |
| Preparedness | 4.03 | 1.25 | Availability COVID-19 data | 4.08 | 1.42 | Motivated personnel | 2.02 | 1.24 |
| Interinstitutional collaboration | 4.01 | 1.23 | Level of care | 3.98 | 1.42 | Missing border control | 2.63 | 1.31 |
| Pandemic pressure | 3.47 | 1.31 | Knowledge exchange and experience | 4.11 | 1.43 | |||
| Preparedness management | 4.09 | 1.24 | ||||||
| Comprehensive epidemiology | 4.19 | 1.09 | ||||||
| Protocols | 4.11 | 1.05 | ||||||
| Average variance extracted (AVE) | 0.81 | Average variance extracted (AVE) | 0.44 | |||||
| Composite reliability (CR) | 0.95 | Composite reliability (CR) | 0.70 | |||||
| Preparedness | Preparedness | |||||||
| Decentralized measures | 4.19 | 1.39 | Capacity increase | 4.28 | 0.86 | |||
| Usage of biosecurity material | 4.24 | 1.32 | Health personnel trust in the management | 4.28 | 0.84 | |||
| Social media to communicate | 4.49 | 0.90 | Home brigades | 4.48 | 0.75 | |||
| Non-politicized environment | 4.24 | 1.03 | Protocols by science | 4.38 | 0.68 | |||
| Interinstitutional collaboration | 4.25 | 0.98 | ||||||
| Trust of society | 4.22 | 0.89 | ||||||
| Trust of health personnel | 4.39 | 0.86 | ||||||
| Average variance extracted (AVE) | 0.51 | Average variance extracted (AVE) | 0.34 | Average variance extracted (AVE) | 0.56 | |||
| Composite reliability (CR) | 0.87 | Composite reliability (CR) | 0.66 | Composite reliability (CR) | 0.90 | |||
| Information | Information | Information | ||||||
| Rapid case tracing | 3.84 | 1.35 | Health system informing about for treatments | 4.22 | 0.94 | Society trust in the management | 4.40 | 0.90 |
| Information | 3.88 | 1.29 | Health system informing about for medicaments | 3.83 | 1.33 | Home brigades | 4.31 | 1.00 |
| Official information by the government | 4.19 | 1.22 | Strengthening of first level | 4.55 | 0.71 | |||
| Comprehensive epidemiology | 4.45 | 0.73 | ||||||
| Information for demand planning | 4.31 | 0.85 | ||||||
| Average variance extracted (AVE) | 0.34 | Average variance extracted (AVE) | 0.54 | Average variance extracted (AVE) | 0.55 | |||
| Composite reliability (CR) | 0.50 | Composite reliability (CR) | 0.77 | Composite reliability (CR) | 0.85 | |||
| Collective Self-efficacy | Collective Self-efficacy | not applicable | ||||||
| Knowledge on deaths and cases | 3.40 | 1.28 | Availability of biosecurity material | 4.13 | 1.20 | |||
| Knowledge on hospital space | 3.16 | 1.37 | Transparent epidemiological data | 4.19 | 1.28 | |||
| Difficulty to stay at home (informal economy) | 3.41 | 1.33 | ||||||
| Self-diagnosis and medication | 3.70 | 1.37 | ||||||
| Informal economy as a limitation | 3.57 | 1.26 | ||||||
| Average variance extracted (AVE) | 0.39 | Average variance extracted (AVE) | 0.75 | |||||
| Composite reliability (CR) | 0.75 | Composite reliability (CR) | 0.86 |
References
- World Health Organization. WHO Coronavirus Disease (COVID-19) Outbreak Situation. 2020, p. 1. Available online: https://covid19.who.int/?gclid=Cj0KCQjwz4z3BRCgARIsAES_OVchE9wLPh28-Ai2xGa7ZjpX0bjoGXVeDJGykEcAdxlGEU-abpkzRdoaAqiYEALw_wcB (accessed on 20 June 2020).
- Ogbu, U.C.; Arah, O.A. World Health Organization. In International Encyclopedia of Public Health; WHO: Geneva, Switzerland, 2016; pp. 461–467. Available online: http://www.who.int/emc (accessed on 20 June 2020).
- Pandemic Emergency Response to the Coronavirus, COVID-19|InterAction Council. Available online: https://www.interactioncouncil.org/publications/pandemic-emergency-response-coronavirus-covid-19 (accessed on 20 June 2020).
- Sharov, K.S. Creating and applying SIR modified compartmental model for calculation of COVID-19 lockdown efficiency. In Chaos, Solitons and Fractals; Elsevier: Amsterdam, The Netherlands, 2020; Volume 141, p. 110295. [Google Scholar]
- Singh, A.; Bajpai, M.K.; Gupta, S.L. A Time-dependent mathematical model for COVID-19 transmission dynamics and analysis of critical and hospitalized cases with bed requirements. MedRxiv 2020. [Google Scholar] [CrossRef]
- Oppenheim, B.; Gallivan, M.; Madhav, N.K.; Brown, N.; Serhiyenko, V.; Wolfe, N.D.; Ayscue, P. Assessing global preparedness for the next pandemic: Development and application of an Epidemic Preparedness Index. BMJ Glob. Health. 2019, 4, 1157. [Google Scholar] [CrossRef] [PubMed] [Green Version]
- Haug, N.; Geyrhofer, L.; Londei, A.; Dervic, E.; Desvars-Larrive, A.; Loreto, V.; Pinior, B.; Thurner, S.; Klimek, P. Ranking the effectiveness of worldwide COVID-19 government interventions. Nat. Hum. Behav. 2020, 4, 1303–1312. [Google Scholar] [CrossRef] [PubMed]
- Development Aid. How the World Bank Is Helping Countries with COVID-19; The World Bank Group: Washington, DC, USA, 2020; Volume 19, pp. 1–2. [Google Scholar]
- The Lancet. COVID-19 in Latin America: A Humanitarian Crisis; Lancet Publishing Group: New York, NY, USA, 2020; Volume 396. [Google Scholar]
- Taylor, L. COVID-19 misinformation sparks threats and violence against doctors in Latin America. BMJ 2020, 370, m3088. [Google Scholar] [CrossRef] [PubMed]
- Williams, C.C.; Horodnic, I.A. Evaluating working conditions in the informal economy: Evidence from the 2015 European Working Conditions Survey. Int. Sociol. 2019, 34, 281–306. [Google Scholar] [CrossRef]
- International Labour Organization. Informal Employment (% of Total Non-Agricultural Employment)—Bolivia. ILOSTAT Database. 2019. Available online: https://data.worldbank.org/indicator/SL.ISV.IFRM.ZS?locations=BO (accessed on 20 June 2020).
- Abramo, L.; Cecchini, S.; Ullmann, H. Addressing health inequalities in latin america: The role of social protection. Cienc. Saude Coletiva. 2020, 25, 1587–1598. [Google Scholar] [CrossRef]
- Benítez, M.A.; Velasco, C.; Sequeira, A.R.; Henríquez, J.; Menezes, F.M.; Paolucci, F. Responses to COVID-19 in five Latin American countries. Health Policy Technol. 2020, 9, 525–559. [Google Scholar] [CrossRef] [PubMed]
- WHO. WHO Coronavirus Disease; WHO: Geneva, Switzerland, 2021; p. 1. Available online: https://covid19.who.int/table (accessed on 16 May 2021).
- Scott, R.J.; Cavana, R.Y.; Cameron, D. Mechanisms for Understanding Mental Model Change in Group Model Building. Syst. Res. Behav. Sci. 2016, 33, 100–118. [Google Scholar] [CrossRef]
- Scott, R.J.; Cavana, R.Y.; Cameron, D. Recent evidence on the effectiveness of group model building. Eur. J. Oper. Research 2016, 249, 908–918. [Google Scholar] [CrossRef] [Green Version]
- Rouwette, E.A.J.A.; Vennix, J.A.M.; Felling, A.J.A. On evaluating the performance of problem structuring methods: An attempt at formulating a conceptual model. Group Decis. Negot. 2009, 18, 567–587. [Google Scholar] [CrossRef] [Green Version]
- Cronin, M.A.; Bezrukova, K. Conflict management through the lens of system dynamics. Acad. Manag. Ann. 2019, 13, 770–806. [Google Scholar] [CrossRef]
- The World Bank. World Bank Country and Lending Groups—World Bank Data Help Desk. The World Bank. 2020, pp. 1–8. Available online: https://datahelpdesk.worldbank.org/knowledgebase/articles/906519-world-bank-country-and-lending-groups (accessed on 1 December 2020).
- Franco, L.A.; Rouwette, A. Messy Problems—Reader. 2015. Available online: https://brightspace.ru.nl/d2l/le/content/261358/Home (accessed on 20 September 2021).
- Baugh Littlejohns, L.; Baum, F.; Lawless, A.; Freeman, T. The value of a causal loop diagram in exploring the complex interplay of factors that influence health promotion in a multisectoral health system in Australia. Health Res. Policy Syst. 2018, 16, 126. [Google Scholar] [CrossRef] [PubMed]
- Gerritsen, S.; Harré, S.; Rees, D.; Renker-Darby, A.; Bartos, A.E.; Waterlander, W.E.; Swinburn, B. Community group model building as a method for engaging participants and mobilising action in public health. Int. J. Environ. Res. Public Health 2020, 17, 3457. [Google Scholar] [CrossRef] [PubMed]
- Duboz, R.; Echaubard, P.; Promburom, P.; Kilvington, M.; Ross, H.; Allen, W.; Ward, J.; Deffuant, G.; de Garine-Wichatitsky, M.; Binot, A. Systems thinking in practice: Participatory modeling as a foundation for Integrated Approaches to Health. Front. Vet. Sci. 2018, 5, 303. [Google Scholar] [CrossRef] [PubMed]
- Rouwette, E.; Bleijenbergh, I.; Vennix, J. Group Model-Building to Support Public Policy: Addressing a Conflicted Situation in a Problem Neighbourhood. Syst. Res. Behav. Sci. 2016, 33, 64–78. [Google Scholar] [CrossRef]
- Mui, Y.; Ballard, E.; Lopatin, E.; Thornton, R.L.J.; Pollack Porter, K.M.; Gittelsohn, J. A community-based system dynamics approach suggests solutions for improving healthy food access in a low-income urban environment. PLoS ONE 2019, 14, e0216985. [Google Scholar] [CrossRef]
- Leung, L. Validity; reliability, and generalizability in qualitative research. J. Fam. Med. Prim. Care 2015, 4, 324–327. [Google Scholar] [CrossRef]
- Palinkas, L.A.; Horwitz, S.M.; Green, C.A.; Wisdom, J.P.; Duan, N.; Hoagwood, K. Purposeful Sampling for Qualitative Data Collection and Analysis in Mixed Method Implementation Research. Adm. Policy Ment. Health Ment. Health Serv. Res. 2015, 42, 533–544. [Google Scholar] [CrossRef] [Green Version]
- Wilkerson, B.; Aguiar, A.; Gkini, C.; Oliveira, I.C.d.; Trellevik, L.-K.L.; Kopainsky, B. Reflections on adapting group model building scripts into online workshops. Syst. Dyn. Rev. 2020, 36, 358–372. [Google Scholar] [CrossRef]
- Roser, M.; Ritchie, H.; Ortiz-Ospina, E. Case Fatality Rate of the Ongoing COVID-19 Pandemic. Our World in Data. 2020. Available online: https://ourworldindata.org/grapher/coronavirus-cfr (accessed on 6 August 2021).
- Vogl, S.; Schmidt, E.M.; Zartler, U. Triangulating perspectives: Ontology and epistemology in the analysis of qualitative multiple perspective interviews. Int. J. Soc. Res. Methodol. 2019, 22, 611–624. [Google Scholar] [CrossRef] [Green Version]
- Shalizi, C. The bootstrap. Am. Sci. 2010, 98, 186–190. [Google Scholar] [CrossRef]
- Van de Schoot, R. Small Sample Size Solutions; Taylor & Francis Group: London, UK, 2020. [Google Scholar]
- Fávero, L.P.; Belfiore, P. Manual de Análise de Dados: Estatística e Modelagem Multivariada; Elsevier: Rio de Janeiro, Brazil, 2017. [Google Scholar]
- Ansell, C.; Sørensen, E.; Torfing, J. The COVID-19 pandemic as a game changer for public administration and leadership? The need for robust governance responses to turbulent problems. Public Manag. Rev. 2020. [Google Scholar] [CrossRef]
- World Health Organization. Health Emergency and Disaster Risk Management Framework. Health Emergency and Disaster Risk Management Fact Sheets. Available online: https://www.who.int/hac/techguidance/preparedness/health-emergency-and-disaster-risk-management-framework-eng.pdf?ua=1 (accessed on 5 January 2021).
- Bandura, A. Self-efficacy mechanism in human agency. Am. Psychol. 1982, 37, 122–147. [Google Scholar] [CrossRef]
- Mills, M.C.; Rahal, C.; Brazel, D.; Yan, J.; Gieysztor, S. COVID-19 vaccine deployment: Behaviour, ethics, misinformation and policy strategies. Br. Acad. 2020, 1–35. Available online: https://royalsociety.org/-/media/policy/projects/set-c/set-c-vaccine-deployment.pdf (accessed on 20 December 2020).
- Weissman, G.E.; Crane-Droesch, A.; Chivers, C.; Luong, T.B.; Hanish, A.; Levy, M.Z.; Lubken, J.; Becker, M.; Draugelis, M.E.; Anesi, G.L.; et al. Locally Informed Simulation to Predict Hospital Capacity Needs During the COVID-19 Pandemic. Ann. Intern. Med. 2020, 173, 21–28. [Google Scholar] [CrossRef] [Green Version]
- Moon, M.J. Fighting COVID-19 with Agility, Transparency, and Participation: Wicked Policy Problems and New Governance Challenges. Public Adm. Rev. 2020, 80, 651–656. [Google Scholar] [CrossRef]
- Mazzucato, M.; Kattel, R. COVID-19 and public-sector capacity. Oxf. Rev. Econ. Policy 2020, 36, S256–S269. [Google Scholar] [CrossRef]
- Hale, T.; Angrist, N.; Goldszmidt, R.; Kira, B.; Petherick, A.; Phillips, T.; Webster, S.; Cameron-Blake, E.; Hallas, L.; Majumdar, S.; et al. A global panel database of pandemic policies (Oxford COVID-19 Government Response Tracker). Nat. Hum. Behav. 2021, 5, 529–538. [Google Scholar] [CrossRef]
- Khan, J.R.; Awan, N.; Islam, M.M.; Muurlink, O. Healthcare Capacity, Health Expenditure, and Civil Society as Predictors of COVID-19 Case Fatalities: A Global Analysis. Front. Public Health 2020, 8, 347. [Google Scholar] [CrossRef]
- Alon, T.; Kim, M.; Lagakos, D.; VanVuren, M. How Should Policy Responses to the COVID-19 Pandemic Differ in the Developing World? NBER Work. Paper 2020. [Google Scholar] [CrossRef]
- Burgos, C. Saturación en Laboratorios: En Redes Ofrecen Pruebas Para Detectar COVID-19 Pese a ser Ilegales. Los Tiempos. Available online: https://www.lostiempos.com/actualidad/pais/20200615/saturacion-laboratorios-redes-ofrecen-pruebas-detectar-covid-19-pese-ser (accessed on 15 June 2020).
- Galhardi, C.P.; Freire, N.P.; de Souza Minayo, M.C.; Fagundes, M.C.M. Fact or fake? An analysis of disinformation regarding the COVID-19 pandemic in Brazil. Cienc. Saude Coletiva 2020, 25, 4201–4210. [Google Scholar] [CrossRef] [PubMed]
- Chatterjee, P.; Tesis, A.; Cymberknop, L.J.; Armentano, R.L. Internet of Things and Artificial Intelligence in Healthcare During COVID-19 Pandemic—A South American Perspective. Front. Public Health 2020, 600213. [Google Scholar] [CrossRef]
- Cinelli, M.; Quattrociocchi, W.; Galeazzi, A.; Valensise, C.M.; Brugnoli, E.; Schmidt, A.L.; Zola, P.; Zollo, F.; Scala, A. The COVID-19 social media infodemic. Sci. Rep. 2020, 10, 16598. [Google Scholar] [CrossRef] [PubMed]
- Buben, R.; Kouba, K. The Causes of Disease Impact Denialism in Nicaragua’s Response to COVID-19. Bull. Lat. Am. Research 2020, 39, 103–107. [Google Scholar] [CrossRef]
- Mehrolia, S.; Alagarsamy, S.; Jeevananda, S. Assessing perceptions of COVID-19 self-protective measures: A structural equation modeling (SEM) approach. J. Health Res. 2021, 35, 307–317. [Google Scholar] [CrossRef]
- Field, A. Discovering Statistics Using SPSS; SAGE Publications: Thousand Oaks, CA, USA, 2009; Volume 58, p. 303. [Google Scholar]
- Fornell, C.; Larcker, D.F. Evaluating Structural Equation Models with Unobservable Variables and Measurement Error. J. Mark. Res. 1981, 18, 39. [Google Scholar] [CrossRef]


| Systemic Feedback Mechanisms | Main Factors | Description of the Factor |
|---|---|---|
| Health system capacity | Public administration | Refers to resources and the capacity to collaborate between the State, the civil society, and the market (scientific community, universities, private and public health system) to stop the spread of COVID-19 while addressing the economic needs of the country [14,35] |
| Preparedness | According to the World Health Organization (2019), preparedness refers to a framework to manage multisectoral disaster risk management, and all-hazards emergency preparation and response, including for epidemics, health systems strengthening and community-centered primary health care [36]. In our view, it refers to a set of actions which are aimed to decrease pandemic outcomes, such as protocols, biosecurity measures, rapid tracing, use of epidemiologic information and communication. | |
| Collective efficacy | Self-efficacy means the responsibility of an individual to behave careful or be effective in a pandemic. By collective efficacy we refer to a group’s shared perception that together they can stay healthy during the COVID-19 [37], it supports actions that could help avoid being infected by COVID-19. | |
| Information & Misinformation | The official information refers to messages by the government or formal sources to support the management of the pandemic (timely and sufficiently detailed). Misinformation fills the lack of detailed information or knowledge that according to the Mills, et al. (2020) this is done through: (1) distrust of science or selective use of expert authority; (2) distrust in pharmaceutical companies and government; (3) straightforward explanations; (4) use of emotion; and, (5) information bubbles [38] |
| Description | Health System Capacity | Public Administration | Preparedness | Information | Collective Self-Efficacy |
|---|---|---|---|---|---|
| Literature supporting the direct relation to health system capacity | [4,5,9,39] | [9,14,35,40,41,42,43,44] | [6,7,35,45] | [38,39,46,47,48] | [14,41,49,50] |
| BOLIVIA | |||||
| Cronbach’s alpha for the whole survey | 0.82 | ||||
| Kaiser-Meyer-Olkin | 0.76, p < 001 | ||||
| Cronbach’s alpha for every construct | 0.87 | 0.87 | 0.67 | 0.74 | |
| Factor Loadings | 0.87–0.89 | 0.46–0.84 | not applicable | 0.43–0.70 | 0.39–0.81 |
| NICARAGUA | |||||
| Cronbach’s alpha for the whole survey | 0.84 | ||||
| Kaiser-Meyer-Olkin | 0.68, p < 001 | ||||
| Cronbach’s alpha for every construct | 0.78 | 0.96 | 0.68 | 0.78 | 0.89 |
| Factor Loadings | 0.86–0.93 | 0.49–0.85 | 0.43–0.75 | 0.56–0.82 | 0.84–0.90 |
| URUGUAY | |||||
| Cronbach’s alpha for the whole survey | 0.95 | ||||
| Kaiser-Meyer-Olkin | 0.76, p < 001 | ||||
| Cronbach’s alpha for every construct | 0.82 | 0.69 | 0.95 | 0.92 | |
| Factor Loadings | 0.45–0.69 | 0.52–0.77 | 0.62–0.90 | 0.53–0.86 | not applicable |
Publisher’s Note: MDPI stays neutral with regard to jurisdictional claims in published maps and institutional affiliations. |
© 2021 by the authors. Licensee MDPI, Basel, Switzerland. This article is an open access article distributed under the terms and conditions of the Creative Commons Attribution (CC BY) license (https://creativecommons.org/licenses/by/4.0/).
Share and Cite
Cordova-Pozo, K.L.; Korzilius, H.P.L.M.; Rouwette, E.A.J.A.; Píriz, G.; Herrera-Gutierrez, R.; Cordova-Pozo, G.; Orozco, M. Using Systems Dynamics for Capturing the Multicausality of Factors Affecting Health System Capacity in Latin America while Responding to the COVID-19 Pandemic. Int. J. Environ. Res. Public Health 2021, 18, 10002. https://doi.org/10.3390/ijerph181910002
Cordova-Pozo KL, Korzilius HPLM, Rouwette EAJA, Píriz G, Herrera-Gutierrez R, Cordova-Pozo G, Orozco M. Using Systems Dynamics for Capturing the Multicausality of Factors Affecting Health System Capacity in Latin America while Responding to the COVID-19 Pandemic. International Journal of Environmental Research and Public Health. 2021; 18(19):10002. https://doi.org/10.3390/ijerph181910002
Chicago/Turabian StyleCordova-Pozo, Kathya Lorena, Hubert P. L. M. Korzilius, Etiënne A. J. A. Rouwette, Gabriela Píriz, Rolando Herrera-Gutierrez, Graciela Cordova-Pozo, and Miguel Orozco. 2021. "Using Systems Dynamics for Capturing the Multicausality of Factors Affecting Health System Capacity in Latin America while Responding to the COVID-19 Pandemic" International Journal of Environmental Research and Public Health 18, no. 19: 10002. https://doi.org/10.3390/ijerph181910002