Article

Assessing Emotional Responses to the Spatial Quality of Urban Green Spaces through Self-Report and Face Recognition Measures

1
Institute of Landscape Architecture, College of Agriculture and Biotechnology, Zhejiang University, Hangzhou 310058, China
2
Institute of Urban and Rural Planning Theories and Technologies, College of Civil Engineering and Architecture, Zhejiang University, Hangzhou 310058, China
3
The Architectural Design & Research Institute of Zhejiang University Co, Ltd., Hangzhou 310030, China
*
Author to whom correspondence should be addressed.
Int. J. Environ. Res. Public Health 2021, 18(16), 8526; https://doi.org/10.3390/ijerph18168526
Submission received: 7 July 2021 / Revised: 5 August 2021 / Accepted: 7 August 2021 / Published: 12 August 2021

Abstract

:
Although creating a high-quality urban green space (UGS) is of considerable importance in public health, few studies have used individuals’ emotions to evaluate the UGS quality. This study aims to conduct a multidimensional emotional assessment method of UGS from the perspective of spatial quality. Panoramic videos of 15 scenes in the West Lake Scenic Area were displayed to 34 participants. For each scene, 12 attributes regarding spatial quality were quantified, including perceived plant attributes, spatial structure attributes, and experiences of UGS. Then, the Self-Assessment-Manikin (SAM) scale and face recognition model were used to measure people’s valence-arousal emotion values. Among all the predictors, the percentages of water and plants were the most predictive indicators of emotional responses measured by SAM scale, while the interpretation rate of the model measured by face recognition was insufficiently high. Concerning gender differences, women experienced a significantly higher valence than men. Higher percentages of water and plants, larger sizes, approximate shape index, and lower canopy densities were often related to positive emotions. Hence, designers must consider all structural attributes of green spaces, as well as enrich visual perception and provide various activities while creating a UGS. In addition, we suggest combining both physiological and psychological methods to assess emotional responses in future studies. Because the face recognition model can provide objective measurement of emotional responses, and the self-report questionnaire is much easier to administer and can be used as a supplement.

1. Introduction

The world is experiencing progressive urbanization. Cities continue to expand, and residents are increasingly moving away from natural environments. A high quality Urban Green Space (UGS) is indispensable for improving the urban environment. An increasing number of research findings have pointed to UGSs as a resource for promoting public health. It is commonly believed that contact with nature may enhance positive emotions, restore attention, improve cognitive ability and reduce stress and anxiety [1,2,3,4,5]. UGSs provide relatively low-cost opportunities for residents to connect with nature in their daily lives. During the COVID-19 pandemic, the latest research has found that what many people missed most was close contact with nature, such as exercising outdoors and meeting other people [6,7,8,9]. In other words, UGSs are seen as vital places.
As mentioned in environmental psychology studies, human beings’ mental health can be affected by the surrounding environment [10,11]. Despite the growing recognition of the health benefits of UGSs, the previous studies highlighted a lack of evidence investigating the role of UGS quality rather than provision. It is likely due to the difficultly in identifying the terms of UGS quality, and the time and cost of measuring quality across all UGSs within a study area in a comprehensive and systematic approach [11]. Definitions of UGS quality differ but broadly deal with the various attributes that create a green space, and the activities they support. Annerstedt et al. (2012) identified the following qualities of green spaces: serene, wild, lush, spacious, or culture [12]. It is also possible to use the ecological, microclimatic, and social purposes to assess urban green spaces benefits from the multidimensional perspective [13]. And many studies concurred that landscape features, facilities, amenities, and maintenance are indicative of a green space quality [14]. In this paper, we mainly focus on the spatial quality of UGS.
The quantitative assessment of the spatial quality of UGS requires the use of secondary indicators. Researchers have variously suggested relationships between individual health and spatial quality characteristics of UGS, such as size [15], location [16,17], space type [18,19], vegetation cover [20], or Normalized Difference Vegetation Index (NDVI) [21]. Also, it could be that the mental health benefits of green spaces are influenced by how these green spaces are perceived. Seasonal color [22,23], plant arrangement [23] and perceived naturalness [24,25] also played important roles in the spatial quality of UGSs. Furthermore, evidence from previous studies suggests that the physical and mental health benefits from UGSs are less a matter of their structural attributes than their nonstructural dimensions, i.e., individuals’ experiences when they visit UGSs [26,27]. This characteristic makes sense, as the domains of the spatial quality of UGSs should include both spatial characteristics and spatial experiences [14,28]. However, most of these studies have only focused on the presence of attributes in UGSs, overlooking the quantitative analysis of UGSs’ spatial quality. And some of the adopted attributes are coarse, indicating large aggregations in spatial features, which may be only suitable for large scale UGSs.
In addition, the current research on the spatial attributes of UGS is mainly focused on mental restoration and aesthetic preference, and few studies have used emotional dimensions to evaluate the spatial quality of UGS [17,29,30,31]. This omission may be due to the complexity of personal emotional expression and the difficulty of capturing emotional responses. There is a need to explore the spatial quality of UGSs to identify which attributes of green spaces have the potential to promote individuals’ emotional well-being.
Given the importance of emotional responses in evaluating the quality of UGS, the measurement of emotion related to UGS is a crucial issue and is acknowledged as a complex research task. Selecting an appropriate evaluative dimension of emotion is also necessary to collect reliable and valid data. Most relevant studies regard emotion as a multidimensional structure and assess it through valence and arousal dimensions [32]. Valence refers to the pleasantness of an experience, and ‘pleasant’ and ‘unpleasant’ usually anchor the continuum of the valence dimension. Arousal, on the other hand, refers to the activation of the internal state and usually contrasts states of ‘quiet’ with states of ‘excited’. Dimensional frameworks appear to have substantial explanatory value and can better capture human beings’ emotional responses. Given this capacity, a dimensional approach to emotion serves as the appropriate theoretical basis for further discussion of the psychophysiological measurement of emotion in this study.
In accordance with past studies, emotional measurement techniques can be divided into two main categories: psychological (subjective, understanding participants by conducting self-report, interviews, etc.) and physiological (objective, counting and analyzing emotional responses statistically through biosensors, software algorithms, etc.) [33]. Self-report measures are simple and quick methods to collect individuals’ emotional reactions [34,35]. In these methods, respondents are asked to describe their emotional responses through open-ended questions or rate their emotional state on a set of affective items. The most popular dimensional approach is the Self-Assessment Manikin (SAM) [36]. In recent years, artificial intelligence (AI) tools have emerged and greatly contributed to data collection. Face recognition is a novel technique that analyzes visual recordings of faces through a software algorithm that was generated by training the model using big data of intended emotional expressions. The model performs even better than humans in face recognition benchmark testing because of the emergence of neural networks [37,38]. Current technology can achieve an accuracy of facial analysis in as high as 87% of the perceived emotion [16]. Svoray et al. (2018) collected photos of faces and analyzed the relationship between human facial expressions and exposure to nature [39]. Meng et al. (2019) explored the effectiveness of facial expression recognition for evaluating urban sound perception. However, emotion recognition remains a complex problem [35]. The use of neural networks allows us to exceed the accuracy of manual identification [40], but each additional percentage of accuracy is achieved through complex scientific research and experiments [41].
The spatial quality of UGS should incorporate comprehensive attributes, involving both physical elements and subjective components, to develop a truly quantitative and objective evaluation methodology. Hence, we investigate 3 types of spatial quality of UGSs, including spatial structure attributes, perceived plant attributes and experiences of UGS, which can affect people’s emotional responses. Our study uses physiological and psychological measures to identify relevant spatial qualities of UGS as the predictors of emotion assessment dimensions. Then, we attempt to assess the specific impact of quantitative structural attributes on emotional responses. This research analyzes gender differences in people’s emotions in UGSs. Finally, we explore the similarities and differences between self-report and face recognition methods.

2. Materials and Methods
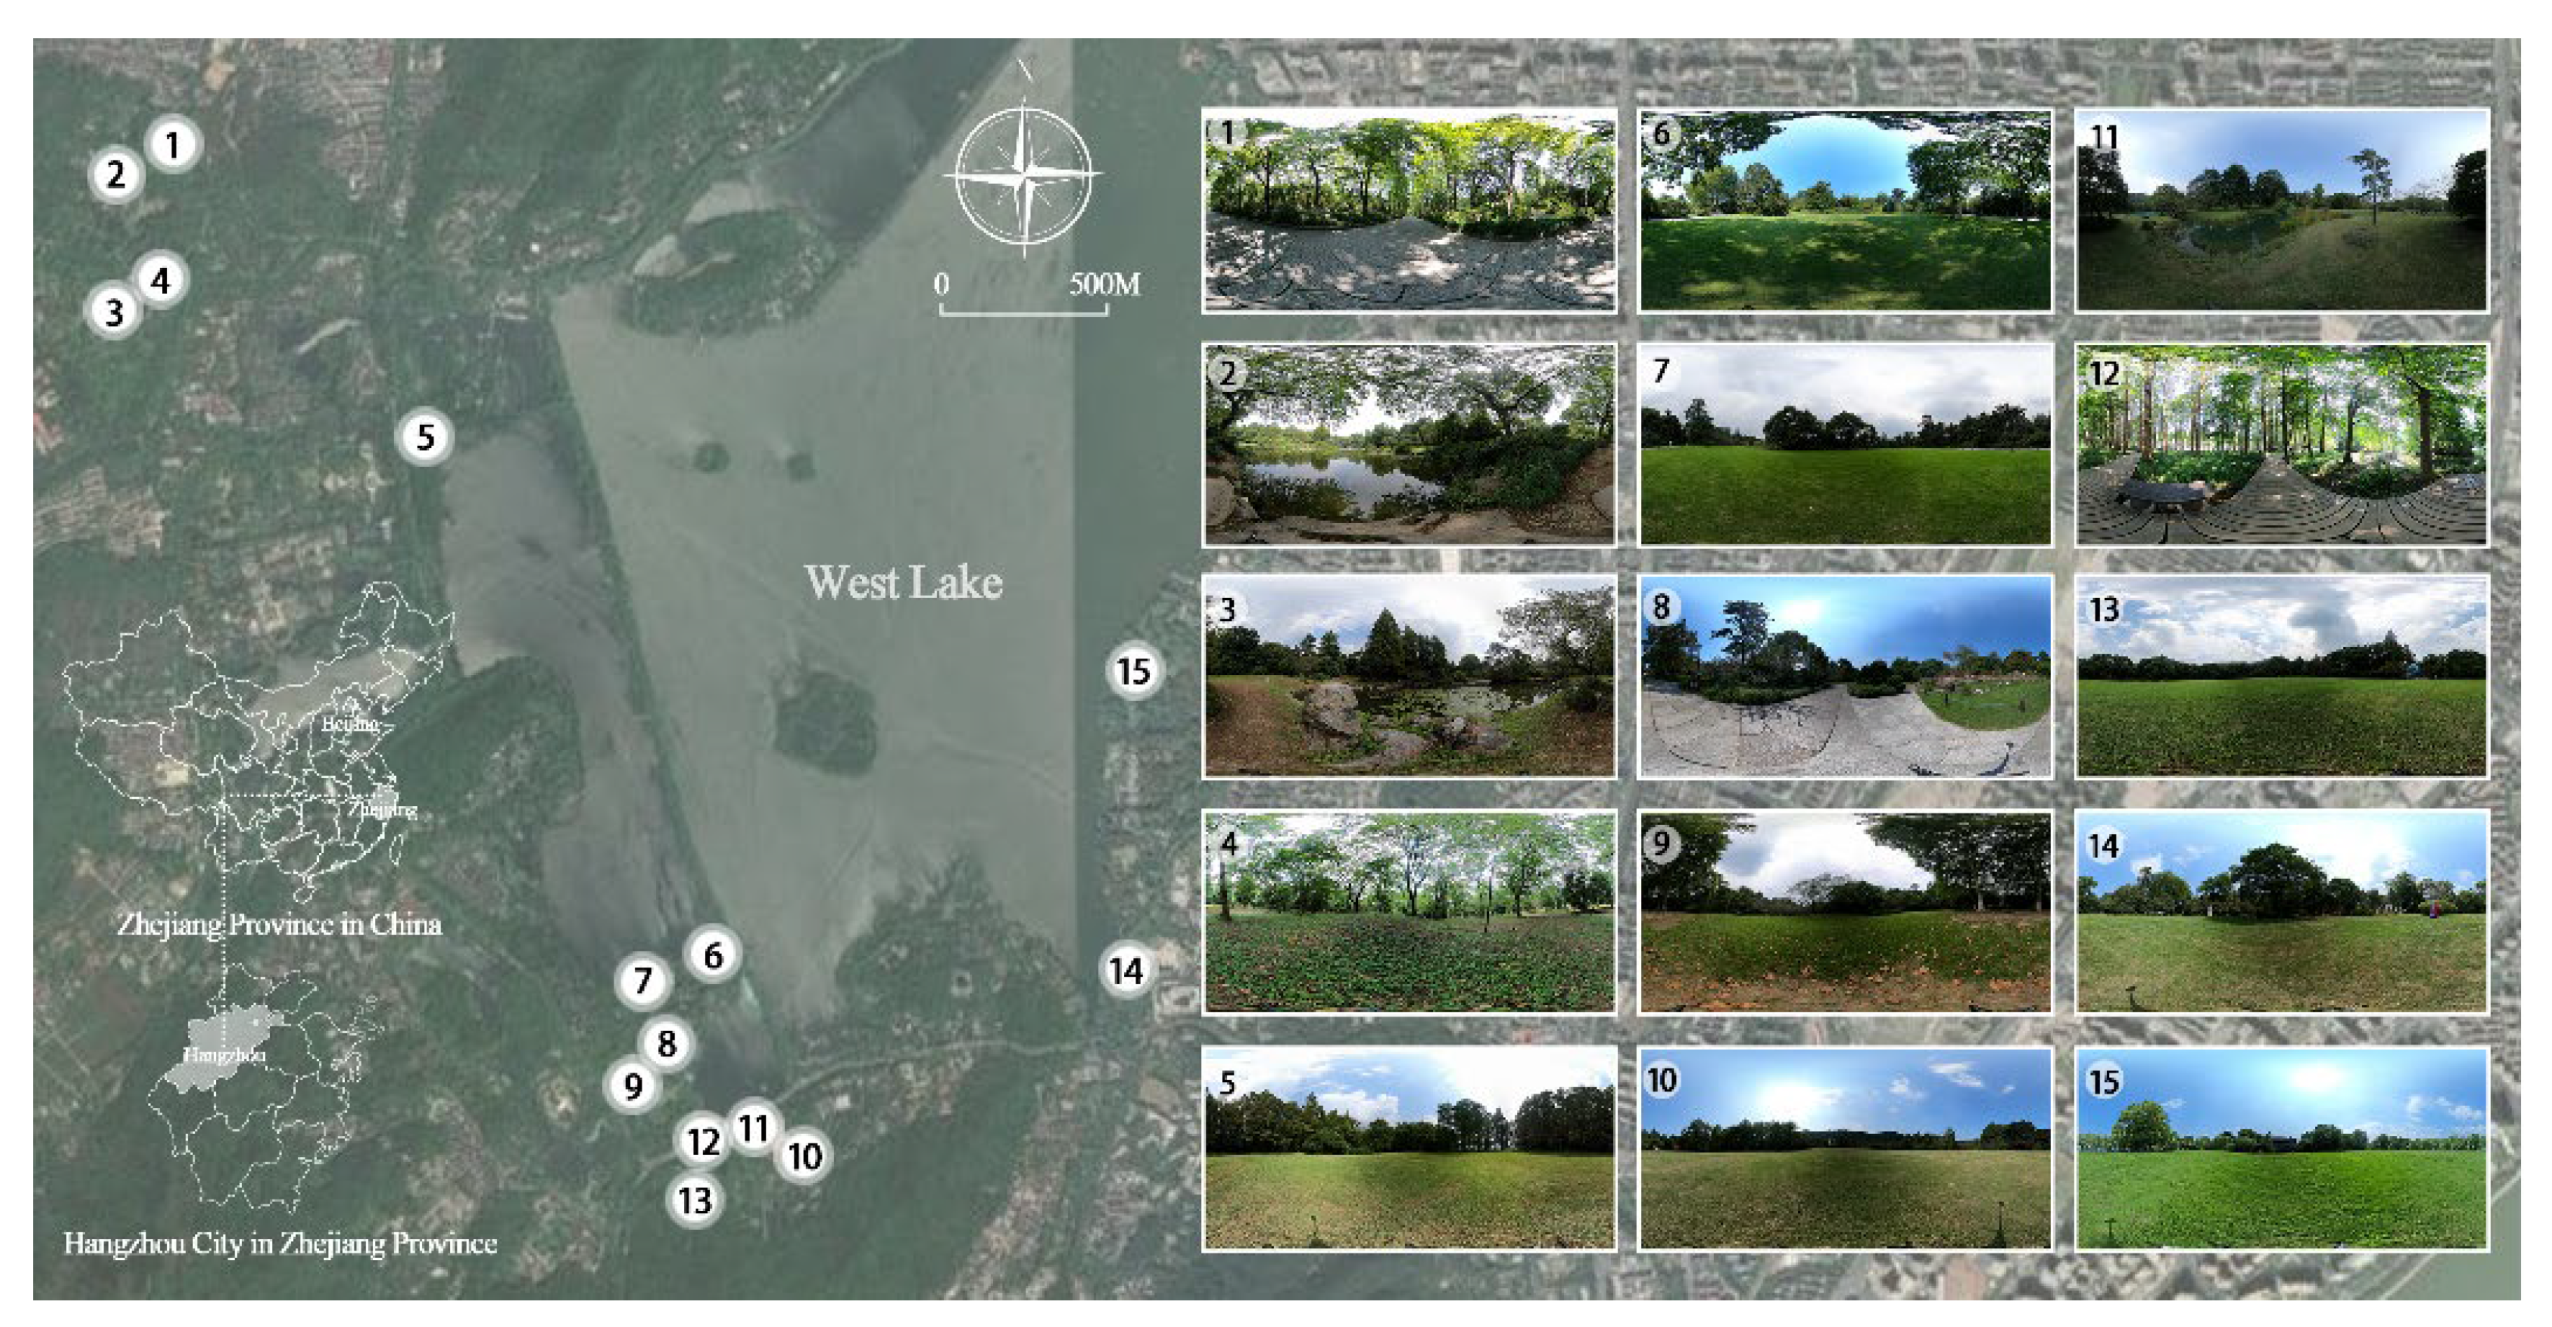
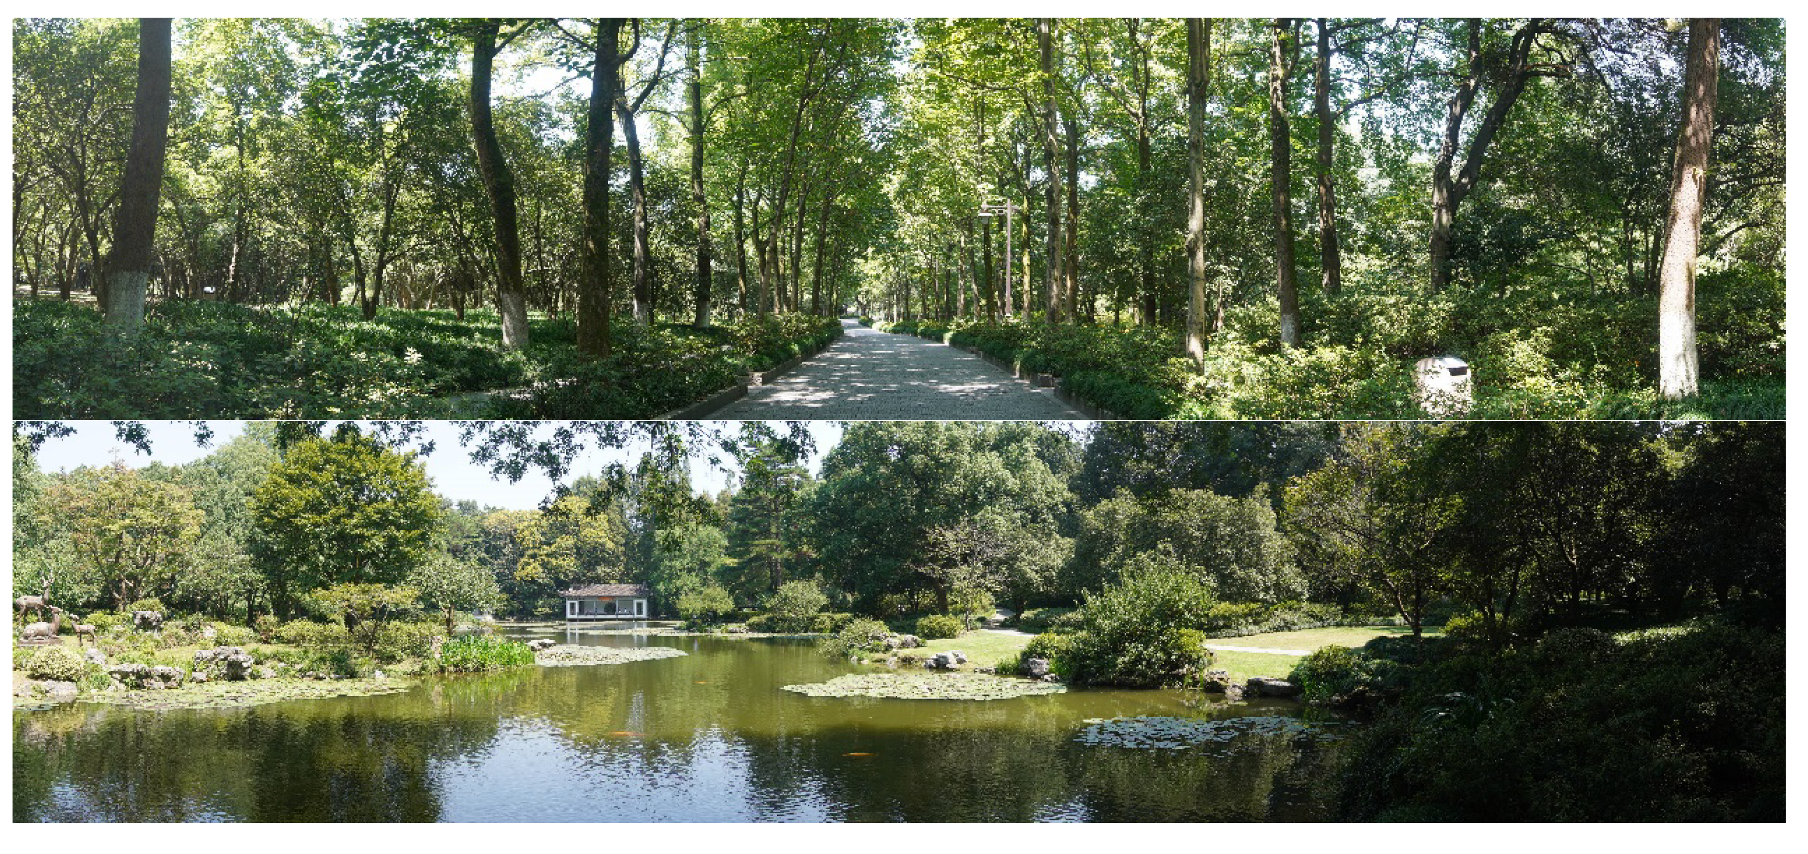
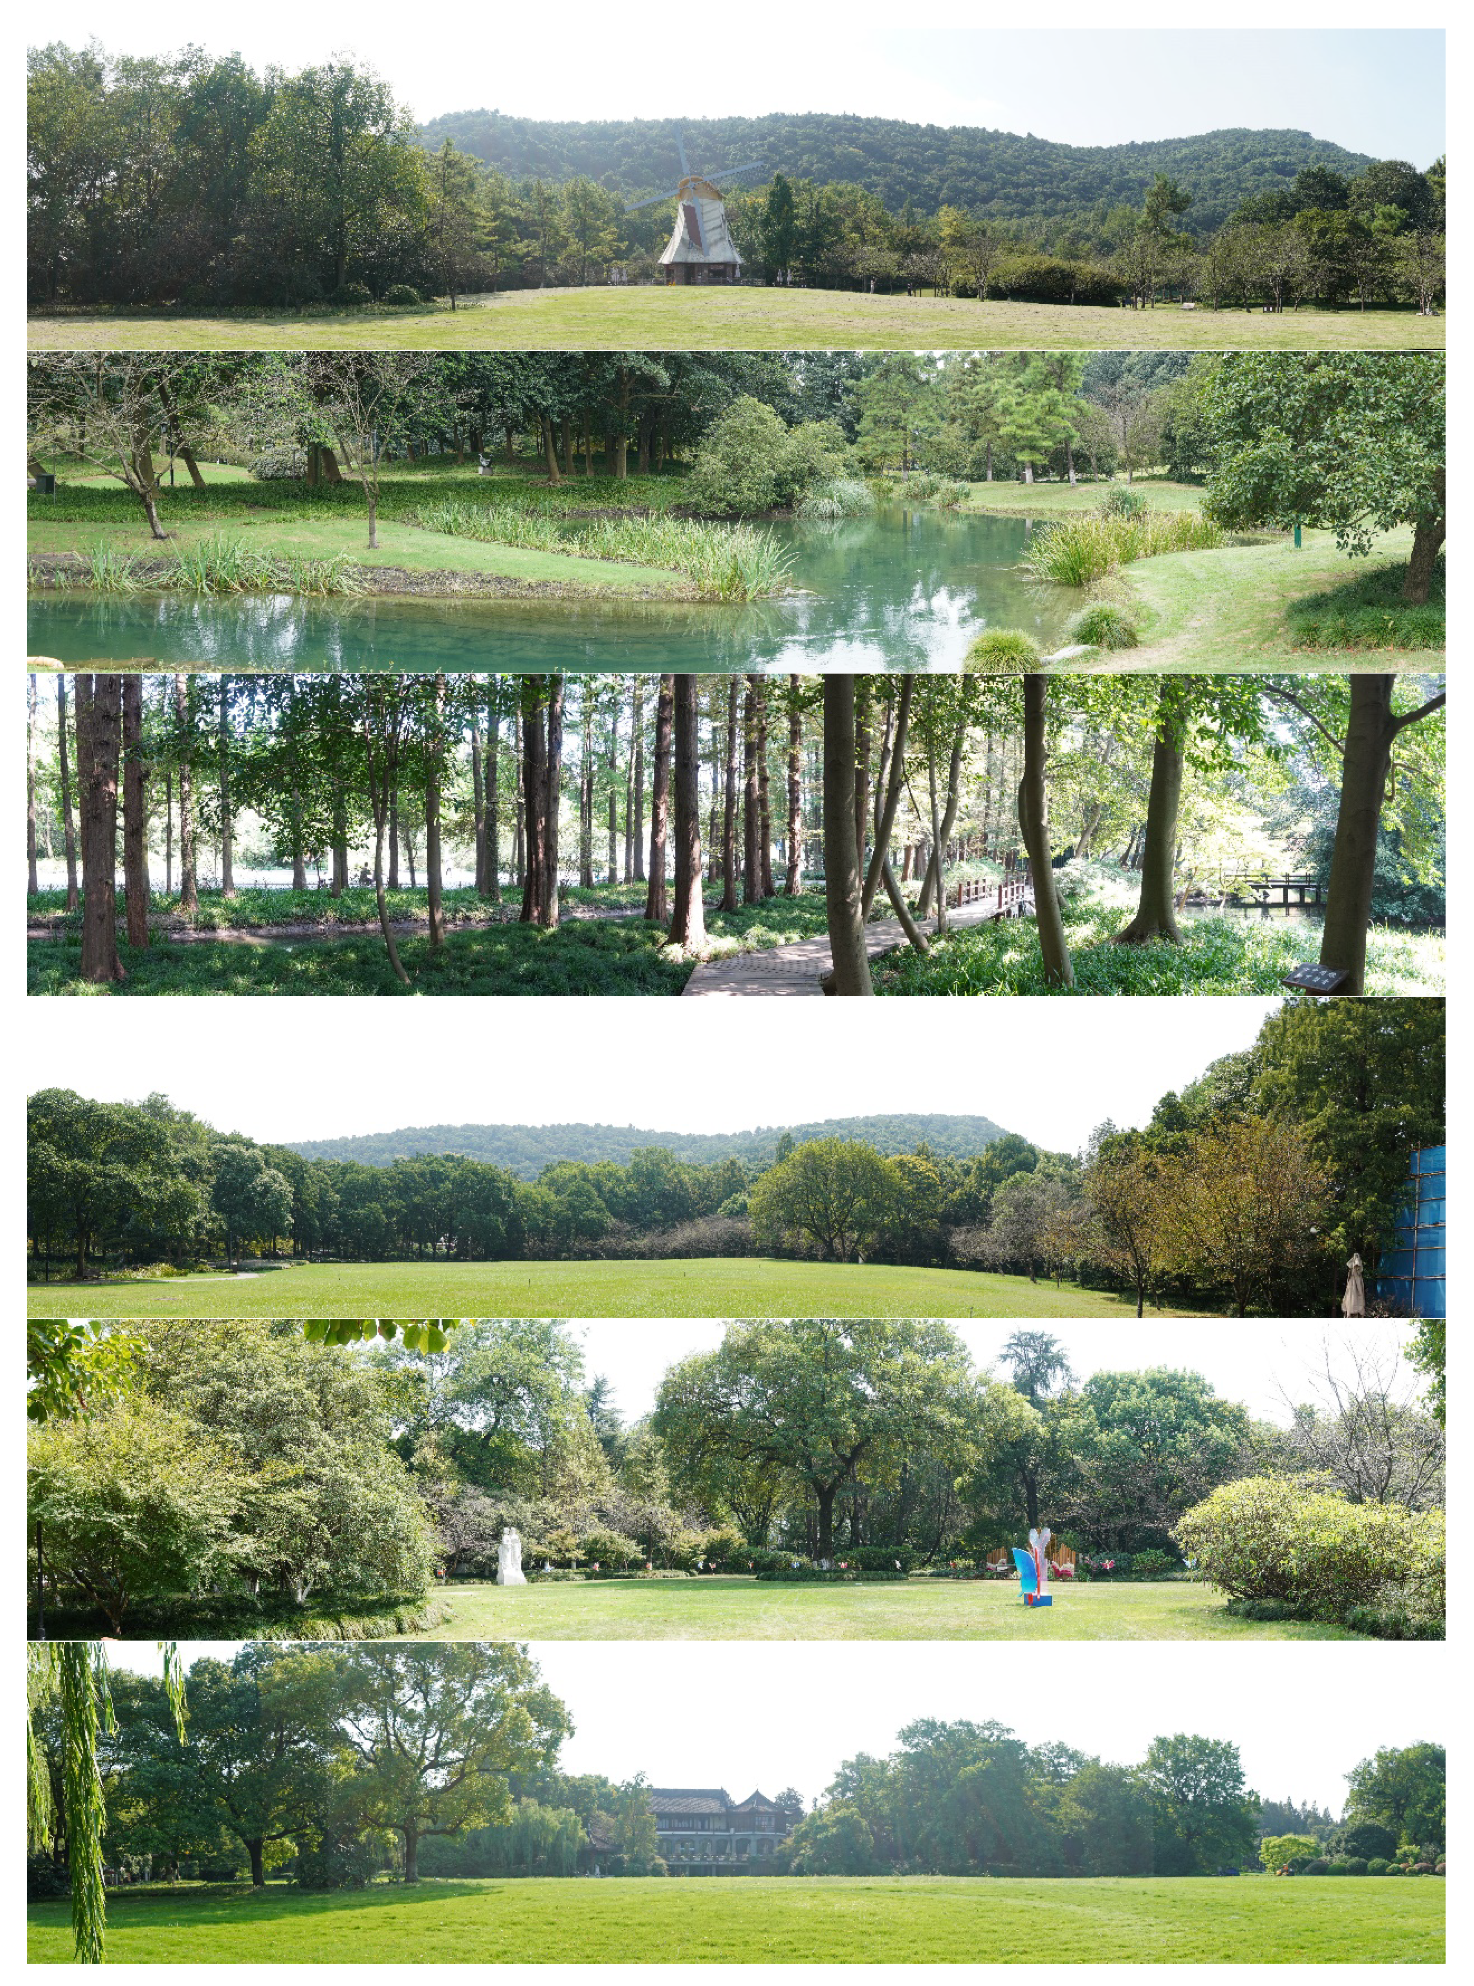
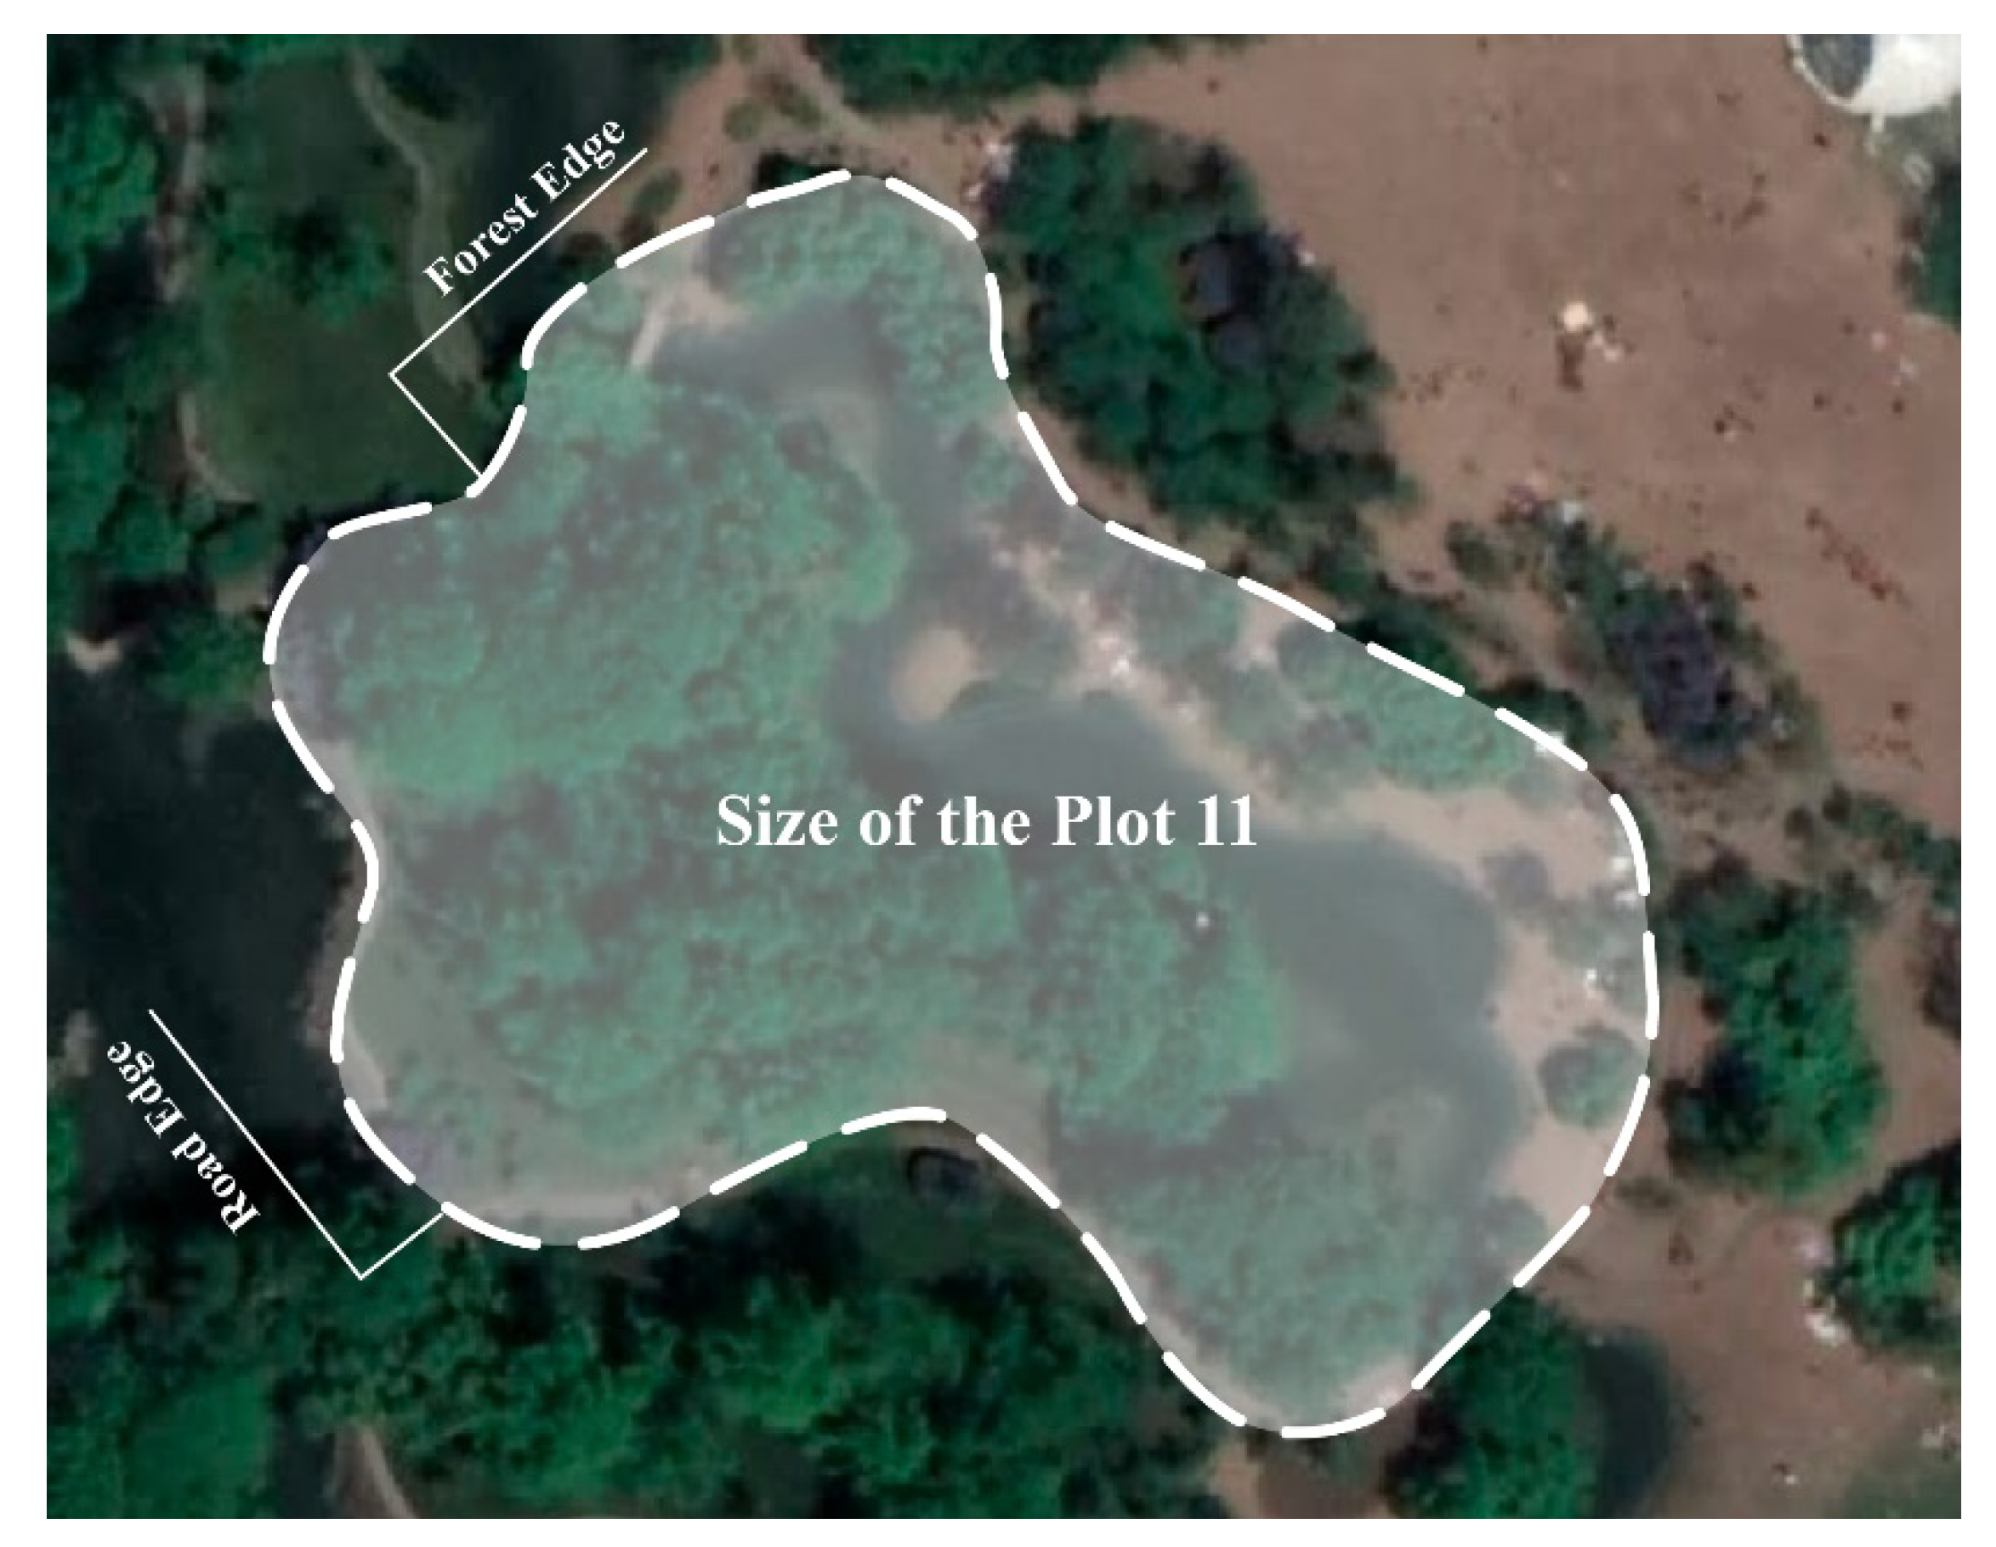
2.1. Site Selection

The study was conducted in Hangzhou, Zhejiang Province, East China (Figure 1). West Lake is a World Cultural Heritage famous for its beautiful and elegant lakes and mountains, as well as its rich cultural heritage. On the basis of the preliminary surveying and mapping of the West Lake scenic area, we chose cases for analysis primarily based on plant landscape construction. Moreover, the sample plots were selected according to the spatial distribution. The green spaces there have good representativeness and research value. We selected a specific type of UGS in the West Lake area that were composed of different attributes of spatial quality (Table A1). The majority of them were along the road or on the lawn edge, the others were part of natural spaces surrounded by plants. Some include water features, some have dense vegetation, and a few are located beside walking pathways, creating green spaces that can be used for a variety of activities. The site was treated as a random effect to control for independence [42]. A total of 15 sample plots were selected based on sampling selection.

2.2. Participants and Design

We recruited 34 participants through website forums. They were almost all college students, aged between 18 and 33 (18 females). The age range was between 18 and 33 years, with a mean of 24 years. The participants were healthy enough to complete the entire experiment. Participation in the research was voluntary, and volunteers were paid a certain amount. We performed a variance analysis within group to detect whether people’s valence and arousal of 15 scenes were consistent. The results showed that there were no significant differences within the groups. Shows that the sample selected for this study is reasonable. The study was performed with the approval of the local Management Committee of Hangzhou West Lake Scenic Area and Zhejiang University, China.

2.3. Environmental Simulation

Scenic photos were taken on sunny days from August to September 2020, and the shooting time was between 9:00 and 16:00. The location of the photographer in the UGSs and the photographic views were selected randomly, but it was confirmed that the photographs could capture the principal characteristics of the scenes, such as vegetation type, color density, and architectural structure. Several photographs were taken at each sample site, but only one picture of good quality (e.g., a good photographic angle, clear contrast) representative of each site was selected by the authors for the experiment. The selected photos were preprocessed to improve their accuracy, including calibration of image brightness and chroma. GoPro MAX cameras were used to take 360° panoramic photos of each scene. The photos had an aspect ratio of 3:2. The GoPro was set up on a tripod at a height of approximately 62 cm to shoot. There were no large trees or other visual impairments within 10 m of the camera’s field of view, and the photos accurately showed the entire field of view captured by the camera. Then, the photos were imported into the VRyun website (http://www.vryun.work, accessed on 6 August 2021) to generate panoramic videos. Finally, a total of 15 one-minute video segments were produced. What’s more, SONY ILCEA 6400 camera was used to take the horizontal panoramic photos, with an aspect ratio of 8192 × 1856 pixels (Figure A1, Appendix A). We always kept the camera lens level when shooting and fixed it at a height of 160 cm from the ground. These photographs were used for subsequent analysis.

2.4. Measures

2.4.1. Spatial Quality of UGS

We proposed that measuring spatial variables based on the perspectives of the UGS users themselves is more meaningful. Considering previous similar studies, the spatial quality attributes were summarized at the outset via the literature review [20,43,44]. Spatial quality attributes that are specific to specific country and region cases, or where the size of green space is too large or too small, are excluded. For the selected attributes, a preliminary correlation analysis and regression analysis was performed, those that were unrelated to emotional responses or had multicollinearity were excluded. Finally, 5 spatial structure attributes (size, shape index of edges, canopy density, percentage of water, percentage of plants) and 5 perceived plant attributes (vegetation layers, shape of trees, texture of trees, color diversity and cultural connotation) of UGS were chosen. In addition, this study also includes the evaluation of 2 nonstructural attributes of UGS experiences (use function and visit frequency). The spatial structure attributes were mainly obtained through field measurement. We measured the length of each side and the canopy of trees in green spaces using a distance finder and a tape. The boundaries of the regular-shaped plots were defined by the inner edges of the road or the lawn, whereas the others (including plots 6, 7, 11, 13) were defined by the forest outermost edges (Figure A2). We then computed their area, perimeter, shape index of edge, and canopy density based on the data. The percentage of water and the percentage of plants were measured by the number of pixels in each of the horizontal panoramic photos [45,46]. Then, the dummy-coding method was employed to quantify 5 spatial structural attributes, referring to previous literature [29,30,43]. The evaluation criteria for the structural attributes of UGS are shown in Table 1. The perceived plant attributes were measured by a photo questionnaire. The participants were asked to evaluate the plant attributes of each plot on a Likert scale (1 = strongly disagree; 5 = strongly agree). The Cronbach’s α is 0.843. In response to the nonstructural quality posed after the presentation of the UGS scenes, we designed questions about the visit motivation of each scene. We asked, “Do you think any factor shown in the video will motivate you to use the scene?” Answers were in the form of binary variable data, with “1” representing “yes” and “0” representing “no”. Then, we evaluated the use function of the UGS by adding all 6 scores. Finally, we asked “How often do you visit UGSs?’’ (Questionnaire 1).

2.4.2. Physiological Measures

For the collection of facial data, participants were required to sit in front of a well-lit window to allow better detection of facial movement. They were asked not to wear thick-rimmed glasses or anything that might cover their faces. Then, we captured the facial movements of the participants with camera videos. To recognize facial expressions of the video we captured, we used the face recognition model proposed by Do et al., 2020 [40]. After we input the videos to the model, the valence-arousal emotion values were output for the subsequent analysis. There were 3 steps to get the final results. The premise of emotion recognition was to detect faces, so the faces in the video frames were detected and aligned in the first step of the pre-processing process. The facial features were then extracted, and the facial expression categories and valence-arousal values were calculated by ResNet50 (a convolutional neural network which is 50 layers deep). Finally, the valence and arousal values were set to range from 0 to 100 and output in seconds. In our experiment, we also attempted to improve the model’s transferability and robustness by re-labeling the distinctly incorrect results of face emotion in our videos during the pre-processing step (cf. Section 2.5).

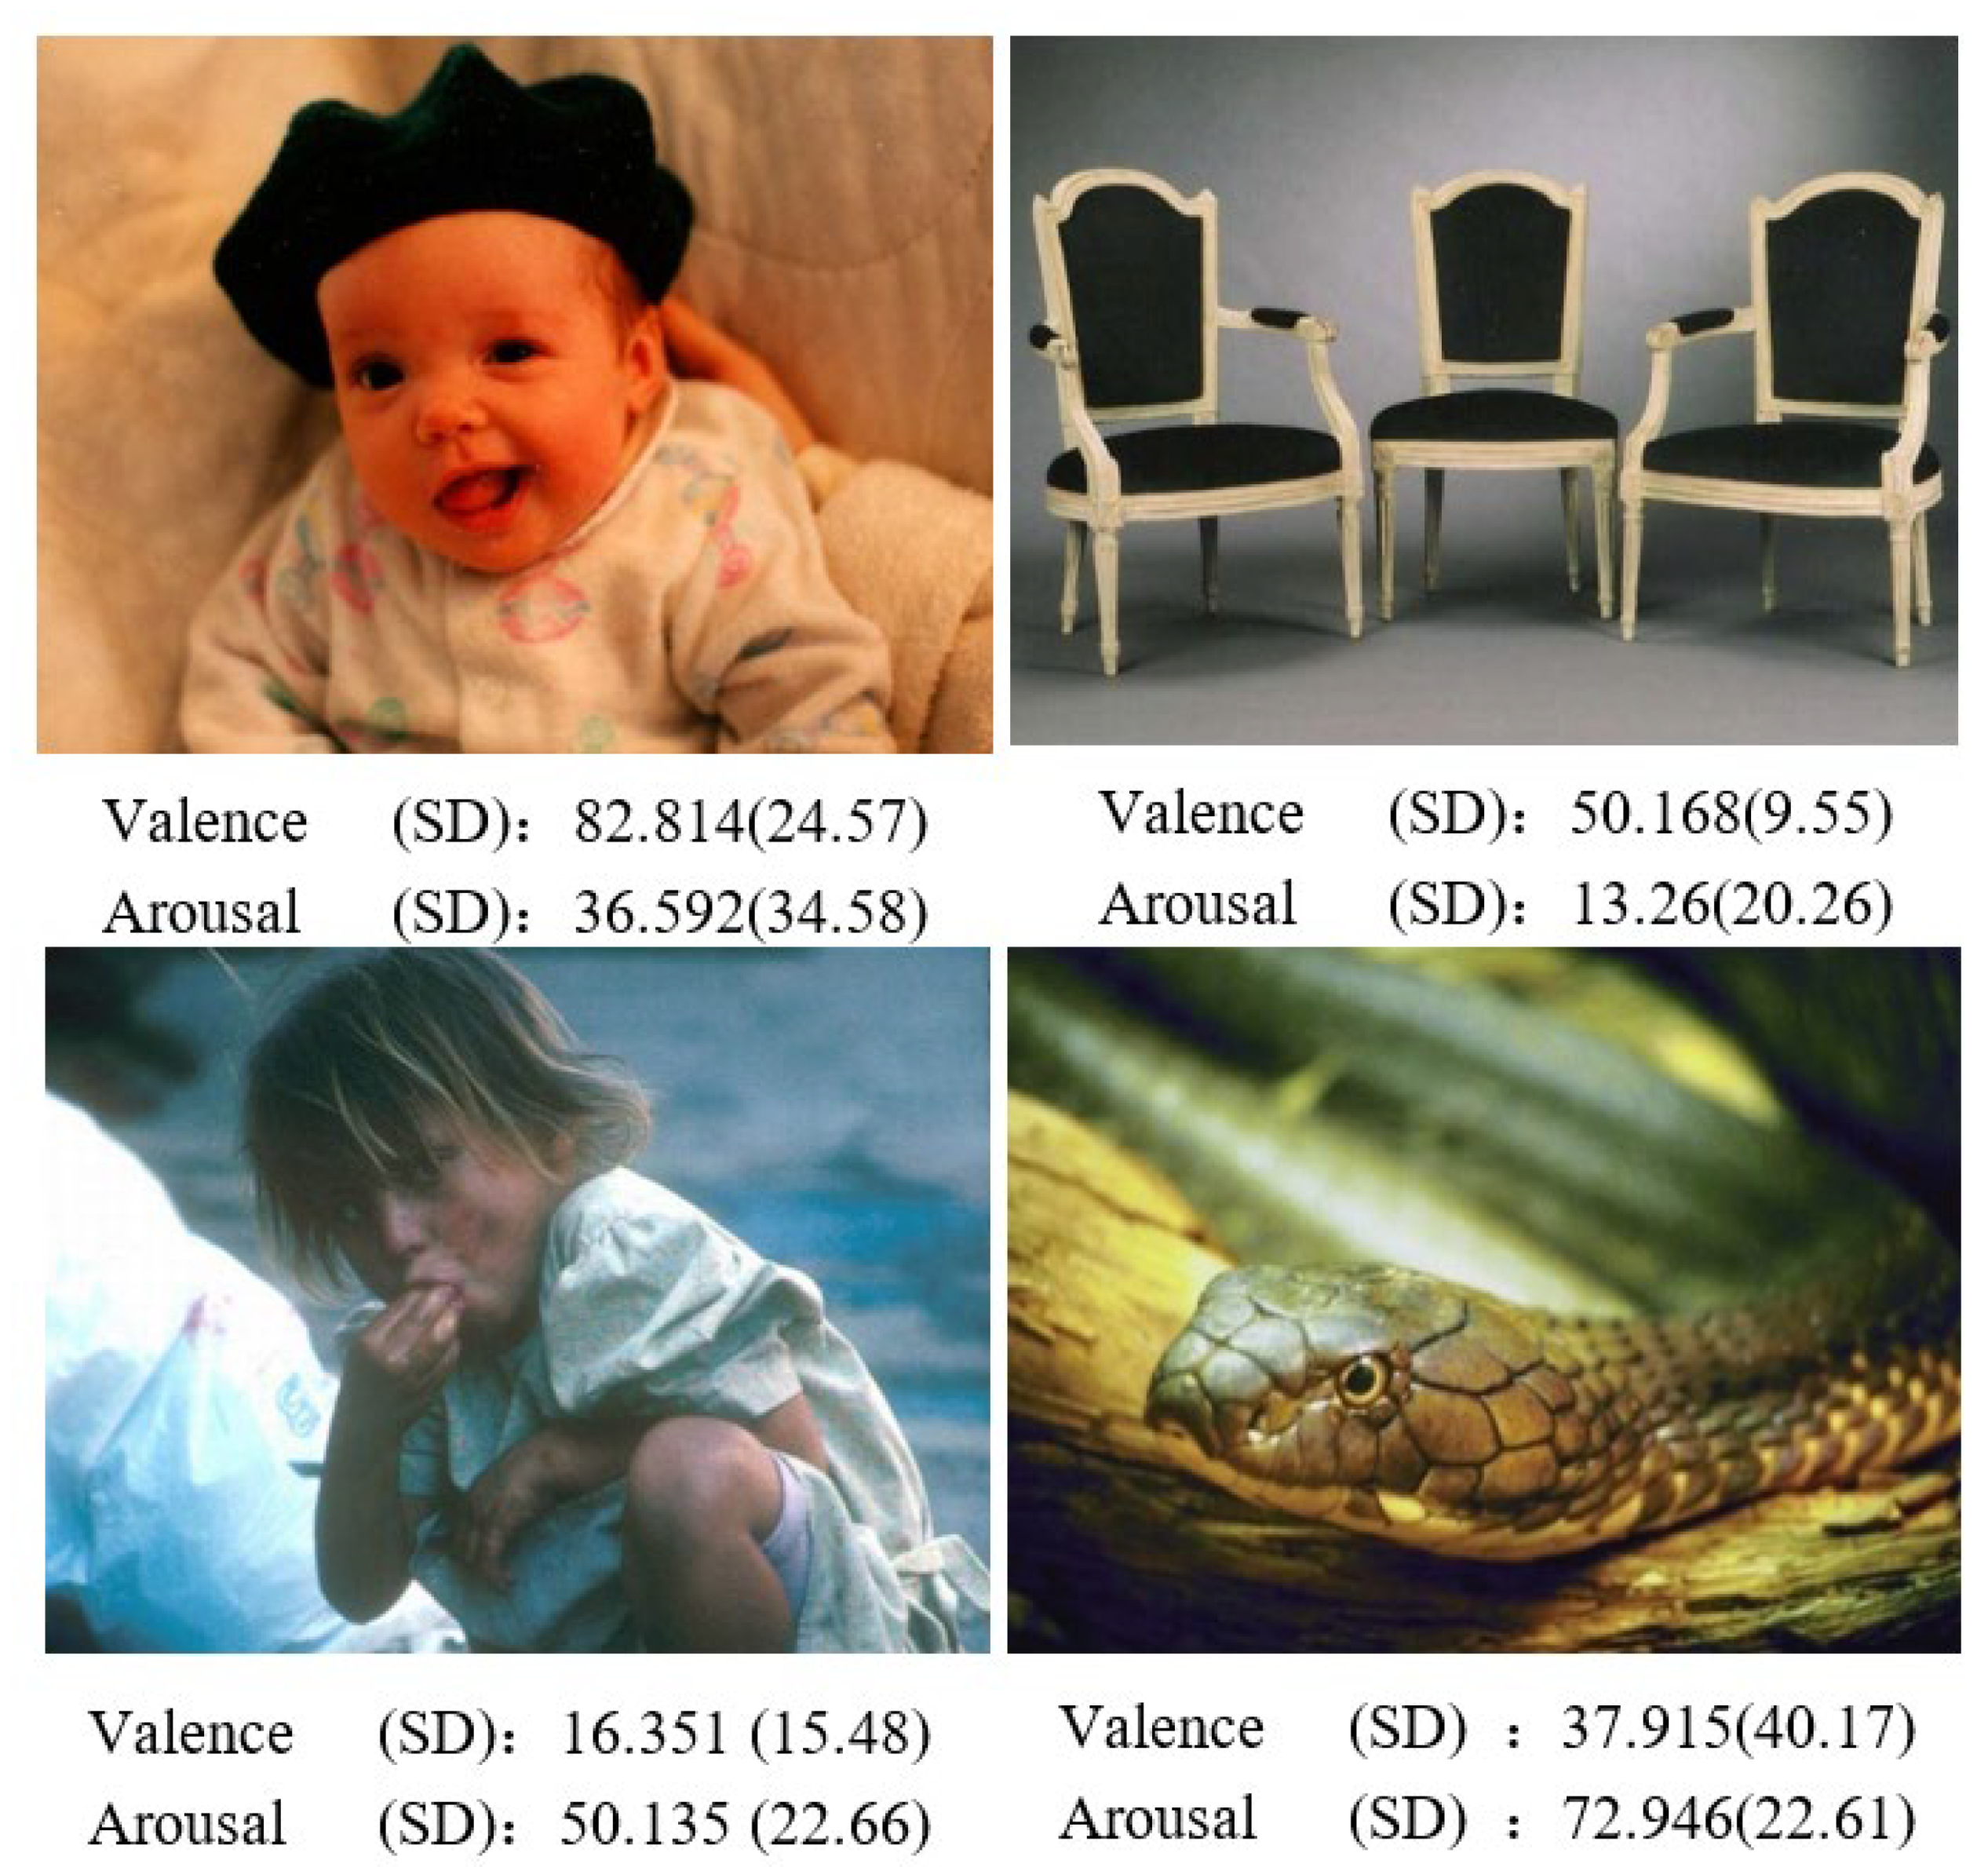
2.4.3. Psychological Measures
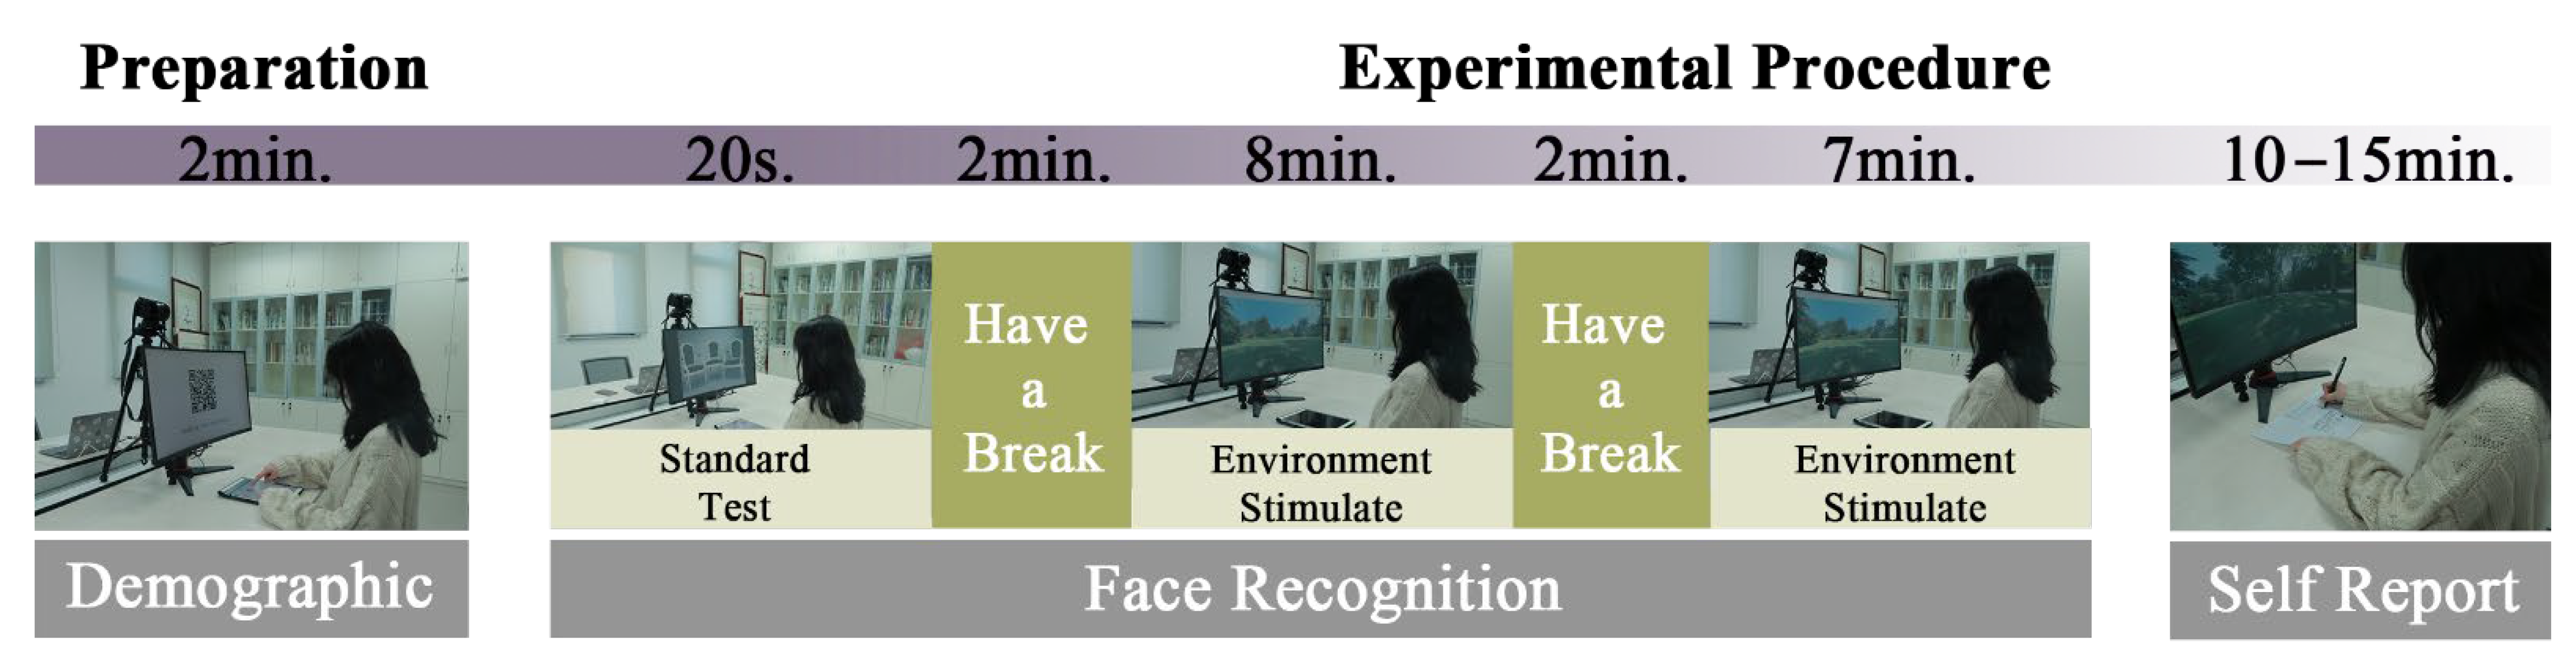
After the experimental procedure, the participants were allowed to describe their feelings through questionnaires. Based on the dimension of emotion evaluation, a Self-Assessment-Manikin (SAM) was used to measure their emotional responses. The SAM is a nonverbal, pictorial assessment technique that directly measures valence and arousal in response to various environmental stimuli, which reduces the potential influence of laziness on the questionnaire results. Backs et al. (2005) proved that the various dimensions of SAM had high internal consistency [47]. Cronbach’s α coefficient of valence and arousal dimension were 0.98 and 0.63, which was widely used in the emotional evaluation research of adolescents, college students, and normal elderly in China [48,49]. The two related dimensions, valence and arousal, are represented by different human-shaped pictures. There are five human-shaped pictures in each dimension in the picture. The numbers in the table below represent different degrees of components from 1–9. From top to bottom, the first dimension is valence. The numbers 1, 3, 5, 7, and 9 represent frown (a frowning figure), unhappy, neutral, smiling, and happy (a smiling figure). The second dimension is arousal. The numbers 1, 3, 5, 7 and 9 indicate sleepy (eyes closed), drowsy, neutral, excited, and stimulation (eyes wide open). Dimensions 2, 4, 6, and 8 provide volunteers with subtler choices among degrees. (Questionnaire 2) The interclass reliability of valence and arousal scores of SAM scale was calculated in this experiment. Cronbach’s α for valence scores was 0.837, arousal was 0.834.

2.5. Procedure

Before the experiment, the participants were briefly introduced to the procedure. Then, they were asked to fill out a simple demographic questionnaire. Next, the participants were asked to view images from the Geneva Affective Picture Database (GAPED) [50]. The database has a wide selection of pictures with clear meanings and can convey emotional information relatively quickly. Four specific pictures, including positive, negative and neutral contents, were randomly selected from the database in order to proportionally cover the whole dimensional affective space (Figure A3). The evaluation results formed the benchmark for evaluating its impact. The pictures were displayed on PPT, and each picture was played for 5 s. After that, each participant was asked to watch 15 scenic videos in a random order. After 8 scenes, they rested for a period to avoid visual fatigue. The participants were asked to imagine what feelings they experienced in the scene and what their emotions were like in this place, rather than focusing on the scene depicted based on the video itself. After the experiment, the participants were asked to complete a questionnaire, including a SAM scale, and to evaluate the perceived plant attributes (Table A2) and the experience of the scene. (Figure 2).

2.6. Statistical Analysis

The collected data were arranged in Excel and transferred into IBM SPSS 21.0 (IBM Corp., Armonk, NY, USA). Our analyses focused on estimating the effect of spatial quality on emotional responses to UGS. The spatial quality values of each scene and emotional scores were then calculated. Pearson correlation analysis was used to show the relationships between spatial quality and emotion scores. We then entered the correlated spatial quality attributes in linear regression analysis with valence or arousal measured in different ways as the dependent variables. We examined the significant coefficients for the relationships between the attributes and predictive likelihood of valence and arousal. Analysis of variance and post hoc analysis were employed to examine the differences in valence or arousal for the UGS with various spatial structural attributes. Finally, an independent sample T test was conducted to present the differences in the participants’ sociodemographic characteristics.

3. Results

This section may be divided by subheadings. It should provide a concise and precise description of the experimental results, their interpretation, as well as the experimental conclusions that can be drawn.

3.1. Spatial Quality Related to Emotional Responses for UGSs

The descriptive statistics shown in Table 2 reveal that the values of spatial quality variables differed substantially across the plots in our samples. Pearson’s rho correlation analysis describes the relationship between the emotional responses and the variables of the spatial quality for UGSs. Based on these results, only B1 and D2 were not related to valence and arousal measured by SAM scales. For the face recognition method, A1, A2, A4, A5, B1, B2, B3, and D2 were associated with Vfr. A4, D1, and D2 were associated with the Afr.

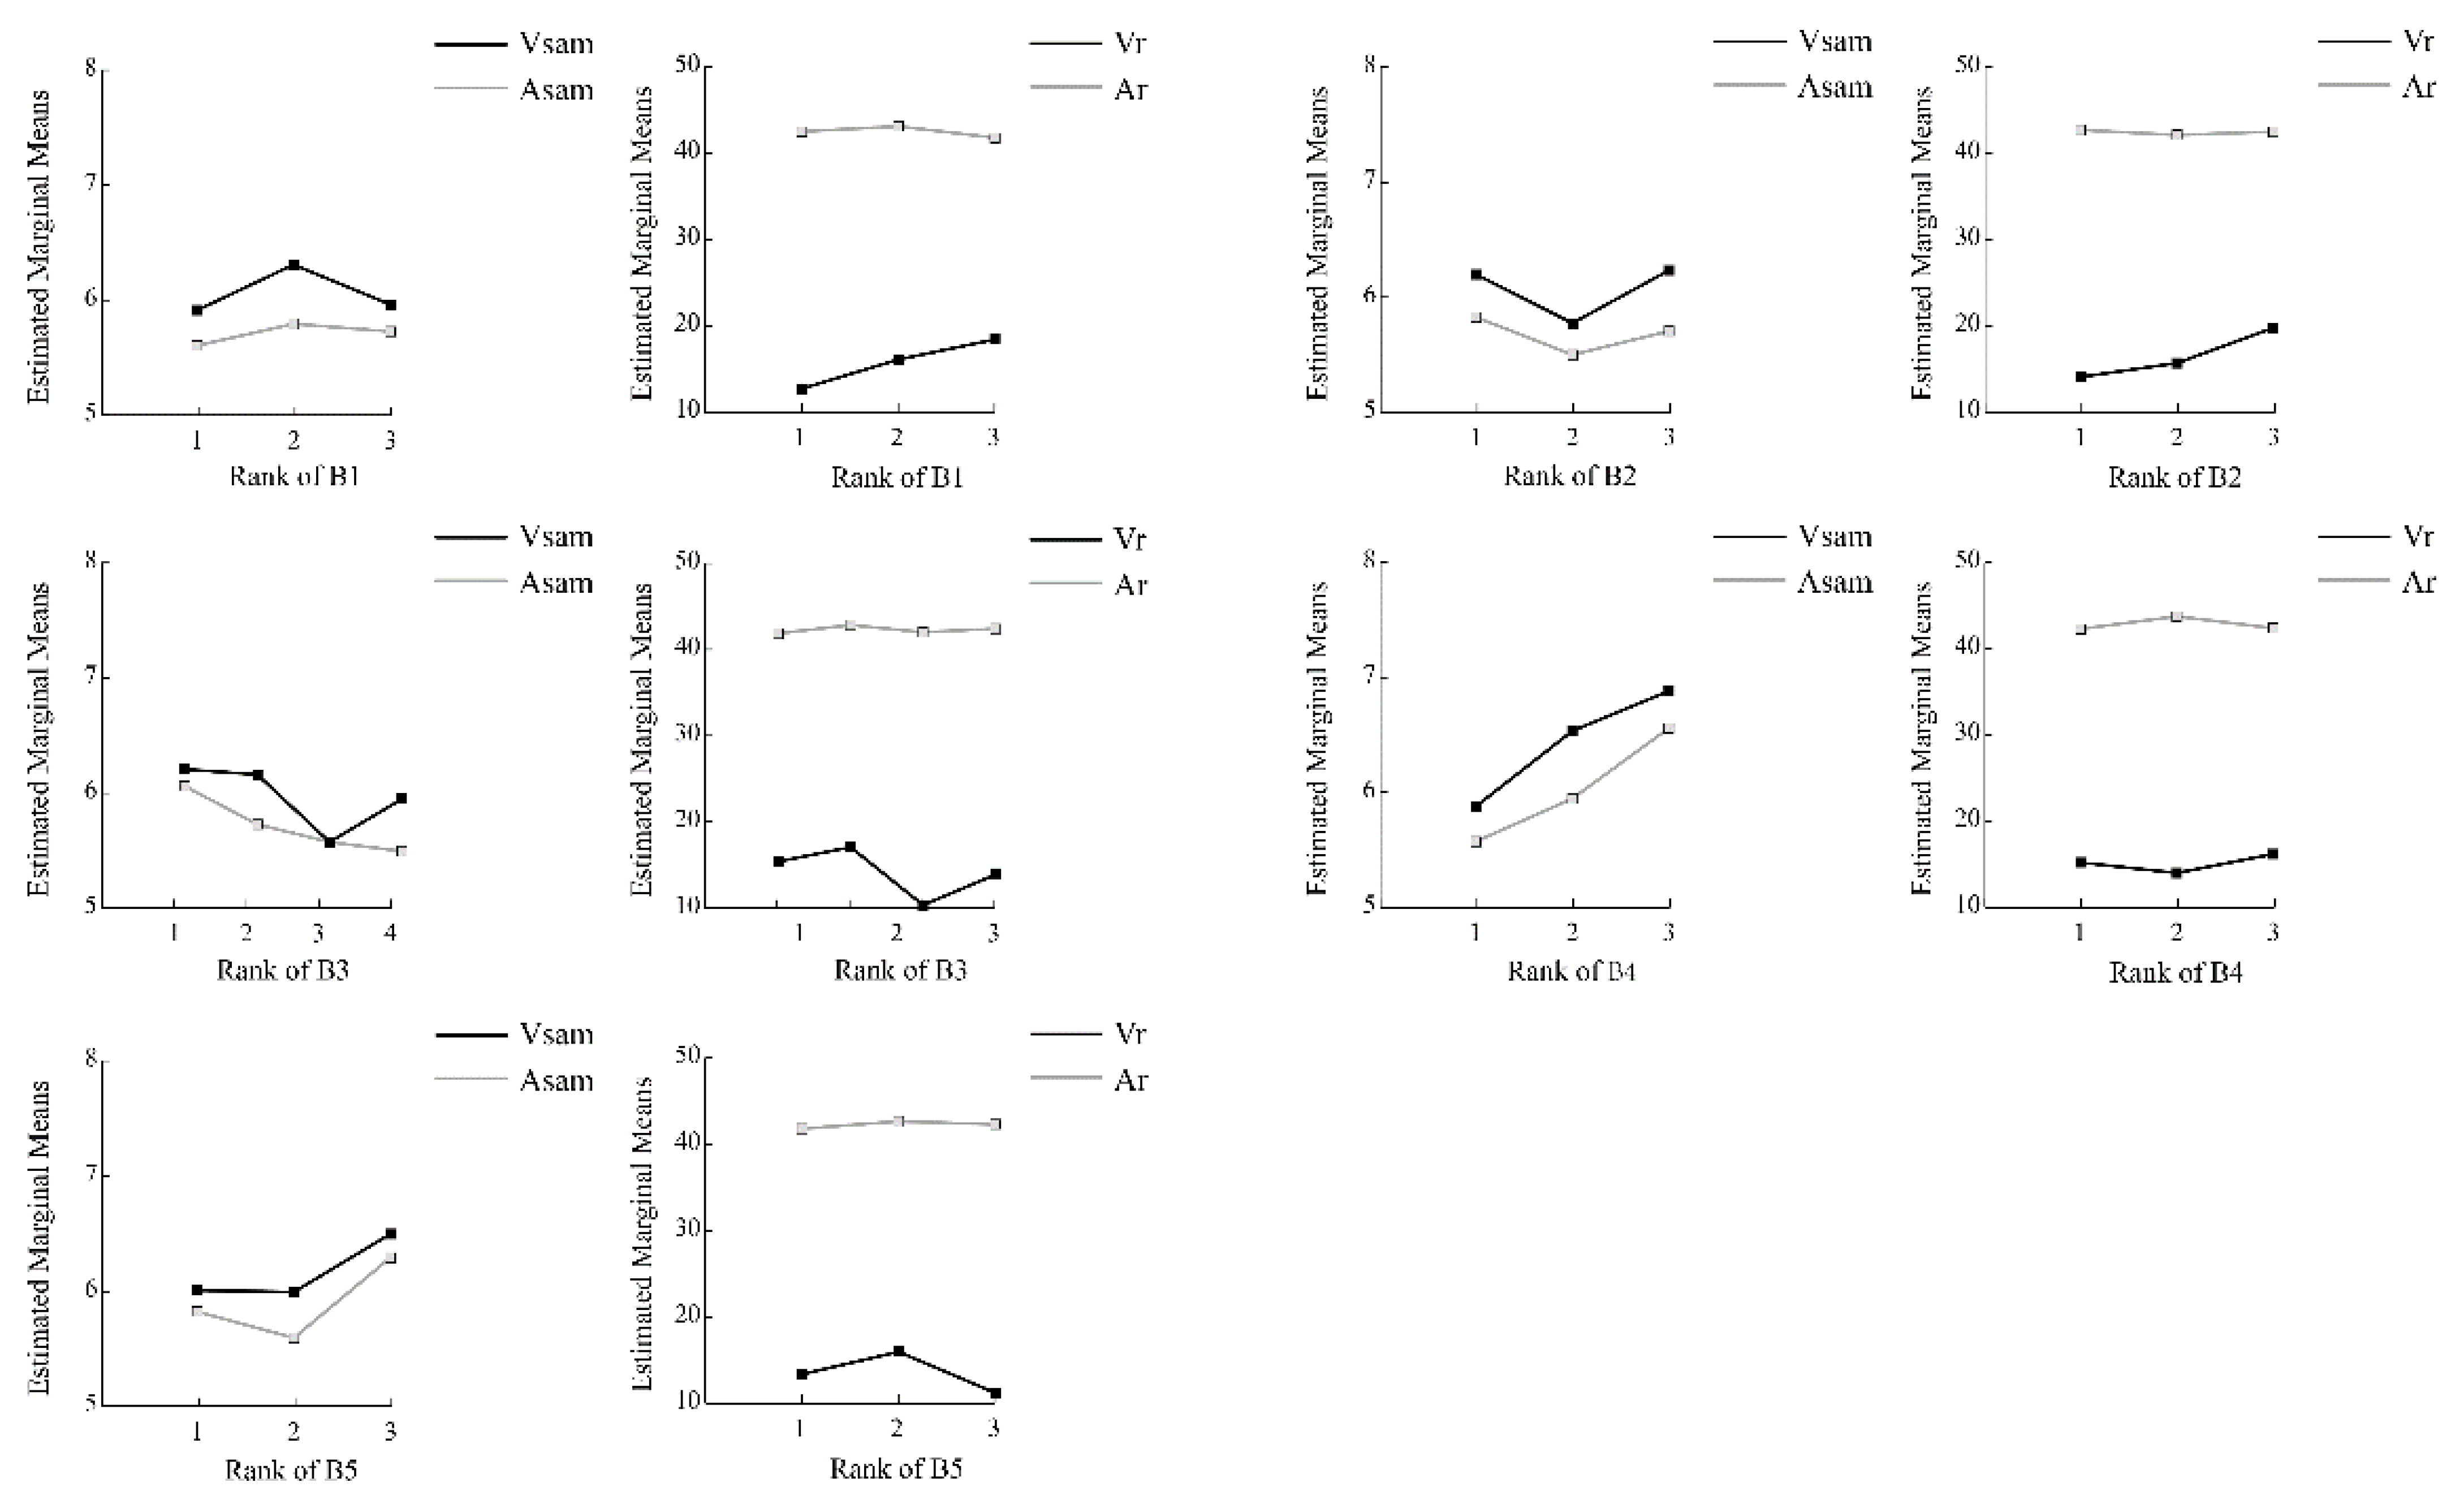
3.2. Effects of the Interaction of UGS Spatial Quality on Emotional Responses

Linear regression analysis was conducted using backward regression analysis. This composite method was applied to determine whether there were several regression models involving different variable combinations that had significant relations with people’s emotions. To verify the model, we performed an analysis of variance and evaluated multicollinearity.
Table 3 shows 4 models from backward regression inclusions. The research focused on the model with high R2. The spatial quality of UGS accounted for 49.7% of the explained variance in the likelihood of Vsam. The most predictive variables, as indicated by the b-values, were C1 and C2. The results showed that A1, A2, A3, A5, B3, C1, C2, and D1 positively predicted the self-reported valence of UGS. In contrast, A4 was shown to be a negative predictor of Vsam. When related indicators were entered in the regression analysis model, they accounted for 46.1% of the explained variance in the likelihood of Asam. In summary, A1, A2, A3, A4, A5, B2, C1, and D2 were proven to be predictors of Asam. Among them, A1, A2, A3, A5, and D2 had a positive effect on the Asam model. Interestingly, A4 also showed a negative effect on Asam. The Vfr and Afr models showed weak predictive ability. In general, each of the 12 indicators of UGS, regardless of their contribution to the model, was of vital significance, as the model was meant to assess the predictive ability of all variables.

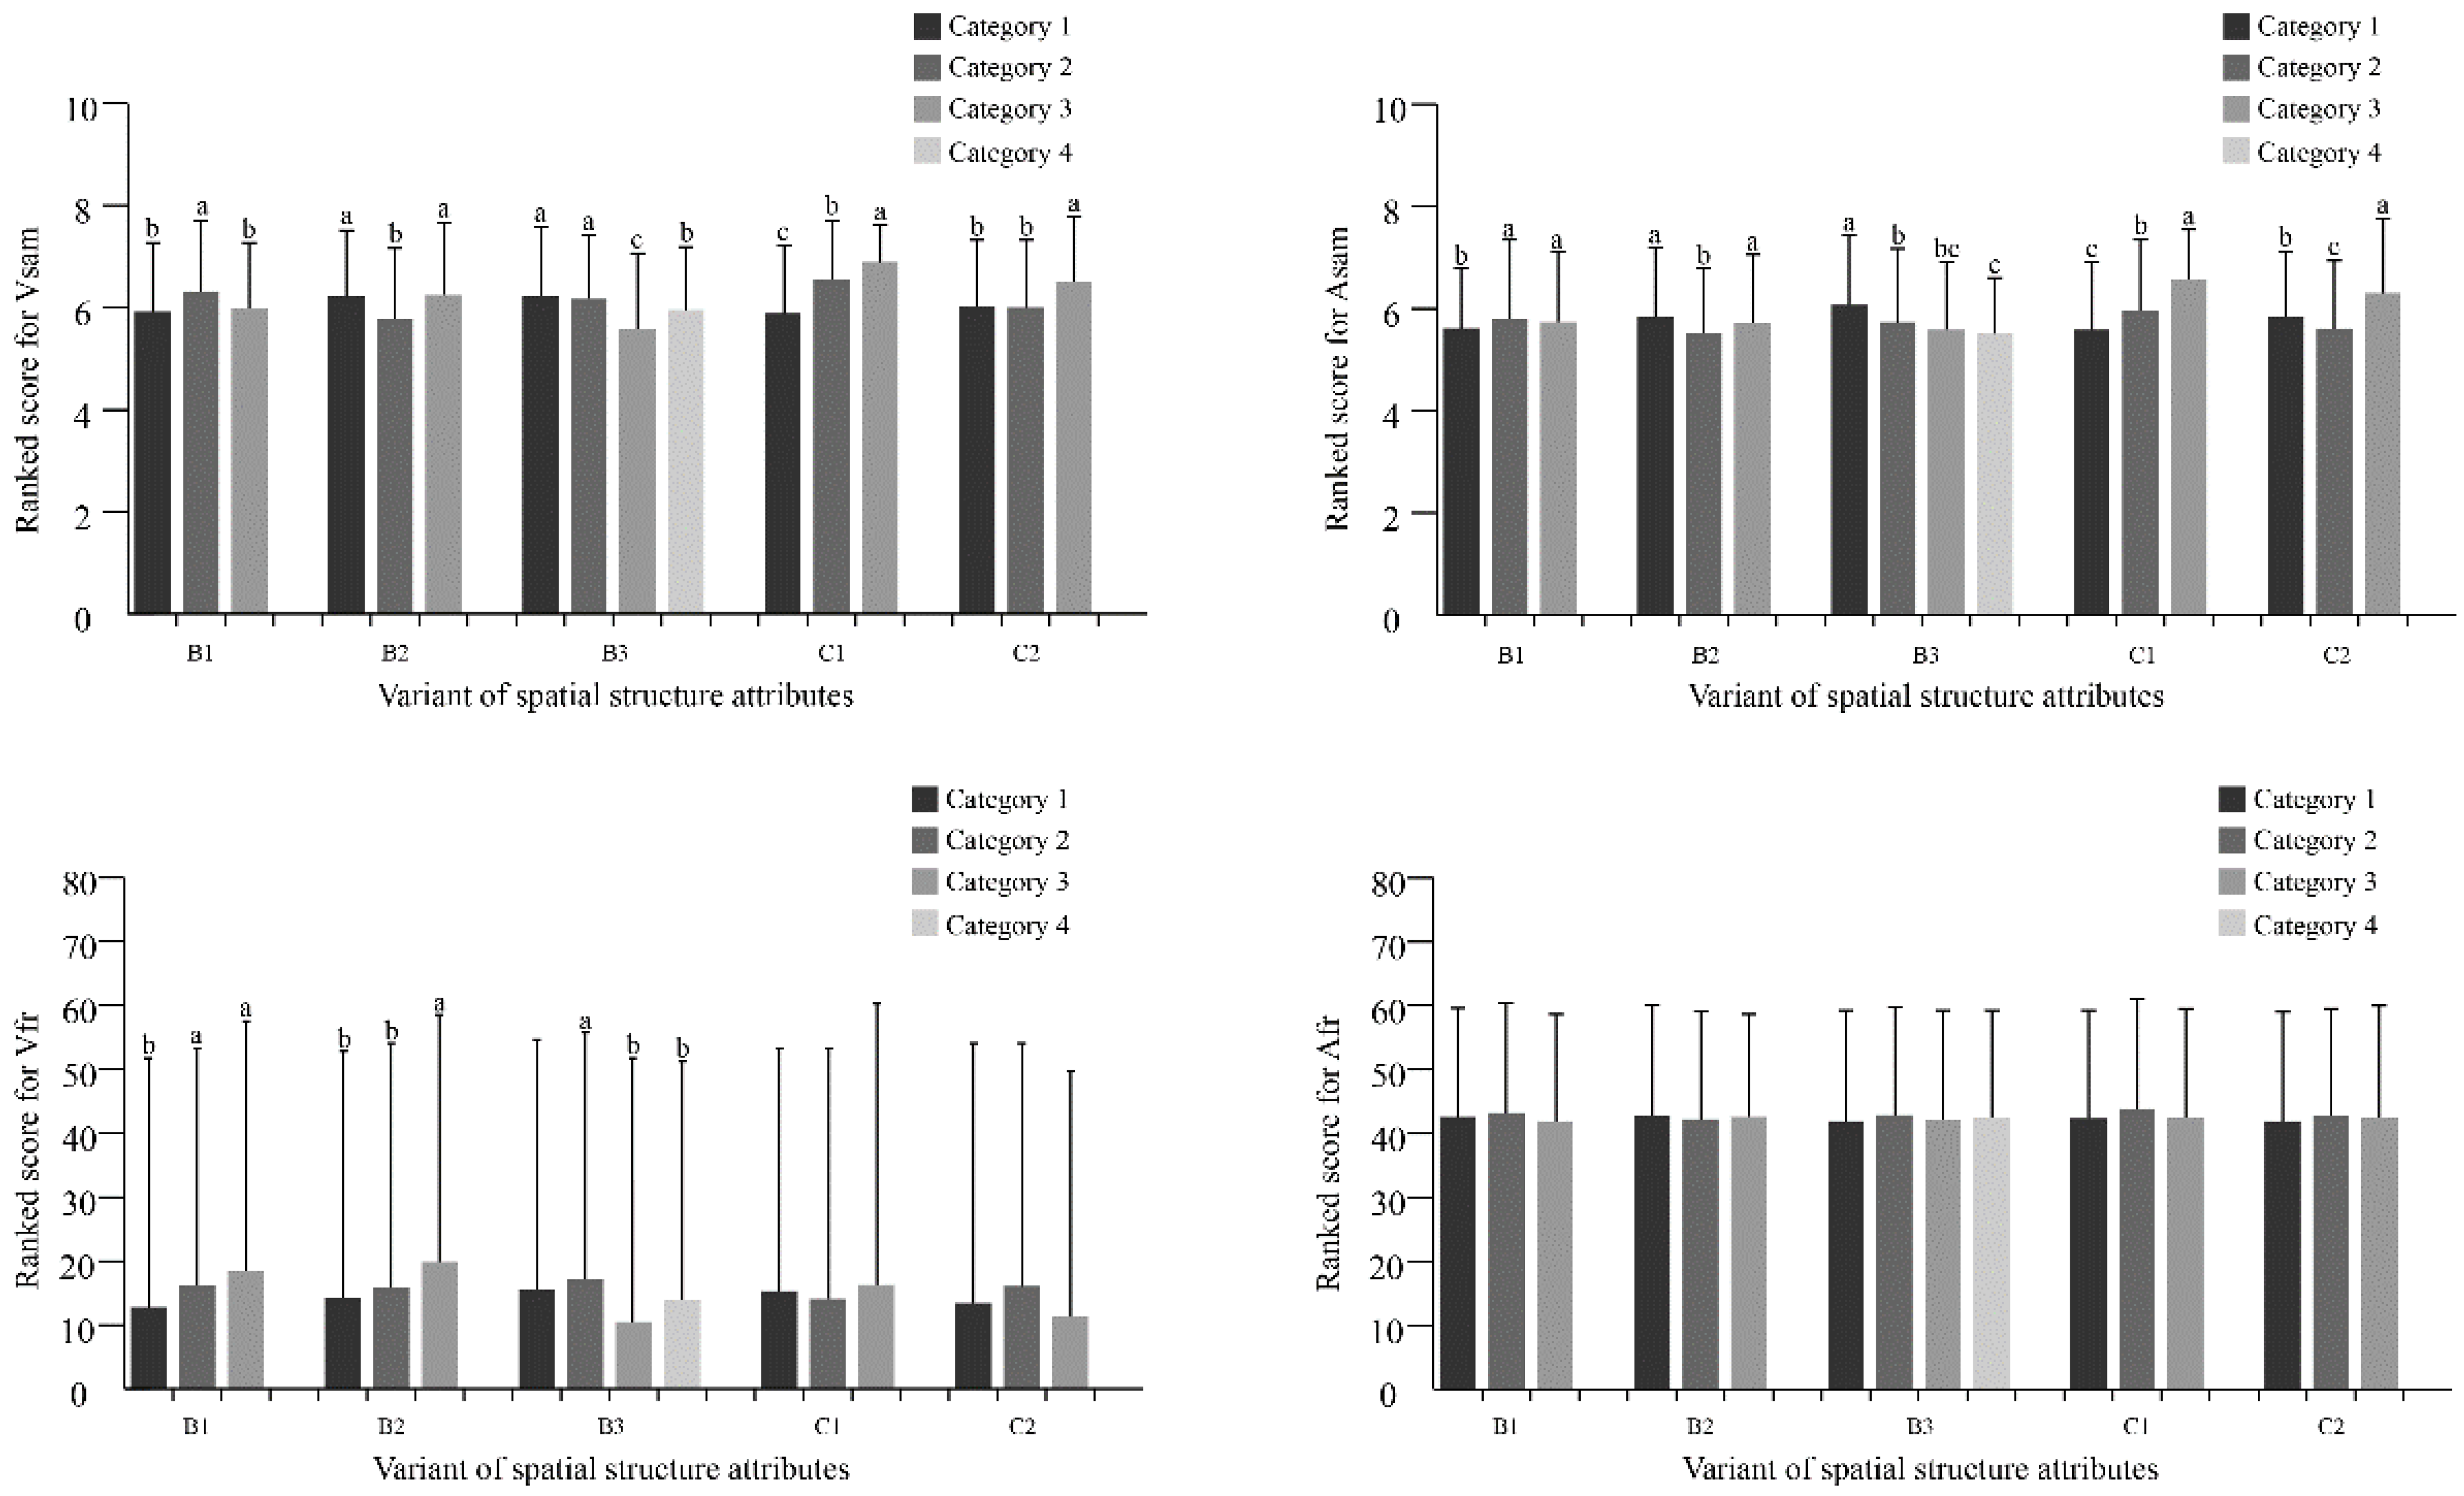
3.3. Effects of the Spatial Structure Attributes of UGSs on Emotional Responses

Our research ranked the quantitatively measured spatial structure attributes according to established standards in Table 1 to perform ANOVA and post hoc analysis. We performed the homogeneity test of variance at the very beginning. If the data conformed to a normal distribution, the LSD method was used for pairwise comparison. Otherwise, we chose the Tamhane method for comparison, as shown in Figure 3 [51].
All related structural factors showed significant differences in Vsam and Asam (Figure 3). The significant heterogeneity of B1 can be observed for emotional responses. As shown in Figure 4, the 0.3-0.8ha2 were rated significantly higher than others in Vsam (F = 40.889, p = 0.000) and Asam (F = 9.297, p = 0.000). And the Vr increased with increasing of the B1(F = 11.652, p = 0.000). In addition, significant differences in Vsam (F = 63.820, p = 0.000) and Asam (F = 34.578, p = 0.000) were found between B2 levels, and the value of B2 from 1.5 to 2.5 conditions was rated significantly lower than others. For B3, Vsam decreased with increasing density (between 20–80%) and then increased slightly at 80%-100% (Figure 4). The Asam of B3 showed a trend of negative correlation as a whole. The main effect of C1 on both Vsam (F = 150.312, p = 0.000) and Asam (F = 100.988, p = 0.000) showed strong consistency. A higher percentage of water often leads to a higher valence and arousal. C2 showed similar conclusions, and the percentage of 80–100% was significantly higher than the others on Vsam and Asam. The face recognition results of ANOVA indicated that the main effects of B1, B2 and B3 on Vfr were significantly different (Figure 3). Post hoc analysis of B1 showed that the comparison result of the average scores of the groups with more obvious differences is “3 > 2 > 1” (F = 11.652, p = 0.000). Similarly, the Vfr on the 3rd rank of B2 was significantly higher than the 1st and 2nd rank (F = 4.269, p = 0.014). Moreover, B3 at 40–60% was considered the most pleasing (F = 6.865, p = 0.000). However, the results of ANOVA indicated that the main effects of spatial structure attributes on Afr were nonsignificant.

3.4. Gender Difference

Independent sample T tests were primarily conducted to show the differences in the participants’ sociodemographic characteristics (Table 4). The P value of the T test for gender was less than 0.01 under the conditions of the two methods, indicating that the valence and arousal values significantly differed by gender. For the V value, the results of Vsam and Vfr both showed higher values for women than men. For the A value, the results of Asam showed that women’s arousal was higher than that of men; nevertheless, Afr results showed that men’s arousal was higher than that of women.

4. Discussion

4.1. Driving Influence of the Spatial Quality Attributes of UGSs on Emotional Responses

The present study identified and described the influence of the spatial quality of UGSs based on emotional assessment dimensions. In this study, we used objective measures of spatial structure attributes, subjective measures of perceived plant attributes, and the experience of UGS to predict people’s emotional responses. The results showed relevant spatial quality that could significantly influence emotions. There are similarities between our findings and earlier research results, and some of these similarities are described above.
We combined spatial quality attributes to predict valence and arousal. The most predictive variable of the likelihood of Vsam was C2, followed by C1. Moreover, C1 was the most predictive attribute of Asam. This result replicates previous findings that trees and water easily draw individuals’ attention. Scenes with a higher percentage of trees and water are conducive to satisfying our biological needs and evoking positive emotional responses [43]. The contributions of D1 and D2 to the regression models were also confirmed. Thus, it is important to consider the activities and goals that drive individuals to visit green spaces [26,52]. In agreement with our expectations, individuals who tend to visit green spaces more frequently are more capable of perceiving their emotional well-being and, consequently, of receiving greater benefits from the green space experience. Note that A4 had a negative effect. This finding is supported by recent research showing that greenness can improve emotional well-being [53]. In other words, variegated colors may seem confused and have negative effects on emotion. The R2 values of Vfr and Afr were low, meaning that apart from the studied attributes, other attributes that were not included in the current study may also affect emotional responses. Our study aims to evaluate the predictive power of each variable, regardless of the degree to which the attribute explains the model.
The design of our study as well as the research questions we attempted to investigate only allow us to sketch the assessment framework for a specific type of UGS spatial quality that possibly contribute to emotional responses, and the environmental indicators may differ in various types of places [54]. We do not try to define a complete set of indicators in this research, and future research is needed to explore a complete series of spatial variables related, to the greatest extent possible, to specific places. The results should not be seen as a limitation of the design process but rather as a guide to understanding some of the spatial qualities of emotional well-being derived from UGS. It will be interesting and important to reconsider which spatial quality contributes to the enhancement of the valence and arousal of UGSs.

4.2. The Relationship between Spatial Structural Attributes and Emotional Responses

With regard to the quality of single attributes, differences were found for every scene. This differentiation indicated that we could perform a multidimensional emotion assessment of UGS, with respect to the given variability of the condition of structural attributes measured quantitatively [13].
The issue of size, usually synonymous with scale, is commonly discussed in landscape architecture and city planning theory. In general, our results support the claim that the higher value of valence was found in the medium to large UGS size. That is, the larger a green space, the more likely it is that a person will promote his/her positive emotion there. However, oversize areas provide more natural space for people, and they may appreciate the tranquility and reflection there, which tended to cause a more inactive emotion [18,55].
The results regarding the shape index of edges were mixed. It is commonly believed that the larger the shape index values are, the richer the spatial hierarchy [24]. Our results showed that the highest Vfr score was found in the scenes representing a scene with a high level of shape complexity. For Vsam and Asam, the lowest and the highest levels of shape complexity caused higher emotion scores compared with the middle level. A possible explanation is that the change in the shape index inevitably affects other structural attributes and spatial configurations, which in turn affects people’s emotions.
Canopy density showed significant differences in the results of the Vfr, Vsam, and Asam models. In terms of Vfr and Vsam, the low- and medium-density canopies had the highest scores. Regarding Asam, the lower the canopy density was, the higher the arousal. Canopy density had a greater impact on the enclosure of green spaces. Kaplan et al. (1989) believed that moderately open scenes were highly preferred [2]. Bjerke et al. (2006) proposed that people were more inclined to open grasses dotted with groups of trees and shrubs [56]. The results may provide some enlightenment to later research; that is, too high a density may exert a negative impact on people’s valence [57].
ANOVA and post hoc analysis investigated the independent contribution of water to emotional response. This research showed that a large percentage of water was rated more positively than scenes with less water in both Vsam and Asam. Overall, this study suggested a positive relationship between water area and emotional responses. The significant contributions of the percentage of water to the spatial quality of UGSs have been mentioned in numerous previous studies. These findings were also confirmed by the abovementioned results of our study. This importance may be because certain visual properties of aquatic environments have been proven to be attractive [43], and the experiences of aquatic environments were thus good for human mental well-being [29,58,59].
The percentage of plants in different scenes constitutes another point of concern. The results presented here suggest that higher tree density means higher Vsam. To ensure a moderate value of Asam, the percentage of plants should be no less than 20%. The same results were found in research by Kang et al. (2019): places where green vegetation is denser seem to exert positive impacts on the degree of human happiness [54]. In addition, season may influence participants’ emotional responses [60]. The pictures were taken in midsummer, and the laboratory experiments were performed at the same time. A higher percentage of plants might be more desirable in the summer because of tree shading or cooling effects. Future studies should explore emotional responses in other seasons.

4.3. Demographic Characteristics

Our research analyzed whether demographic differences played an important role in emotional responses. The results indicated that women experienced a significantly higher valence than men. Thus, the findings suggest that female participants were able to obtain significant valence from exposure to the environment stimuli experience, but male visitors’ expressions were not very sensitive. Our results concur with those in a recent study, which showed that male visitors generally showed neutral emotions in forest environments, while female visitors showed a positive contribution of such scenes to expressional emotions [16]. The results of arousal showed an inconsistent trend. Both biological and social differences between men and women might explain gender differences in emotional responses [17]. We hope that this kind of research will enable planners to focus on individual differences in the public and make urban planning more sophisticated and humane. The current understanding of the emotional responses and demographics of the UGS experience is still limited. More studies are needed to detect the mechanism for the variation of emotional responses in UGSs.

4.4. The Differences between the 2 Emotional Measurement Methods

According to these results, the physiological assessments of emotions do not exactly match the psychological assessments, even for the same attributes. One could ask what different attributes mean with regard to the valence and arousal measured by the two measures. The present results indicate their distinctiveness in that, as described above, each dependent variable has a somewhat different set of indicators, and each indicator mediates relations between emotional responses and UGSs somewhat differently. On the one hand, self-reporting emotions and objectively measured emotions are essentially different emotional attributes. On the other hand, we can interpret such differences as an inability of objective assessment to recognize all subjective characteristics of the emotions expressed on faces [40]. However, the method of self-reporting is simple. As Ulrich (1983) pointed out, the passive intellectual contemplation of a natural setting can be quite beneficial in itself, and therefore, post cognitive emotional responses may themselves be considered a reliable measure [1]. The method of face recognition is more objective, as it allows for real-time and continuous measurement and has been already used in psychological and behavioral studies, and its validity is well established [17,35,55]. Barrett et al. (2019) concluded that even more important than technology development, it is important for scientists to consider emotions in a more complex fashion [61]. In other words, the findings provide professionals with evidence regarding the quantitative indicators to reach moderate levels of emotional response. Nevertheless, the indicator set only contains initial theoretical foundations for moving towards multidimensional, specific and holistic planning guidelines for UGSs.

4.5. Limitations and Future Perspectives

Our approach also has some limitations. First, we tried to capture emotional responses in an experimental setting using simulated environments. Previous studies have shown that the influence of the environment on emotional responses acts on multisensory stimulation, such as visual, auditory, tactile, and olfactory stimulation [51]. The perception of green space among participants may be limited. However, an actual visit to the UGS may not always provide an ‘objective’ or more valid representation, as the physical characteristics of environments depending on the weather, time of the day, season, contingencies and so on, which might dramatically affect the participants’ judgments [56]. Self-evidently, such problems are eliminated when 360° visual simulation techniques are used, and an immersive experience of the environment is presented. Thus, we think that the use of a visual simulation method appropriately matched the objectives of our study. Second, as already mentioned, the results might be affected by the diversity of faces in the trained data sets. Therefore, we used the GAPED as the preintervention measurements of mood to standardize the dataset. In addition, people may not always express emotions explicitly through either facial expressions or text [35,62]. Barrret et al. (2019) found that people do many other things with their faces regardless of whether they are happy or sad [61]. For example, a smile can be mocking or ironic. Further exploration should be conducted to show the connections between human emotions and facial expressions on technology-mediated platforms [54]. A further limitation concerns the size and characteristics of the sample. As the emotional responses of UGSs depend on age, education background, socioeconomic status or other factors, a deep insight into individual differences in evaluating spatial quality of UGSs could merit attention in future research. Last but not least, we recognized that we treated greenspace as a single type of object instead of breaking it down by categories of type. Whilst we advocate the need to not treat greenspace as homogenous spaces, for practicality reasons that green spaces in the West Lake had a significant weight in the total amount of green spaces in Hangzhou, China. Exploring more comprehensive types of urban green spaces and exploring the impact of green space quality on individuals’ emotions is an important aspect for further research [7].

5. Conclusions

With the growing emphasis on the well-designed urban environment, the design of green space to enhance the mental health of people living in cities is of considerable importance. This study is an initial effort to identify the influence of the spatial quality for UGSs on people’s emotional responses. We revealed that a series of spatial qualities, including perceived plant attributes, spatial structure attributes and experiences of UGS, can elicit a range of significantly different valence-arousal emotion values of people. It became evident that no structural attribute is valuable or superfluous per se but that every attribute can be adjusted to promote people’s emotional well-being.
Our findings can help designers make evidence-based decisions about the spatial quality of green spaces that will contribute to the health and wellbeing of the individuals. According to our research, when the size was no less than 0.3 ha2, the positive emotion was enhanced. Canopy density was negatively correlated with the emotional responses, and the valence and arousal were most significant when the value was 40–60%. This shows that the overall crown threshold for the planting of tall trees in UGSs should not be too dense. The emotion value increased as the percentage of plants and water increased, so designers are encouraged to incorporate plant and water elements into UGSs. The shape index of edges was interrelated with the other attributes, designers were encouraged to take them all into account while creating a high-quality UGS.
In terms of comparison between physiological and psychological methods, we found that the face recognition method was capable of assessing participants’ emotional responses to UGSs. The method has achieved objective results in our experiment. There are similarities between our findings and previous research results, indicating that face recognition is effective to some extent. Both physiological and psychological methods are useful, and we recommend combining them in future studies.
The results presented here should be considered with a view to future urban planning, where UGSs can be seen as a resource of importance to public mental health. However, before spatial quality can be used by practitioners as tools to promote health through design and urban planning, more research is needed to investigate a broader set of spatial attributes and improve the accuracy and pertinence of the emotion assessment model in UGS.

Author Contributions

Conceptualization, L.Q. and Y.X.; methodology, L.Q.; formal analysis, L.Q.; investigation, L.Q., J.Z., X.Z., Y.S.; resources, Y.X.; data curation, L.Q.; writing—original draft preparation, L.Q.; writing—review and editing, Y.X.; visualization, L.Q., X.Z.; supervision, Y.X.; project administration, Y.X. All authors have read and agreed to the published version of the manuscript.

Funding

This research received no external funding.

Institutional Review Board Statement

Not applicable.

Informed Consent Statement

Informed consent was obtained from all subjects involved in the study.

Data Availability Statement

The data are not publicly available due to the ongoing research, and the authors will continue to work with it in the future.

Acknowledgments

We are grateful to all respondents to the survey for their kind cooperation, and to members of the Xiatian Garden Studio. in Zhengjiang Univ. for assistance in experiment preparation. And The authors would like to thank all the people who gave up their time to help us including Jia yu Wu, Charrin, Ge Chen, Ming Gao and Qinhong Jiang. We also thank the reviewers for their comments.

Conflicts of Interest

The authors declare no conflict of interest.

Appendix A

Table A1. Descriptive statistics for sample plots.
Plot NumberVsamAsamVfrAfrVegetation LayersShape of TreesTexture of TreesColor DiversityCulture ConnotationSizeShape Index of EdgesCanopy DensityPercentage of WaterPercentage of PlantVisit FrequencyUse Function
16.5295.50016.03344.1063.6473.6473.4713.0003.0590.1162.5001.0000.0000.7963.6472.265
26.8826.55916.20242.3674.0003.9413.4413.4713.3241.2581.3900.5750.2560.5913.6472.971
36.4416.11812.47343.9474.0003.8243.2063.4413.2350.1711.0000.5760.1070.6703.6472.441
45.3825.29414.41943.4222.9713.2942.9712.6472.7940.2521.3201.0000.0000.4553.6472.000
56.5006.29411.21542.3273.6763.8243.5003.0002.7940.3940.6100.3940.0000.8063.6472.971
66.2355.70619.80642.5193.7353.7063.6473.1183.3820.5002.9000.4890.0000.7883.6472.382
75.6185.14719.04442.4833.2653.5003.2352.8242.7941.4081.6700.4140.0000.6123.6471.882
85.7655.6189.47539.6403.8533.5883.2063.2653.2940.1660.7400.8310.0000.5983.6472.000
95.5295.3248.09842.1133.6183.2653.1473.2352.8530.2151.7000.7260.0000.6573.6472.500
105.4415.38218.77740.8903.1473.1762.9712.7942.8530.9001.7900.5100.0000.6563.6472.029
116.6185.76515.65743.5183.9413.6763.4413.1762.9410.6301.0800.4840.1100.6993.6472.588
126.1185.55915.70542.4583.4413.3243.1472.8823.0000.0881.4601.0000.0000.6603.6472.382
135.8825.41217.64344.0633.4123.3533.3533.1762.8530.7751.4100.4440.0000.6033.6472.412
145.6185.82412.67041.8693.5883.3823.0593.2942.8530.0241.9200.6050.0000.7543.6472.000
155.9125.82419.62641.3803.4713.4713.2652.9713.0591.4651.6600.3480.0000.6813.6472.382
Table A2. Short version revised scale for perceived plant attributes.
VariableDescriptionScales
12345
A1. Vegetation LayersWhether the layers of vegetation are abundant
A2. Shape of TreesWhether the shape of trees is beautiful
A3. Texture of TreesWhether the texture of trees is smooth
A4. Color DiversityWhether the UGS is rich in color
A5. Culture ConnotationWhether the UGS is rich in culture connotation
Questionnaire 1. Short-version revised scale for experience of UGS
  • Do you think any factor shown in the video will motivate you to use the scene? (Multiple Choice)
    (1)
    Is the scene soothing? □Yes □No
    (2)
    Is the scene beautiful? □Yes □No
    (3)
    Is the scene relaxing? □Yes □No
    (4)
    Is the scene accessible? □Yes □No
    (5)
    Does the scene provide rich activities? □Yes □No
    (6)
    Does the scene provide a place to stay? □Yes □No
  • ‘How often do you visit the UGSs shown in the videos. (Exclusive Choice)
    • □ almost every day
    • □ 2 or 3 times a week
    • □ 2 or 3 times a month
    • □ 2 or 3 times a quarter
    • □ 2 or 3 times a year
    • □ almost never
Questionnaire 2. SAM scale
1. Please select the degree of pleasure you feel after watching the panoramic video of the scene. The numbers 1, 3, 5, 7 and 9 represent frown (a frowning figure), unhappy, neutral, smiling, and happy (a smiling figure), and 2, 4, 6, 8 are provided you with subtler choices among degrees. Ijerph 18 08526 i001
2. Please select the degree of arousal you feel after watching the panoramic video of the scene. The numbers 1, 3, 5, 7 and 9 indicate sleepy (eyes closed), drowsy, neutral, excited, and stimulation (eyes wide open), and 2, 4, 6, 8 are provided you with subtler choices among degrees. Ijerph 18 08526 i002
Figure A1. 15 horizontal panoramic photos and the website address of 15 360° panoramic videos.
Ijerph 18 08526 g0a1aIjerph 18 08526 g0a1bIjerph 18 08526 g0a1c
http://view.vryun.work/#/panoview/50227 [Online; accessed on 6 August 2021].
http://view.vryun.work/#/panoview/50226 [Online; accessed on 6 August 2021].
Figure A2. The schematic diagram of field measurement methods.
Ijerph 18 08526 g0a2
Figure A3. 4 pictures randomly selected from GAPED 730 pictures.
Ijerph 18 08526 g0a3

References

  1. Ulrich, R.S. View through a window may influence recovery from surgery. Science 1984, 224, 420–421. [Google Scholar] [CrossRef] [Green Version]
  2. Kaplan, R.; Kaplan, S.; Brown, T. Environmental Preference. Environ. Behav. 1989, 21, 509–530. [Google Scholar] [CrossRef] [Green Version]
  3. Berg, A.E.V.D.; Koole, S.L.; van der Wulp, N.Y. Environmental preference and restoration: (How) are they related? J. Environ. Psychol. 2003, 23, 135–146. [Google Scholar] [CrossRef]
  4. Hartig, T.; Böök, A.; Garvill, J.; Olsson, T.; Gärling, T. Environmental influences on psychological restoration. Scand. J. Psychol. 1996, 37, 378–393. [Google Scholar] [CrossRef]
  5. Kondo, M.C.; Fluehr, J.M.; McKeon, T.P.; Branas, C.C. Urban Green Space and Its Impact on Human Health. Int. J. Environ. Res. Public Health 2018, 15, 445. [Google Scholar] [CrossRef] [Green Version]
  6. Ugolini, F.; Massetti, L.; Calaza-Martínez, P.; Cariñanos, P.; Dobbs, C.; Ostoić, S.K.; Marin, A.M.; Pearlmutter, D.; Saaroni, H.; Šaulienė, I.; et al. Effects of the COVID-19 pandemic on the use and perceptions of urban green space: An international exploratory study. Urban For. Urban Green. 2020, 56, 126888. [Google Scholar] [CrossRef] [PubMed]
  7. Cheng, Y.; Zhang, J.; Wei, W.; Zhao, B. Effects of urban parks on residents’ expressed happiness before and during the COVID-19 pandemic. Landsc. Urban Plan. 2021, 212, 104118. [Google Scholar] [CrossRef]
  8. Ciupa, T.; Suligowski, R. Green-Blue Spaces and Population Density versus COVID-19 Cases and Deaths in Poland. Int. J. Environ. Res. Public Health 2021, 18, 6636. [Google Scholar] [CrossRef] [PubMed]
  9. Lu, Y.; Chen, L.; Liu, X.; Yang, Y.; Sullivan, W.C.; Xu, W.; Webster, C.; Jiang, B. Green spaces mitigate racial disparity of health: A higher ratio of green spaces indicates a lower racial disparity in SARS-CoV-2 infection rates in the USA. Environ. Int. 2021, 152, 106465. [Google Scholar] [CrossRef]
  10. Capaldi, C.; Dopko, R.L.; Zelenski, J.M. The relationship between nature connectedness and happiness: A meta-analysis. Front. Psychol. 2014, 5, 976. [Google Scholar] [CrossRef] [Green Version]
  11. Brindley, P.; Cameron, R.W.; Ersoy, E.; Jorgensen, A.; Maheswaran, R. Is more always better? Exploring field survey and social media indicators of quality of urban greenspace, in relation to health. Urban For. Urban Green. 2019, 39, 45–54. [Google Scholar] [CrossRef]
  12. Annerstedt, M.; Östergren, P.-O.; Björk, J.; Grahn, P.; Skärbäck, E.; Währborg, P. Green qualities in the neighbourhood and mental health—results from a longitudinal cohort study in Southern Sweden. BMC Public Health 2012, 12, 337. [Google Scholar] [CrossRef] [PubMed] [Green Version]
  13. Daniels, B.; Zaunbrecher, B.S.; Paas, B.; Ottermanns, R.; Ziefle, M.; Roß-Nickoll, M. Assessment of urban green space structures and their quality from a multidimensional perspective. Sci. Total. Environ. 2018, 615, 1364–1378. [Google Scholar] [CrossRef]
  14. Chen, S.; Sleipness, O.; Xu, Y.; Park, K.; Christensen, K. A systematic review of alternative protocols for evaluating non-spatial dimensions of urban parks. Urban For. Urban Green. 2020, 53, 126718. [Google Scholar] [CrossRef]
  15. Zhang, X.; Melbourne, S.; Sarkar, C.; Chiaradia, A.; Webster, C. Effects of green space on walking: Does size, shape and density matter? Urban Stud. 2020, 57, 3402–3420. [Google Scholar] [CrossRef]
  16. Wei, H.; Hauer, R.J.; Chen, X.; He, X. Facial Expressions of Visitors in Forests along the Urbanization Gradient: What Can We Learn from Selfies on Social Networking Services? Forests 2019, 10, 1049. [Google Scholar] [CrossRef] [Green Version]
  17. Ma, Y.; Ling, C.; Wu, J. Exploring the Spatial Distribution Characteristics of Emotions of Weibo Users in Wuhan Waterfront Based on Gender Differences Using Social Media Texts. ISPRS Int. J. Geo-Inf. 2020, 9, 465. [Google Scholar] [CrossRef]
  18. Huynh, Q.; Craig, W.; Janssen, I.; Pickett, W. Exposure to public natural space as a protective factor for emotional well-being among young people in Canada. BMC Public Health 2013, 13, 407. [Google Scholar] [CrossRef] [Green Version]
  19. Lai, K.Y.; Sarkar, C.; Sun, Z.; Scott, I. Are greenspace attributes associated with perceived restorativeness? A comparative study of urban cemeteries and parks in Edinburgh, Scotland. Urban For. Urban Green. 2020, 53, 126720. [Google Scholar] [CrossRef]
  20. Zhang, L.; Tan, P.Y. Associations between Urban Green Spaces and Health are Dependent on the Analytical Scale and How Urban Green Spaces are Measured. Int. J. Environ. Res. Public Health 2019, 16, 578. [Google Scholar] [CrossRef] [Green Version]
  21. Yang, L.; Ho, J.Y.; Wong, F.K.; Chang, K.K.; Chan, K.L.; Wong, M.S.; Ho, H.C.; Yuen, J.W.; Huang, J.; Siu, J.Y. Neighbourhood green space, perceived stress and sleep quality in an urban population. Urban For. Urban Green. 2020, 54, 126763. [Google Scholar] [CrossRef]
  22. Paraskevopoulou, A.T.; Kamperi, E.; Demiris, N.; Economou, M.; Theleritis, C.; Kitsonas, M.; Papageorgiou, C.; Papageorgiou, C. The impact of seasonal colour change in planting on patients with psychotic disorders using biosensors. Urban For. Urban Green. 2018, 36, 50–56. [Google Scholar] [CrossRef]
  23. Rahnema, S.; Sedaghathoor, S.; Allahyari, M.S.; Damalas, C.A.; El Bilali, H. Preferences and emotion perceptions of ornamental plant species for green space designing among urban park users in Iran. Urban For. Urban Green. 2019, 39, 98–108. [Google Scholar] [CrossRef]
  24. Ode, Å.; Fry, G.; Tveit, M.S.; Messager, P.; Miller, D. Indicators of perceived naturalness as drivers of landscape preference. J. Environ. Manag. 2009, 90, 375–383. [Google Scholar] [CrossRef]
  25. Van den Berg, A.E.; Jorgensen, A.; Wilson, E.R. Evaluating restoration in urban green spaces: Does setting type make a difference? Landsc. Urban Plan. 2014, 127, 173–181. [Google Scholar] [CrossRef]
  26. Soga, M.; Yamaura, Y.; Aikoh, T.; Shoji, Y.; Kubo, T.; Gaston, K.J. Reducing the extinction of experience: Association between urban form and recreational use of public greenspace. Landsc. Urban Plan. 2015, 143, 69–75. [Google Scholar] [CrossRef]
  27. Yessoufou, K.; Sithole, M.; Elansary, H.O. Effects of urban green spaces on human perceived health improvements: Provision of green spaces is not enough but how people use them matters. PLoS ONE 2020, 15, e0239314. [Google Scholar] [CrossRef]
  28. Veen, E.J.; Ekkel, E.D.; Hansma, M.R.; De Vrieze, A.G.M. Designing Urban Green Space (UGS) to Enhance Health: A Methodology. Int. J. Environ. Res. Public Health 2020, 17, 5205. [Google Scholar] [CrossRef]
  29. Polat, A.T.; Akay, A. Relationships between the visual preferences of urban recreation area users and various landscape design elements. Urban For. Urban Green. 2015, 14, 573–582. [Google Scholar] [CrossRef]
  30. Hoyle, H.; Hitchmough, J.; Jorgensen, A. All about the ‘wow factor’? The relationships between aesthetics, restorative effect and perceived biodiversity in designed urban planting. Landsc. Urban Plan. 2017, 164, 109–123. [Google Scholar] [CrossRef]
  31. Zhang, Y.; Berg, A.E.V.D.; Van Dijk, T.; Weitkamp, G. Quality over Quantity: Contribution of Urban Green Space to Neighborhood Satisfaction. Int. J. Environ. Res. Public Health 2017, 14, 535. [Google Scholar] [CrossRef]
  32. Sun, K.; Yu, J.; Huang, Y.; Hu, X. An improved valence-arousal emotion space for video affective content representation and recognition. In Proceedings of the 2009 IEEE International Conference on Multimedia and Expo, New York, NY, USA, 28 June–3 July 2009; pp. 566–569. [Google Scholar]
  33. Hadinejad, A.; Moyle, B.D.; Kralj, A.; Scott, N. Physiological and self-report methods to the measurement of emotion in tourism. Tour. Recreat. Res. 2019, 44, 466–478. [Google Scholar] [CrossRef]
  34. Li, S.; Scott, N.; Walters, G. Current and potential methods for measuring emotion in tourism experiences: A review. Curr. Issues Tour. 2014, 18, 805–827. [Google Scholar] [CrossRef]
  35. Meng, Q.; Hu, X.; Kang, J.; Wu, Y. On the effectiveness of facial expression recognition for evaluation of urban sound perception. Sci. Total. Environ. 2020, 710, 135484. [Google Scholar] [CrossRef] [PubMed]
  36. Bradley, M.M.; Lang, P.J. Measuring emotion: The self-assessment manikin and the semantic differential. J. Behav. Ther. Exp. Psychiatry 1994, 25, 49–59. [Google Scholar] [CrossRef]
  37. Yu, Z.; Zhang, C. Image based Static Facial Expression Recognition with Multiple Deep Network Learning. In Proceedings of the 2015 ACM on International Conference on Multimodal Interaction; ACM: New York, NY, USA, 2015; pp. 435–442. [Google Scholar]
  38. Masi, I.; Wu, Y.; Hassner, T.; Natarajan, P. Deep Face Recognition: A Survey. In Proceedings of the 2018 31st SIBGRAPI Conference on Graphics, Patterns and Images (SIBGRAPI), Paraná, Brazil, 29 October–1 November 2018; pp. 471–478. [Google Scholar]
  39. Svoray, T.; Dorman, M.; Shahar, G.; Kloog, I. Demonstrating the effect of exposure to nature on happy facial expressions via Flickr data: Advantages of non-intrusive social network data analyses and geoinformatics methodologies. J. Environ. Psychol. 2018, 58, 93–100. [Google Scholar] [CrossRef]
  40. Do, N.-T.; Nguyen-Quynh, T.-T.; Kim, S.-H. Affective Expression Analysis in-the-wild using Multi-Task Temporal Statistical Deep Learning Model. In Proceedings of the 2020 15th IEEE International Conference on Automatic Face and Gesture Recognition (FG 2020), Buenos Aires, Argentina, 23 November 2020; pp. 624–628. [Google Scholar]
  41. Vartanov, A.; Ivanov, V.; Vartanova, I. Facial expressions and subjective assessments of emotions. Cogn. Syst. Res. 2019, 59, 319–328. [Google Scholar] [CrossRef]
  42. Fisher, J.C.; Irvine, K.N.; Bicknell, J.E.; Hayes, W.M.; Fernandes, D.; Mistry, J.; Davies, Z.G. Perceived biodiversity, sound, naturalness and safety enhance the restorative quality and wellbeing benefits of green and blue space in a neotropical city. Sci. Total. Environ. 2021, 755, 143095. [Google Scholar] [CrossRef]
  43. Wang, R.; Zhao, J.; Meitner, M.J.; Hu, Y.; Xu, X. Characteristics of urban green spaces in relation to aesthetic preference and stress recovery. Urban For. Urban Green. 2019, 41, 6–13. [Google Scholar] [CrossRef]
  44. Cai, Q.; Yang, Z.; Wang, Y.; Gao, C. Study on Plant Perception Influencing Factors and Value Recognition. Chinese Landsc. Archit. 2019, 35, 112–116. [Google Scholar] [CrossRef]
  45. Nordh, H.; Hartig, T.; Hagerhall, C.; Fry, G. Components of small urban parks that predict the possibility for restoration. Urban For. Urban Green. 2009, 8, 225–235. [Google Scholar] [CrossRef]
  46. Jiang, B.; Chang, C.-Y.; Sullivan, W.C. A dose of nature: Tree cover, stress reduction, and gender differences. Landsc. Urban Plan. 2014, 132, 26–36. [Google Scholar] [CrossRef]
  47. Backs, R.W.; Da Silva, S.P.; Han, K. A Comparison of Younger and Older Adults’ Self-Assessment Manikin Ratings of Affective Pictures. Exp. Aging Res. 2005, 31, 421–440. [Google Scholar] [CrossRef]
  48. Chen, J.-M.; Chang, P.-C.; Liang, K.-W. Speech Emotion Recognition Based on Joint Self-Assessment Manikins and Emotion Labels. In Proceedings of the 2019 IEEE International Symposium on Multimedia (ISM), Thessaloniki, Greece, 8–11 January 2019; pp. 327–3273. [Google Scholar]
  49. Xie, T.; Cao, M.; Pan, Z.-G. Applying Self-Assessment Manikin (SAM) to Evaluate the Affective Arousal Effects of VR Games. In Proceedings of the 2020 3rd International Conference on Image and Graphics Processing, Association for Computing Machinery (ACM). Singapore, 8–10 February 2020; pp. 134–138. [Google Scholar]
  50. Dan-Glauser, E.S.; Scherer, K.R. The Geneva affective picture database (GAPED): A new 730-picture database focusing on valence and normative significance. Behav. Res. Methods 2011, 43, 468–477. [Google Scholar] [CrossRef] [PubMed]
  51. Deng, L.; Luo, H.; Ma, J.; Huang, Z.; Sun, L.-X.; Jiang, M.-Y.; Zhu, C.-Y.; Li, X. Effects of integration between visual stimuli and auditory stimuli on restorative potential and aesthetic preference in urban green spaces. Urban For. Urban Green. 2020, 53, 126702. [Google Scholar] [CrossRef]
  52. Huerta, C.M.; Utomo, A. Evaluating the association between urban green spaces and subjective well-being in Mexico city during the COVID-19 pandemic. Health Place 2021, 70, 102606. [Google Scholar] [CrossRef]
  53. Akers, A.; Barton, J.; Cossey, R.; Gainsford, P.; Griffin, M.; Micklewright, D. Visual Color Perception in Green Exercise: Positive Effects on Mood and Perceived Exertion. Environ. Sci. Technol. 2012, 46, 8661–8666. [Google Scholar] [CrossRef]
  54. Kang, Y.; Jia, Q.; Gao, S.; Zeng, X.; Wang, Y.; Angsuesser, S.; Liu, Y.; Ye, X.; Fei, T. Extracting human emotions at different places based on facial expressions and spatial clustering analysis. Trans. GIS 2019, 23, 450–480. [Google Scholar] [CrossRef]
  55. Wood, L.; Hooper, P.; Foster, S.; Bull, F. Public green spaces and positive mental health—investigating the relationship between access, quantity and types of parks and mental wellbeing. Health Place 2017, 48, 63–71. [Google Scholar] [CrossRef]
  56. Bjerke, T.; Østdahl, T.; Thrane, C.; Strumse, E. Vegetation density of urban parks and perceived appropriateness for recreation. Urban For. Urban Green. 2006, 5, 35–44. [Google Scholar] [CrossRef]
  57. Zhu, X.; Gao, M.; Zhao, W.; Ge, T. Does the Presence of Birdsongs Improve Perceived Levels of Mental Restoration from Park Use? Experiments on Parkways of Harbin Sun Island in China. Int. J. Environ. Res. Public Health 2020, 17, 2271. [Google Scholar] [CrossRef] [Green Version]
  58. White, M.; Smith, A.; Humphryes, K.; Pahl, S.; Snelling, D.; Depledge, M. Blue space: The importance of water for preference, affect, and restorativeness ratings of natural and built scenes. J. Environ. Psychol. 2010, 30, 482–493. [Google Scholar] [CrossRef]
  59. Chen, Y.; Yuan, Y. The neighborhood effect of exposure to blue space on elderly individuals’ mental health: A case study in Guangzhou, China. Health Place 2020, 63, 102348. [Google Scholar] [CrossRef] [PubMed]
  60. Zhao, J.; Xu, W.; Li, R. Visual preference of trees: The effects of tree attributes and seasons. Urban For. Urban Green. 2017, 25, 19–25. [Google Scholar] [CrossRef]
  61. Barrett, L.F.; Adolphs, R.; Marsella, S.; Martinez, A.M.; Pollak, S.D. Emotional expressions reconsidered: Challenges to in-ferring emotion from human facial movements. Psychol. Sci. Public Interest. 2019, 20, 1–68. [Google Scholar] [CrossRef] [PubMed] [Green Version]
  62. González-Rodríguez, M.; Díaz-Fernández, M.; Gómez, C.P. Facial-expression recognition: An emergent approach to the measurement of tourist satisfaction through emotions. Telemat. Inform. 2020, 51, 101404. [Google Scholar] [CrossRef]
Figure 1. The locations and 360° panoramic photos of the 15 study sites in Hangzhou, China.
Ijerph 18 08526 g001
Figure 2. Preparation and experimental procedure.
Ijerph 18 08526 g002
Figure 3. Post hoc test of the spatial structure attributes; Significant difference at the 0.05 level is shown by different letters (a, b and c).
Ijerph 18 08526 g003
Figure 4. The extent of emotional responses differences of spatial structure attributes across the categories of scenes. Note: See Table 1 for the full abbreviations.
Ijerph 18 08526 g004
Table 1. Scale of spatial quality for sample plots.
AttributesVariableDescriptionCategories
123456
Emotion DimensionsVsamValence measured by SAM scale
AsamArousal measured by SAM scale
VfrValence measured by Face recognition
AfrArousal measured by Face recognition
Perceived Plant AttributesA1. Vegetation LayersWhether the layers of vegetation are abundant
A2. Shape of TreesWhether the shape of trees is beautiful
A3. Texture of TreesWhether the tactile sense of trees is smooth
A4. Color DiversityWhether the UGS is rich in color
A5. Culture ConnotationWhether the UGS is rich in culture atmosphere
Spatial Structure AttributesB1. SizeArea of urban green space<0.3000.300–0.800>0.800
B2. Shape Index of EdgesThe ratio of the actual length of the space boundary to the circumference of the same area<1.5001.500–2.500>2.500
B3. Canopy densityThe ratio of the total crown width of the tree to the total area of the urban green space0.200–0.4000.400–0.6000.600–0.8000.800–1.000
C1. Percentage of WaterThe number of water pixels in each of the panoramic photo0.000–0.1000.100–0.2000.200–0.300
C2. Percentage of PlantsThe number of plant pixels in each of the panoramic photo0.000–0.20000.200–0.4000.400–0.6000.600–0.8000.800–1.000
Experiences of Urban Green Space D1. Visit FrequencyThe frequency you visit the UGSsAlmost Everyday2 or 3 Times a Week2 or 3 Times a Month2 or 3 Times a Quarter2 or 3 Times a YearAlmost Never
D2. Use FunctionThe factors shown in the video that motivate you to useSoothing or NotBeautiful or NotRelaxing or NotPassable or NotLively or NotStationary or Not
Table 2. Descriptive statistics and Pearson’s rho correlation analysis of the spatial quality attributes.
VariableMin.Max.MS.D.VsamAsamVfrAfr
A1153.5840.8090.562 **0.538 **−0.057 **0.013
A2153.5310.8440.602 **0.599 **−0.049 **0.012
A3153.2710.8130.511 **0.512 **−0.0230.022
A4153.0860.9060.383 **0.399 **−0.094 **−0.025 *
A5153.0060.8820.440 **0.423 **−0.096 **0.021
B10.0241.4650.5770.0000.0130.0180.060 **−0.009
B20.6102.9001.5430.585−0.030 *−0.082 **0.047 **0.010
B30.3501.0000.6260.222−0.038 **−0.076 **−0.032 *0.006
C10.0000.2560.0310.0700.212 **0.179 **0.0010.013
C20.4550.8060.6680.0900.136 **0.078 **0.0020.004
D1063.6470.8710.434 **0.382 **0.0070.040 **
D2062.3471.428−0.017−0.0110.121 **0.155 **
Note. We report Pearson correlations. * p ≤ 0.05 (1-tailed). ** p ≤ 0.01 (2-tailed).
Table 3. Linear regression analysis of the spatial quality and emotional responses.
DependentIndependentUnstandardized BetatSig.Collinearity Statistics
BStandard ErrorToleranceVIF
Vsam r2 = 0.497
(F = 670.019, p = 0.000)
A10.4650.02121.9660.0000.6051.654
A20.4700.02320.7900.0000.4892.045
A30.3180.02214.7140.0000.5761.737
A4−0.1330.020−6.6550.0000.5431.842
A50.1450.0217.0100.0000.5301.887
B30.2950.0644.6200.0000.8841.131
C12.0560.20410.0550.0000.8601.163
C21.1320.1607.0630.0000.8471.181
D20.1530.01114.2610.0000.7581.319
Asam r2 = 0.461
(F = 579.961, p = 0.000)
A10.4380.02220.0150.0000.6181.618
A20.5240.02422.2030.0000.4882.049
A30.3520.02315.6010.0000.5741.742
A4−0.0440.021−2.1010.0360.5421.845
A50.0900.0224.1420.0000.5271.896
B2−0.1260.025−5.1140.0000.9251.082
B3−0.1060.064−1.6660.0960.9641.038
C10.7200.2113.4060.0010.8761.141
D20.0830.0117.4330.0000.7571.320
Vfr r2 = 0.020
(F = 20.409, p = 0.000)
A4−2.1620.843−3.8230.0100.5951.681
A5−5.0070.900−5.7030.0000.5501.817
B13.2391.2314.1920.0090.9951.005
B22.7571.0143.6490.0070.9861.014
D13.6800.6799.0620.0000.9941.006
Afr r2= 0.019
(F = 40.537, p = 0.000)
A4−0.5140.307−1.6740.0940.8551.170
D13.0930.29710.4110.0000.9861.014
D20.4300.1952.2070.0270.8531.172
Note: See Table 1 for the full abbreviations.
Table 4. Independent sample T tests of gender differences.
Dependent GenderMS.D.Sig.
VsamMale5.9291.3960.000 **
Female6.1221.524
VfrMale12.49938.6270.000 **
Female17.45539.858
AsamMale5.5791.4030.000 **
Female5.7851.539
AfrMale44.31917.1690.000 **
Female40.83417.790
Note. We report ** p ≤ 0.01 (2-tailed).
Publisher’s Note: MDPI stays neutral with regard to jurisdictional claims in published maps and institutional affiliations.

