Article

The Bibliometric Literature on Scopus and WoS: The Medicine and Environmental Sciences Categories as Case of Study

by
Mila Cascajares
1,
Alfredo Alcayde
1,
Esther Salmerón-Manzano
2,* and
Francisco Manzano-Agugliaro
1
1
Department of Engineering, University of Almeria, ceiA3, 04120 Almeria, Spain
2
Faculty of Law, Universidad Internacional de La Rioja (UNIR), Av. de la Paz, 137, 26006 Logroño, Spain
*
Author to whom correspondence should be addressed.
Int. J. Environ. Res. Public Health 2021, 18(11), 5851; https://doi.org/10.3390/ijerph18115851
Submission received: 24 April 2021 / Revised: 25 May 2021 / Accepted: 27 May 2021 / Published: 29 May 2021
(This article belongs to the Special Issue Health Environment and Sustainable Development)

Abstract

:
In a broad sense, science can be understood as the knowledge contained in scientific manuscripts published in scientific journals. Scientific databases index only those journals that reach certain quality standards. Therefore, research and dissemination of scientific knowledge are essential activities for the growth of science itself. The aim of this manuscript is to assess the situation of medicine and environmental sciences among the bibliometric literature and to put it in perspective with the overall bibliometric publications in all scientific fields. The main countries publishing bibliometric manuscripts are China, USA and Spain. The latter country is ranked three out of the top five institutions according to the Scopus and WoS databases. In both databases, the average scientific collaboration of the top 20 institutions offers the same result, 41%. According to Scopus, the main subject categories in which this research falls are social sciences (38%), computer science (26%) and medicine (23%), while the environmental sciences category has 8%. In the analysis of the Medicine category alone, it has been observed that 136 countries have contributions in this field. The main countries are the United States, China and the United Kingdom. In the field of medicine, the main areas studied were: Epidemiology, Pediatrics, Orthopedics, Cardiology, Neurosurgery, Radiology, Ophthalmology, Oncology, Plastic Surgery and Psychiatry. With respect to environmental sciences, less international dissemination has been found, with only 83 countries having worked in this field. The main ones are China, Spain and the United States. Regarding the top 10 institutions, it can be stated that only Spain and China are relevant. Spain focuses on sustainability and China on the environment. The result of an independent keyword analysis of all published bibliometric manuscripts has shown that the main clusters are: Mapping Science (29%), Research Productivity (23%), Medicine (20%), Environmental Sciences (12%), Psychology (7%), Nursing (6%) and Engineering (4%). In short, medicine and environmental sciences are the most relevant areas in the field of bibliometrics after social sciences and computer sciences.

1. Introduction

Bibliometrics, as a science-related discipline, aims to provide a set of tools for the assessment of scientific production. From its origin at the beginning of the 20th century to the present day, bibliometric studies have focused on different points of view. In 1917 Cole and Eales carried out the first bibliometric study through the statistical analysis of publications on comparative anatomy [1], thus initiating the use of bibliometrics for the measurement of scientific activity. Following this same approach, in 1926 Lotka focused his work on analyzing the scientific production of researchers with the so-called Lotka’s Law of Productivity, a law that determines that the greatest number of authors publish the least number of publications, while the least number of authors publish the greatest number of publications [2]. In 1956, Price formulated the Law of Exponential Growth of Scientific Information, stating that it grows at a much faster rate than other social processes. Price also states that the scientific literature loses relevance more rapidly, although not in a uniform manner depending on the different disciplines. Thus, while in the experimental sciences and technology the growth in number of publications is greater and faster, their decline is more rapid, in contrast to the behavior found in the humanities and social sciences. Later, it was in 1963 when Price introduced a new element in the development of bibliometrics by relating the growth of science to scientific communication [3].
A second aspect of bibliometrics is oriented to the analysis of the publications’ references in the scientific literature. Thus, in 1927 Gross and Gross made the first count of references appearing in the Journal of the American Chemical Society to study the frequency of their appearance and the sources of their origin, applying the study to the selection of the list of subscriptions of interest [4]. In 1934 Bradford analyzed the distribution of articles in journals by formulating Bradford’s Law of Dispersion, according to which it was evident that a small number of journals accounted for the largest percentage of the bibliography of a specific topic [5]. If scientific journals are arranged in decreasing order of productivity of articles on a given subject, one can distinguish a core of journals more specialized in that subject and several groups containing approximately the same core but distributed in an increasing number of journals. It can be understood as the background of the classification of journals by scientific categories.
The third point of view focuses on the analysis of the impact and visibility of research through citation activity. As early as 1873 Shepard developed a citation index following the codification applied to federal court judgments in the United States. However, it was not until 1936 that Cason and Lubotky created for the first time a citation network, identifying the links between psychology journals [6]. However, undoubtedly, the precursor of citation analysis is Garfield, who published in 1955 in the Science journal the proposal for a citation index [7], based on Sherpad’s concept, which made it possible to relate an article to other articles citing it. In this way it was possible to assess the significance of a research paper and its impact, and for researchers to know how their publications were being used. This is the renowned Science Citation Index (SCI) created by Garfield himself from the ISI (Institute for Scientific Information). In the early 1960s, Garfield and Sher designed the Impact Factor.
The purpose of the Impact Factor was to be the methodological instrument for selecting the journals that belong to the Science Citation Index, since it was unfeasible to include all the existing scientific journals in it. Years later, in addition to the Science Citation Index (focused on Experimental and Technological Sciences), it created the Social Science Citation Index (oriented to the Social Sciences) and the Arts and Humanities Citation Index (AHCI) for the Arts and Humanities. These three databases have been a milestone in bibliometrics and have become benchmarks in the evaluation of publications, researchers, and institutions. They are part of the Web of Science database platform, originally known as ISI Web of Knowledge and currently owned by Clarivate Analytics.
Although they have been the main benchmark since the 1960s, based also on the relationship that Garfield established in 1979 between the nature of the research and its potential to be cited, they have nevertheless been the focus of multiple criticisms [8]. Earlier in 1976 Pinski and Narin warned of the bias in favor of reviews, which tend to have a higher impact factor and in the calculation of the impact factor all citations are weighted equally [9]. To correct this deviation, they suggest the “influence methodology”, giving each journal a weight regardless of its size. As early as 1986 Tomer thought that “There is no distinction in regard to the nature and merits of the citing journals” [10]. These disagreements have been ongoing for a long time, and they are still relevant today.
For example, in 2001 Tijssen, Visser and Van Leeuwen questioned citation analysis as a measure of research quality since the influence of citation varies in different disciplines, showing considerable differences [11]. Today, shortcomings such as asymmetry between numerator and denominator, differences between disciplines, insufficient citation window and asymmetry of underlying citation distributions has also been analyzed by Larivière and Sugimoto in 2019 [12].
The JCR Impact Factor (SCI, SSCI) is not the only metric that measures the impact factor. The SJR (Scimago Journal Rank), shows the visibility of the journals contained in Scopus since 1996. This metric applies not only to journals, but also to book series and conference proceedings. Based on citations, it shows the quality and reputation of the journal in thematic fields, computing the citations received to articles of a journal for a period of three years, giving a greater weight to citations coming from high reputed journals. The SJR index attempts to correct for these deviations by weighting links based on citation proximity, extending the number of years considered in the citation and setting thresholds for self-citation within the journal itself [13].
By the end of 2016 [14], Scopus establishes a new metric index, the CiteScore, which extends the range of citation years (4 years), but by including all types of documents; on the one hand, it eliminates the differences between the different types of documents, although on the other hand some critics state that this index benefits Elsevier publications, which tend to publish a lower proportion of articles than other publishers [15].
Additionally, as a last novelty, there is the transition of the impact factor computation with respect to the date of online publication and not the date of print publication, as until now. In the current system, there are journals that have up to more than a year to publish the article online so that it can obtain citations, and when it is published in print, its number of citations is higher than those of other journals. Therefore, there is a trend towards a model in which the online publication date will be considered for the computation of the Journal Impact Factor (JIF) [16].
This change implies a problem for databases that do not have an online publication date. Web of Science Core Collection has begun to index online-first articles since December 2017 [17]. For example, in the case of Web of Science, half of the journals indexed lack this data [16]. If a publication is published online in the same year as in print, there is no mismatch since the JIF is from the same year. This is not the case for journals published online in one year and in print in another. Clarivate is considering the effects of adopting two new counting models: one pre-2020 and one post-2020 [18].
Thus far, bibliometrics has progressed from its origins to the present day. At present, there is a significant increase in the number of publications on this discipline, closely linked to the exponential growth of science. This trend has been classified into three major approaches [19]:
  • Bibliometric performance studies on authorship and production: they focus on analyzing the profiles of authors according to elements such as their affiliation, country, and the production of articles, examining which are the most cited or relevant;
  • Bibliometric studies on topics: they focus on the main topics dealt with, as well as their relationships or evolution in a specific topic;
  • Studies on research methodologies: they focus on the research methods and techniques used to develop the research papers published in the journals.
Taking all these approaches into account, how can bibliometrics be defined? From a quantitative point of view Pritchard in 1969 describes it as “studies aimed at quantifying the processes of written communication” [20]. In 1987, Broadus defined bibliometrics as the “branch of research concerned with the quantification of the physical units of publications, bibliographic citations and their surrogates” [21]. A broader concept is included here since it establishes relationships between publications and bibliographic links or co-citation. Moed in 1989 defines it as the “discipline that deals with the collection, processing and management of bibliographic data from the scientific literature” [22]. From this second point of view, bibliometrics has been defined as a tool for analysis and evaluation. In 1989 White and McCain defined it as “the quantitative study of publications as reflected in the literature, in order to provide evolutionary models of science, technology and research” [23]. Spinak in 1996 refers to bibliometrics as the study of the organization of scientific and technological sectors from bibliographic sources and patents, to identify authors, their relationships and trends [24]. In the same line, other authors describe bibliometrics as the discipline that tries to measure scientific and social activity and predict its trend by analyzing the literature [25].
Other concepts related to bibliometrics are scientometric or infometric. Scientometric applies bibliometric techniques to science and examines scientific development and policies. Infometric is more focused on quantitative aspects of measurement and the application of mathematical models.
Bibliometrics and bibliometric indexes form a whole that serve to assess and measure scientific production in all its aspects. To measure, it is necessary to evaluate a set of data that are collected in databases specialized in giving visibility to scientific publications. A bibliometric index is a parameter that measures some aspect of scientific activity and allows for assessing the impact of research in the different fields of science. The two databases that allow this analysis are Web of Science and Scopus, both with a clearly commercial bias. Based on these two databases, both Clarivate and Elsevier have developed applications that allow organizations to assess their research from different perspectives to be able to establish and evaluate strategies based on reliable data.
InCites [26] uses data from the Web of Science Core Collection since 1980 to facilitate the analysis of organizations: activity, impact, collaborations, allowing to make comparisons. It allows searching by researchers or research groups to analyze their production. The search by areas of knowledge gives an overview of emerging fields. It is also possible to analyze the journals in which they are published and the funding agencies. All these variables (affiliation, researcher, area, source of publication, funding) can be easily combined to perform analyses by applying and combining different metrics (productivity, impact, collaboration, open access) and generate all kinds of reports. As a novelty, since December 2020, InCites allows the analysis of topics, classifying them into macro, meso and micro topics thanks to the collaboration between ISI and Centre for Science and Technology Studies (CWTS) and the use of the algorithm developed by CWTS that allows to detect and connect communities [27].
Based on the analysis of data from Scopus [28], Scival offers access to more than 50 million publication records (post-1996) from over 22,000 journals from more than 5000 publishers worldwide. It analyzes the scientific output of more than 230 countries and 14,000 institutions allowing to visualize research performance, make comparisons, analyze trends, and evaluate collaborations. It also allows the analysis of topics, classifying them into topic name and topic cluster. As InCites, Scival allows to generate data analysis and visualization reports combining many metrics that assess economic impact, productivity, citation impact, usage, collaborations and communication.
There are a large number of bibliometric metrics that allow the evaluation of scientific activity, but it is important to use these metrics correctly. It is necessary to consider what is to be measured, apply the appropriate metric, detect possible deviations, make an adequate analysis, etc. In this regard the 2015 Leiden Manifesto sets out 10 basic principles that the use of metrics should not be forgotten [29], and the San Francisco Declaration on Research Assessment sets out 18 recommendations in the same direction [30].
The first goal of this research is to analyze the context of all the bibliometric studies carried out from 1996 to 2020 to discover if there is any bias towards any scientific category, if there are countries or institutions that devote a great effort to this issue and finally to analyze what consideration these works have, e.g., are they mostly considered as reviews or articles, and what level of citations they have in comparison according to the categories in which they are indexed. As a second main goal, it is the case study of the categories of medicine and environmental sciences.

2. Materials and Methods

This analysis was based on searches of the Scopus and Web of Science databases. A previous study has pointed out that WoS is a confusing concept, as many institutions may subscribe to only a customized subset of the entire Web of Science Core Collection. It should be made clarified that our study is conducted for the whole of WoS [31]. Although the historical content of Scopus dates to 1788, the search was limited from 1996 (when the analysis of Scopus data in SciVal began) to 2020. In the case of Web of Science, the origin of the data collected in this database begins in 1960 and the analyses in InCites begin in 1980. In order to carry a correlation in the results presented in this work, it has also been limited from 1996 to 2020.
The search was performed using the same criteria: the term “bibliometric” in the title of the publication and in the keywords assigned by the author. The results of both searches were exported from Scopus to SciVal Benchmarking and from WoS to InCites Analyze.
Data processing, both from Scopus and WoS and from SciVal and InCites, was carried out with different tools. The Scopus API was used for automatic data retrieval [32], Microsoft Excel, Gephi and ArcGIS for the analysis and representation of the results, see Figure 1.
Topic classification is done on the document [33]. A topic in SciVal covers a collection of documents with a common intellectual interest [34]. Over time, new topics appear and, as topics are dynamic, they evolve. Each document is assigned a topic consisting of three elements, for example: Intellectual Structure, Co-citation Analysis, scientometrics. The topics are based on the citation network grouping of 95% of the Scopus content (all documents published since 1996), taking as a reference the direct analysis of citations using the reference lists of the documents. As new published documents are indexed, they are added to Topics using their reference lists. This makes the Topics dynamic and most increase in size over time. New topics represent research areas that have experienced a significant acceleration of growth in recently published articles and have attracted funding. These new Topics are derived from the existing stem Topics and are formed by the new citation relationships that have occurred in the last year. Once a year, the Topics SciVal algorithm is run to identify the new Topics that have emerged [35].
Like SciVal Topics, the InCites Topics ranking is also done on the document. It is based on a CWTS algorithm [27] considering the citations (cited and citing) between documents, based on the “strength” of the citation relationships. In this way, clusters are created: macro, meso and micro topics.
An independent analysis, based on scientific communities or clusters and the relationships between them based on citation and main keywords, has also been considered in this research.
Finally, continuing with the issue of quality, the sources (journals) have been analyzed with the following metrics:
  • Number of publications in WoS and Scopus;
  • Number of citations in WoS and Scopus;
  • Quartile in JCR and SJR;
  • Journal Impact Factor JCR. It uses for the citations, articles, reviews, and proceedings papers [36];
  • 5-Year Journal Impact Factor JCR, available from 2007 onward [36];
  • Impact SJR [37];
  • Cite Score [35].
On the other hand, the analysis of the sources has been completed with two other metric values:
  • Field-Weighted Citation Impact (FWCI) the SciVal [38];
  • Category Normalized Citation Impact (CNCI) the InCites [36].

3. Results of Bibliometric Literature on Scopus and WoS

3.1. Trend in Scientific Production

According to Scopus, with the search criteria used, between 1996 and 2020, 13,161 results were obtained. The temporal evolution is shown in Figure 2 from the year 2000, since before that date there are few papers per year. The trend line has been represented, showing that the annual growth is exponential. It can be observed that in 2020 there will be more than 2500 published documents.
Figure 2 shows that 72% of the documents are mainly classified as articles. To a lesser extent, reviews in 13% of the cases and contributions to conferences in 10%. The number of reviews shows that this type of documents is the result of an analysis of a specific topic. In this case the most cited article [39] has considerably more citations than the most cited review [40].
In Web of Science (WoS), with the same search criteria, 11,651 results were obtained between 1996 and 2020, slightly less than in Scopus. The temporal evolution is shown in Figure 3 from the year 2000, since before that date there are few papers per year, as was the case in the other database. The trend line has been plotted, showing that annual growth is exponential. It can be observed that in the year 2020 there will be more than 2000 published documents.
Figure 3 shows that 68% of the works are classified as articles. To a lesser extent, reviews in 14% of the cases and contributions to congresses in 11%. In general, there are no differences between the two databases in the distribution of documents by type. In this case the most cited article and review are the same as in Scopus.

3.1.1. Countries

The countries that have devoted most effort to bibliometric studies are China with 16% of the total number of publications, followed by the USA with 15% and in third place Spain with 12.5%. Further behind with 6% are Brazil, the UK and India. Given that China and the USA are the world leaders in scientific production, these results in the first two positions are not surprising. It should be noted that a recent study has shown that China has overtaken the United States in terms of the number of articles indexed in the SCI in 2018 [41]. However, what is particularly notable is the great effort made by Spain in this area. Figure 4 shows a worldwide map with the geographical distribution by countries according to their publications related to bibliometrics.
The most cited bibliometric document from China is related to energy [42]. For the USA, it is the one cited above as the most cited review, and it is about economics [40], the same subject line as for the most cited from Spain [43].

3.1.2. Institutions According to Scopus and WoS

Table 1 shows the top 20 institutions that publish the largest number of bibliometric publications, according to Scopus and WoS. A first analysis of the table shows that the difference between the two databases is only in four institutions. The institutions that appear in Scopus in the top 20 and are not in WoS are: An-Najah National University (18), Sichuan University (16), Universidad de Chile (14) and Universidade Federal de Santa Catarina (19). On the other hand, the four institutions that appear in WoS and not in Scopus are: Harvard University (16), University System of Georgia (13), University of London (8) and Istituto di Analisi dei Sistemi ed Informatica Antonio Ruberti (IASI-CNR) (17).
These differences are undoubtedly due to the different sources indexed in the two databases. Of the differences in this top 20, there is only one institution in the top 10 of WoS and not in Scopus, the University of London. It can be seen that the first five institutions are the same in both databases, although in different order: Universidad de Granada (Spain), University of Valencia (Spain), Consejo Superior de Investigaciones Científicas (CSIC) (Spain), Chinese Academy of Sciences (China) and Leiden University (Netherlands). It is remarkable that three institutions from Spain are in the top five, and this probably contributes, as already mentioned, to the fact that Spain accounts for 12.5% of the total number of publications in this field.
The most cited documents from these institutions were: University of Granada (Spain), related to computers and education [44]; University of Valencia (Spain), related to economics [45]; Consejo Superior de Investigaciones Científicas (CSIC) (Spain), related to bibliometrics [46]; Chinese Academy of Sciences (China), related to biodiversity and conservation [47]; and Leiden University (Netherlands), related to bibliometry, the one already reported as the most cited bibliometric article [39].
Leiden University is a benchmark in research evaluation and bibliometric studies through the Centre for Science and Technology Studies (CWTS). It works closely with Clarivate Analytics, which bases its analyses on Web of Science and is continuously expanding its data system to include other sources, such as Scopus, PubMed, Crossref, PATSTAT, Mendeley and ORCID [48].
International collaborations (IC) were analyzed for both Scopus publications using SciVal and WoS publications using InCites, see Table 1. For Scopus data, the minimum international collaboration for the top 20 is 15.8% for the Consiglio Nazionale delle Ricerche (CNR), while the maximum is 81% for the Universidad de Chile. For WoS data, the minimum of international collaboration in this top 20 is 10% from Istituto di Analisi dei Sistemi ed Informatica Antonio Ruberti (IASI-CNR); while the maximum is 79.5% from Georgia Institute of Technology. However, both databases, for the average scientific collaboration of this top 20 offer the same result, 41.4% according to Scopus and 41% according to WoS. The first five institutions have relatively low international scientific collaboration in this field, between 21 and 38%. However, if we analyze the average of these five institutions, it is 29.8% according to Scopus and 29.9% according to WoS. Therefore, it is possible to establish that the main institutions dedicated to bibliometrics collaborate less than the average of the other 15, which without them have an average of 45% of international collaboration in both databases.

3.2. Scientific Areas of Indexing

3.2.1. Scopus

Subject Area

Figure 5 shows the indexation by subject area in Scopus. The Social Sciences category leads the published documents with slightly more than 38% of the publications, which was to be expected since this is where bibliometrics is classified. In second place is the Computer Science category with 26.5%, showing that there is an increasingly important volume of data management and that therefore advanced computer techniques must be applied. The third category in order of number of documents is the field of Medicine with more than 23%, this is worth a reflection on the importance of bibliometrics. The next three categories are close to 10% and are: Business, Management and Accounting (12%), Engineering (9%) and Environmental Science (8%).
Figure 5 shows the temporal evolution by years of the first six categories from 2000 to 2020 according to Scopus. Since 2008, bibliometric publications have been led by the Social Sciences category. The Computer Science category has occupied the second place from 2009 to 2019, and already in the last year it is surpassed by the Medicine category, which was in third place since 2009. The next three categories have had a quite similar behavior, exceeding 100 publications per year the Business, Management and Accounting category in 2016, Engineering in 2017 and Environmental Science in 2018, all of them finish with 300 or more papers per year in the last year studied, 2020.

SciVal

According to SciVal, the average number of citations per document was 12.4. This section starts to discuss the Topic Name extracted from Scival, see Table 2. It is observed that the main topic name is Hirsch Index, Self-Citation, Journal Impact Factor; followed closely by: Intellectual Structure, Co-citation Analysis, scientometrics. In third place is: Co-Authorship, Scientific Collaboration, scientometrics.
Since the Hirsch Index or H index was proposed in 2005 [49], many evaluation agencies and even journals make use of it to measure the quality of an individual author’s impact. This has also given rise to the misconduct by some authors of self-citation to artificially raise their own H index [50]. There are studies that propose eliminating self-citation for the calculation or correction of the H index [51]. Self-citations do not only occur in individual authors, but some journals have been able to encourage this practice in citing articles from their own journal to raise its Journal Impact Factor [52], this is named journal self-citation. These facts have inspired many studies that make this Topic Name the most prominent one to date.
In the second topic name, these studies are based on describing the intellectual structure of a particular scientific field from the point of view of frequently occurring keywords and phrases, using Co-citation Analysis, co-word analysis, hierarchical clustering, and link analysis [53]. The third of the main topic name focuses on the analysis of the structure of scientific collaboration networks [54]. These scientific collaboration networks are analyzed by scientific fields [55], countries [56,57] or even institutions [58,59,60].
Table 2 lists each topic name according to the average number of citations received per document. According to this index, the leading topic name is Social Science and Humanities, Research Evaluation, Book Publishers with almost 45 citations per document, followed in second place by Technology Roadmapping, Patent Analysis, Technological Competitiveness with almost 23, and in third place by Bibliometric Analysis, Citation Index, Document Type with almost 19.
Table 3 shows the main topic clusters related to bibliometric studies. The main topic cluster is the one focused on: Publications, Periodicals as Topic, Research. This cluster stands out from the rest as it is 11 times larger than the next cluster, which is focused on: Industry, Innovation, Entrepreneurship; and 30 times larger than the third: Library, Librarian, Information. In relation to the citations of each topic cluster name, Decision Making, Fuzzy Sets, Models leads this ranking with 23 citations per document, e.g., the manuscript “Fuzzy decision making: A bibliometric-based review” [61] has 163 citations according to Scopus. In second place is: Industry, Innovation, Entrepreneurship with 18 citations per document. In third place is Electricity, Energy, Economics with 16 citations per document, e.g., “Power quality: Scientific collaboration networks and research trends” [62].

3.2.2. WoS

Categories

The classification by WoS categories is shown in Table 4. As is well known, the categories do not match those of Scopus. On the other hand, in both databases the same document can be indexed in more than one category if the journal in which it was published is indexed in more than one category. For the documents analyzed, the great discrepancy between scientific fields between the two databases is observed in the field of Medicine in Scopus, which does not correspond to the first positions ranked by WoS. Although there are comparable categories in WoS such as: Medicine, Research and Experimental or Medicine, General and Internal, there are many other categories specific to the medical field that are independent for indexing. In our case, for example, the categories of: Oncology, Psychiatry, Pediatrics, Anesthesiology, Respiratory System, Ophthalmology, Dermatology or Tropical Medicine, but all of them with values below 1%, which does not make it possible to reach the 23.2% that appeared in Scopus. Therefore, the indexing field of medicine is very different between the two databases.
In the last column of Table 4, the average number of citations of these bibliometric documents has been calculated according to WoS data. For the whole documents analyzed the average number of citations per document was 11.7. Only three categories are below five citations per document: Engineering, Electrical and Electronic, Computer Science, Theory and Methods and Social Sciences, Interdisciplinary. In general, these documents are highly cited within their scientific categories, especially in Management and Engineering, Industrial, both with more than 18 citations per document (C/D).

Incites

In this section the macro, meso and micro topics in which WoS classifies all bibliometric publications will be discussed. The macro topics are listed in Table 5. Leading this classification are the social sciences which has 5 times more documents than the following one. Followed by Clinical and Life Sciences, and in third place is Electrical Engineering, Electronics and Computer Science, with far fewer documents.
In terms of citations per document, social sciences remain the main one with 14. However, now the second place in this other ranking is for Electrical Engineering, Electronics and Computer Science with 12 citations per document. With 10 citations per document there are already several categories: Chemistry, and Engineering and Materials Science. The average number of citations per document (C/D) is 8.5.
The 20 main meso topics are listed in Table 6, highlighting bibliometrics, scientometrics and Research Integrity, with 11 times more publications than the second meso topic, Management. These two meso topics can be included within the main macro topic of Social Science, mentioned above. As can be seen in column 2 of Table 6, the first number indicates the macro topic. It can be observed that in this top 20 are not present the macro topics of: Chemistry (2), Earth Sciences (8), Engineering and Materials Science (7), Arts and Humanities (10), Physics (5) or Mathematics (9).
The two meso topics with the most citations per document are Artificial Intelligence and Machine Learning (19 C/D), Operations Research and Management Science (17 C/D), both from the macro topic 4, Electrical Engineering, Electronics and Computer Science. The average number of citations per document for this top 20 meso topic is 11.7 C/D.
Finally, the micro topics, as expected, the first one, bibliometrics, belongs to the bibliometrics, scientometrics and Research Integrity meso topic, see Table 7. Additionally, the second, Knowledge Management, and the fourth, Corporate Social Responsibility, belong to the Management meso topic. The third, Systematic Reviews, is included in the Medical Ethics meso topic. In the first 20 micro topics there is an average of 15 C/D. Fuzzy Sets stands out above all with more than 30 C/D and belongs to the meso topic with the highest average number of citations per document, Artificial Intelligence and Machine Learning.

3.3. Source (Journal)

Table 8 shows the top 20 journals indexed in both WoS and Scopus, and where the bibliometric articles are published. The table shows both the ranking of the journal by total number of publications in the subject studied and by citations received for these articles. In addition, the different impact indicators according to JCR, SJR and Scopus and the relative position of the journal within its category according to JCR and SJR, e.g., the quartile, are also shown.
The first consideration for journals is that they should have not the same number of articles published in the same period in both databases. What probably happens is that editorial articles or short communications are considered differently in both databases.
It is noted that apart from the journals indexed in the category of Information Science and Library Science, there are many of them in the categories of Environmental Sciences Environmental Studies such as: Sustainability, Journal of Cleaner Production, Environmental Science and Pollution Research. Or even Journals in the field of Medicine such as Medicine or World Neurosurgery.
Considering the quartile of the journals, it can be found that according to JCR: six are Q1, six are Q2, five are Q3, two are Q4 and one does not have a JCR impact factor. That is to say that most are Q1 and Q2. According to Scopus: seven are Q1, nine are Q2, one Q3 and three have no SJR. Of all these journals, the one with the highest impact both IF JCR and SJR is Journal of Informetrics.
A comparative study of the top 10 countries and affiliations publishing in the leading bibliometrics journal, Scientometrics, is shown in Table 9. If the results obtained in Table 9 are compared with the global results of scientific production by country, it can be seen that the first three countries are the same and in the same ranking order: China, the United States, and Spain. Another four countries that appear in the top 10 of both rankings, although in a different order, are: United Kingdom, Germany, India and Italy. In summary there is an overlap of 7 of the 10 countries in both rankings. Although China and the USA are the two countries with the most publications, the Netherlands dominates in citations per document with 22 followed by Hungary with 19.
With regard to affiliations, something similar happens, since of the top 10 that publish the most in Scientometrics, 6 are in the top 20 worldwide. These are: Universidad de Granada, Consejo Superior de Investigaciones Científicas (CSIC), Chinese Academy of Sciences, Leiden University, Wuhan University and KU Leuven. In the case of the affiliations, i.e., the most productive ones are also the most cited in Scientometrics journal: KU Leuven (18 C/D), Magyar Tudomanyos Akademia (21 C/D) and Leiden University (35 C/D).

3.4. CNCI vs. FWCI

Table 10 shows the CNCI and FWCI. Both the CNCI and the FWCI measure the actual citation impact on the expected citation for the articles studied. As long as it is equal to or greater than 1, they have achieved the expected citation. There are only three journals that in both indicators, CNCI and FWCI, are below one: Current Science, Malaysian Journal of Library, and Information Science, and Revista Española de Documentación Científica. Then, there are two that have a CNCI < 1, although the FWCI is above 1: Sustainability, and Environmental Science and Pollution Research. All the other journals, 15 out of 20, are above 1 in both indicators, so in general the bibliometric articles achieve a higher number of citations than expected based on the journal and category.
Considering the number of citations per document, for Incites the average is 15.5, and for Scival it is 14.8, so that for this select group of journals the average is about 15. The three journals with the most citations per document according to Incites are: Research Policy (62 C/D), Technological Forecasting and Social Change (31.7 C/D) and Journal of Informetrics (28 C/D). The lowest one for Incites is Investigación Bibliotecológica (0.9 C/D). The three journals with the most citations per document according to Scival are: Journal of the American Society for Information Science and Technology (48.4 C/D), Technological Forecasting and Social Change (42.9 C/D) and Journal of Informetrics (37 C/D). The lowest one for Scival is Espacios (0.7 C/D).
Figure 6 shows the journals studied in Table 11, where the size of the dot is the number of articles studied. Both indicators, FCWI and CNCI, have been plotted, here two trends have been observed. The first one involving the largest number of journals is slightly favored by the FWCI. The second trend, which favors CNCI over FWCI, occurs in the journals: Journal of the American Society for Information Science and Technology, Research Evaluation, Journal of the Association for Information Science and Technology, World Neurosurgery, and Revista Española de Documentación Científica.

4. The Medicine and Environmental Sciences Categories as Case of Study

Once all the bibliometric manuscripts have been analyzed, it has been observed that the two main categories are those that could be classified as natural for bibliometrics, the social sciences and computer sciences. After these, the third category has been found to be medicine, and the other emerging category is environmental sciences. These two categories are therefore worth studying as a case study, which is the second objective of this manuscript.

4.1. The Medicine Category

4.1.1. Countries and Affiliations

Figure 7 shows a worldwide map with the distribution by country of bibliometric publications in the medicine category. Publications from 136 different countries have been found. It can be seen that it covers geographically all the countries of the world.
Table 11 shows the top 10 countries and affiliations publishing on bibliometrics in the category of medicine. They have been analyzed from 2000 to 2020 and based on the Scopus database.
In terms of countries, this ranking is led by the USA with more than twice more publications than the next country, China. It should be noted that the most cited article from the USA in this category is on the history and meaning of the impact factor, even though it is published in a medical journal, the Journal of the American Medical Association (JAMA) [63]. Although the second most cited manuscript from this country is on the effectiveness of interventions, whose results are subsequently contradicted [64].
In third place is the UK where its most cited manuscript is related to a taxonomy of behavior change techniques used in interventions [65]. For the fourth country, Spain, the most cited manuscript can also be considered a bibliometric research paper related exclusively to medicine, the Spanish version of the Short Form 36 Health Survey [66].
Among the top 10 affiliations that have published bibliometric manuscripts in the category of medicine, there are three from Spain, University of Valencia, Consejo Superior de Investigaciones Científicas and Universidad Miguel Hernandez de Elche; and the other three from Canada: University of Toronto, McMaster University and The University of British Columbia. The two most cited manuscripts from the University of Valencia focus on bibliometric aspects of scientific collaborations [67], or the impact factors of medical journals [68] and the third most cited manuscript focuses on a purely medical topic with the leishmaniasis [69]. The most cited manuscript from the University of Toronto is a purely medical one, such as the propensity-score methods that are increasingly being used to reduce the impact of treatment-selection bias in the estimation of treatment effects using observational data [70].

4.1.2. Keywords

In this section the most frequent keywords in the fields of medicine that appear in the bibliometric publications in this category have been identified, see Table 12. Among the scientific fields of medicine, Epidemiology and Pediatrics stand out above the rest. The main affiliations in these two fields are Universidad Tecnológica de Pereira (Colombia) and University of Valencia (Spain), respectively.

4.1.3. Journals

Table 13 shows the top 10 journals publishing articles in bibliometrics in the category of medicine and their main WoS-JCR and Scopus-SJR bibliometric source indices. It can be seen that the top three journals are above 80 manuscripts and stand out from the rest. Of these 10 JCR journals, three are Q1, three Q2, three Q3 and one has no impact factor. However, for SJR, five are Q1, four Q2 and one Q3.

4.2. The Environmental Sciences Category

4.2.1. Countries and Affiliations

Figure 8 shows a world map with the country distribution of bibliometric publications in the environmental sciences category. Publications from 83 different countries have been found. It can be seen that it covers geographically a large part of the world, and that Africa is the continent with the fewest publications in this regard.
Table 14 shows the top 10 countries and affiliations publishing on bibliometrics in the category of Environmental Sciences. They have been analyzed from 2000 to 2020 and based on the Scopus database. By country, this ranking is led by China, with more than twice as many publications as the next country, Spain. Notably, the most cited article from China in this category is on sustainable, smart, resilient and low-carbon cities [71]. The second most cited manuscript from this country is on anaerobic digestion of food waste [72].
Number two in this category, Spain, has its most cited article on sensitivity analysis in chemical modelling [73]. The following is on green innovation [74]. Number 3 in this category, USA, has its most cited article on urban resilience [75]. The following are on scholarly networks on resilience, vulnerability and adaptation within the human dimensions of global environmental change [76]. Impacts of anthropogenic noise on marine life [77].
Among the top 12 affiliations that have published bibliometric manuscripts in the environmental sciences category, there are 10 from China and 2 from Spain. The top two affiliations are the Chinese Academy of Sciences and the University of Almeria. The two most cited manuscripts from the Chinese Academy of Sciences are related to global biodiversity [47] and, the other on ecological engineering and ecosystem restoration [78]. For the University of Almeria, the most cited manuscripts are related to and nitrate leaching [79] and energy efficiency in public buildings [80].

4.2.2. Keywords

In this section the most frequent keywords in the fields of environmental sciences that appear in the bibliometric publications in this category have been identified, Table 15. Among the scientific fields of environmental sciences, sustainability and sustainable development keywords stand out above the rest. The two main affiliations for these top 10 keywords, are the University of Almeria (Spain) and the Chinese Academy of Sciences (China). The third main affiliation is the Goethe-Universität Frankfurt am Main (Germany) and the environmental topic is related to public health.

4.2.3. Journals

Table 16 shows the top 10 journals publishing articles in bibliometrics in the category of environmental science and their main WoS-JCR and Scopus-SJR bibliometric source indices. It can be seen that the top journal is Sustainability with a large number of bibliometric manuscripts. The second and third journals are Journal Of Cleaner Production and International Journal Of Environmental Research And Public Health, respectively. Among these 10 JCR journals, four are Q1, three Q2, one Q3 and two have no impact factor. However, for SJR, five are Q1, three Q2 and two Q3.

5. Independent Cluster Analysis of Bibliometric Publications

In this section, all the papers have been classified by analysis of scientific communities or clusters, and their links between them, by means of the citations they make to each other. Afterwards, the most frequent keywords have been extracted from each of these scientific communities to name them, see Table 17. Bibliometrics and Bibliometric Analysis are the search terms and excluded.
Figure 9 shows the graph generated with all the articles, where in the outer circle are documents not related to any other, or in other words, documents that do not cite any other bibliometric work, and therefore are in a certain way isolated from the core of the bibliometric publications. On the other hand, the central core are papers related by references, since they cite each other and thus establish a relationship. From this core of publications, seven communities or clusters have been detected, which are represented by colors in Figure 9. In this figure, a particular paper has also been marked in red, which is the most cited article by all the bibliometric papers (Van Eck and Waltman, 2010).
The clusters have been outlined in Table 8, where the 20 main keywords have also been collected. These clusters are: Science Mapping (28.72%), Research Productivity (23.29%), Medical research (19.65%), Environment (11.84%), Psychology (7.02%), Nursing (5.66%) and Engineering (3.82%).
Table 18 shows, for each cluster, the use of WoS or Scopus, being mainly highlighted in the Environment cluster. The only exception to this is in the Nursing cluster, where Scopus is preferred.

6. Conclusions

This study has analyzed the bibliometric documents produced between 1996 and 2020. It has been observed how bibliometrics were applied to research in all scientific fields during these years. To evaluate these documents, a methodology has been used that has proven to be valid to relate scientific production in Scopus and WoS and link it to bibliometric indicators through SciVal and InCites.
The first conclusion drawn from this work is that there is an exponential growth in publications between 2000 and 2020 and that most of the documents are indexed as articles (72% in Scopus and 68% in WoS), as opposed to reviews (13% in Scopus and 14% in WoS). Three countries have led the number of documents published: China with 16%, the USA with 15% and in third place Spain with 12.5%. In this sense, it is worth highlighting the role of Spain in third place compared to the two large countries with the highest scientific production in absolute terms.
From the point of view of the institutions, there are differences between the two databases analyzed. However, the top five positions in the ranking are shared by the same institutions: University of Granada, University of Valencia, Consejo Superior de Investigaciones Científicas (CSIC), Chinese Academy of Sciences and Leiden University. Once again, the predominance of Spanish institutions in this ranking stands out. International collaboration is undoubtedly a parameter that allows us to know the synergies in scientific production. In this case it has been shown that the institutions located in the top five positions of the ranking do not have a parallelism between quantity of production and international collaboration, they have 30% of international collaboration, that is to say, they have collaboration below the average, which without these institutions is 45%.
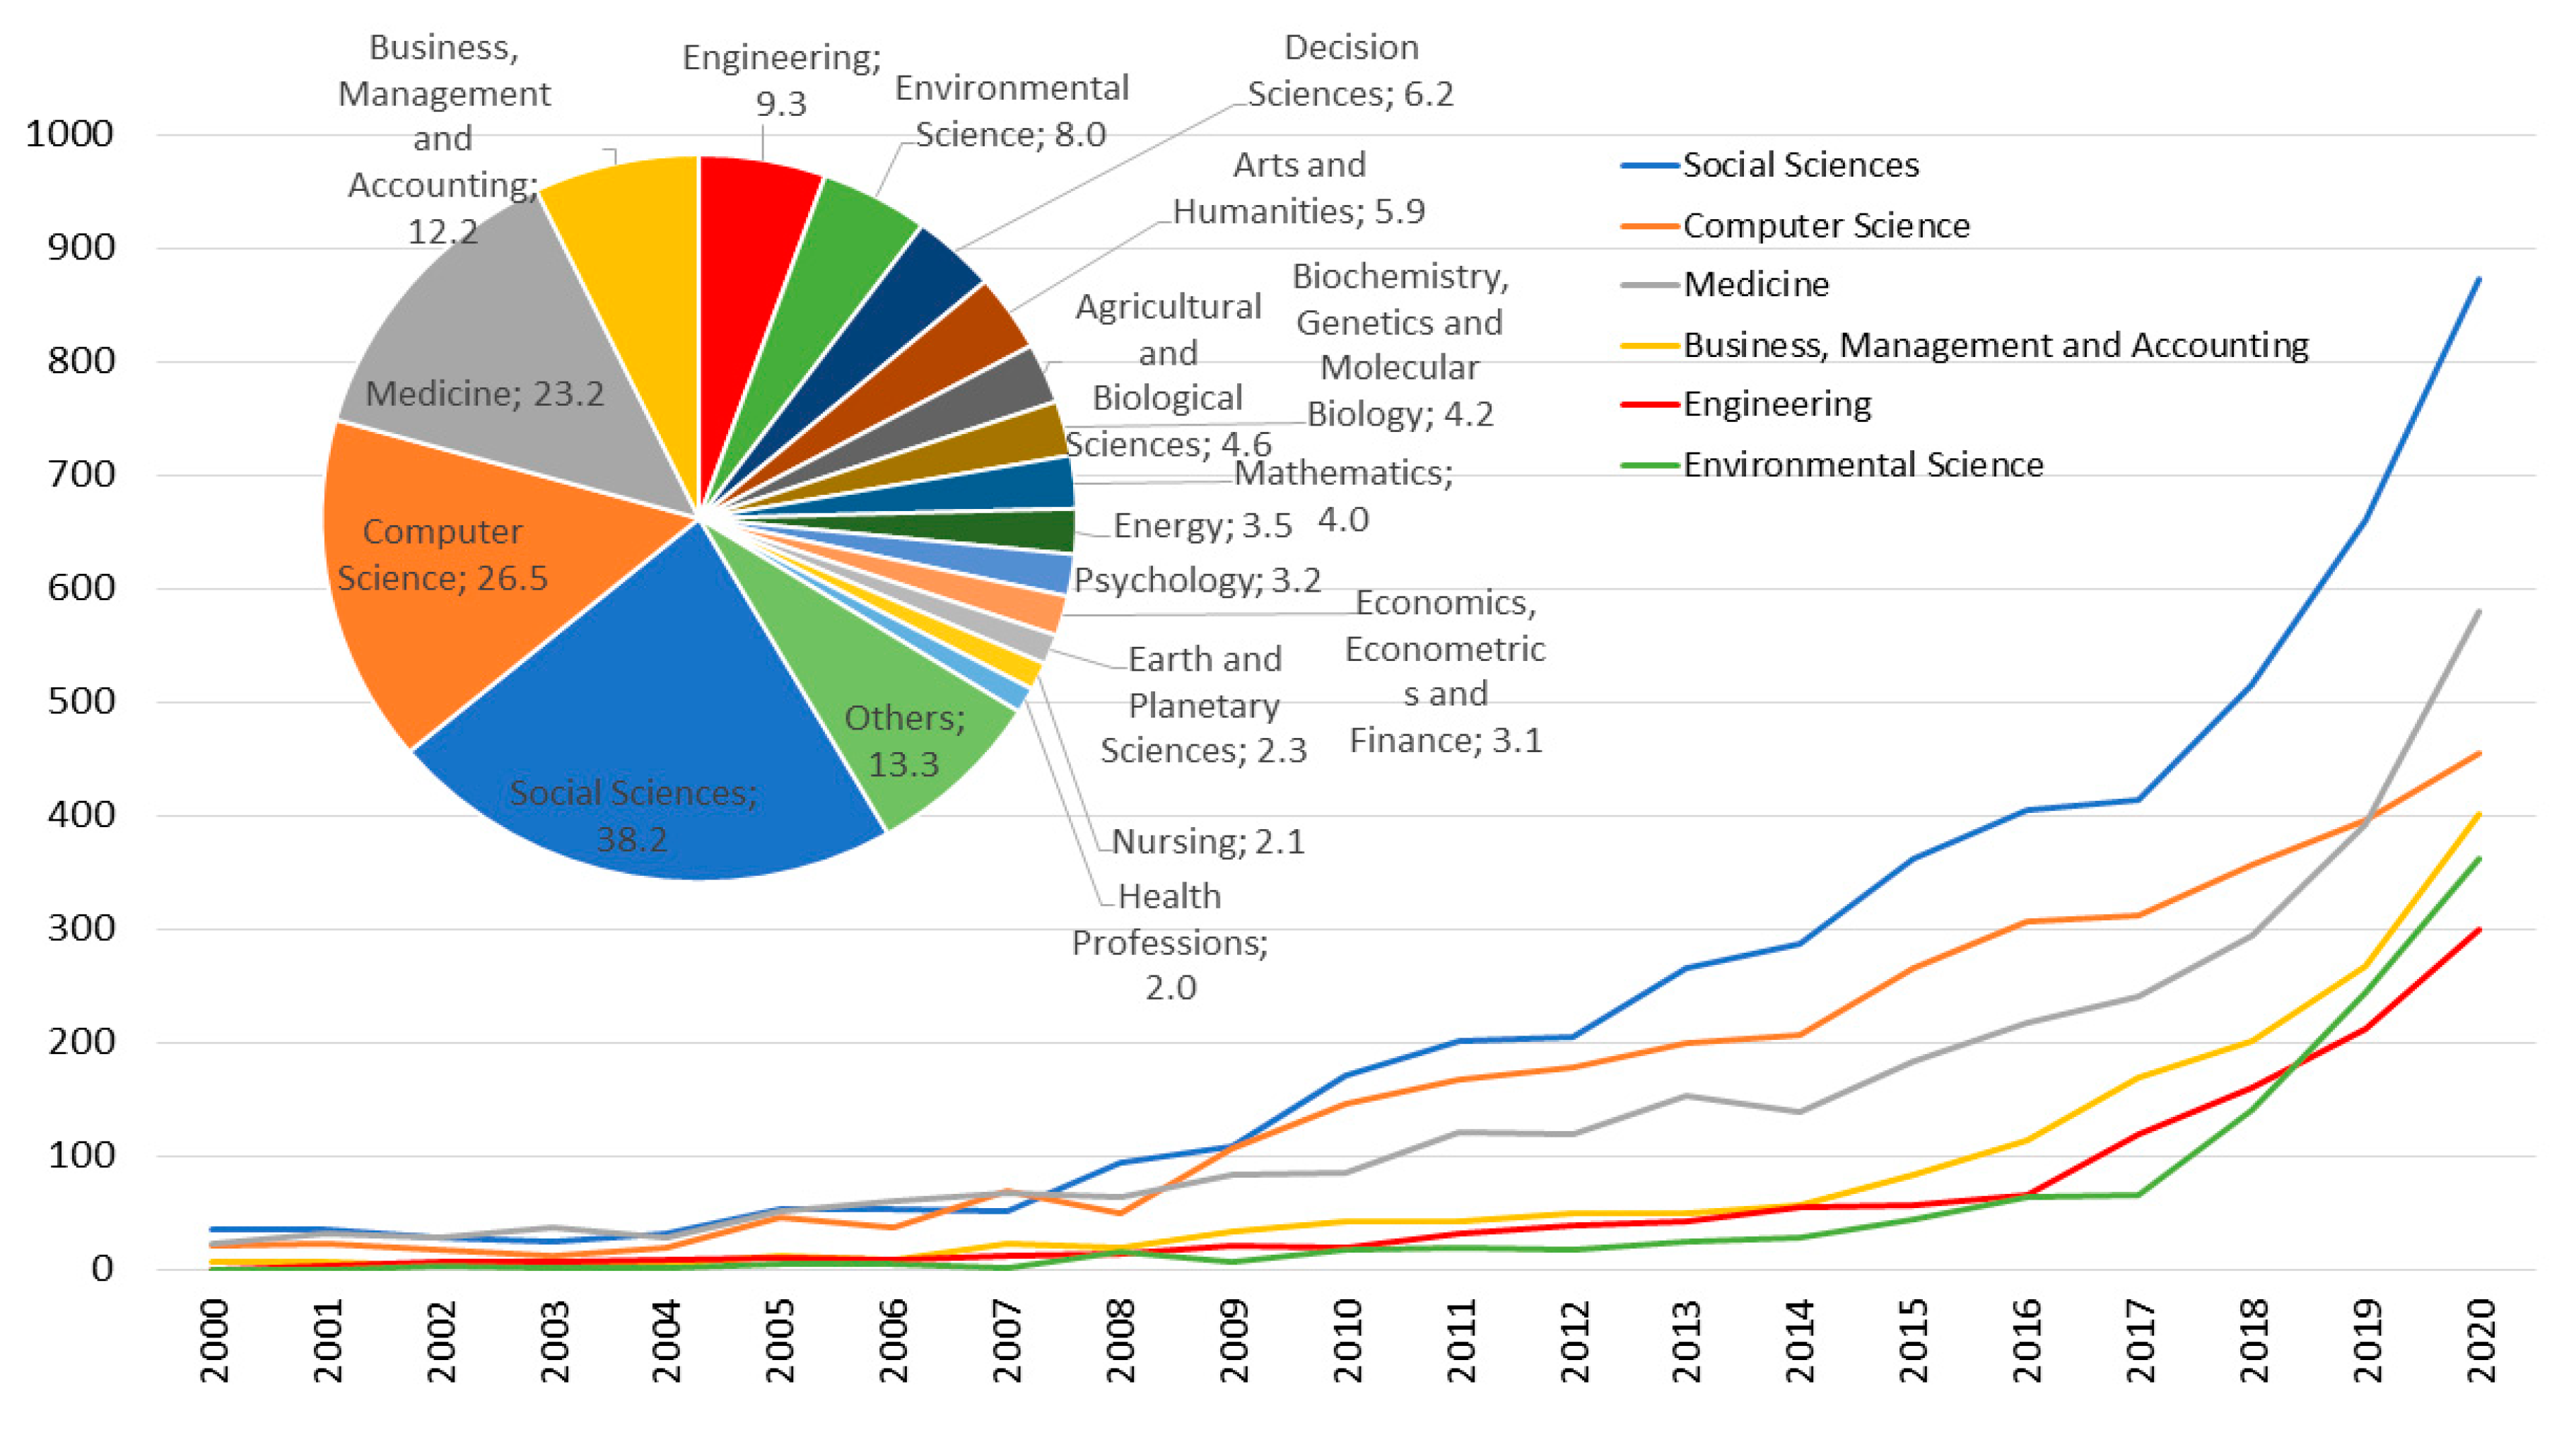
Regarding the topics where bibliometrics is applied, the publications have been categorized, and despite the differences between Scopus and WoS when classifying the publications, the results show that this type of studies have been classified mainly in the areas most related to bibliometrics. According to Scopus, in order of importance: Social Science and Computer Sciences, Medicine, Business, Management and Accounting, Engineering and Environmental Science. According to WoS: Information Science and Library Science, Computer Science, Environmental Sciences and Management. There is a high degree of interest in the application of bibliometrics to other disciplines as an element of analysis of their own progress.
Completing the review of the topics, the topics for Scopus indexing have been considered as an indicator of where the publications on bibliometrics stand out. In this sense, the trend also shows the predominance of topics related to the discipline addressed in this research. Hirsch Index, Self-Citation and Journal Impact Factor as predominant Topic Name in SciVal. Publications, Periodicals as Topic, Research as predominant Topic Cluster Names. Interestingly, the ones with the most citations per document are for the Topic Name, Social Science and Humanities, Research Evaluation and Book Publishers with 45 citations per document as average; and for the Topic Cluster Name, Decision Making, Fuzzy Sets, Models with 23 Cites per Document.
In InCites they are mostly included in the Macro Topic of Social Sciences with an average of 14 citations per document, in the Meso Topic of bibliometrics, scientometrics and Research Integrity, but with respect to citations per document the meso topic of Artificial Intelligence and Machine Learning stands out (19 C/D). In the Micro Topic, the main one by number of documents is bibliometrics, but regarding citations per document Fuzzy Sets stands out above all with more than 30 C/D. That is to say that in the citations per document the computer science topics stand out.
The analysis of the sources shows that, despite the different indexing criteria of JCR and SJR, there is variety in the categories in which they have been indexed. The first positions, according to the number of publications, are occupied by journals specialized in bibliometrics, but journals specialized in Medicine or Environment also appear among the first 20 journals. In terms of quartile ranking, a greater number of SJR journals are positioned in Q1 and Q2 compared to JCR, undoubtedly due to the different indexing criteria applied by the two databases. To complete the quartile ranking, impact factors and citation level, two metrics have been used that allow the performance of the sources based on the citations received and those expected to be received. The InCites CNCI shows that 7 of the 20 are below 1 and the SciVal FWCI shows that 9 of the 20 are also below this threshold.
In the analysis of the Medicine category alone, it has been observed that 136 countries have contributions in this field. The main countries are the United States, China and the United Kingdom. In the field of medicine, the main research areas studied were: Epidemiology, Pediatrics, Orthopedics, Cardiology, Neurosurgery, Radiology, Ophthalmology, Oncology, Plastic Surgery and Psychiatry.
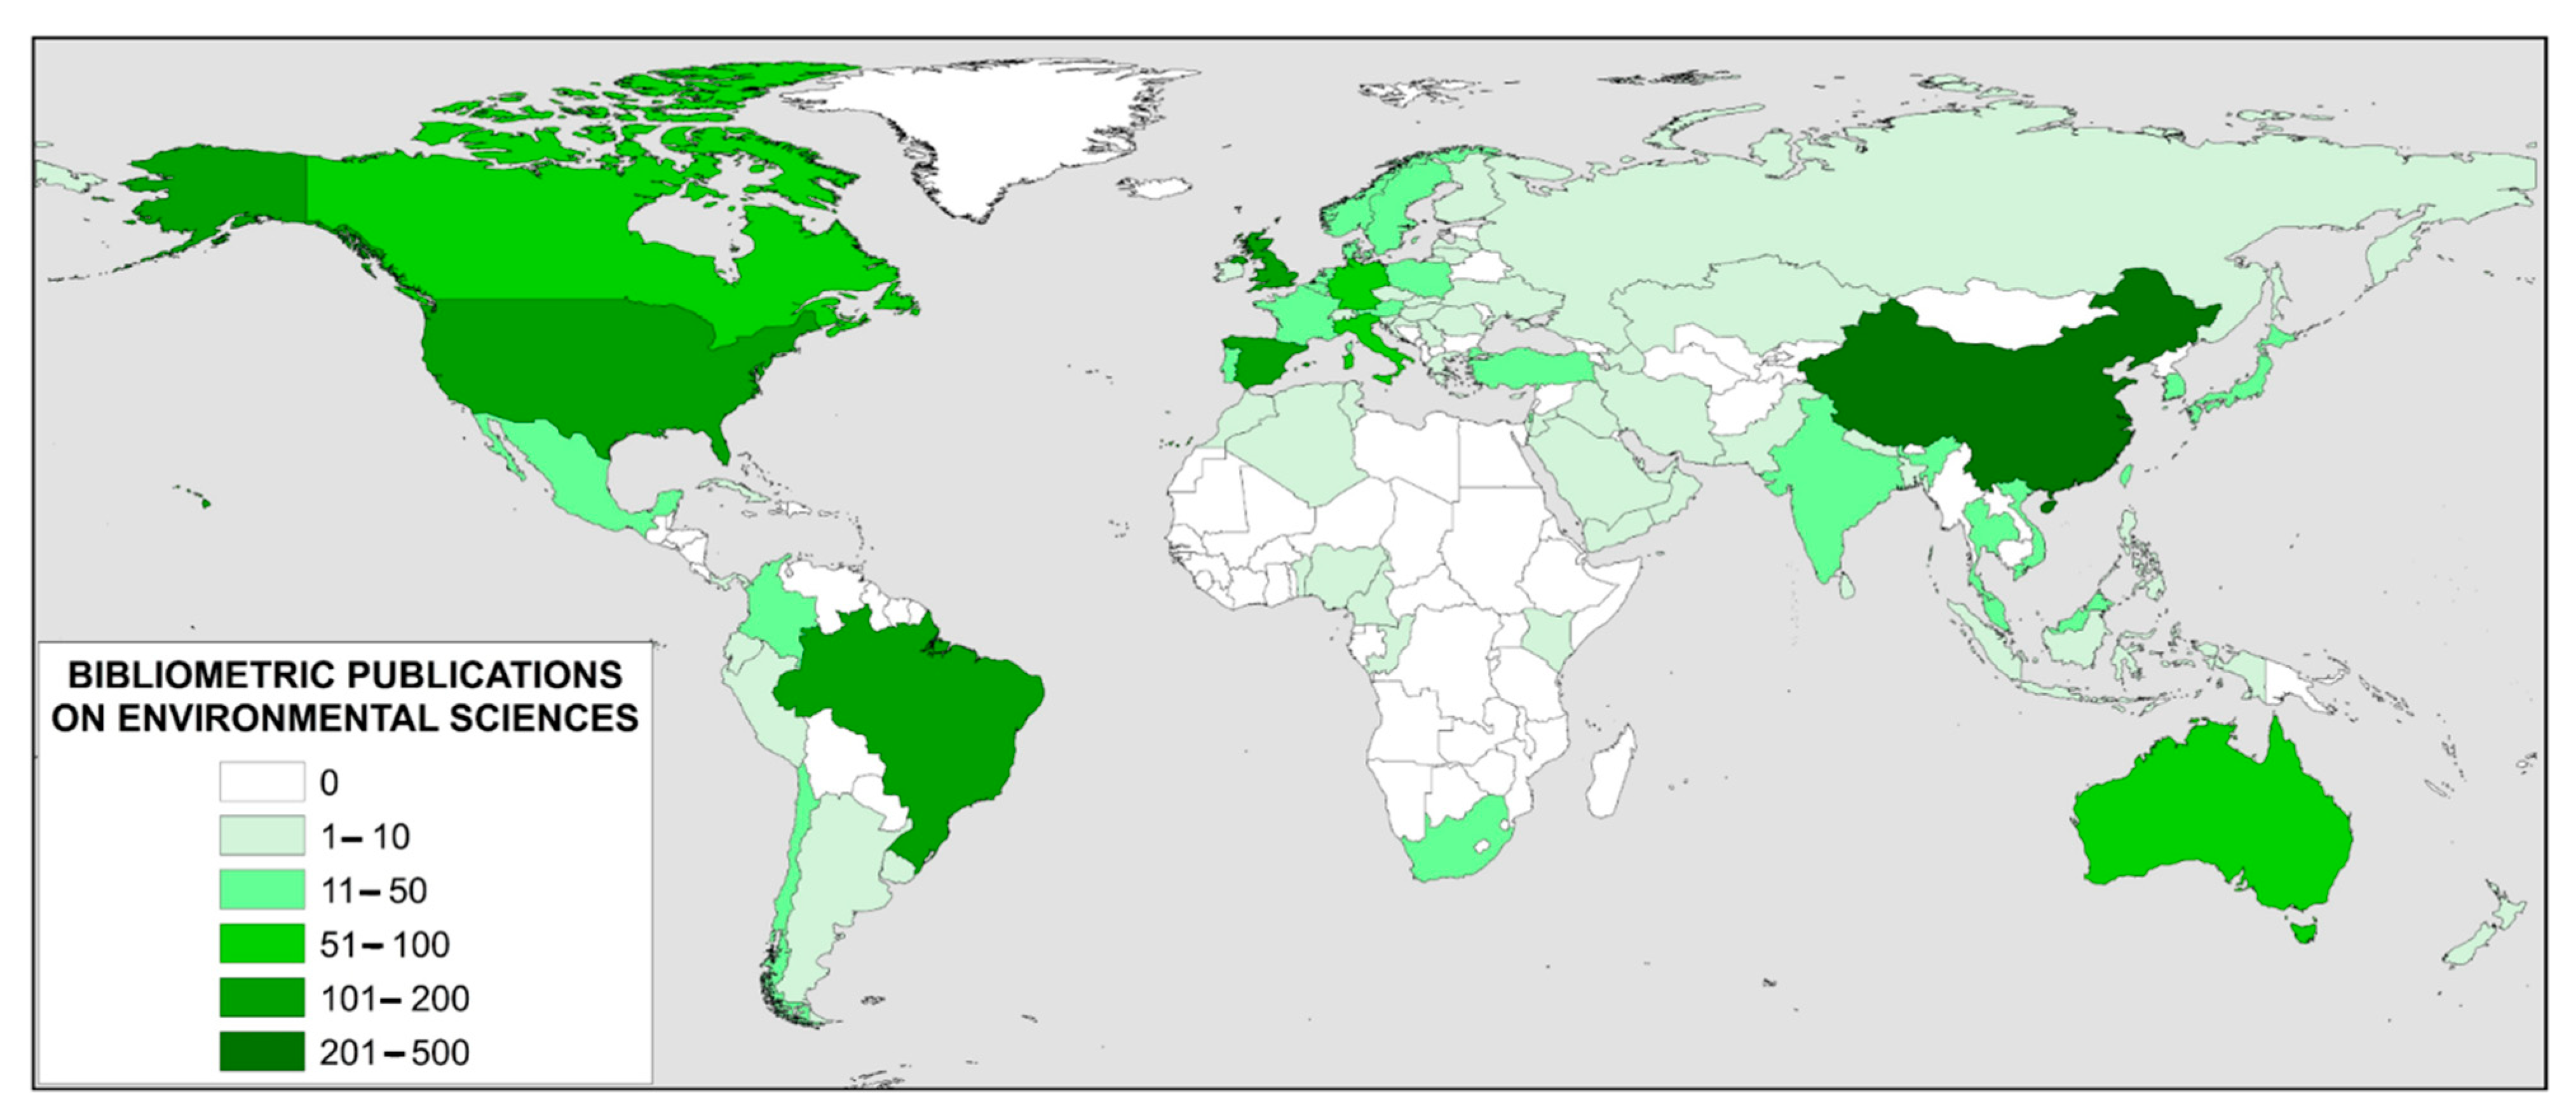
With respect to Environmental Sciences category, less international dissemination has been found, with only 83 countries having worked in this field. The main ones are China, Spain and the United States. Regarding the top 10 institutions, it can be stated that only Spain and China are relevant. Spain focuses on sustainability and China on the environment. In the field of Environmental Science, the main research areas studied were: Sustainability, Sustainable Development, Climate Change, Ecology, Environmental Impact, Biodiversity, Environmental Protection, Environmental Management, Public Health and Environmental Monitoring.
The relationships between the citations of the publications have allowed, with an independent analysis, to establish clusters by key words based on the level of citation. These seven clusters were: Science Mapping, Research Productivity, Medicine, Environmental Sciences, Psychology, Nursing and Engineering. In the seven communities in which the 20 main keywords were collected, a predominance of terms related to bibliometrics applied to the different clusters was again observed. The main country keyword data has also been extracted, highlighting the relevance of China as the predominant country in four of the seven clusters analyzed. The independent analysis of the indexing category of the journals highlights that Medicine and Environmental Sciences are the most relevant areas in the field of bibliometrics, after Social Sciences and Computer Science.
In conclusion, there are many parameters that can be used to see the evolution of bibliometric studies in the period under analysis. In this case, bibliometric data and indicators have been used to study the evolution of this discipline over the years and the performance of publications. In any analysis it is important to start from the objectives of the study to be able to apply the appropriate metric values. In this sense, the recommendations established in the Leiden Manifesto and the San Francisco Declaration should not be forgotten to make proper use of the metrics that allow scientific production to be correctly assessed.

Author Contributions

M.C. and A.A. conceived and performed the research; A.A. and E.S.-M. analyzed the data; M.C., A.A. and F.M.-A. wrote the paper. A.A. and F.M.-A. supervised the research. E.S.-M. and F.M.-A. revised the manuscript. They share the structure and aims of the manuscript, paper drafting, editing and review. All authors have read and agreed to the published version of the manuscript.

Funding

This research received no external funding.

Institutional Review Board Statement

Not applicable.

Informed Consent Statement

Not applicable.

Data Availability Statement

Data retrieved from Scopus, SciVal, WoS, Incites, JCR and SJR databases.

Acknowledgments

The authors would like to thank to the CIAIMBITAL (University of Almeria, CeiA3) for its support.

Conflicts of Interest

The authors declare no conflict of interest.

References

  1. Cole, F.J.; Eales, N.B. The history of comparative anatomy: Part I—A statistical analysis of the literature. Sci. Prog. 1917, 11, 578–596. [Google Scholar]
  2. Lotka, A.J. The frequency distribution of scientific productivity. J. Wash. Acad. Sci. 1926, 16, 317–323. [Google Scholar]
  3. Price, D.J. Little Science, Big Science; Columbia Univ. Press: New York, NY, USA, 1963. [Google Scholar]
  4. Gross, P.L.; Gross, E.M. College libraries and chemical education. Science 1927, 66, 385–389. [Google Scholar] [CrossRef] [PubMed]
  5. Bradford, S.C. Sources of information on specific subjects. Engineering 1934, 137, 85–86. [Google Scholar]
  6. Cason, H.; Lubotsky, M. The influence and dependence of psychological journals on each other. Psychol. Bull. 1936, 33, 95. [Google Scholar] [CrossRef]
  7. Garfield, E. Citation indexes for science. Science 1955, 122, 108–111. [Google Scholar] [CrossRef] [PubMed]
  8. Garfield, E. Is citation analysis a legitimate evaluation tool? Scientometrics 1979, 1, 359–375. [Google Scholar] [CrossRef]
  9. Pinski, G.; Narin, F. Citation influence for journal aggregates of scientific publications: Theory, with application to the literature of physics. Inf. Process. Manag. 1976, 12, 297–312. [Google Scholar] [CrossRef] [Green Version]
  10. Tomer, C. A statistical assessment of two measures of citation: The impact factor and the immediacy index. Inf. Process. Manag. 1986, 22, 251–258. [Google Scholar] [CrossRef]
  11. Tijssen, R.J.; Visser, M.S.; Van Leeuwen, T.N. Searching for scientific excellence: Scientometric measurements and citation analyses of national research systems. In Proceedings of the 8th International Conference on Scientometrics and Informetrics Proceedings-ISSI-2001, Sidney, Australia, 16–20 July 2001; pp. 675–689. [Google Scholar]
  12. Lariviere, V.; Sugimoto, C.R. The journal impact factor: A brief history, critique, and discussion of adverse effects. In Springer Handbook of Science and Technology Indicators; Springer: Cham, Switzerland, 2019; pp. 3–24. [Google Scholar]
  13. González-Pereira, B.; Guerrero-Bote, V.P.; Moya-Anegón, F. A new approach to the metric of journals’ scientific prestige: The SJR indicator. J. Informetr. 2010, 4, 379–391. [Google Scholar] [CrossRef]
  14. Zijlstra, H.; McCullough, R. CiteScore: A New Metric to Help You Track Journal Performance and Make Decisions; Elsevier: Amsterdam, The Netherlands, 2016; Available online: https://www.elsevier.com/editors-update/story/journal-metrics/citescore-a-new-metric-to-help-you-choose-the-right-journal (accessed on 18 February 2021).
  15. Bergstrom, C.T.; West, J. Comparing Impact Factor and Scopus CiteScore. Eigenfactor.org. 2016. Available online: http://eigenfactor.org/projects/posts/citescore.php (accessed on 18 February 2021).
  16. Davis, P. Changing Journal Impact Factor Rules Creates Unfair Playing Field For Some. Available online: https://scholarlykitchen.sspnet.org/2021/02/01/unfair-playing-field/ (accessed on 18 February 2021).
  17. Liu, W. A matter of time: Publication dates in Web of Science Core Collection. Scientometrics 2021, 126, 849–857. [Google Scholar] [CrossRef]
  18. McVeigh, M.; Quaderi, N. Adding Early Access Content to Journal Citation Reports Choosing a Prospective Model. Available online: https://clarivate.com/webofsciencegroup/article/adding-early-access-content-to-journal-citation-reports-choosing-a-prospective-model/ (accessed on 18 February 2021).
  19. López-Robles, J.R.; Guallar, J.; Otegi-Olaso, J.R.; Gamboa-Rosales, N.K. El profesional de la información (EPI): Bibliometric and thematic analysis (2006–2017). El Profesional. de la Información. 2019, 28, e280417. [Google Scholar] [CrossRef]
  20. Pritchard, A. Statistical bibliography or bibliometrics. J. Doc. 1969, 25, 348–349. [Google Scholar]
  21. Broadus, R.N. Toward a definition of “bibliometrics”. Scientometrics 1987, 12, 373–379. [Google Scholar] [CrossRef]
  22. Moed, H.F. Bibliometric measurement of research performance and Price’s theory of differences among the sciences. Scientometrics 1989, 15, 473–483. [Google Scholar] [CrossRef]
  23. White, H.D.; McCain, K.W. Bibliometrics. Annu. Rev. Inf. Sci. Technol. 1989, 24, 119–186. [Google Scholar]
  24. Spinak, E. Diccionario Enciclopédico de Bibliometría, Cienciometría e Informetría; UNESCO: Caracas, Venezuela, 1996. [Google Scholar]
  25. Garcia-Zorita, C.; Rousseau, R.; Marugan-Lazaro, S.; Sanz-Casado, E. Ranking dynamics and volatility. J. Informetr. 2018, 12, 567–578. [Google Scholar] [CrossRef]
  26. Web of Science Group. 2021. Available online: https://clarivate.com/webofsciencegroup/ (accessed on 18 February 2021).
  27. Traag, V.A.; Waltman, L.; Van Eck, N.J. From Louvain to Leiden: Guaranteeing well-connected communities. Sci. Rep. 2019, 9, 1–12. [Google Scholar] [CrossRef] [PubMed]
  28. Elsevier. 2021. Available online: https://www.elsevier.com/es-es (accessed on 18 February 2021).
  29. Hicks, D.; Wouters, P.; Waltman, L.; De Rijcke, S.; Rafols, I. Bibliometrics: The Leiden Manifesto for research metrics. Nat. News 2015, 520, 429. [Google Scholar] [CrossRef] [PubMed] [Green Version]
  30. American Society for Cell Biology. San Francisco Declaration on Research Assessment. 2012. Available online: https://sfdora.org/read/ (accessed on 18 February 2021).
  31. Liu, W. The data source of this study is Web of Science Core Collection? Not enough. Scientometrics 2019, 121, 1815–1824. [Google Scholar] [CrossRef]
  32. Montoya, F.G.; Alcayde, A.; Baños, R.; Manzano-Agugliaro, F. A fast method for identifying worldwide scientific collaborations using the Scopus database. Telemat. Inform. 2018, 35, 168–185. [Google Scholar] [CrossRef]
  33. Klavans, R.; Boyack, K.W. Research portfolio analysis and topic prominence. J. Informetr. 2017, 11, 1158–1174. [Google Scholar] [CrossRef] [Green Version]
  34. Dresbeck, R. SciVal. J. Med Libr. Assoc. 2015, 103, 164. [Google Scholar] [CrossRef]
  35. Scopus. How Are CiteScore Metrics Used in Scopus? 2021. Available online: https://service.elsevier.com/app/answers/detail/a_id/14880/supporthub/scopus/ (accessed on 18 February 2021).
  36. Clarivate. Journal Citation Reports Help. 2021. Available online: http://jcr.help.clarivate.com/Content/home.htm (accessed on 18 February 2021).
  37. Scimago Journal Country Rank. SJR Scimago Journal Country Rank. 2021. Available online: https://www.scimagojr.com/ (accessed on 18 February 2021).
  38. Scopus. What Is Field-Weighted Citation Impact (FWCI)? 2021. Available online: https://service.elsevier.com/app/answers/detail/a_id/14894/supporthub/scopus/kw/FWCI/ (accessed on 18 February 2021).
  39. Van Eck, N.J.; Waltman, L. Software survey: VOSviewer, a computer program for bibliometric mapping. Scientometrics 2010, 84, 523–538. [Google Scholar] [CrossRef] [Green Version]
  40. Fahimnia, B.; Sarkis, J.; Davarzani, H. Green supply chain management: A review and bibliometric analysis. Int. J. Prod. Econ. 2015, 162, 101–114. [Google Scholar] [CrossRef]
  41. Zhu, J.; Liu, W. Comparing like with like: China ranks first in SCI-indexed research articles since 2018. Scientometrics 2020, 124, 1691–1700. [Google Scholar] [CrossRef]
  42. Zhang, P.; Yan, F.; Du, C. A comprehensive analysis of energy management strategies for hybrid electric vehicles based on bibliometrics. Renew. Sustain. Energy Rev. 2015, 48, 88–104. [Google Scholar] [CrossRef]
  43. Ramos-Rodríguez, A.R.; Ruíz-Navarro, J. Changes in the intellectual structure of strategic management research: A bibliometric study of the Strategic Management Journal, 1980–2000. Strateg. Manag. J. 2004, 25, 981–1004. [Google Scholar] [CrossRef]
  44. Heradio, R.; De La Torre, L.; Galan, D.; Cabrerizo, F.J.; Herrera-Viedma, E.; Dormido, S. Virtual and remote labs in education: A bibliometric analysis. Comput. Educ. 2016, 98, 14–38. [Google Scholar] [CrossRef]
  45. Merigó, J.M.; Mas-Tur, A.; Roig-Tierno, N.; Ribeiro-Soriano, D. A bibliometric overview of the Journal of Business Research between 1973 and 2014. J. Bus. Res. 2015, 68, 2645–2653. [Google Scholar] [CrossRef]
  46. Costas, R.; Bordons, M. The h-index: Advantages, limitations and its relation with other bibliometric indicators at the micro level. J. Informetr. 2007, 1, 193–203. [Google Scholar] [CrossRef] [Green Version]
  47. Liu, X.; Zhang, L.; Hong, S. Global biodiversity research during 1900–2009: A bibliometric analysis. Biodivers. Conserv. 2011, 20, 807–826. [Google Scholar] [CrossRef]
  48. CWTS. The Centre for Science and Technology Studies (CWTS). 2021. Available online: https://www.cwts.nl/about-cwts (accessed on 18 February 2021).
  49. Hirsch, J.E. An index to quantify an individual’s scientific research output. Proc. Natl. Acad. Sci. USA 2005, 102, 16569–16572. [Google Scholar] [CrossRef] [Green Version]
  50. Bartneck, C.; Kokkelmans, S. Detecting h-index manipulation through self-citation analysis. Scientometrics 2011, 87, 85–98. [Google Scholar] [CrossRef] [PubMed] [Green Version]
  51. Schreiber, M. A modification of the h-index: The hm-index accounts for multi-authored manuscripts. J. Informetr. 2008, 2, 211–216. [Google Scholar] [CrossRef] [Green Version]
  52. Opthof, T. Inflation of impact factors by journal self-citation in cardiovascular science. Neth. Heart J. 2013, 21, 163–165. [Google Scholar] [CrossRef] [PubMed] [Green Version]
  53. Jeong, Y.K.; Song, M.; Ding, Y. Content-based author co-citation analysis. J. Informetr. 2014, 8, 197–211. [Google Scholar] [CrossRef]
  54. Liu, W.; Gu, M.; Hu, G.; Li, C.; Liao, H.; Tang, L.; Shapira, P. Profile of developments in biomass-based bioenergy research: A 20-year perspective. Scientometrics 2014, 99, 507–521. [Google Scholar] [CrossRef]
  55. Salmerón-Manzano, E.; Garrido-Cardenas, J.A.; Manzano-Agugliaro, F. Worldwide research trends on medicinal plants. Int. J. Environ. Res. Public Health 2020, 17, 3376. [Google Scholar] [CrossRef]
  56. Aznar-Sánchez, J.A.; Piquer-Rodríguez, M.; Velasco-Muñoz, J.F.; Manzano-Agugliaro, F. Worldwide research trends on sustainable land use in agriculture. Land Use Policy 2019, 87, 104069. [Google Scholar] [CrossRef]
  57. Montoya, F.G.; Baños, R.; Meroño, J.E.; Manzano-Agugliaro, F. The research of water use in Spain. J. Clean. Prod. 2016, 112, 4719–4732. [Google Scholar] [CrossRef]
  58. Garrido-Cardenas, J.A.; Cebrián-Carmona, J.; González-Cerón, L.; Manzano-Agugliaro, F.; Mesa-Valle, C. Analysis of global research on malaria and Plasmodium vivax. Int. J. Environ. Res. Public Health 2019, 16, 1928. [Google Scholar] [CrossRef] [PubMed] [Green Version]
  59. Garrido-Cardenas, J.A.; Esteban-García, B.; Agüera, A.; Sánchez-Pérez, J.A.; Manzano-Agugliaro, F. Wastewater treatment by advanced oxidation process and their worldwide research trends. Int. J. Environ. Res. Public Health 2020, 17, 170. [Google Scholar] [CrossRef] [PubMed] [Green Version]
  60. Aznar-Sánchez, J.A.; Velasco-Muñoz, J.F.; Belmonte-Ureña, L.J.; Manzano-Agugliaro, F. Innovation and technology for sustainable mining activity: A worldwide research assessment. J. Clean. Prod. 2019, 221, 38–54. [Google Scholar] [CrossRef]
  61. Blanco-Mesa, F.; Merigo, J.M.; Gil-Lafuente, A.M. Fuzzy decision making: A bibliometric-based review. J. Intell. Fuzzy Syst. 2017, 32, 2033–2050. [Google Scholar] [CrossRef] [Green Version]
  62. Montoya, F.G.; Baños, R.; Alcayde, A.; Montoya, M.G.; Manzano-Agugliaro, F. Power quality: Scientific collaboration networks and research trends. Energies 2018, 11, 2067. [Google Scholar] [CrossRef] [Green Version]
  63. Garfield, E. The history and meaning of the journal impact factor. JAMA 2006, 295, 90–93. [Google Scholar] [CrossRef]
  64. Loannidis, J.P. Contradicted and initially stronger effects in highly cited clinical research. JAMA 2005, 294, 218–228. [Google Scholar] [CrossRef] [Green Version]
  65. Abraham, C.; Michie, S. A taxonomy of behavior change techniques used in interventions. Health Psychol. 2008, 27, 379. [Google Scholar] [CrossRef] [PubMed] [Green Version]
  66. Vilagut, G.; Ferrer, M.; Rajmil, L.; Rebollo, P.; Permanyer-Miralda, G.; Quintana, J.M.; Santed, R.; Valderas, J.M.; Ribera, A.; Domingo-Salvany, A.; et al. The Spanish version of the Short Form 36 Health Survey: A decade of experience and new developments. Gac. Sanit. 2005, 19, 135–150. [Google Scholar] [CrossRef] [Green Version]
  67. Valderrama-Zurián, J.C.; González-Alcaide, G.; Valderrama-Zurián, F.J.; Aleixandre-Benavent, R.; Miguel-Dasit, A. Coauthorship networks and institutional collaboration in Revista Española de Cardiología publications. Rev. Española Cardiol. 2007, 60, 117–130. [Google Scholar] [CrossRef]
  68. Benavent, R.A.; Valderrama-Zurian, J.C.; Gomez, M.C.; Melendez, R.S.; Molina, C.N. Impact factor of the Spanish medical journals. Med. Clin. 2004, 123, 697–701. [Google Scholar]
  69. Ramos, J.M.; González-Alcaide, G.; Bolaños-Pizarro, M. Bibliometric analysis of leishmaniasis research in Medline (1945–2010). Parasites Vectors 2013, 6, 1–14. [Google Scholar] [CrossRef] [PubMed] [Green Version]
  70. Austin, P.C. A critical appraisal of propensity-score matching in the medical literature between 1996 and 2003. Stat. Med. 2008, 27, 2037–2049. [Google Scholar] [CrossRef]
  71. De Jong, M.; Joss, S.; Schraven, D.; Zhan, C.; Weijnen, M. Sustainable–smart–resilient–low carbon–eco–knowledge cities; making sense of a multitude of concepts promoting sustainable urbanization. J. Clean. Prod. 2015, 109, 25–38. [Google Scholar] [CrossRef] [Green Version]
  72. Ren, Y.; Yu, M.; Wu, C.; Wang, Q.; Gao, M.; Huang, Q.; Liu, Y. A comprehensive review on food waste anaerobic digestion: Research updates and tendencies. Bioresour. Technol. 2018, 247, 1069–1076. [Google Scholar] [CrossRef] [PubMed]
  73. Ferretti, F.; Saltelli, A.; Tarantola, S. Trends in sensitivity analysis practice in the last decade. Sci. Total Environ. 2016, 568, 666–670. [Google Scholar] [CrossRef] [PubMed]
  74. Albort-Morant, G.; Henseler, J.; Leal-Millán, A.; Cepeda-Carrión, G. Mapping the field: A bibliometric analysis of green innovation. Sustainability 2017, 9, 1011. [Google Scholar] [CrossRef] [Green Version]
  75. Meerow, S.; Newell, J.P.; Stults, M. Defining urban resilience: A review. Landsc. Urban Plan. 2016, 147, 38–49. [Google Scholar] [CrossRef]
  76. Janssen, M.A.; Schoon, M.L.; Ke, W.; Börner, K. Scholarly networks on resilience, vulnerability and adaptation within the human dimensions of global environmental change. Glob. Environ. Chang. 2006, 16, 240–252. [Google Scholar] [CrossRef] [Green Version]
  77. Williams, R.; Wright, A.J.; Ashe, E.; Blight, L.K.; Bruintjes, R.; Canessa, R.; Wale, M.A. Impacts of anthropogenic noise on marine life: Publication patterns, new discoveries, and future directions in research and management. Ocean Coast. Manag. 2015, 115, 17–24. [Google Scholar] [CrossRef] [Green Version]
  78. Zhang, L.; Wang, M.H.; Hu, J.; Ho, Y.S. A review of published wetland research, 1991–2008: Ecological engineering and ecosystem restoration. Ecol. Eng. 2010, 36, 973–980. [Google Scholar] [CrossRef]
  79. Padilla, F.M.; Gallardo, M.; Manzano-Agugliaro, F. Global trends in nitrate leaching research in the 1960–2017 period. Sci. Total Environ. 2018, 643, 400–413. [Google Scholar] [CrossRef]
  80. la Cruz-Lovera, D.; Perea-Moreno, A.J.; la Cruz-Fernández, D.; Alvarez-Bermejo, J.A.; Manzano-Agugliaro, F. Worldwide research on energy efficiency and sustainability in public buildings. Sustainability 2017, 9, 1294. [Google Scholar] [CrossRef] [Green Version]
Figure 1. Methodology.
Ijerph 18 05851 g001
Figure 2. Bibliometric publications trend (Source Scopus).
Ijerph 18 05851 g002
Figure 3. Bibliometric publications trend (Source WoS).
Ijerph 18 05851 g003
Figure 4. Worldwide distribution by country of scientific production on bibliometrics.
Ijerph 18 05851 g004
Figure 5. Subject area in Scopus and its trend from 2000 to 2020.
Ijerph 18 05851 g005
Figure 6. CNCI vs. FWCI for the top 20 journals.
Ijerph 18 05851 g006
Figure 7. Global distribution of bibliometric publications by country in the medicine category.
Ijerph 18 05851 g007
Figure 8. Global distribution of bibliometric publications by country in the environmental sciences category.
Ijerph 18 05851 g008
Figure 9. Scientific communities of bibliometric publications.
Ijerph 18 05851 g009
Table 1. Main affiliations according to Scopus and WoS.
RankScopusWoS
AffiliationNTOTNIC
SciVal
IC
(%)
AffiliationNTOTNIC
InCites
IC
(%)
1Universidad de Granada2595521.2Consejo Superior de Investigaciones Científicas (CSIC)1984723.7
2University of Valencia2117435.1University of Granada1984924.7
3Consejo Superior de Investigaciones Científicas (CSIC)1966131.1Leiden University1545938.3
4Chinese Academy of Sciences1885026.6Chinese Academy of Sciences1384633.3
5Leiden University1776235.0University of Valencia1333929.3
6Universidade de São Paulo1362216.2Asia University Taiwan1298364.3
7Asia University Taiwan1339168.4Max Planck Society1205747.5
8Wuhan University1183933.1University of London1156758.3
9Consiglio Nazionale delle Ricerche (CNR)1141815.8Consiglio Nazionale delle Ricerche (CNR)1122017.9
10Peking University1116155.0University of Rome Tor Vergata1091816.5
11University of Rome Tor Vergata1091816.5Peking University1015352.5
12Administrative Headquarters of the Max Planck Society1065249.1Wuhan University1013433.7
13Universitat Politècnica de València1043533.7University System of Georgia906774.4
14Universidad de Chile1008181.0KU Leuven805973.8
15KU Leuven926267.4Universitat Politecnica de Valencia803037.5
16Sichuan University853642.4Harvard University783544.9
17Georgia Institute of Technology856576.5Istituto di Analisi dei Sistemi ed Informatica Antonio Ruberti (IASI-CNR)78810.3
18An-Najah National University852630.6Georgia Institute of Technology735879.5
19Universidade Federal de Santa Catarina821923.2University of Barcelona733446.6
20Universitat de Barcelona805670.0Universidade de São Paulo72912.5
NTOT = Total number of publications; NIC = number publications with international collaboration.
Table 2. Topic Name (Scival) for bibliometrics publications.
Topic NameNCC/D
Hirsch Index, Self-Citation, Journal Impact Factor100516,41716.34
Intellectual Structure, Co-citation Analysis, Scientometrics98017,63918.00
Co-Authorship, Scientific Collaboration, Scientometrics74311,15915.02
Citation Counts, Bibliometric Analysis, Journal Impact Factor438489711.18
Scientometrics, Research Productivity, Bibliometric Analysis31915804.95
European Regional Development Fund, Bibliometric Indicators, ERDF28321867.72
Beauties, Citations, Sleeping Beauty220229510.43
Social Science and Humanities, Research Evaluation, Book Publishers198889544.92
Bibliometric Analysis, Citation Index, Document Type188347218.47
Readership, Citation Counts, Journal Impact Factor186286315.39
Scientific Journals, Doctoral Thesis, Spanish Universities14610787.38
Technology Roadmapping, Patent Analysis, Technological Competitiveness145330622.80
Female Scientist, Research Productivity, Women in Science120159613.30
Research Productivity, Bibliometric Analysis, Arab Countries114121310.64
Scientific Publications, Research Productivity, Bibliometric Analysis101109010.79
Tourism Research, Tourism and Hospitality, Hospitality Management85151717.85
Citations, Summarization, Scholarly Publication686479.51
Open Access Publishing, Scholarly Communication, Preprints675868.75
Economists, Co-Authorship, Economic Journals615969.77
Library Science, Tenure, Land Information System574958.68
N = Total number of publications; C = total number of citations; C/D = cites per document.
Table 3. Topic Cluster Name (Scival) for bibliometrics publications.
Topic Cluster NameNCC/D
Publications, Periodicals as Topic, Research602084,21713.99
Industry, Innovation, Entrepreneurship536959317.90
Library, Librarian, Information19615607.96
Research, Meta-Analysis as Topic, Guidelines as Topic16315309.39
Periodicals as Topic, Open Access, Library146156010.68
Tourism, Tourists, Destination133198714.94
Industry, Research, Marketing130142910.99
Supply Chains, Supply Chain Management, Industry129190714.78
Semantics, Models, Recommender Systems114117110.27
Corporate Social Responsibility, Corporate Governance, Firms110127711.61
Schools, Brazil, Education1083823.54
Electricity, Energy, Economics101160515.89
Brazil, Health, Nursing953633.82
Libraries, Metadata, Ontology812463.04
Work, Personality, Psychology7891111.68
Students, Medical Students, Education775637.31
Construction, Construction Industry, Project Management7497113.12
Research, Data, Information Dissemination6067611.27
Rotavirus, Norovirus, Coronavirus563696.59
Decision Making, Fuzzy Sets, Models51118423.22
N = Total number of publications; C = total number of citations; C/D = cites per document.
Table 4. Indexing by category according to WoS.
CategoryN%C/D
Information Science and Library Science250816.315.8
Computer Science, Interdisciplinary Applications155210.117.7
Computer Science, Information Systems6664.314.3
Environmental Sciences6164.09.5
Management5213.418.2
Business3792.516.8
Public, Environmental and Occupational Health3732.47.7
Green and Sustainable Science and Technology3312.112.0
Surgery2991.98.5
Environmental Studies2891.98.7
Education and Educational Research2701.85.0
Economics2251.55.4
Clinical Neurology2041.39.2
Computer Science, Theory and Methods1951.32.6
Computer Science, Artificial Intelligence1941.39.9
Engineering, Electrical and Electronic1741.14.4
Operations Research and Management Science1711.117.1
Health Care Sciences and Services1651.111.0
Social Sciences, Interdisciplinary1621.13.5
Engineering, Industrial1450.918.1
N = Total number of publications; C/D = cites per document.
Table 5. Macro topics (InCites).
Macro TopicCodeNCC/D
Social Sciences6561480,78314.39
Clinical and Life Sciences1104777717.42
Electrical Engineering, Electronics and Computer Science4387473212.23
Agriculture, Environment and Ecology327825879.31
Chemistry2105106810.17
Earth Sciences8625228.42
Engineering and Materials Science74650010.87
Arts and Humanities10441994.52
Physics529832.86
Mathematics914684.86
N = Total number of publications; C = total number of citations; C/D = cites per document.
Table 6. Meso topics (InCites).
Meso TopicCodeNCC/D
Bibliometrics, Scientometrics and Research Integrity6.238448967,42015.02
Management6.3397604915.24
Medical Ethics1.155144147710.26
Sustainability Science6.115114163314.32
Nursing1.141018088.00
Knowledge Engineering and Representation4.48904845.38
Education and Educational Research6.11867168.33
Hospitality, Leisure, Sport and Tourism6.22370105315.04
Forestry3.406985312.36
Healthcare Policy1.156585699.81
Economics6.105759510.44
Climate Change6.153565119.13
Artificial Intelligence and Machine Learning4.6151101219.84
Human Geography6.864855911.65
Design and Manufacturing4.2244771515.21
Social Psychology6.73412476.02
Operations Research and Management Science6.2944069117.28
Supply Chain and Logistics4.843758115.70
Marine Biology3.2352156.14
Psychiatry1.21343329.76
N = Total number of publications; C = total number of citations; C/D = cites per document.
Table 7. Micro topics (InCites).
Micro TopicCodeNCC/D
Bibliometrics6.238.166446066,78214.97
Knowledge Management6.3.2134219916.41
Systematic Reviews1.155.611877188.25
Corporate Social Responsibility6.3.38566111316.86
Tourism6.223.24761101416.62
Foresight6.294.18073968917.67
Entrepreneurship6.3.7263874319.55
Environmental Kuznets Curve6.115.2343147115.19
Academic Entrepreneurship6.3.14673156918.35
Information Literacy4.48.228301535.10
Customer Satisfaction6.3.652936912.72
Project Scheduling4.224.5992849517.68
Fuzzy Sets4.61.562885730.61
Agglomeration Economies6.86.2802735613.19
Internationalization6.3.1229232269.83
Internet of Things4.13.8072248121.86
Sentiment Analysis4.48.672211497.10
Unified Health System1.156.1509201065.30
Corporate Governance6.10.632037918.95
Life Cycle Assessment6.115.11812025812.90
N = Total number of publications; C = total number of citations; C/D = cites per document.
Table 8. Main indexes of WoS-JCR and Scopus-SJR bibliometric sources.
RankWoS—JCRScopus—SJR
JournalN1Cit1Q1IF2IF5JournalN2Cit2Q2IF3CS
1Scientometrics105120,447Q12.873.07Scientometrics103626,087Q11.2105.6
2Journal of Informetrics2035691Q14.614.41Library Philosophy and Practice307406Q20.2200.3
3Sustainability180852Q22.582.8Journal of Informetrics2047542Q12.0798.4
4Journal of the American Society for Information Science and Technology833178n/an/an/aSustainability1851483Q20.5813.2
5Journal of the Association for Information Science and Technology811609Q22.413.17Journal of the American Society for Information Science and Technology834018N/AN/AN/A
6Revista Española de Documentación Científica74252Q31.31.12Revista Española de Documentación Científica81552Q20.4971.7
7Journal of Cleaner Production741287Q17.257.49Malaysian Journal of Library and Information Science81732Q20.4141.3
8Current Science71292Q40.730.88Lecture Notes in Computer Science (including subseries Lecture Notes in Artificial Intelligence and Lecture Notes in Bioinformatics)78244Q20.4271.9
9Research Evaluation64914Q22.573.41Espacios7857Q30.2150.5
10Technological Forecasting and Social Change611934Q15.855.18Journal of Cleaner Production751867Q11.88610.9
11Profesional de la Información60351Q31.581.42Journal of the Association for Information Science and Technology742317Q11.2707.9
12Environmental Science and Pollution Research59352Q23.063.31Current Science69427Q20.2381.2
13International Journal of Environmental Research and Public Health52167Q12.853.13Research Evaluation671165Q11.7925.6
14PLOS ONE51912Q22.743.23ACM International Conference Proceeding Series64114N/A0.2000.8
15World Neurosurgery50306Q31.832.07Profesional de la Información62615Q10.4802.1
16Malaysian Journal of Library and Information Science49215Q31.550.96Technological Forecasting and Social Change622662Q11.8158.7
17Investigación Bibliotecologica4942Q40.350.48CEUR Workshop Proceedings62123N/A0.1770.6
18Medicine49245Q31.552DESIDOC Journal of Library and Information Technology57280Q20.2811.0
19Research Policy412541Q15.357.93World Neurosurgery55463Q20.7272.4
20Journal of Information Science35645Q22.412.34Environmental Science and Pollution Research55403Q20.7884.9
N1 = Number of publications (WoS); Cit1 = Number of citations (WoS); Q1 = Quartile JCR (data 2019); IF2 = Journal Impact Factor JCR (data 2019); IF5 = 5-year Journal Impact Factor JCR (data 2019); N2 = Number of publications (Scopus); Cit2 = Number of citations (Scopus); Q2 = Quartile SJR (data 2019); IF3= Impact SJR (data 2019); CS = Cite Score (data 2019).
Table 9. Top 10 countries and affiliations publishing in Scientometrics.
RankCountryNCC/DAffiliationNCC/D
1China117478816.7KU Leuven271498618.4
2United States112514,84113.2Magyar Tudomanyos Akademia268566021.1
3Spain693753810.9Leiden University248866534.9
4United Kingdom57910,20617.6Consejo Superior de Investigaciones Científicas210292413.9
5Netherlands57212,72022.2Universiteit Antwerpen157264216.8
6Germany558789014.1Wuhan University15211917.8
7Belgium469768116.4Universidad de Granada132196914.9
8India34027878.2Chinese Academy of Sciences1269507.5
9Hungary315597419.0Dalian University of Technology123137511.2
10Italy314319710.2Indiana University Bloomington122177014.5
N = Number of publications (1978–2021); C = Number of citations (1978–2021); C/D = cites per document.
Table 10. CNCI (Category Normalized Citation Impact) from InCites and FWCI (Field-Weighted Citation Impact) from SciVal.
RankInCitesSciVal
WoS Journal NameNCC/DCNCIScopus Journal NameNCC/DFWCI
1Scientometrics105120,44719.51.37Scientometrics103626,08725.22.51
2Journal of Informetrics203569128.02.02Library Philosophy and Practice3074061.30.61
3Sustainability1808524.70.89Journal of Informetrics204754237.03.23
4Journal of the American Society for Information Science and Technology83317838.35.14Sustainability18514838.01.54
5Journal of the Association for Information Science and Technology81160919.97.27Journal of the American Society for Information Science and Technology83401848.42.19
6Revista Española de Documentación Científica742523.40.3Revista Española de Documentación Científica815526.80.94
6Journal of Cleaner Production74128717.41.27Malaysian Journal of Library and Information Science817329.00.72
8Current Science712924.10.42Lecture Notes in Computer Science782443.10.91
9Research Evaluation6491414.33.4Espacios78570.70.11
10Technological Forecasting and Social Change61193431.72.39Journal of Cleaner Production75186724.92.35
11Profesional de la Información603515.91.67Journal of the Association for Information Science and Technology74231731.32.83
12Environmental Science and Pollution Research593526.00.99Current Science694276.20.25
13International Journal of Environmental Research and Public Health521673.21.44Research Evaluation67116517.41.75
14PLOS ONE5191217.91.61ACM International Conference Proceeding Series641141.80.39
15World Neurosurgery503066.11.43Profesional de la Información626159.92.90
16Malaysian Journal of Library and Information Science492154.40.35Technological Forecasting and Social Change62266242.93.95
16Investigación Bibliotecológica49420.90.11CEUR Workshop Proceedings621232.00.71
16Medicine492455.00.78DESIDOC Journal of Library and Information Technology572804.90.76
19Research Policy41254162.02.73World Neurosurgery554638.41.25
20Journal of Information Science3564518.41.13Environmental Science and Pollution Research55403 1.38
Table 11. Top 10 countries and affiliations publishing in Medicine category.
RankCountryNAffiliation (Country)N
1United States1919University of Valencia (Spain)110
2China834University of Toronto (Canada)110
3United Kingdom688Harvard Medical School (USA)102
4Spain597Universidade de Sao Paulo—USP (Brasil)93
5Canada458McMaster University (Canada)86
6Brazil359Consejo Superior de Investigaciones Científicas (Spain)80
7Australia336Universidad Miguel Hernandez de Elche (Spain)73
8Germany303The University of Sydney (Australia)67
9France226An-Najah National University (Palestine)61
10Italy223The University of British Columbia (Canada)56
N = Number of publications (1978–2021); C = Number of citations (1978–2021); C/D = cites per document.
Table 12. Top 10 medical keywords in bibliometric publications in this category and the main affiliations using them.
Medicine TopicNMain Affiliation (Country)
Epidemiology194Universidad Tecnológica de Pereira (Colombia)
Pediatrics194University of Valencia (Spain)
Orthopedics186Centre Hospitalier Universitaire de Clermont-Ferrand (France)
CNRS Centre National de la Recherche Scientifique (France)
Second Military Medical University (China)
McMaster University (Canada)
Cardiology166Universidade de Sao Paulo—USP (Brasil)
Neurosurgery164University of Tennessee Health Science Center (USA)
Radiology152Hallym University, College of Medicine (South Korea)
Ophthalmology134China Medical University Shenyang (China)
Oncology131University of Texas MD Anderson Cancer Center (USA)
University of Michigan, Ann Arbor (USA)
Plastic Surgery121Harvard Medical School (USA)
Massachusetts General Hospital (USA)
Psychiatry119King’s College London (UK)
Universidad de Alcalá (Spain)
Table 13. Top 10 journals publishing articles on bibliometrics in the category of medicine and their main bibliometric source indices.
Rank WoS—JCRScopus—SJR
JournalN1Q1IF2IF5Q2IF3CS
1Journal Of The Medical Library Association87Q22.0422.299Q10.8942.8
2International Journal Of Environmental Research And Public Health83Q12.8493.127Q20.7393.0
3World Neurosurgery82Q31.8292.074Q20.7272.4
4Journal Of Clinical Epidemiology55Q14.9526.234Q12.7029.0
5BMJ Open42Q22.4962.992Q11.2473.5
6Health Research Policy And Systems40Q22.3652.762Q10.9873.8
7Medicine United States40Q31.5521.998Q20.6392.7
8Plastic And Reconstructive Surgery37Q14.2354.387Q11.9165.3
9Revista Cubana De Informacion En Ciencias De La Salud36n/an/an/aQ30.1720.5
10Health Information And Libraries Journal35Q31.3561.280Q20.5212.6
N1 = Number of publications (Scopus); Q1 = Quartile JCR (data 2019); IF2 = Journal Impact Factor JCR (data 2019); IF5 = 5-year Journal Impact Factor JCR (data 2019); Q2 = Quartile SJR (data 2019); IF3 = Impact SJR (data 2019); CS = Cite Score (data 2019).
Table 14. Top 10 countries and affiliations publishing in Environmental Sciences category.
RankCountry/RegionNAffiliation (Country)N
1China485Chinese Academy of Sciences (China)94
2Spain191Universidad de Almeria (Spain)47
3United States177Asia University Taiwan (China)38
4Brazil122University of Chinese Academy of Sciences (China)30
5United Kingdom113Beijing Institute of Technology (China)29
6Australia81Peking University (China)27
7Italy75Ministry of Education China (China)25
8Germany56Research Center for Eco-Environmental Sciences Chinese Academy of Sciences (China)19
9Canada54University of Valencia (Spain)18
10Taiwan50Tianjin University (China)
Beijing Normal University (China)
Wuhan University (China)
18
N = Number of publications (1978–2021); C = Number of citations (1978–2021); C/D = cites per document.
Table 15. Top 10 environmental sciences keywords in bibliometric publications in this category and the main affiliations using them.
Environmental Sciences TopicNMain Affiliation (Country)
Sustainability214Universidad de Almeria (Spain)
Sustainable Development207Universidad de Almeria (Spain)
Climate Change144Chinese Academy of Sciences (China)
Ecology66Chinese Academy of Sciences (China)
Environmental Impact58Universidad de Almeria (Spain)
Biodiversity57Chinese Academy of Sciences (China)
Environmental Protection45Chinese Academy of Sciences (China)
Environmental Management44Chinese Academy of Sciences (China)
Public Health43Goethe-Universität Frankfurt am Main (Germany)
Environmental Monitoring37Chinese Academy of Sciences (China)
Table 16. Top 10 journals publishing articles on bibliometrics in the category of environmental sciences and their main bibliometric source indices.
Rank WoS—JCRScopus—SJR
JournalN1Q1IF2IF5Q2IF3CS
1Sustainability Switzerland239Q22.5762.798Q20.5813.2
2Journal Of Cleaner Production108Q17.2467.491Q11.88610.9
3International Journal Of Environmental Research And Public Health83Q12.8493.127Q20.7393.0
4Environmental Science And Pollution Research60Q23.0563.306Q20.7884.9
5Science Of The Total Environment30Q16.5516.419Q11.6618.6
6Acta Ecologica Sinica30n/an/an/aQ30.2291.1
7Science And Public Policy26Q31.7302.114Q10.7713.3
8Water Switzerland22Q22.5442.709Q10.6573.0
9IOP Conference Series Earth And Environmental Science19n/an/an/aQ30.1750.4
10Ecological Indicators15Q14.2294.968Q11.3317.6
N1 = Number of publications (Scopus); Q1 = Quartile JCR (data 2019); IF2 = Journal Impact Factor JCR (data 2019); IF5 = 5-year Journal Impact Factor JCR (data 2019); Q2 = Quartile SJR (data 2019); IF3 = Impact SJR (data 2019); CS = Cite Score (data 2019).
Table 17. Main keywords of each cluster.
Cluster 5Cluster 4Cluster 1Cluster 3Cluster 6Cluster 2Cluster 0
Science MappingResearch ProductivityMedicineEnvironmental SciencesPsychologyNursingEngineering
28.72%23.29%19.65%11.84%7.02%5.66%3.82%
VosviewerCitation AnalysisCitation AnalysisResearch TrendsBibliometric IndicatorsCitation AnalysisNanotechnology
Citation AnalysisH-indexCitationsWeb Of ScienceImpact FactorAuthorship PatternScientometrics
Web Of ScienceCitationsPublicationsScientometricsBibliometryScientometricsCitation Analysis
Literature ReviewResearch EvaluationScientometricsCitespaceSpainNursingText Mining
ScopusScientometricsH-indexSci-expandedResearchResearch ProductivityInformation Retrieval
ScientometricsImpact FactorImpact FactorSocial Network AnalysisScientific JournalsBibliometric StudyPatent Analysis
Bibliometric StudyAltmetricsResearchScopusScientometricsScopusDigital Libraries
Co-word AnalysisWeb Of ScienceWeb Of ScienceCitationsJournalsIndiaCitations
SustainabilityScopusScopusCitation AnalysisBibliometric StudyAuthor ProductivityNanoscience
Co-citation AnalysisPeer ReviewJournal Impact FactorClimate ChangePublicationsNursing ResearchChina
Network AnalysisJournal Impact FactorPubmedPublicationsCitationsCitationsCitation Network
Science MappingItalyBibliometric StudyImpact FactorWeb Of ScienceImpact FactorTechnology Forecasting
Social Network AnalysisResearch AssessmentVosviewerSciPsychologyLibrary And Information ScienceComputational Linguistics
CitationsPublicationsCOVID-19ResearchDatabasesLotka’s LawEmerging Technologies
Content AnalysisResearchResearch ProductivityVosviewerPeriodicalsResearch OutputResearch Evaluation
CitespaceGoogle ScholarBiomedical ResearchSustainabilityScopusDegree Of CollaborationDocument Clustering
Co-citationUniversitiesLatin AmericaH-indexCitation AnalysisBibliometric IndicatorsBibliometric Study
Research TrendsResearch ProductivityCitespaceScientific ProductionJournal ArticleScientific ProductionPublications
Bibliometric ReviewEvaluationBibliometric IndicatorsResearch HotspotsImpactResearchNetwork Analysis
Table 18. Main database used for each cluster.
ClusterNameWoSScopusMain Country keyword
Cluster 5Science Mapping192133China
Cluster 4Research Productivity7361Italy
Cluster 1Medical Research8175China/India
Cluster 3Environment10237China
Cluster 6Psychology2217Spain
Cluster 2Nursing1220India
Cluster 0Engineering21China
Publisher’s Note: MDPI stays neutral with regard to jurisdictional claims in published maps and institutional affiliations.

