Deformation Time Series and Driving-Force Analysis of Glaciers in the Eastern Tienshan Mountains Using the SBAS InSAR Method


Abstract
:1. Introduction
2. Data and Methods
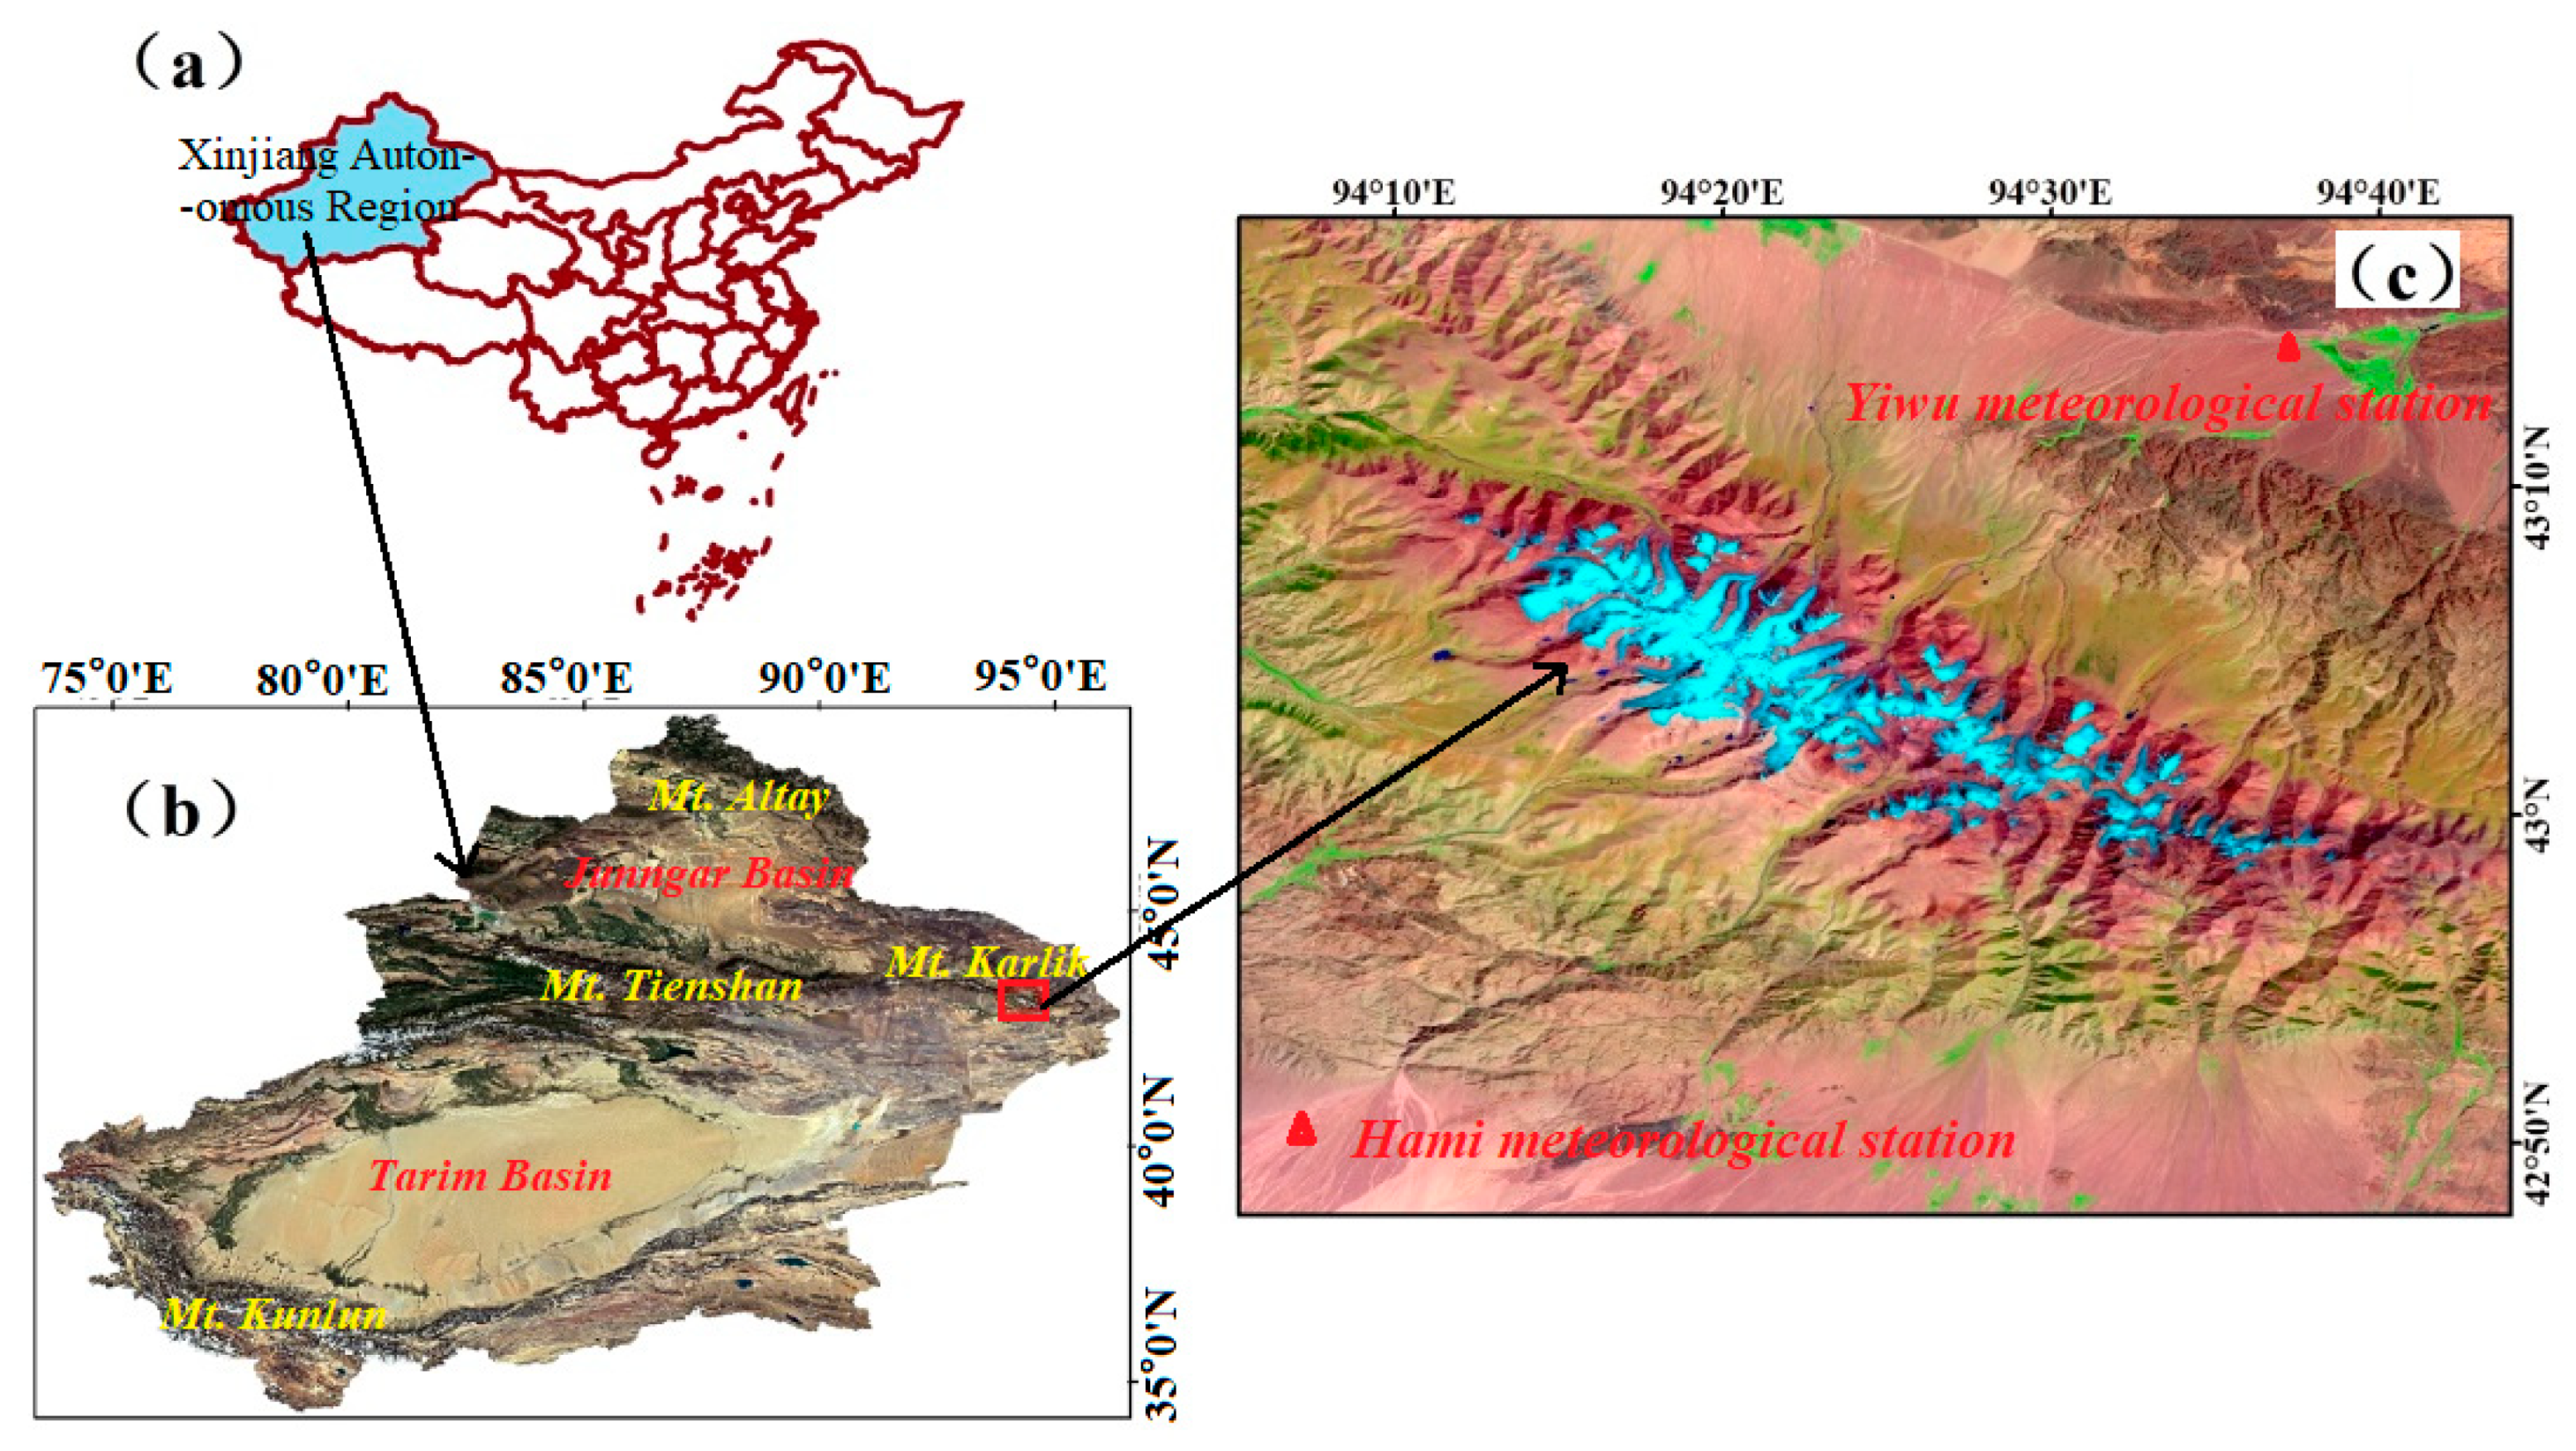
2.1. Study Area
2.2. Data
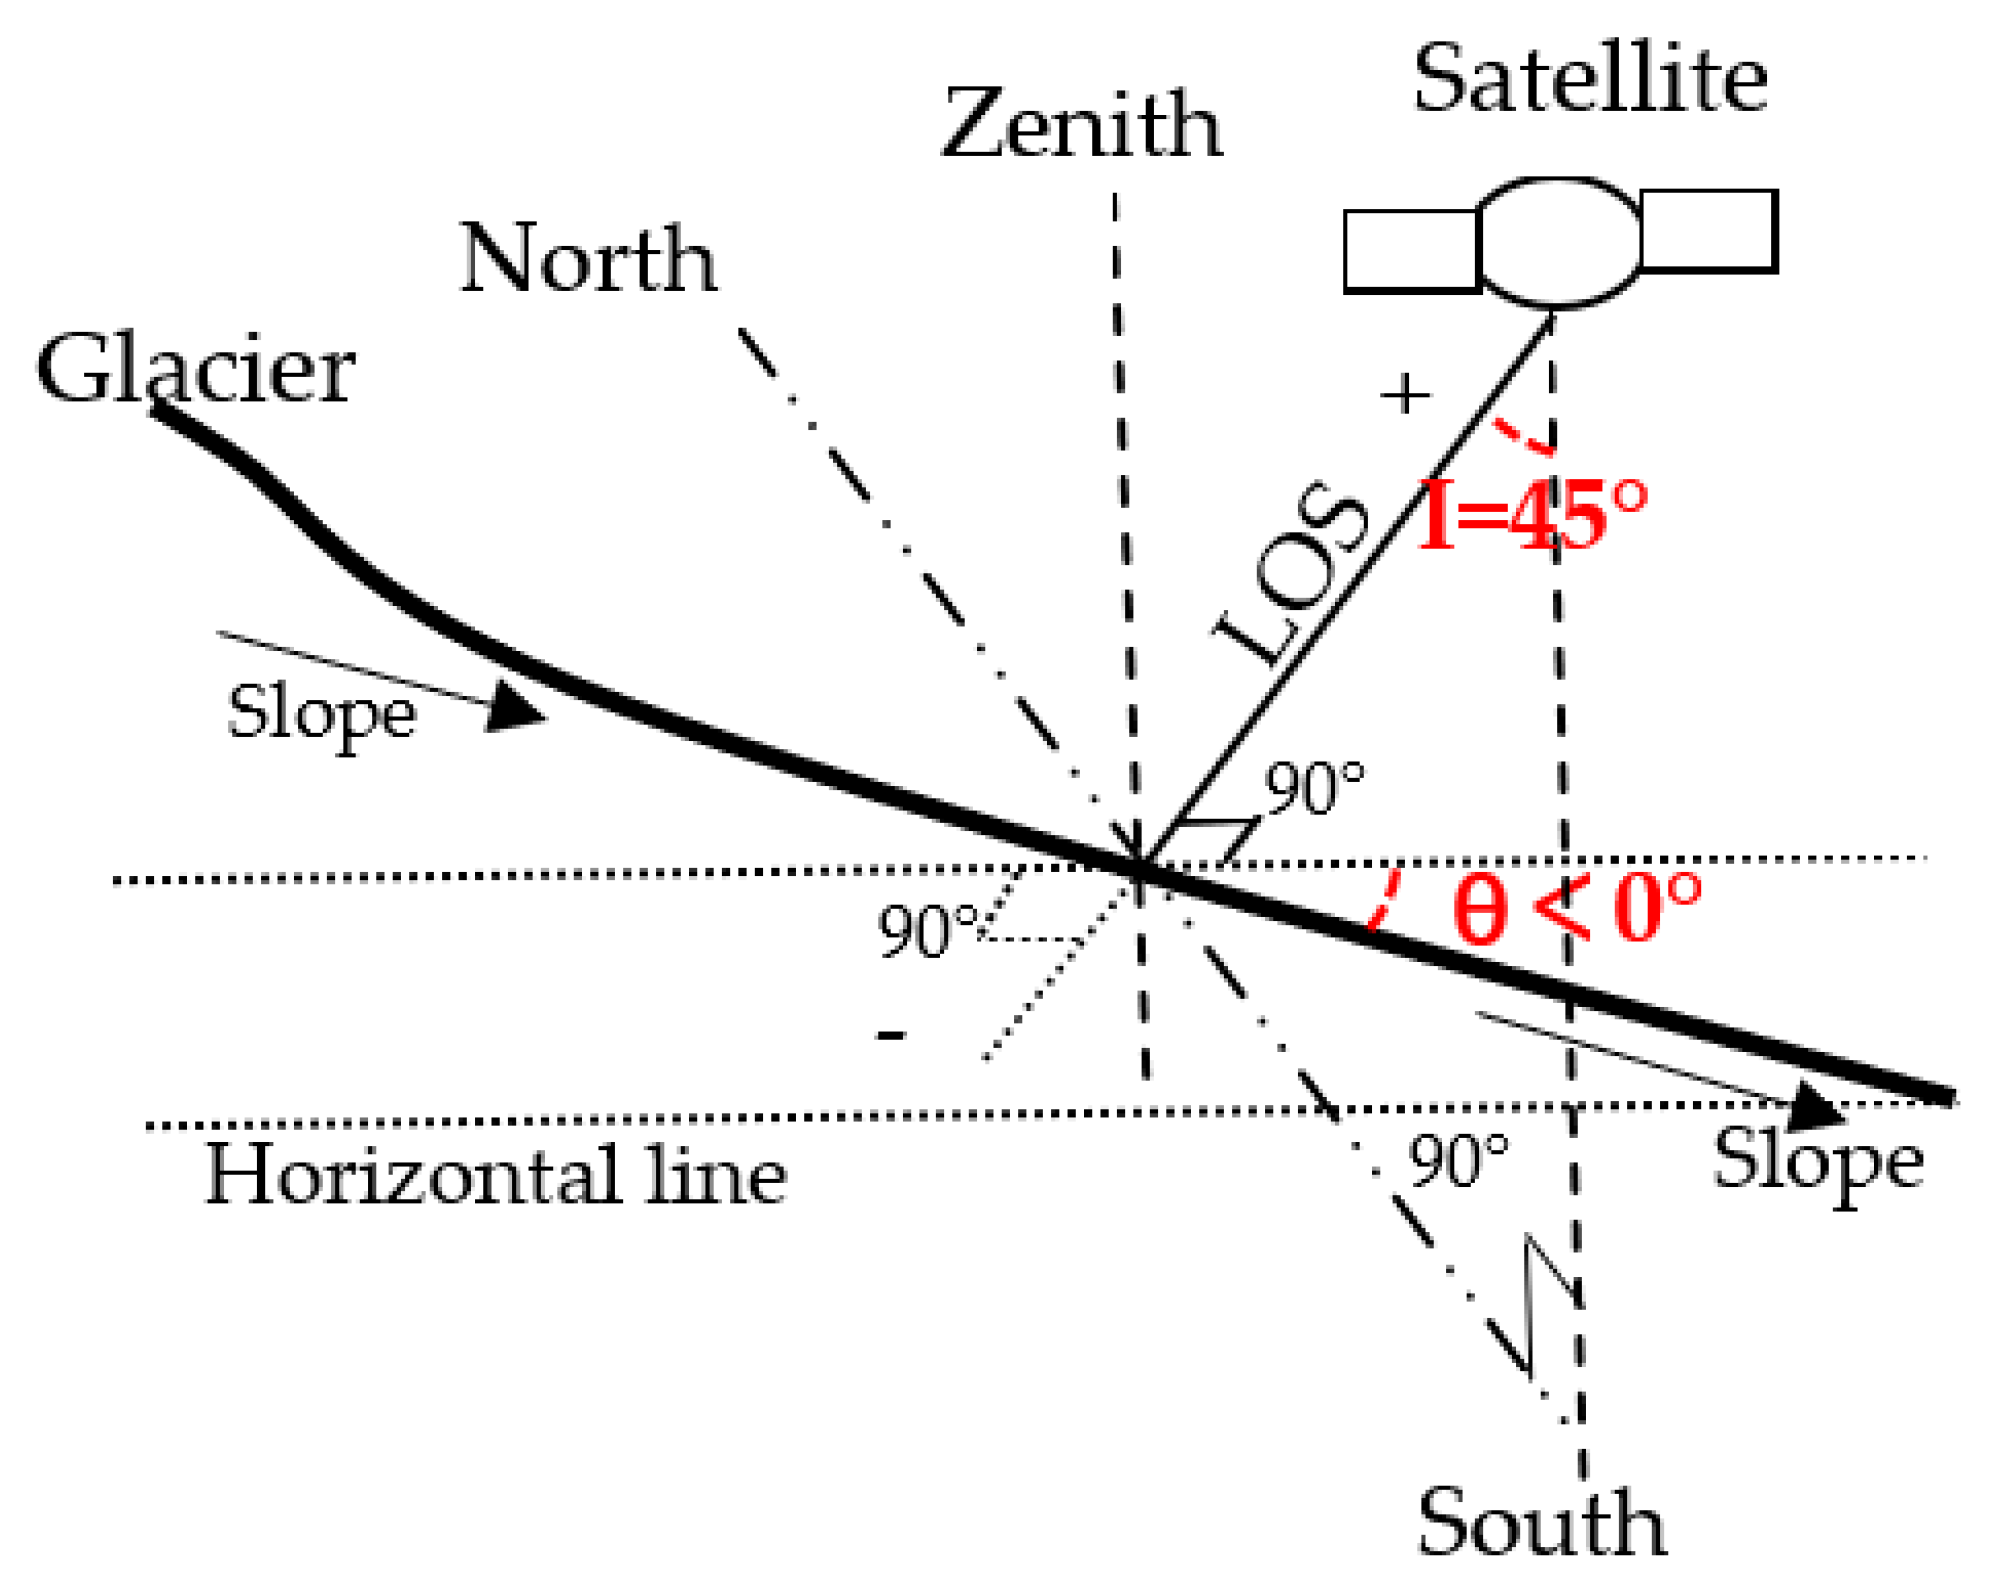
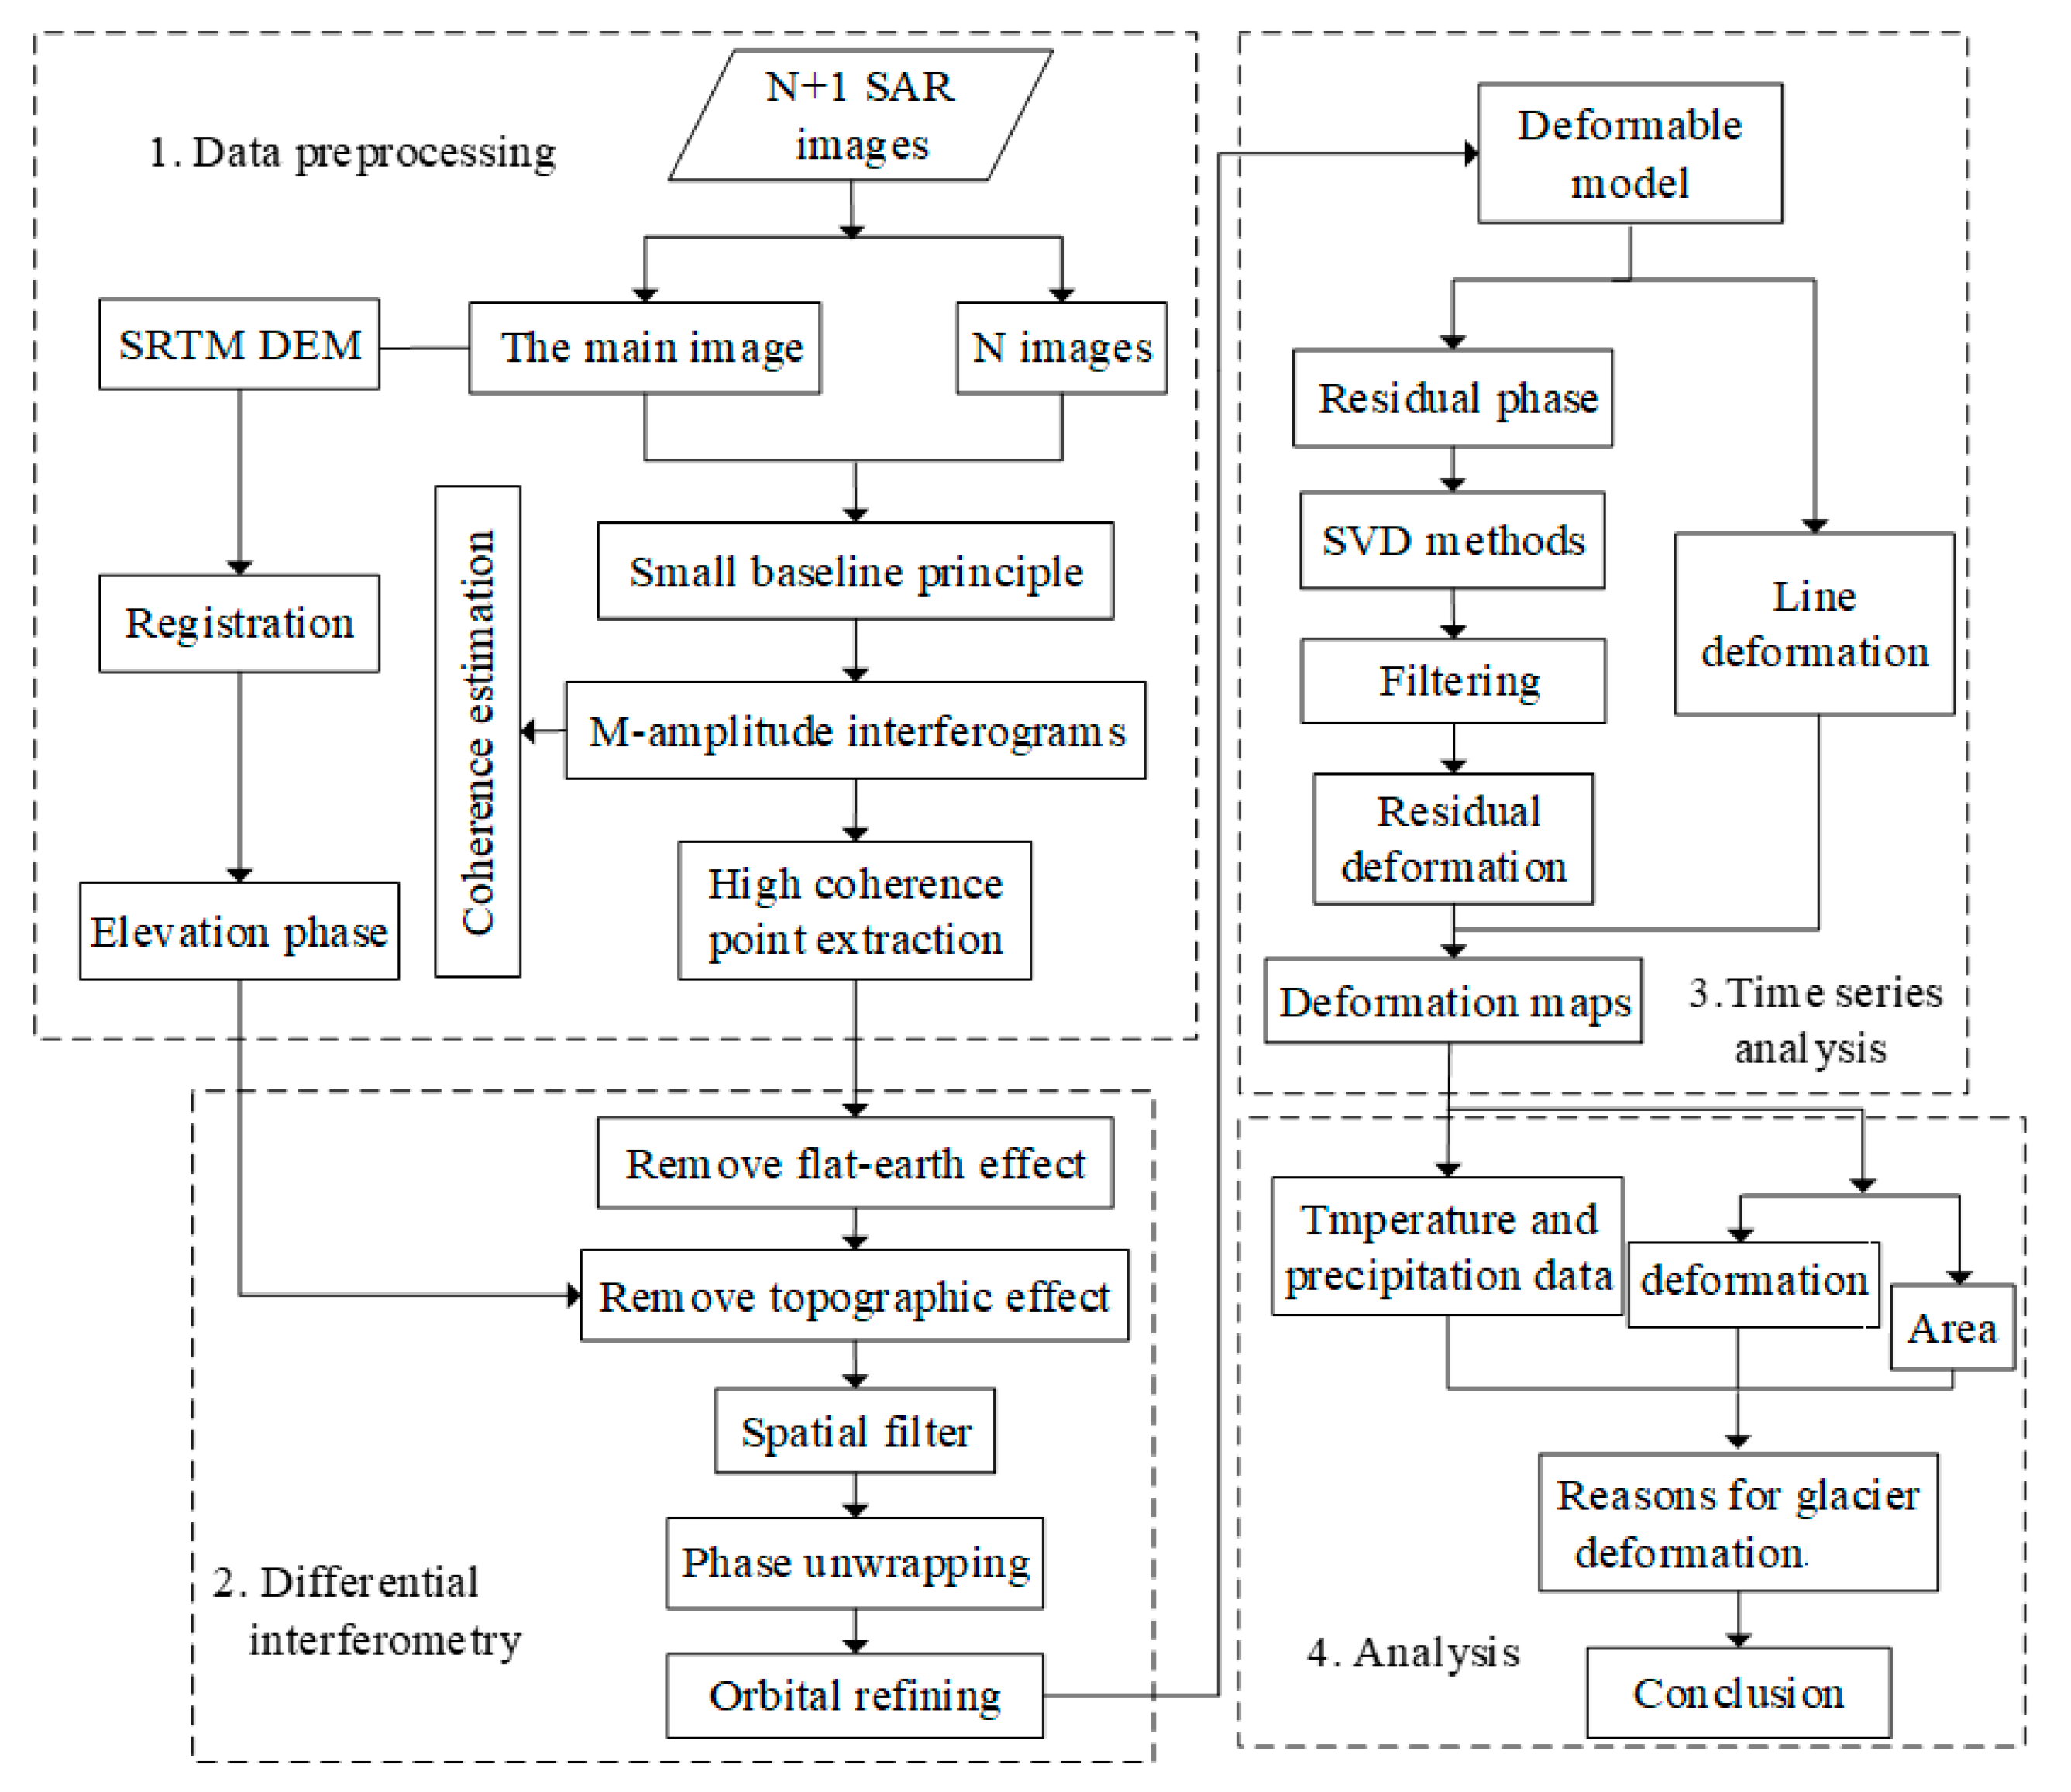
2.3. Methods
3. Results
4. Discussion
4.1. Analysis of the Deformation Results
4.2. Effects of Climate Change on Glacier Deformation
5. Conclusions
- (1)
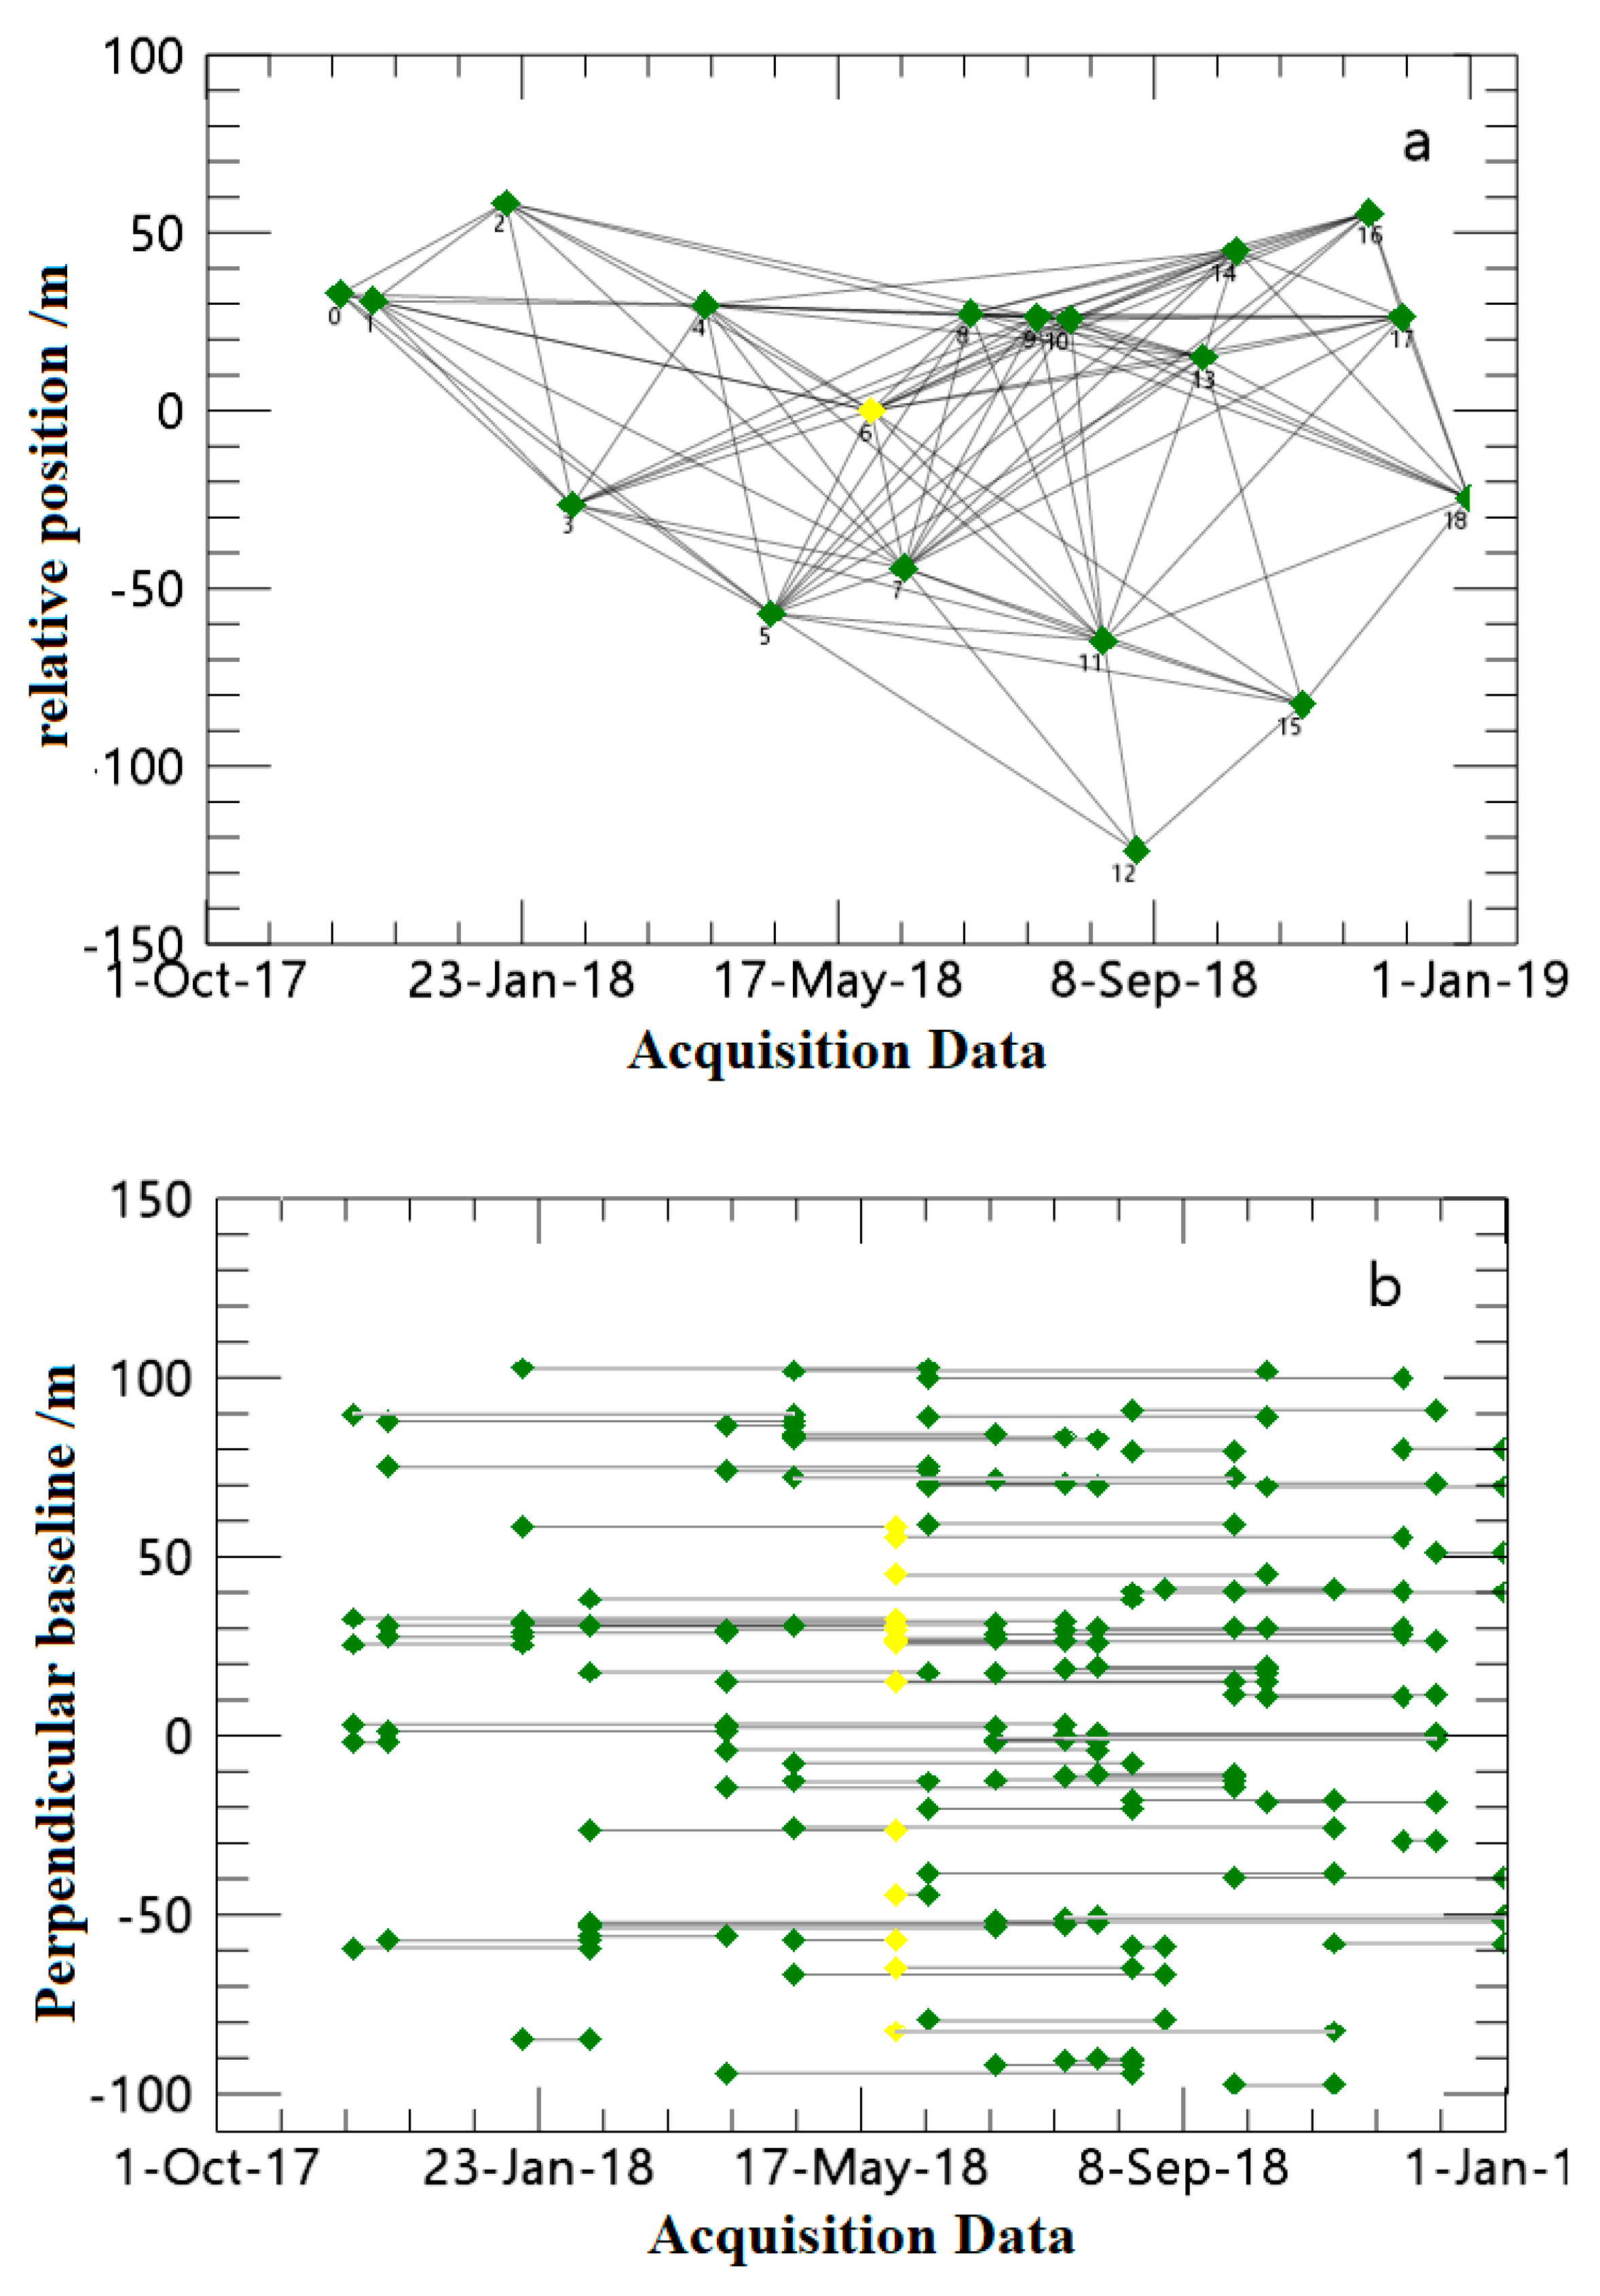
- A SAR dataset with a short temporal baseline and a short spatial baseline was established. By setting appropriate temporal and spatial baseline thresholds, incoherence effects caused by long spatial and temporal baselines can be limited. Thus, the glacier deformation accuracy was improved;
- (2)
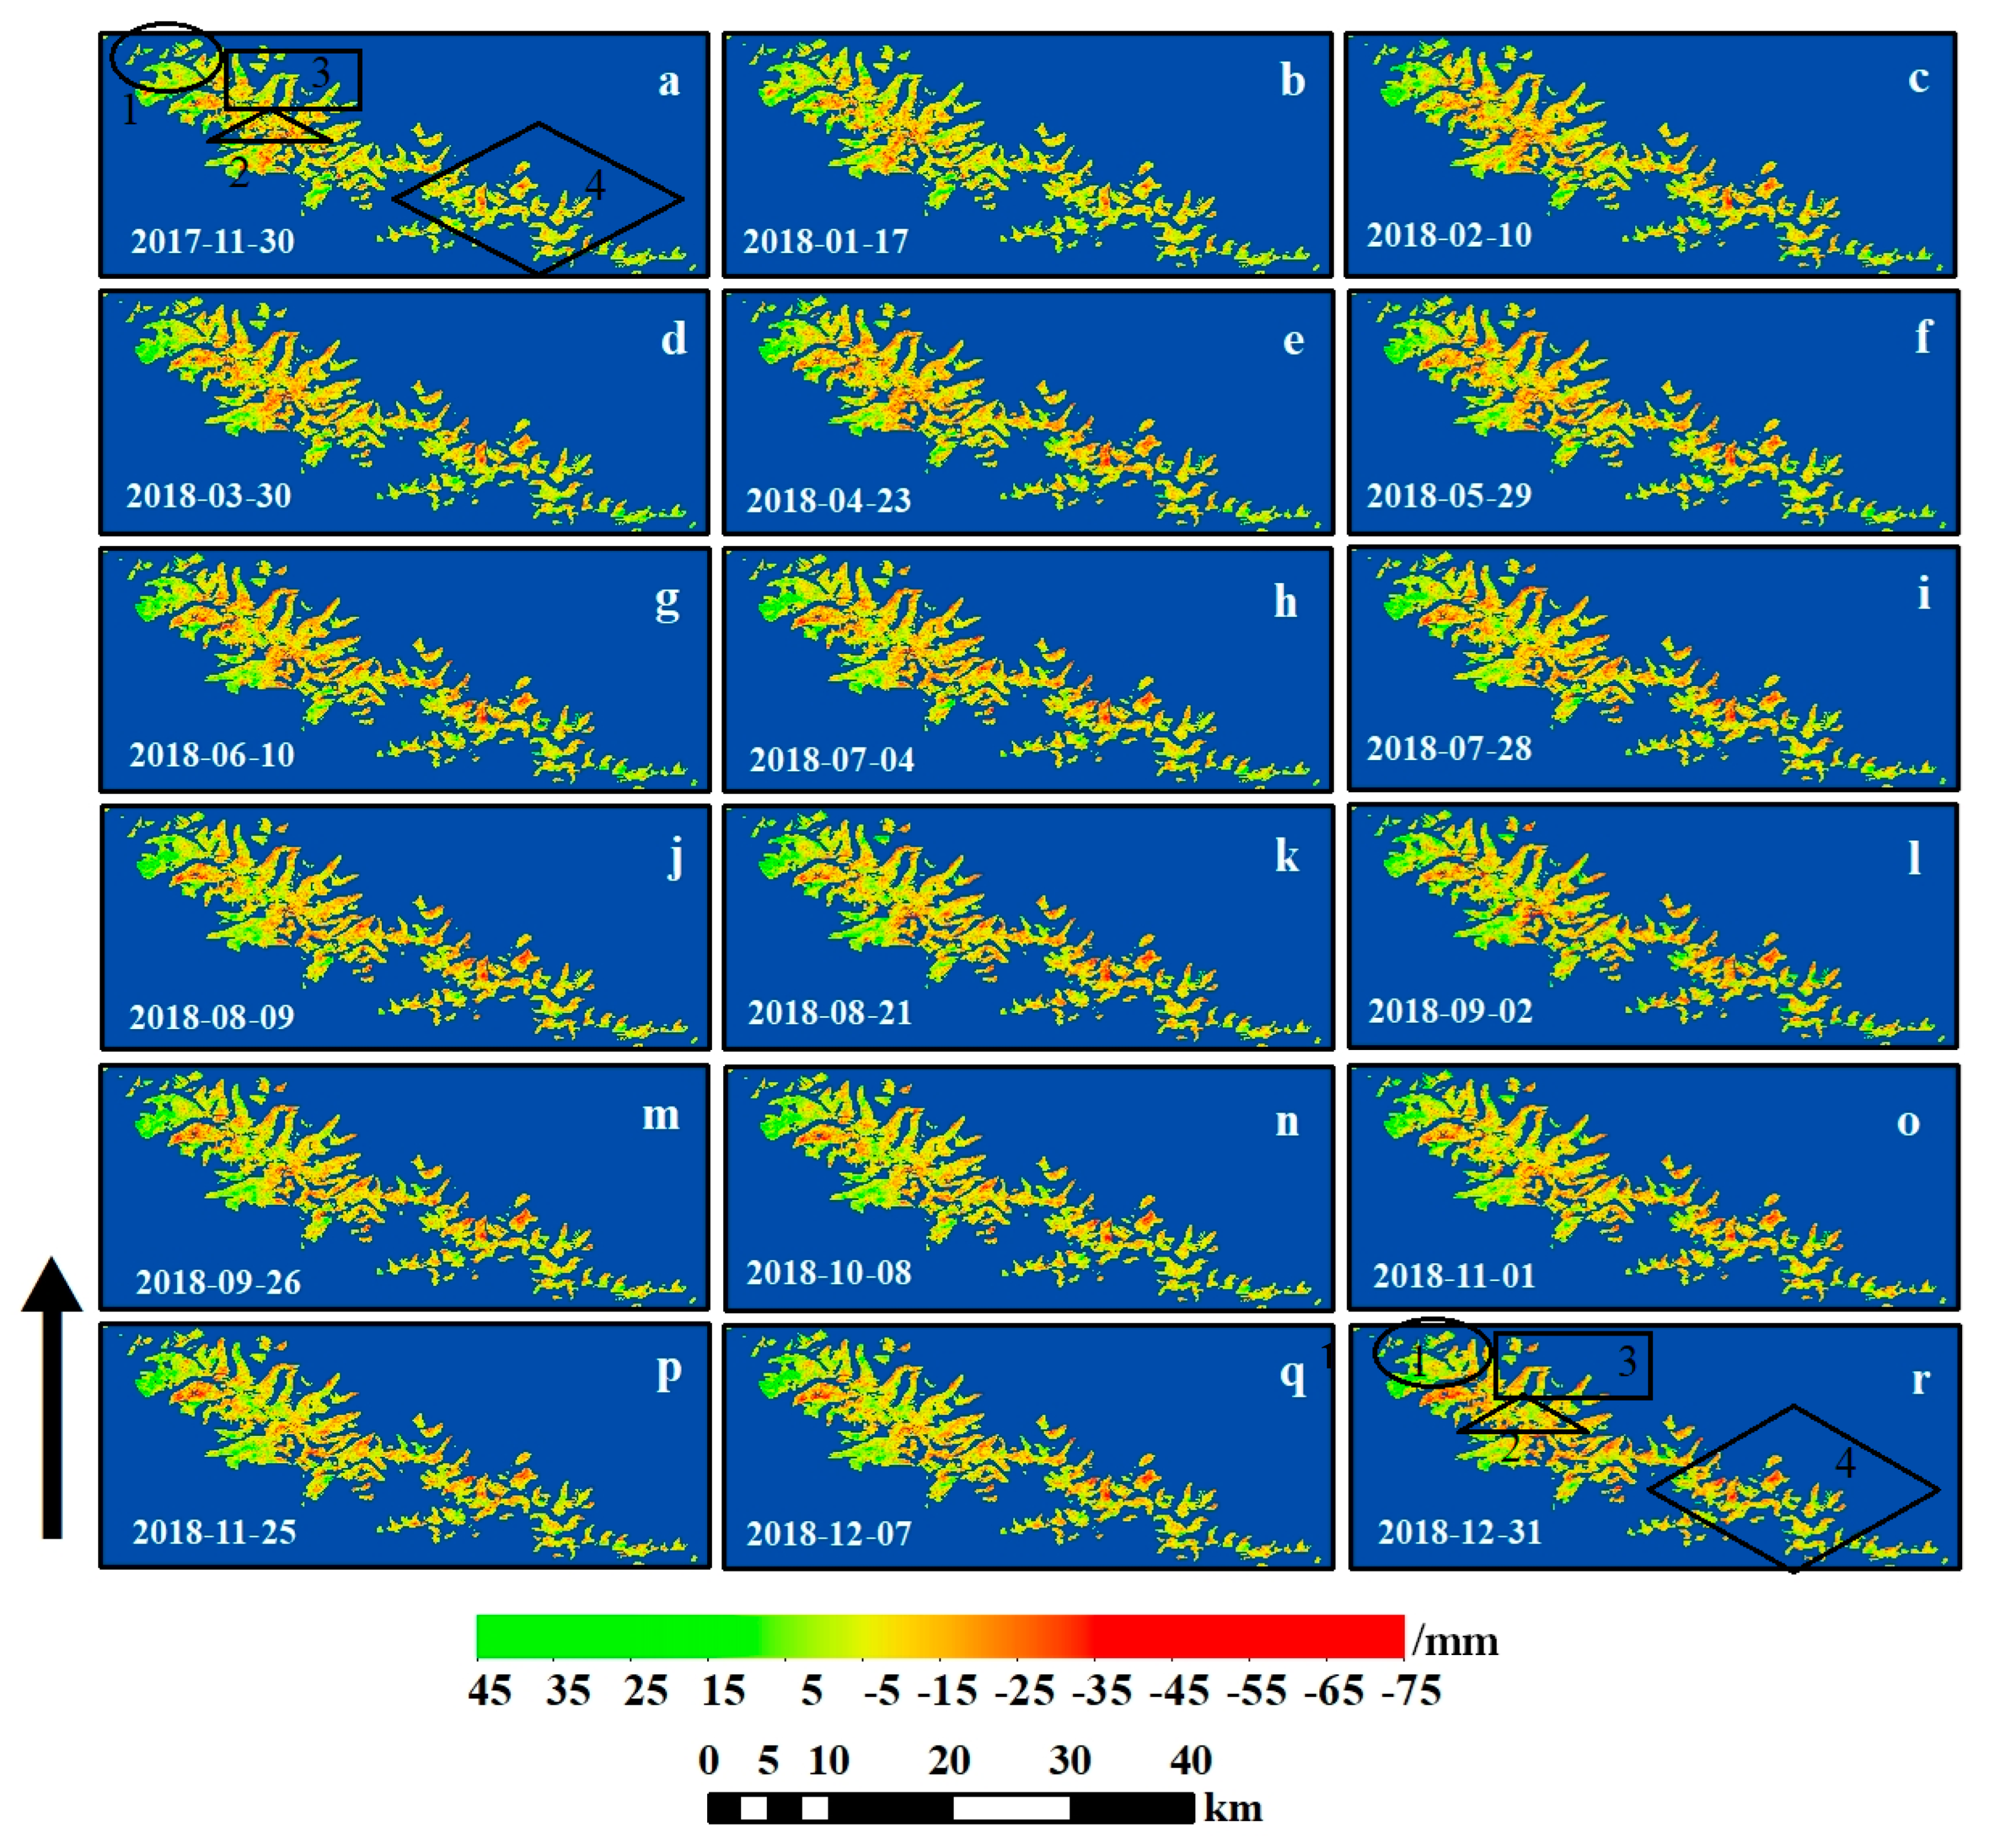
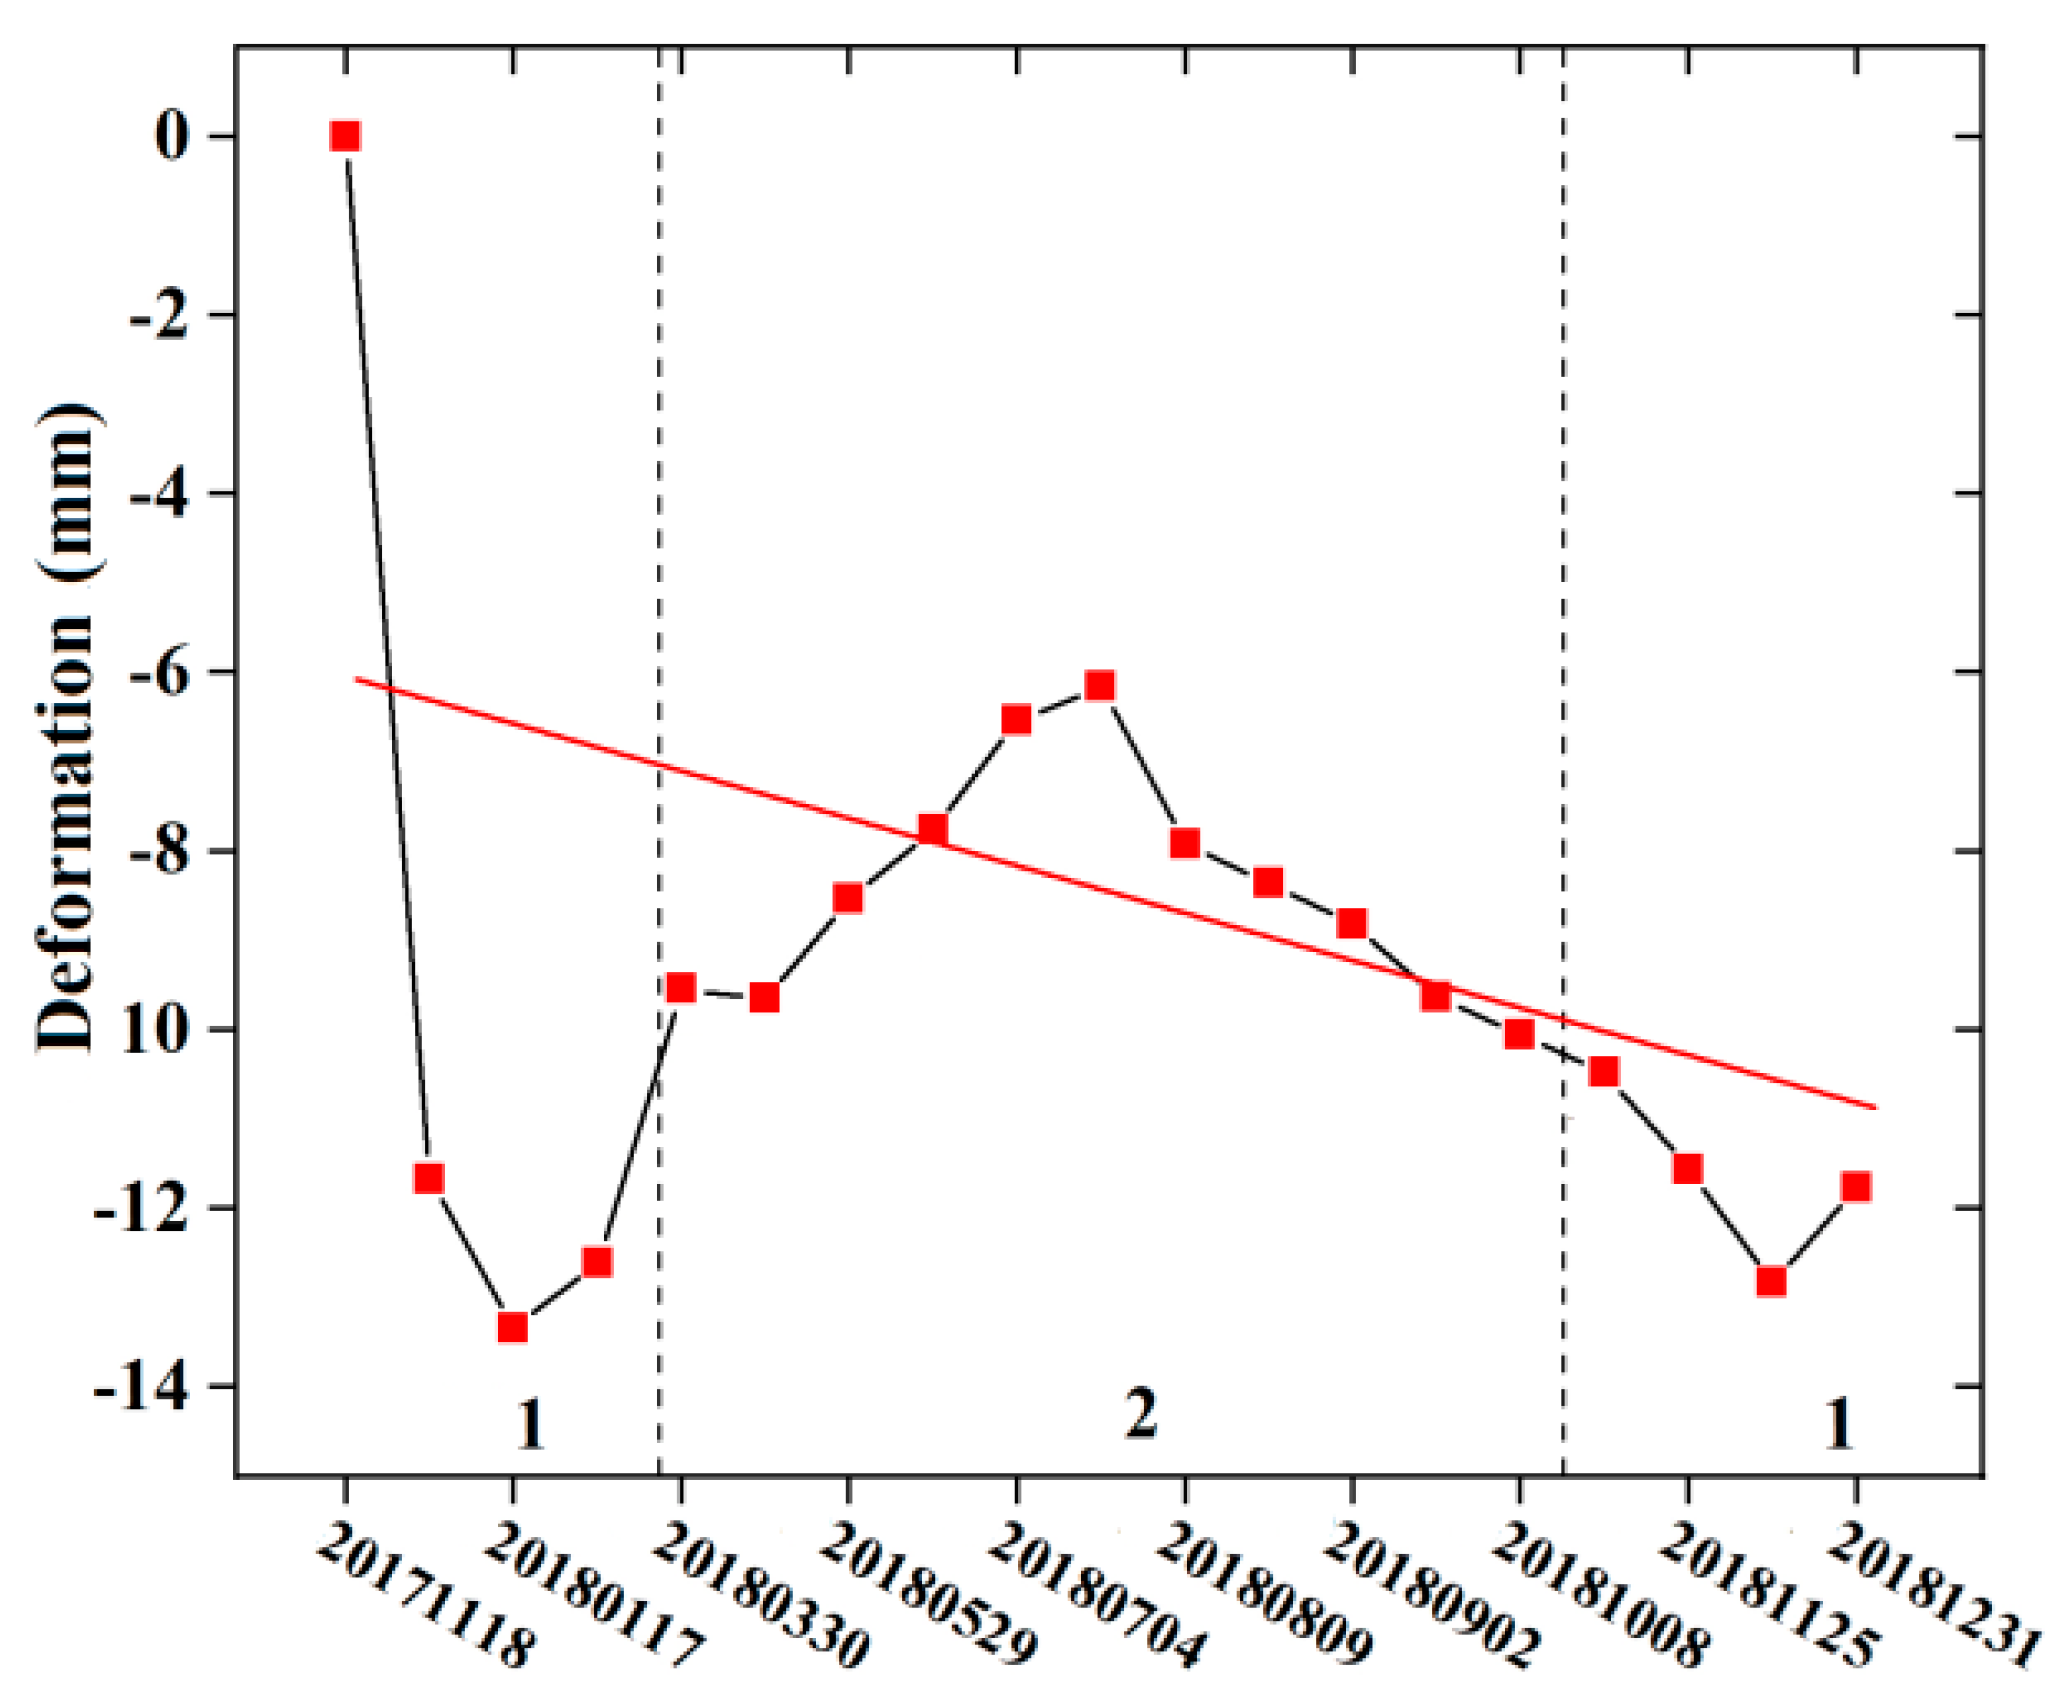
- The total glacier deformation during the study period was −11.77 ± 9.73 mm;
- (3)
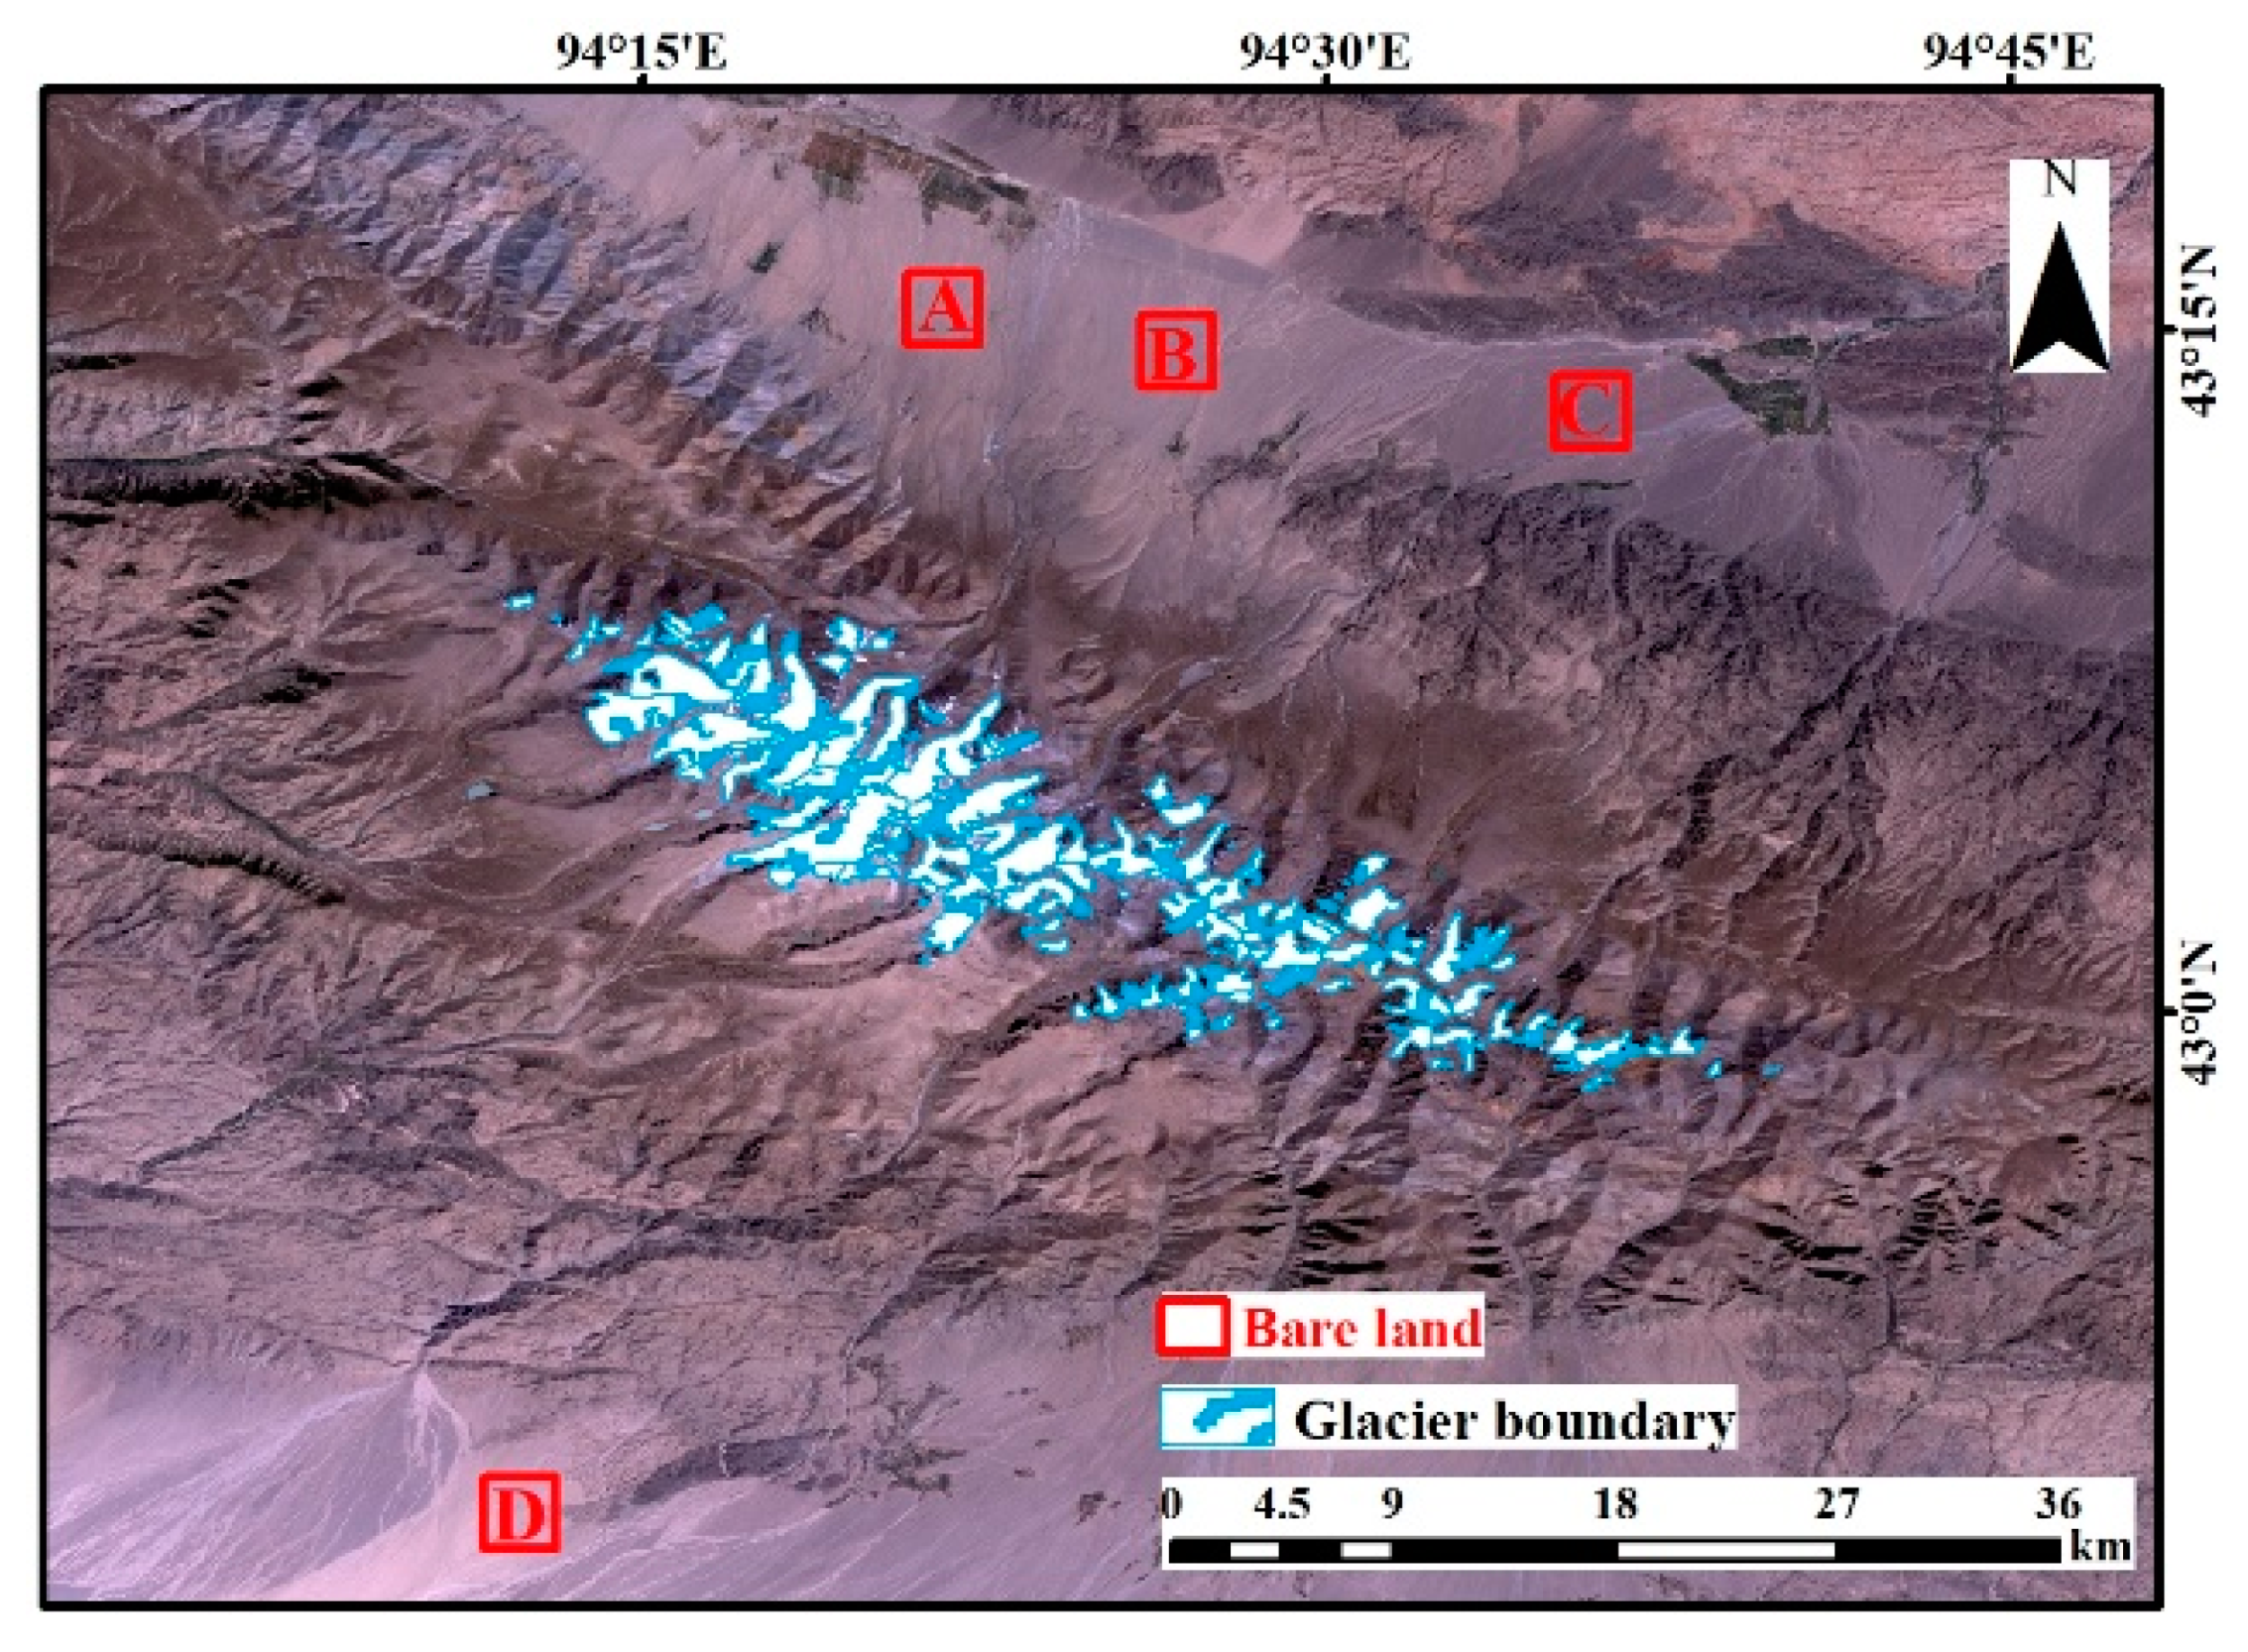
- Based on the assumption that the deformation of bare land in the study area is zero, the deformation of bare land was taken as the error value in order to validate the deformation results. It was found that this error value is much smaller than the glacier deformation, which thus verifies the reliability of the results of this paper;
- (4)
- Taking the ridge line as the dividing line, it was found that the deformation rate of the south slopes was higher than that of the north slopes. It was found that the deformation rate was higher in the southeast of the study area than in the northwest;
- (5)
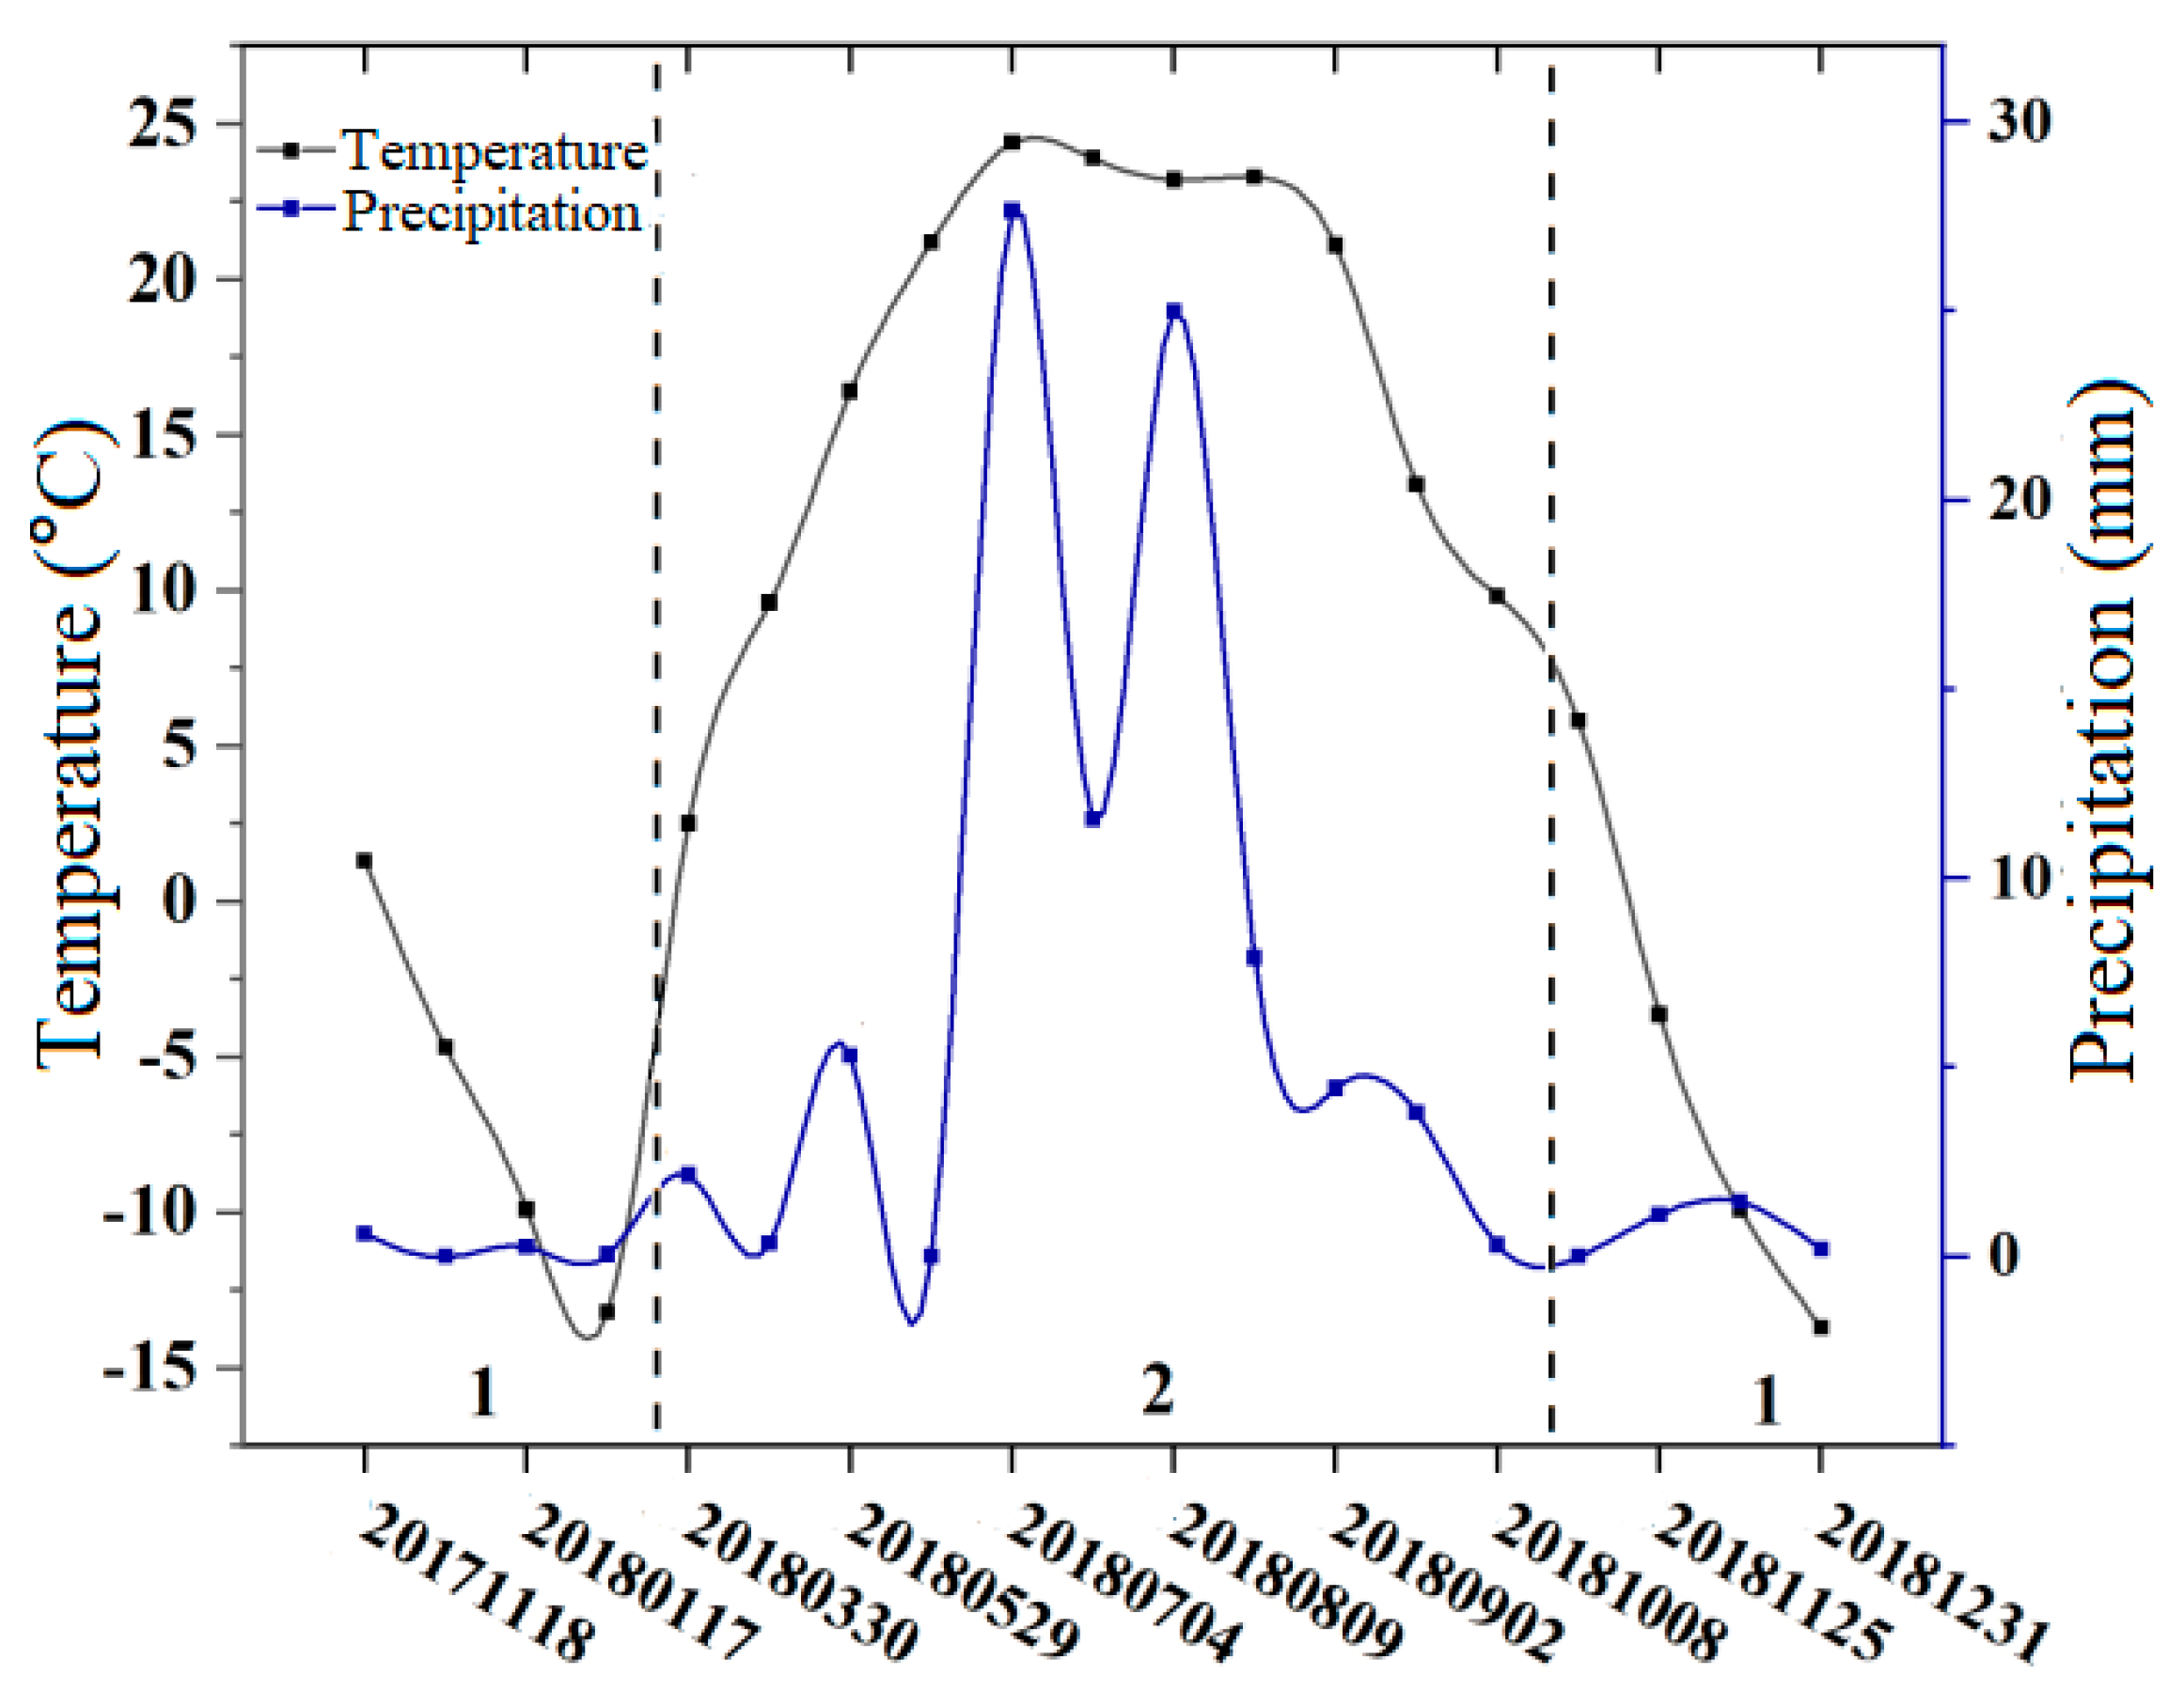
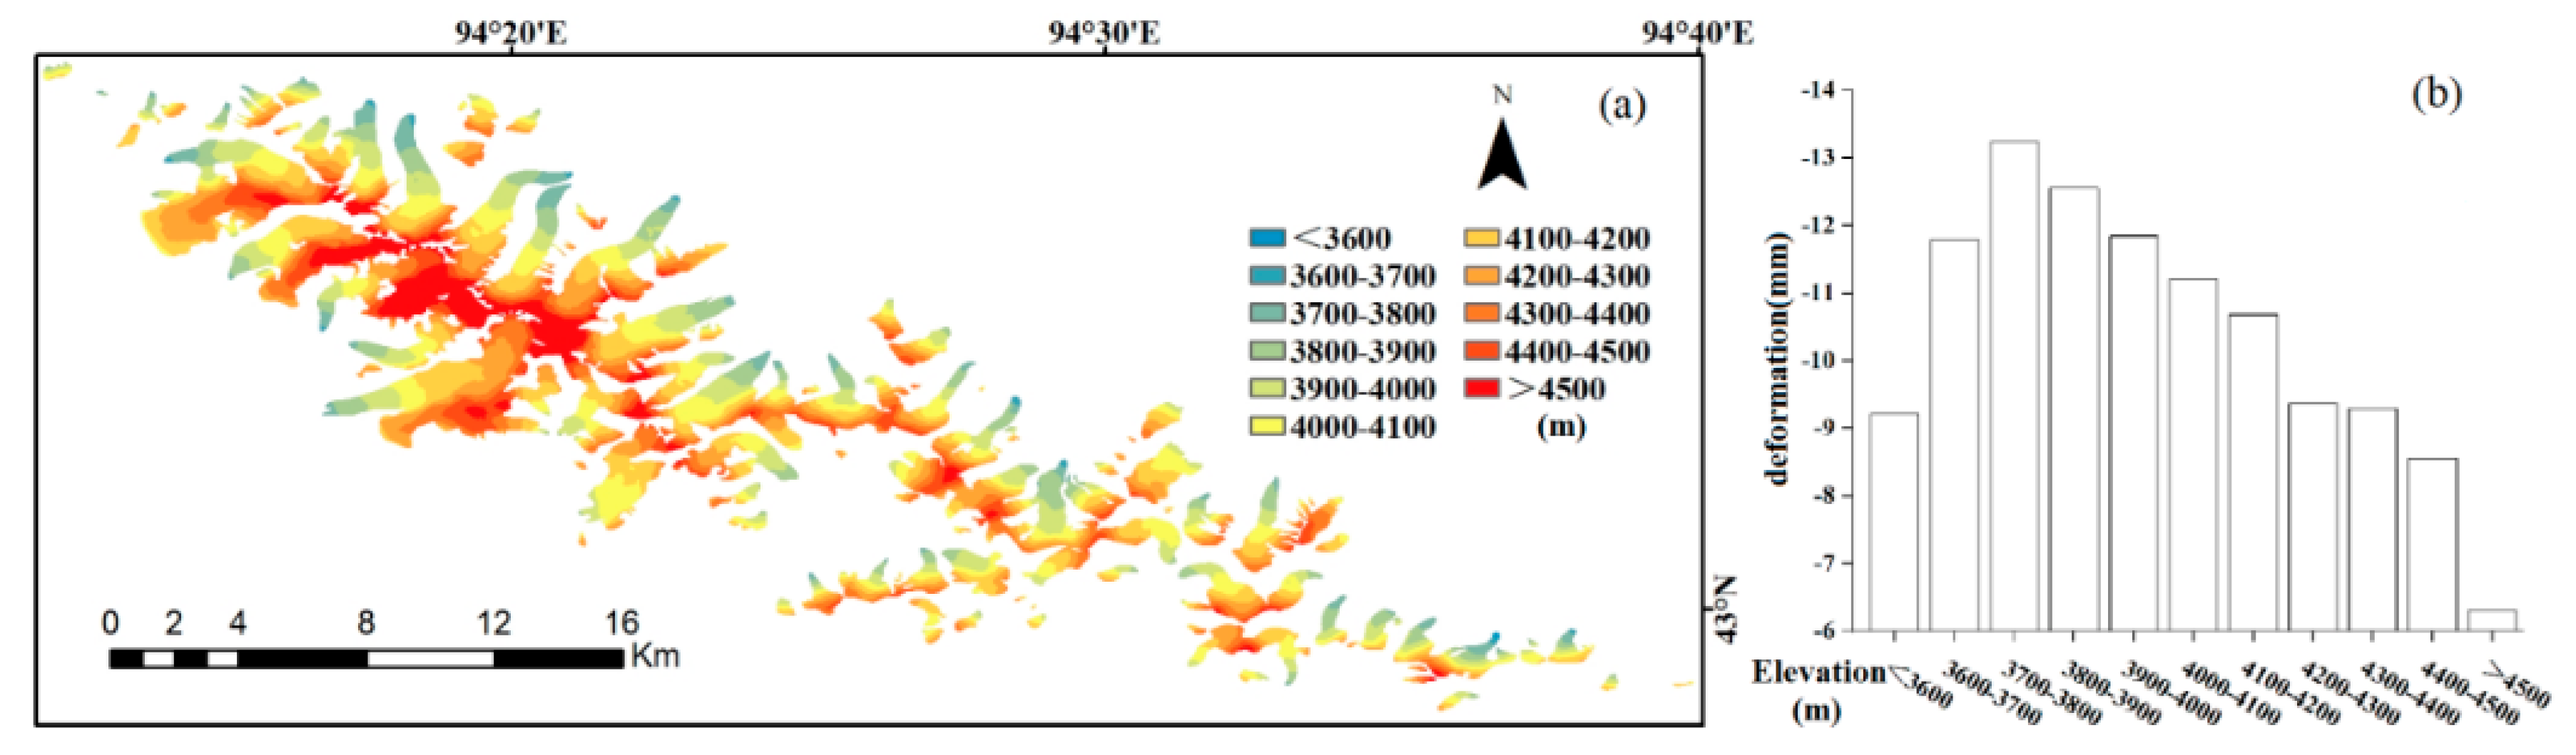
- Through the analysis of temperature and precipitation data, it was found that precipitation played a leading role in the glacier deformation. In winter, precipitation and temperature were low, and glacier deformation was also low. There was a strong correlation between glacier deformation and elevation; the lower the elevation, the larger the deformation.
Author Contributions
Funding
Conflicts of Interest
References
- Wang, X.W.; Chen, H.J.; Chen, Y.N. Large Differences between Glaciers 3D Surface Extents and 2D Planar Areas in Central Tianshan. Water 2017, 9, 282. [Google Scholar] [CrossRef] [Green Version]
- Brenning, A.; Trombotto, D. Logistic regression modeling of rock glacier and glacier distribution: Topographic and climatic controls in the semi-arid Andes. Geomorphology 2006, 81, 141–154. [Google Scholar] [CrossRef]
- Zhang, H.; Li, Z.Q.; Zhou, P.; Zhu, X.; Wang, L. Mass-Balance observations and reconstruction for Haxilegen Glacier No. 51, eastern Tien Shan, from 1999 to 2015. J. Glaciol. 2018, 64, 689–699. [Google Scholar] [CrossRef] [Green Version]
- Hagg, W.; Braun, L.N.; Kuhn, M.; Nesgaard, T.I. Modelling of hydrological response to climate change in glacierized Central Asian catchments. J. Hydrol. 2007, 332, 40–53. [Google Scholar] [CrossRef] [Green Version]
- Hagg, W.; Mayer, C.; Lambrecht, A.; Kriegel, D.; Azizov, E. Glacier changes in the Big Naryn basin, Central Tian Shan. Glob. Planet. Chang. 2013, 110, 40–50. [Google Scholar] [CrossRef]
- Kutuzov, S.; Shahgedanova, M. Glacier retreat and climatic variability in the eastern Terskey–Alatoo, inner Tien Shan between the middle of the 19th century and beginning of the 21st century. Glob. Planet. Chang. 2009, 69, 59–70. [Google Scholar] [CrossRef]
- Li, J.; Li, Z.W.; Ding, X.L.; Wang, Q.J.; Zhu, J.; Wang, C. Investigating mountain glacier motion with the method of SAR intensity-Tracking: Removal of topographic effects and analysis of the dynamic patterns. Earth Sci. Rev. 2014, 138, 179–195. [Google Scholar] [CrossRef]
- Li, J.; Li, Z.W.; Zhu, J.J.; Li, X.; Xu, B.; Wang, Q.; Huang, C.; Hu, J. Early 21st century glacier thickness changes in the Central Tien Shan. Remote Sens. Environ. 2017, 192, 12–29. [Google Scholar] [CrossRef] [Green Version]
- Sorg, A.; Bolch, T.; Stoffel, M.; Solomina, O.; Beniston, M. Climate change impacts on glaciers and runoff in Tien Shan (Central Asia). Nat. Clim. Chang. 2012, 2, 725. [Google Scholar] [CrossRef]
- Barandun, M.; Huss, M.; Sold, L.; Farinotti, D.; Azisov, E.; Salzmann, N.; Usubaliev, R.; Merkushkin, A.; Hoelzle, M. Re-Analysis of seasonal mass balance at Abramov glacier 1968–2014. J. Glaciol. 2015, 61, 1103–1117. [Google Scholar] [CrossRef] [Green Version]
- Chand, M.; Kayastha, R.; Parajuli, A.; Mool, P. Seasonal variation of ice melting on varying layers of debris of Lirung Glacier, Langtang Valley, Nepal. Proc. Int. Assoc. Hydrol. Sci. 2015, 368, 21–26. [Google Scholar] [CrossRef] [Green Version]
- Chand, M.B.; Kayastha, R.B. Study of thermal properties of supraglacial debris and degree-Day factors on Lirung Glacier, Nepal. Sci. Cold Arid Reg. 2018, 10, 0357–0368. [Google Scholar]
- Li, Z.; Li, H.; Chen, Y. Mechanisms and simulation of accelerated shrinkage of continental glaciers: A case study of Urumqi Glacier No. 1 in eastern Tianshan, Central Asia. J. Earth Sci. 2011, 22, 423–430. [Google Scholar] [CrossRef]
- Guo, W.; Liu, S.; Xu, J.; Wu, L.; Shangguan, D.; Yao, X.; Wei, J.; Bao, W.; Yu, P.; Liu, Q. The second Chinese glacier inventory: Data, methods and results. J. Glaciol. 2015, 61, 357–372. [Google Scholar] [CrossRef] [Green Version]
- Wang, Y.; Hou, S.; Liu, Y. Glacier changes in the Karlik Shan, eastern Tien Shan, during 1971/72–2001/02. Ann. Glaciol. 2009, 50, 39–45. [Google Scholar] [CrossRef] [Green Version]
- Du, W.J.; Liu, X.; Guo, J.Y.; Shen, Y.; Li, W.; Chang, X. Analysis of the melting glaciers in Southeast Tibet by ALOS-PALSAR data. Terr. Atmos. Ocean. Sci. 2019, 30, 1–13. [Google Scholar] [CrossRef] [Green Version]
- Nicolas, J.-M.; Vasile, G.; Gay, M.; Tupin, F.; Trouvé, E. SAR processing in the temporal domain: Application to direct interferogram generation and mountain glacier monitoring. Can. J. Remote Sens. 2007, 33, 52–59. [Google Scholar] [CrossRef] [Green Version]
- Jia, Y.Y.; Kim, J.W.; Shum, C.K.; Lu, Z.; Ding, X.; Zhang, L.; Erkan, K.; Kuo, C.-Y.; Shang, K.; Tseng, K.-H. Characterization of active layer thickening rate over the northern Qinghai-Tibetan plateau permafrost region using ALOS interferometric synthetic aperture radar data, 2007–2009. Remote Sens. 2017, 9, 84. [Google Scholar] [CrossRef] [Green Version]
- Liu, L.; Schaefer, K.; Zhang, T.J.; Wahr, J. Estimating 1992–2000 average active layer thickness on the Alaskan North Slope from remotely sensed surface subsidence. J. Geophys. Res. Earth Surf. 2012, 117, F01005. [Google Scholar] [CrossRef]
- Liu, L.; Zhang, T.J.; Wahr, J. InSAR measurements of surface deformation over permafrost on the North Slope of Alaska. J. Geophys. Res. Earth Surf. 2010, 115, F03023. [Google Scholar] [CrossRef]
- Li, Z.W.; Zhao, R.; Hu, J.; Wen, L.; Feng, G.; Zhang, Z.; Wang, Q. InSAR analysis of surface deformation over permafrost to estimate active layer thickness based on one-Dimensional heat transfer model of soils. Sci. Rep. 2015, 5, 15542. [Google Scholar] [CrossRef] [PubMed]
- Yu, Y.H.; Balz, T.; Luo, H.; Liao, M.; Zhang, L. GPU accelerated interferometric SAR processing for Sentinel-1 TOPS data. Comput. Geosci. 2019, 129, 12–25. [Google Scholar] [CrossRef]
- De, L.C.; Bonano, M.; Casu, F.; Manunta, M.; Manzo, M.; Onorato, G.; Zinno, I.; Lanari, R. The Parallel SBAS-DInSAR Processing Chain for the Generation of National Scale Sentinel-1 Deformation Time-Series. Procedia Comput. Sci. 2018, 138, 326–331. [Google Scholar]
- Crosetto, M.; Crippa, B.; Biescas, E. Early detection and in-Depth analysis of deformation phenomena by radar interferometry. Eng. Geol. 2005, 79, 81–91. [Google Scholar] [CrossRef]
- Hooper, A.; Zebker, H.; Segall, P.; Kampes, B. A new method for measuring deformation on volcanoes and other natural terrains using InSAR persistent scatterers. Geophys. Res. Lett. 2004, 31, L23611. [Google Scholar] [CrossRef]
- Casu, F.; Manzo, M.; Lanari, R. A quantitative assessment of the SBAS algorithm performance for surface deformation retrieval from DInSAR data. Remote Sens. Environ. 2006, 102, 195–210. [Google Scholar] [CrossRef]
- Usai, S. A least squares database approach for SAR interferometric data. IEEE Trans. Geosci. Remote Sens. 2003, 41, 753–760. [Google Scholar] [CrossRef] [Green Version]
- Lanari, R.; Lundgren, P.; Manzo, M.; Casu, F. Satellite radar interferometry time series analysis of surface deformation for Los Angeles, California. Geophys. Res. Lett. 2004, 31, L23613. [Google Scholar] [CrossRef]
- Wang, X.W.; Chen, H.J.; Chen, Y.N. Topography-Related Glacier Area Changes in Central Tianshan from 1989 to 2015 Derived from Landsat Images and ASTER GDEM Data. Water 2018, 10, 555. [Google Scholar] [CrossRef] [Green Version]
- Zhao, R.; Li, Z.; Feng, G.; Wang, Q.; Hu, J. Monitoring surface deformation over permafrost with an improved SBAS-InSAR algorithm: With emphasis on climatic factors modeling. Remote Sens. Environ. 2016, 184, 276–287. [Google Scholar] [CrossRef]
- Galve, J.P.; Pérez-Peña, J.V.; Azañón, J.M.; Closson, D.; Caló, F.; Reyes-Carmona, C.; Jabaloy, A.; Ruano, P.; Mateos, R.M.; Notti, D. Evaluation of the SBAS InSAR service of the European space Agency’s Geohazard Exploitation Platform (GEP). Remote Sens. 2017, 9, 1291. [Google Scholar] [CrossRef] [Green Version]
- Chen, Y.X.; Li, Y.K.; Wang, Y.Y.; Zhang, M.; Cui, Z.; Yi, C.; Liu, G. Late Quaternary glacial history of the Karlik Range, easternmost Tian Shan, derived from 10Be surface exposure and optically stimulated luminescence datings. Quat. Sci. Rev. 2015, 115, 17–27. [Google Scholar] [CrossRef]
- Ahmad, W.; Kim, D. Estimation of flow in various sizes of streams using the Sentinel-1 Synthetic Aperture Radar (SAR) data in Han River Basin, Korea. Int. J. Appl. Earth Obs. Geoinf. 2019, 83, 101930. [Google Scholar] [CrossRef]
- Torres, R.; Snoeij, P.; Geudtner, D.; Bibby, D.; Davidson, M.; Attema, E.; Potin, P.; Rommen, B.; Floury, N.; Brown, M. GMES Sentinel-1 mission. Remote Sens. Environ. 2012, 120, 9–24. [Google Scholar] [CrossRef]
- Chen, D.L.; Lu, Y.Y.; Jia, D.Z. Land deformation associated with exploitation of groundwater in Changzhou City measured by COSMO-SkyMed and Sentinel-1A SAR data. Open Geosci. 2018, 10, 678–687. [Google Scholar] [CrossRef]
- De Zan, F.; Guarnieri, A.M. TOPSAR: Terrain Observation by Progressive Scans. IEEE Trans. Geosci. Remote Sens. 2006, 44, 2352–2360. [Google Scholar] [CrossRef]
- Shi, J.; Dozier, J. Measurements of snow- and glacier-Covered areas with single-Polarization SAR. Ann. Glaciol. 1993, 17, 72–76. [Google Scholar] [CrossRef] [Green Version]
- Mukul, M.; Srivastava, V.; Jade, S.; Mukul, M. Uncertainties in the shuttle radar topography mission (SRTM) Heights: Insights from the indian Himalaya and Peninsula. Sci. Rep. 2017, 7, 41672. [Google Scholar] [CrossRef] [Green Version]
- Hu, L.Y.; Dai, K.R.; Xing, C.Q.; Li, Z.; Tomás, R.; Clark, B.; Shi, X.; Chen, M.; Zhang, R.; Qiu, Q. Land subsidence in Beijing and its relationship with geological faults revealed by Sentinel-1 InSAR observations. Int. J. Appl. Earth Obs. Geoinf. 2019, 82, 101886. [Google Scholar] [CrossRef]
- Calò, F.; Ardizzone, F.; Castaldo, R.; Lollino, P.; Tizzani, P.; Guzzetti, F.; Lanari, R.; Angeli, M.-G.; Pontoni, F.; Manunta, M. Enhanced landslide investigations through advanced DInSAR techniques: The Ivancich case study, Assisi, Italy. Remote Sens. Environ. 2014, 142, 69–82. [Google Scholar] [CrossRef] [Green Version]
- Hu, B.; Wang, H.S.; Sun, Y.L.; Hou, J.G.; Liang, J. Long-Term land subsidence monitoring of Beijing (China) using the small baseline subset (SBAS) technique. Remote Sens. 2014, 6, 3648–3661. [Google Scholar] [CrossRef] [Green Version]
- Tizzani, P.; Berardino, P.; Casu, F.; Euillades, P.; Manzo, M.; Ricciardi, G.; Zeni, G.; Lanari, R. Surface deformation of Long Valley caldera and Mono Basin, California, investigated with the SBAS-InSAR approach. Remote Sens. Environ. 2007, 108, 277–289. [Google Scholar] [CrossRef]
- Chen, Y.X.; Jiang, L.M.; Liang, L.L.; ZhiWei, Z. Monitoring permafrost deformation in the upstream Heihe River, Qilian Mountain by using multi-temporal Sentinel-1 InSAR dataset. Chin. J. Geophys. 2019, 62, 2441–2454. [Google Scholar]
- Wu, Q.; Jia, C.T.; Chen, S.B.; Li, H. SBAS-InSAR Based Deformation Detection of Urban Land, Created from Mega-Scale Mountain Excavating and Valley Filling in the Loess Plateau: The Case Study of Yan’an City. Remote Sens. 2019, 11, 1673. [Google Scholar] [CrossRef] [Green Version]
- Onn, F.; Zebker, H.A. Correction for interferometric synthetic aperture radar atmospheric phase artifacts using time series of zenith wet delay observations from a GPS network. J. Geophys. Res. Solid Earth 2006, 111, B09102. [Google Scholar] [CrossRef]
- Canova, F.; Tolomei, C.; Salvi, S.; Toscani, G.; Seno, S. Land subsidence along the Ionian coast of SE Sicily (Italy), detection and analysis via Small Baseline Subset (SBAS) multitemporal differential SAR interferometry. Earth Surf. Process. Landf. 2012, 37, 273–286. [Google Scholar] [CrossRef]
- Wang, Q.J.; Yu, W.Y.; Xu, B.; Wei, G. Assessing the Use of GACOS Products for SBAS-InSAR Deformation Monitoring: A Case in Southern California. Sensors 2019, 19, 3894. [Google Scholar] [CrossRef]
- Hooper, A.; Zebker, H.A. Phase unwrapping in three dimensions with application to InSAR time series. J. Opt. Soc. Am. A 2007, 24, 2737–2747. [Google Scholar] [CrossRef] [Green Version]
- Baek, J.; Kim, S.-W.; Park, H.-J.; Jung, H.-S.; Kim, K.-D.; Kim, J.W. Analysis of ground subsidence in coal mining area using SAR interferometry. Geosci. J. 2008, 12, 277–284. [Google Scholar] [CrossRef]
- Gini, F.; Lombardini, F.; Montanari, M. Layover solution in multibaseline SAR interferometry. IEEE Trans. Aerosp. Electron. Syst. 2002, 38, 1344–1356. [Google Scholar] [CrossRef]
- Voigt, U. The Determination of the Direction of Movement on Glacier Surfaces by Terrestrial Photogrammetry. J. Glaciol. 1966, 6, 359–367. [Google Scholar] [CrossRef] [Green Version]
- Zhu, S.; Liao, G.; Qu, Y.; Liu, X.; Zhou, Z. A New Slant-Range Velocity Ambiguity Resolving Approach of Fast Moving Targets for SAR System. IEEE Trans. Geosci. Remote Sens. 2010, 48, 432–451. [Google Scholar]
- Teshebaeva, K.; Echtler, H.; Bookhagen, B.; Strecker, M. Deep-Seated gravitational slope deformation (DSGSD) and slow-Moving landslides in the southern Tien Shan Mountains: New insights from InSAR, tectonic and geomorphic analysis. Earth Surf. Process. Landf. 2019, 44, 2333–2348. [Google Scholar] [CrossRef] [Green Version]
- Yang, X.; Zhao, J.; Han, H. Study on glacier mass balance in the Karlik Range, East Tianshan Mountains, 1972–2016. J. Glaciol. Geocryol. 2019, 41, 7–17. [Google Scholar]
- Qin, Y.; Yang, T.B.; Ji, Q.; Jim, W. Change in the modern glaciers of Harlik Mountains from 1973–2016. J. Lanzhou Univ. Nat. Sci. 2018, 54, 5–12. [Google Scholar]
- Li, J.; Yang, T.B.; He, Y. Response of Glacier Retreat to Climate in Eastern Tianshan from 1990 to 2011. Res. Soil Water Conserv. 2014, 21, 212–216. [Google Scholar]
- Yastika, P.; Shimizu, N.; Abidin, H. Monitoring of long-Term land subsidence from 2003 to 2017 in coastal area of Semarang, Indonesia by SBAS DInSAR analyses using Envisat-ASAR, ALOS-PALSAR, and Sentinel-1A SAR data. Adv. Space Res. 2019, 63, 1719–1736. [Google Scholar] [CrossRef]
- Liu, H.; Zhao, Z.; Jezek, K.C. Synergistic fusion of interferometric and speckle-tracking methods for deriving surface velocity from interferometric SAR data. IEEE Geosci. Remote Sens. Lett. 2007, 4, 102–106. [Google Scholar] [CrossRef]
- Liu, H.; Zhao, Z.; Yu, J.; Jezek, K. Simultaneous least squares adjustment of multiframe velocities derived from interferometric and Speckle-Tracking methods. IEEE Geosci. Remote Sens. Lett. 2008, 5, 289–293. [Google Scholar]
- Strozzi, T.; Kouraev, A.; Wiesmann, A.; Wegmüller, U.; Sharov, A.; Werner, C. Estimation of Arctic glacier motion with satellite L-Band SAR data. Remote Sens. Environ. 2008, 112, 636–645. [Google Scholar] [CrossRef]
- Strozzi, T.; Luckman, A.; Murray, T.; Wegmuller, U.; Werner, C.L. Glacier motion estimation using SAR offset-tracking procedures. IEEE Trans. Geosci. Remote Sens. 2002, 40, 2384–2391. [Google Scholar] [CrossRef] [Green Version]
- Hu, R.J. Glaciers in the karlik area of tianshan mountain east. Xinjiang Geogr. 1979, 1, 69–82. [Google Scholar]


| Sentinel-1A Sensor Image | SRTM DEM | ||
|---|---|---|---|
| Parameter | Type | Parameter | Type |
| Polarization mode | VV | Spatial resolution | 90 m |
| Swath mode | IW | Data format | TIF |
| Data type | SLC | Reference surface | WGS-84 |
| Spatial resolution | 5 m (range) × 20 m (azimuth) | Relative elevation accuracy | ±10 m |
| Revisit frequency Orbit type | 12 Days Ascending | Absolute elevation accuracy | ±16 m |
| Data coverage | 250 km | ||
| Image Number | Acquisition Date | Orbit Type | Orbit Number | Polarization |
|---|---|---|---|---|
| 0 | 18 November 2017 | ASCENDING | 019319 | VV |
| 1 | 30 November 2017 | ASCENDING | 019494 | VV |
| 2 | 17 January 2018 | ASCENDING | 020194 | VV |
| 3 | 10 February 2018 | ASCENDING | 020544 | VV |
| 4 | 30 March 2018 | ASCENDING | 024897 | VV |
| 5 | 23 April 2018 | ASCENDING | 025380 | VV |
| 6 | 29 May 2018 | ASCENDING | 022119 | VV |
| 7 | 10 June 2018 | ASCENDING | 022294 | VV |
| 8 | 4 July 2018 | ASCENDING | 022644 | VV |
| 9 | 28 July 2018 | ASCENDING | 022994 | VV |
| 10 | 9 August 2018 | ASCENDING | 023169 | VV |
| 11 | 21 August 2018 | ASCENDING | 023344 | VV |
| 12 | 2 September 2018 | ASCENDING | 023519 | VV |
| 13 | 26 September 2018 | ASCENDING | 023869 | VV |
| 14 | 8 October 2018 | ASCENDING | 024044 | VV |
| 15 | 1 November 2018 | ASCENDING | 024394 | VV |
| 16 | 25 November 2018 | ASCENDING | 024744 | VV |
| 17 | 7 December 2018 | ASCENDING | 024919 | VV |
| 18 | 31 December 2018 | ASCENDING | 025269 | VV |
| Glacial Partition | Deformation Velocity (mm/year) |
|---|---|
| South slopes | −13.15 ± 8.89 |
| North slopes | −12.38 ± 7.46 |
| Area I | −9.45 ± 7.65 |
| Area II | −12.16 ± 8.70 |
| Region | Deformation (mm) |
|---|---|
| A | 0.93 |
| B | 0.63 |
| C | 0.86 |
| D | 0.78 |
© 2020 by the authors. Licensee MDPI, Basel, Switzerland. This article is an open access article distributed under the terms and conditions of the Creative Commons Attribution (CC BY) license (http://creativecommons.org/licenses/by/4.0/).
Share and Cite
Du, W.; Ji, W.; Xu, L.; Wang, S. Deformation Time Series and Driving-Force Analysis of Glaciers in the Eastern Tienshan Mountains Using the SBAS InSAR Method. Int. J. Environ. Res. Public Health 2020, 17, 2836. https://doi.org/10.3390/ijerph17082836
Du W, Ji W, Xu L, Wang S. Deformation Time Series and Driving-Force Analysis of Glaciers in the Eastern Tienshan Mountains Using the SBAS InSAR Method. International Journal of Environmental Research and Public Health. 2020; 17(8):2836. https://doi.org/10.3390/ijerph17082836
Chicago/Turabian StyleDu, Weibing, Weiqian Ji, Linjuan Xu, and Shuangting Wang. 2020. "Deformation Time Series and Driving-Force Analysis of Glaciers in the Eastern Tienshan Mountains Using the SBAS InSAR Method" International Journal of Environmental Research and Public Health 17, no. 8: 2836. https://doi.org/10.3390/ijerph17082836