Smart and Regenerative Urban Growth: A Literature Network Analysis


Abstract
:1. Introduction
2. Review Method
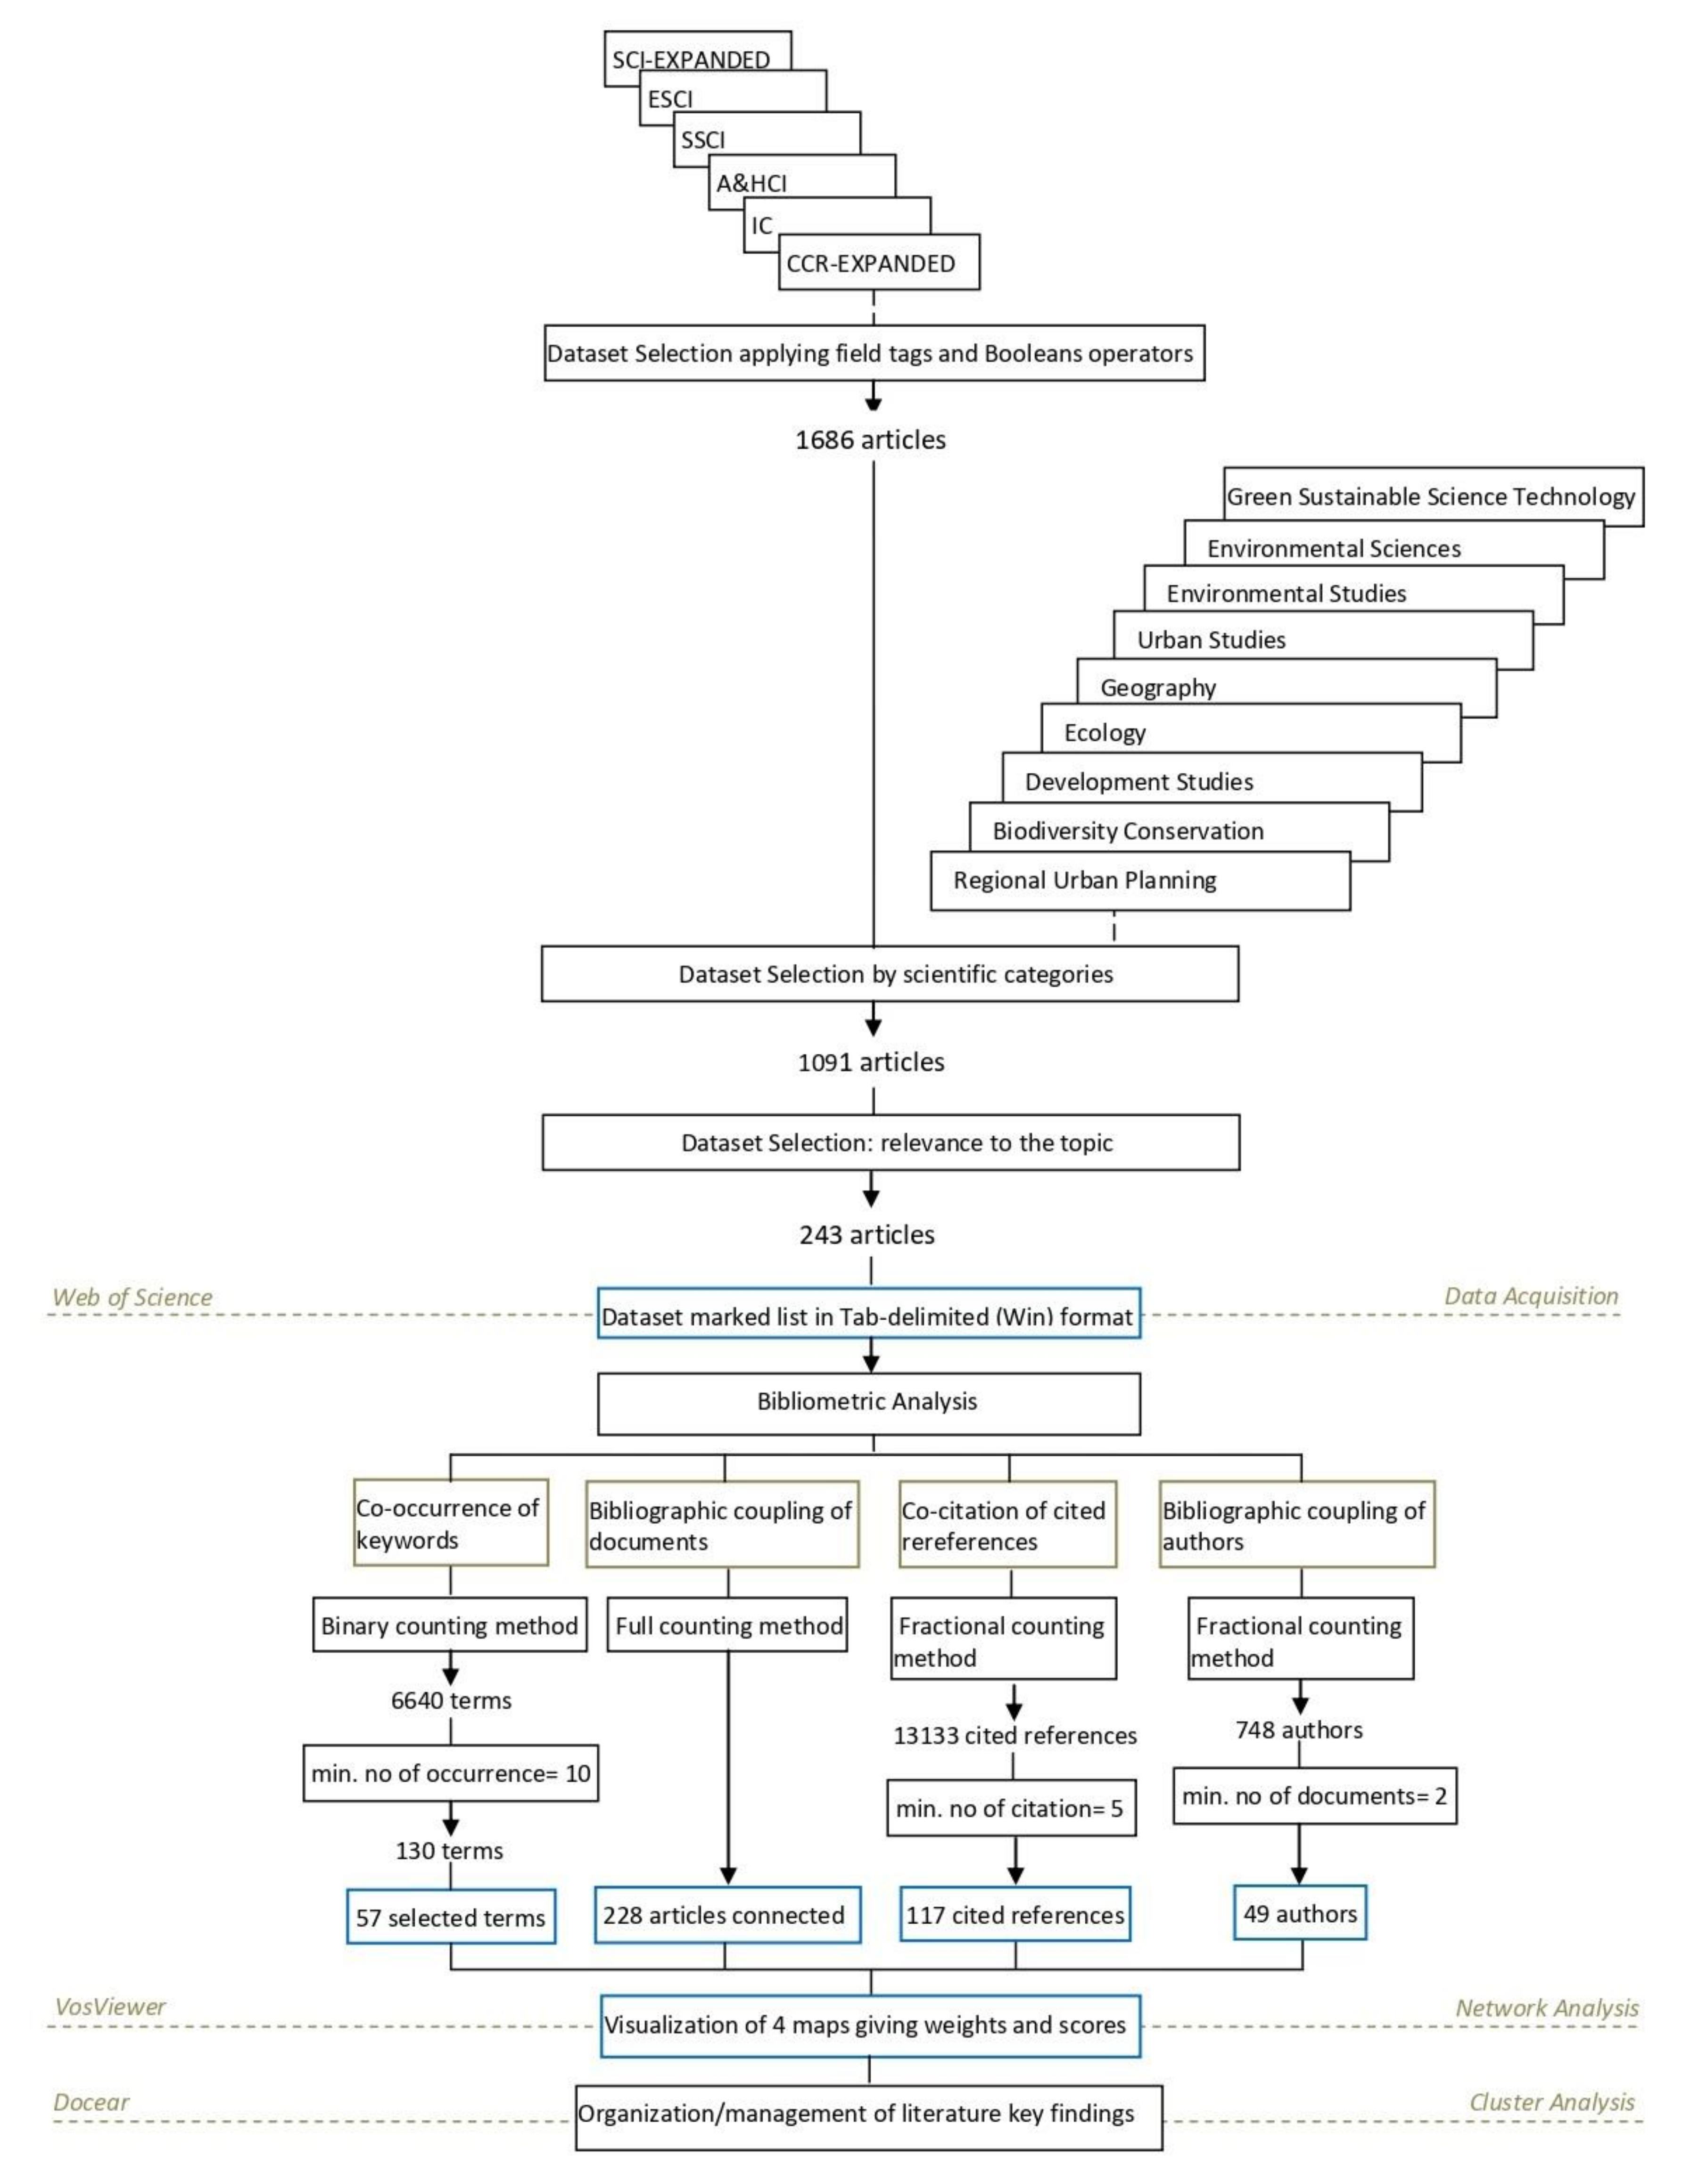
2.1. Data Acquisition
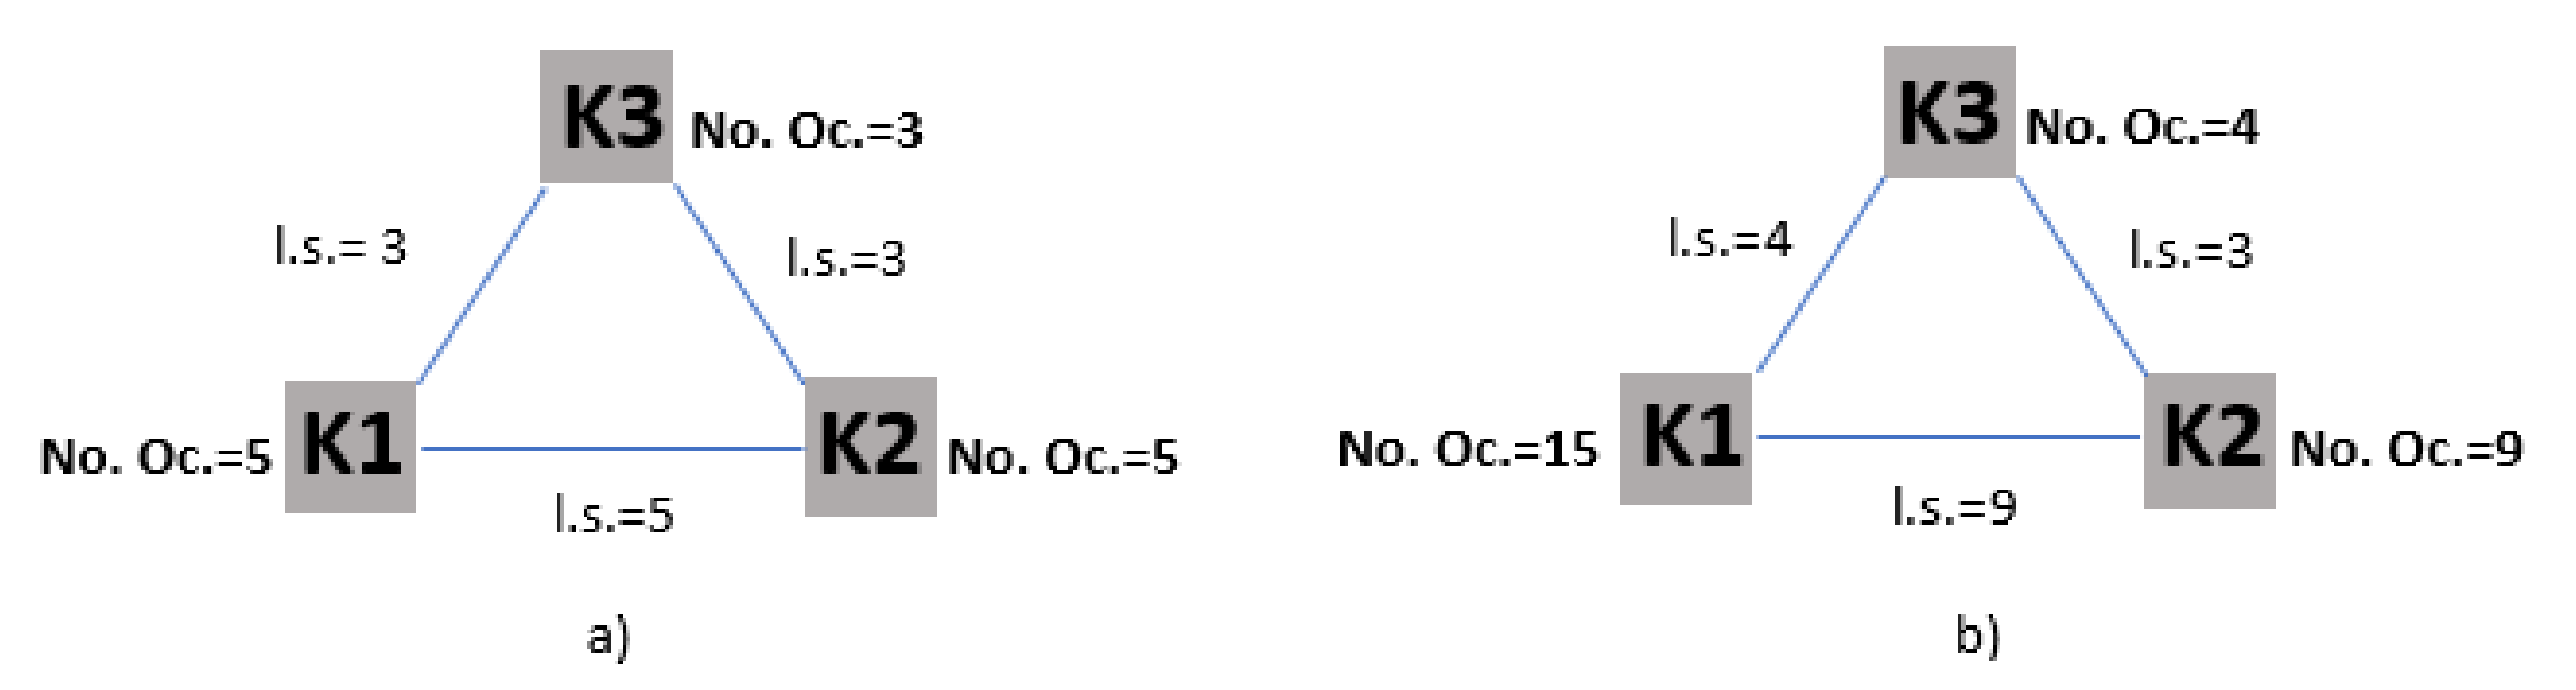
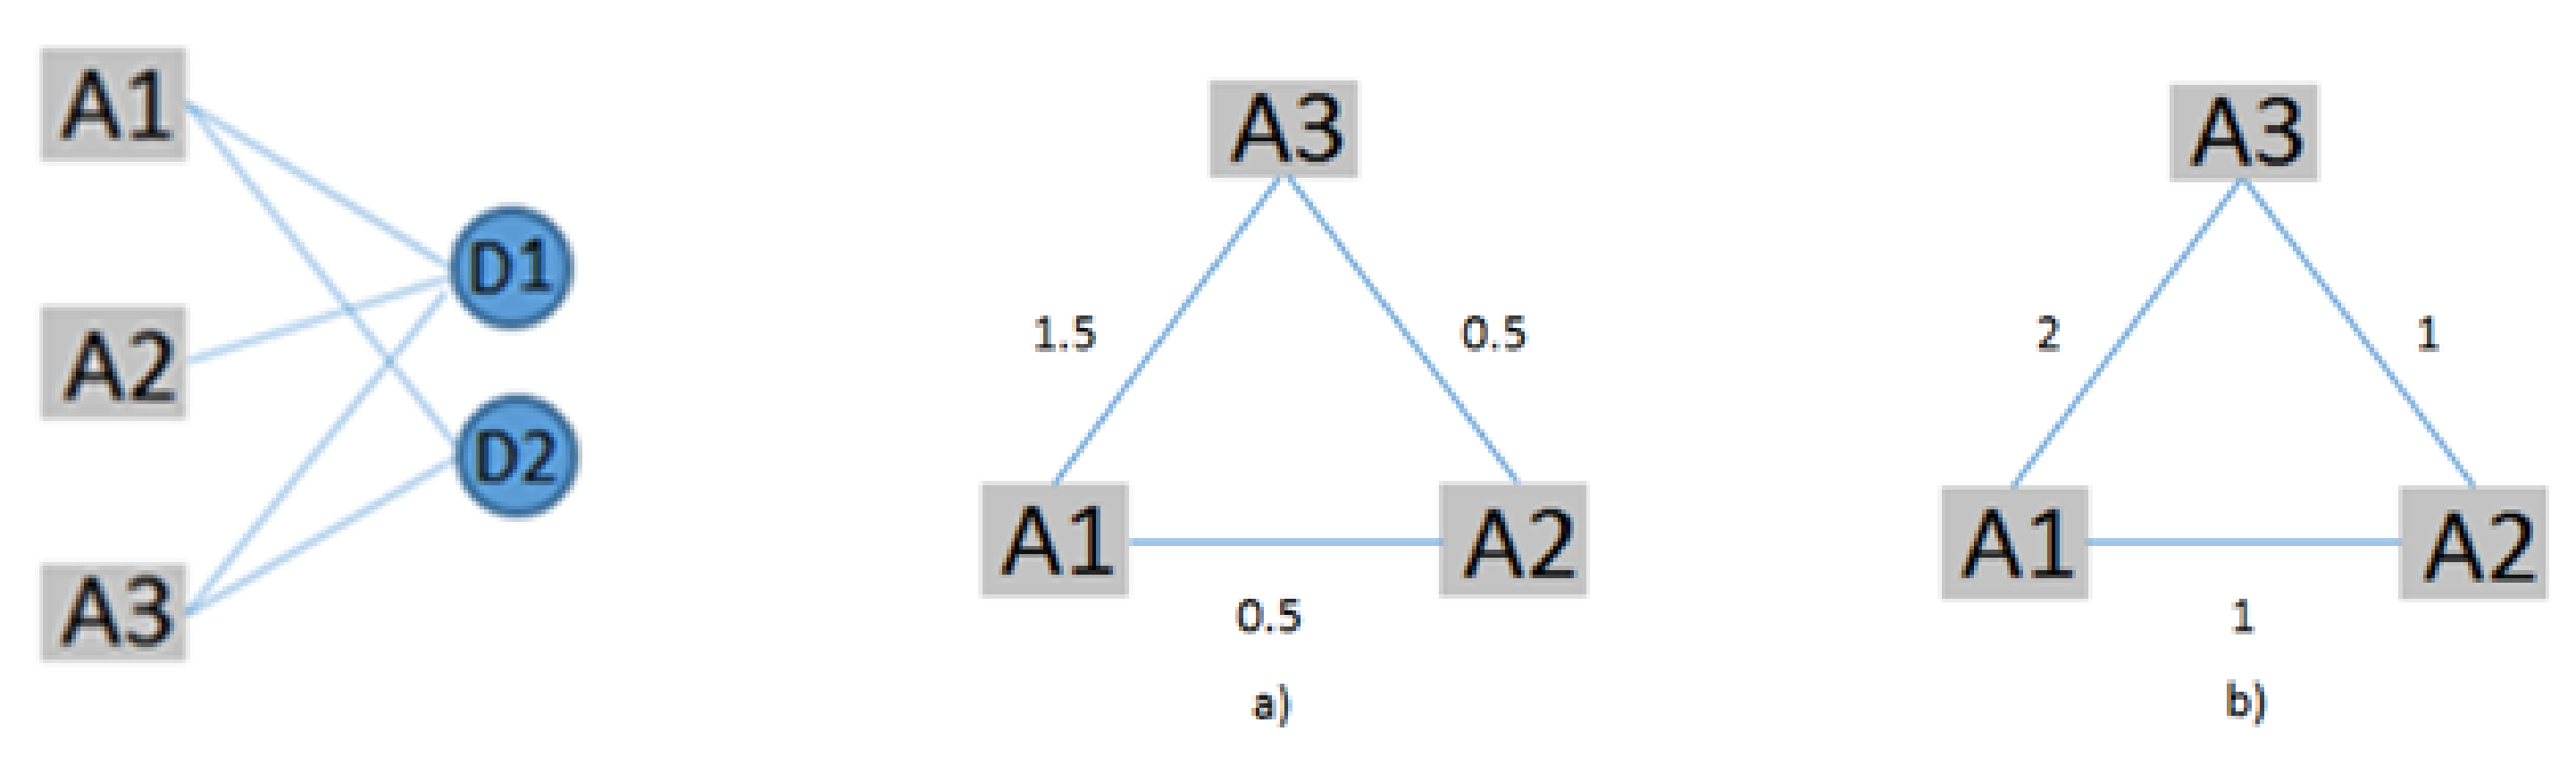
2.2. Bibliometric Analysis
3. Results
4. Discussion
4.1. Discussion and Limitations of Methodology
4.2. Discussion of Results
5. Conclusions
Author Contributions
Funding
Acknowledgments
Conflicts of Interest
Appendix A

| CLUSTER 1 (60 Items) | CLUSTER 2 (47 Items) | CLUSTER 3 (40 Items) | CLUSTER 4 (40 Items) | CLUSTER 5 (31 Items) | CLUSTER 6 (10 Items) | ||||||
|---|---|---|---|---|---|---|---|---|---|---|---|
| Documents Citations | Documents Citations | Documents Citations | Documents Citations | Documents Citations | Documents Citations | ||||||
| Arbaci (2012) | 31 | Alexandrescu et al. (2018) | 6 | Barles (2010) | 86 | Ahvenniemi et al. (2017) | 77 | Caputo et al. (2012) | 13 | Davoudia and Sturzakerb (2017) | 10 |
| Baba (2017) | 2 | Artmann (2014) | 20 | Basiri et al. (2017) | 3 | Al Nuaimi et al. (2015) | 78 | Dell‘ollo et al. (2014) | 10 | Haghshenas and Vaziri (2012) | 80 |
| Bailey (2012) | 30 | Artmann (2014b) | 28 | Blecic et al. (2014) | 10 | Albino et al. (2015) | 260 | Farmani et al. (2012) | 10 | Li et al. (2017) | 0 |
| Barbour et al. (2016) | 1 | Barbosa et al. (2012) | 135 | Broto et al. (2012) | 70 | Angelidou (2014) | 125 | Grekousis et al. (2019) | 0 | Liu (2012) | 30 |
| Belanche et al. (2016) | 34 | Beck et al. (2013) | 7 | Chen and Chen (2019) | 127 | Batty et al. (2012) | 372 | Haapio (2012) | 88 | Moore et al. (2013) | 56 |
| Biddulph (2011) | 29 | Berta et al. (2016) | 5 | Chester et al. (2012) | 33 | Betz et al. (2016) | 6 | Hale and Sadler (2012) | 12 | Newton and Glackin (2014) | 19 |
| Blessi et al. (2012) | 17 | Bonafoni et al. (2017) | 10 | Chrysoulakis et al. (2013) | 53 | Bibri and Krogstie (2017) | 58 | Herrschel (2013) | 26 | Pojani and Stead (2015) | 40 |
| Bulkeley et al. (2016) | 14 | Breuste et al. (2013) | 15 | Conke and Ferreira (2015) | 23 | Caragliu et al. (2011) | 576 | Jansson (2013) | 60 | Thomson and Newman (2018) | 4 |
| Codecasa and Ponzini (2011) | 16 | Bridges (2016) | 2 | Cui et al. (2019) | 0 | Crivello (2014) | 17 | Jim (2013) | 43 | Van Timmeren et al. (2012) | 6 |
| Couch et al. (2011) | 67 | Chelleri et al. (2016) | 2 | Dijst et al. (2018) | 4 | Falco et al. (2018) | 0 | Kaur and Garg (2019) | 1 | Webb et al. (2018) | 11 |
| Cuthill (2010) | 91 | D’Al.isa et al. (2012) | 32 | García-Guaita et al. (2018) | 1 | Falco et al. (2019) | 0 | Rosa (2014) | 43 | ||
| Deakin (2012) | 11 | Dierkes et al. (2015) | 19 | Goldstein et al. (2013) | 42 | Ejaz et al. (2017) | 54 | Rosa et al. (2017) | 9 | ||
| Degen and Garcia (2012) | 79 | Francesch-Huidobro (2015) | 8 | Gonzalez et al. (2013) | 47 | Garau and Pavan (2018) | 28 | Leigh and Hoelzel (2012) | 21 | ||
| Dempsey et al. (2011) | 275 | Gaitani et al. (2014) | 14 | Huang et al. (2018) | 0 | Garau et al. (2016) | 7 | Lombardi et al. (2011) | 40 | ||
| Dempsey et al. (2012) | 76 | Girard (2013) | 26 | Inostroza (2014) | 24 | Gazzola et al. (2019) | 0 | MacLeo d (2013) | 37 | ||
| Dixon et al. (2011) | 22 | Grêt-Regamey et al. (2013) | 48 | Kennedy et al. (2011) | 258 | Gharaibeh et al. (2017) | 32 | Marsal-Llacuna and López-Ibáñez (2014) | 8 | ||
| Ergas (2010) | 34 | Guzmán et al. (2017) | 20 | Kılkış (2017) | 0 | Goodspeed (2014) | 39 | Mateo and Cunat (2016) | 3 | ||
| Eriksson (2010) | 28 | Kaika (2017) | 32 | Lehmann (2011) | 28 | Ibrahim et al. (2018) | 6 | Mavrakis et al. (2015) | 11 | ||
| Frantál et al. (2015) | 28 | Klopp and Petretta (2017) | 22 | Liang and Zhang (2012) | 38 | Lombardi et al. (2012) | 158 | Morimoto (2011) | 10 | ||
| González et al. (2013) | 166 | Lapenna and Toccafondi (2017) | 0 | Lin et al. (2014) | 27 | Macke et al. (2018) | 8 | Mörtberg et al. (2013) | 17 | ||
| Gray and Porter (2015) | 19 | Li et al. (2017) | 17 | Lund et al. (2015) | 45 | Manitiu and Pedrini (2016) | 2 | Oh et al. (2011) | 5 | ||
| Guimarães (2017) | 2 | Lu et al. (2016) | 14 | Meijer (2011) | 18 | March and Ribera-Fumaz (2016) | 32 | Peng et al. (2015) | 32 | ||
| Güzey (2016) | 11 | Marlow et al. (2013) | 126 | Mostafavi et al. (2014) | 10 | Marsal-Llacuna et al. (2015) | 61 | Pili et al. (2017) | 51 | ||
| Haas and Locke (2012) | 0 | McCormick et al. (2013) | 144 | Mostafavi et al. (2014a) | 7 | Martin et al. (2018) | 11 | Rogers et al. (2012) | 34 | ||
| Hodkinson (2011) | 23 | Medved (2016) | 9 | Niemi et al. (2012) | 54 | Martin et al. (2019) | 0 | Scott (2007) | 31 | ||
| Howley et al. (2009) | 73 | Nevens et al. (2013) | 191 | Pearson et al. (2010) | 74 | Mosannenzadeh et al. (2017b) | 15 | Shi et al. (2012) | 43 | ||
| Huston et al. (2015) | 16 | Newell et al. (2013) | 41 | Pincetl et al. (2012) | 98 | Palma Lampreia dos Santos (2016) | 11 | Song (2005) | 55 | ||
| Jung et al. (2015) | 16 | Perales-Momparler et al. (2015) | 13 | Rosado et al. (2014) | 54 | Pinna et al. (2017) | 10 | Strazzera (2010) | 13 | ||
| Keresztely and Scott (2012) | 11 | Pupphachai and Zuidema (2017) | 13 | Rosado et al. (2016) | 12 | Roche (2014) | 36 | Tyler et al. (2013) | 25 | ||
| Kort and Klijn (2013) | 12 | Radulescu et al. (2016) | 8 | Shahrokni et al. (2015a) | 7 | Shahrokni et al. (2015) | 14 | Yigitcanlar and Lee (2014) | 60 | ||
| Kriznik (2018) | 2 | Romero-Lankao et al. (2014) | 24 | Singh et al. (2011) | 54 | Shen et al. (2018 | 1 | Zitti et al. (2015) | 58 | ||
| Larco (2016) | 20 | Sharma et al. (2010) | 26 | Voskamp et al. (2018) | 8 | Shin et al. (2015) | 19 | ||||
| Lee et al. (2014) | 12 | Simon et al. (2015) | 19 | Wachsmuth (2012) | 46 | Soyinka et al. (2016) | 3 | ||||
| Lees and Melhuish (2012) | 12 | Stredova et al. (2015) | 7 | Walker and Beck (2012) | 14 | Steenbruggen et al. (2015) | 42 | ||||
| Lim et al. (2013) | 16 | Tran (2016) | 12 | Xia et al. (2018) | 3 | Tranos and Gertner (2012) | 48 | ||||
| Lugosi, et al. (2010) | 17 | Uyarra and Gee (2013) | 27 | Yang et al. (2012) | 19 | Winters (2011) | 97 | ||||
| Malleson and Heppenstall (2013) | 12 | Van de Meene et al. (2011) | 71 | Yang et al. (2014) | 24 | Yigitcanlar (2015) | 21 | ||||
| Martí-Costa and Miquel (2011) | 23 | Wei et al. (2015) | 36 | Zhang et al. (2011) | 56 | Yigitcanlar et al. (2019) | 0 | ||||
| McGuirk et al. (2016) | 13 | Willuweit and OSullivan (2013) | 39 | Zhang et al. (2014) | 22 | Zanella et al. (2014) | 1065 | ||||
| Meerkerk (2013) | 25 | Yang and Wang (2017) | 7 | Zhang et al. (2018) | 1 | Zhang et al. (2019) | 0 | ||||
| Mosannenzadeh et al. (2017) | 9 | Yigitcanlar and Teriman (2015) | 46 | ||||||||
| Obeng-Odoom (2014) | 14 | Yim et al. (2015) | 3 | ||||||||
| Pares et al. (2014) | 12 | Yin et al. (2014) | 56 | ||||||||
| Parés et al. (2012) | 20 | Yue et al. (2014) | 26 | ||||||||
| Park (2014) | 2 | Zhang et al. (2016) | 3 | ||||||||
| Rhodes and Russo (2013) | 20 | Zhao (2010) | 121 | ||||||||
| Sasaki (2010) | 42 | Ziervogel et al. (2016) | 18 | ||||||||
| Schuetze and Chelleri (2016) | 13 | ||||||||||
| Shao and Liu (2018) | 1 | ||||||||||
| Susilo et al. (2012) | 39 | ||||||||||
| Tasan-Kok (2010) | 25 | ||||||||||
| Tulumello (2016) | 10 | ||||||||||
| Ulldemolins (2014) | 22 | ||||||||||
| Uysal (2012) | 23 | ||||||||||
| Van den Berg (2013) | 22 | ||||||||||
| Vento (2017) | 8 | ||||||||||
| While et al. (2010) | 172 | ||||||||||
| Winston (2010) | 43 | ||||||||||
| Zebracki and Smulders (2012) | 1 | ||||||||||
| Zhong (2016) | 10 | ||||||||||
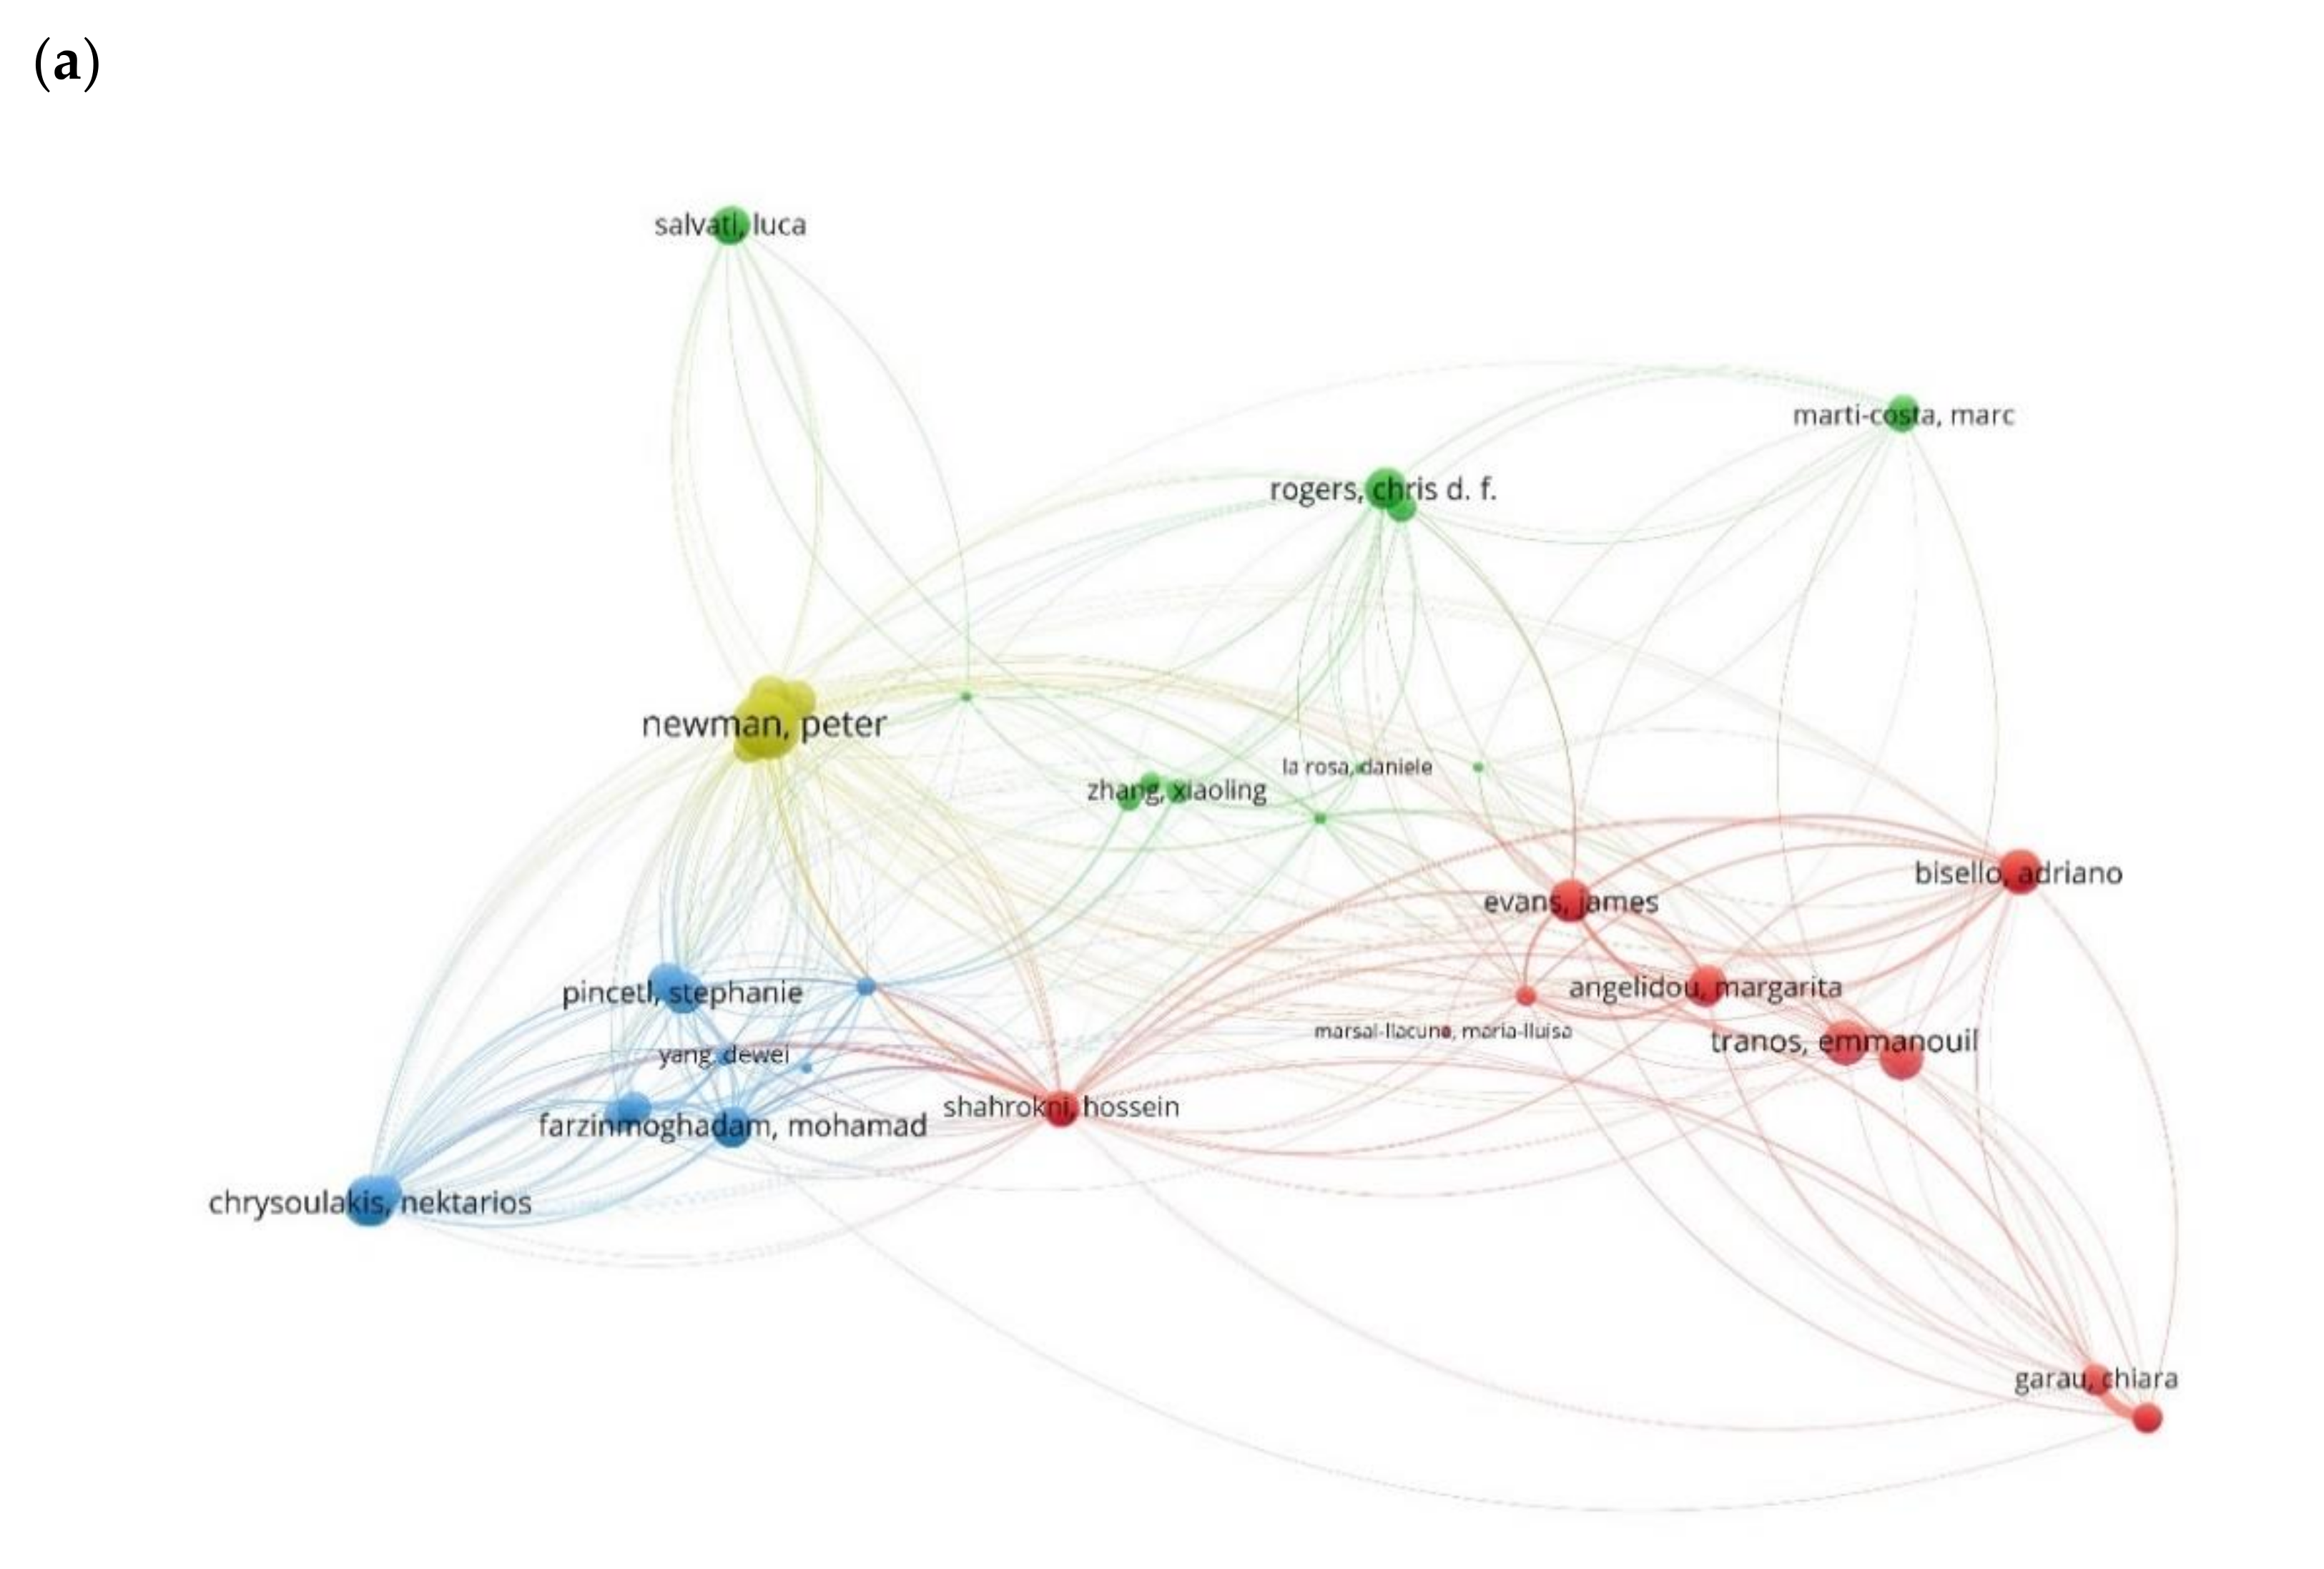
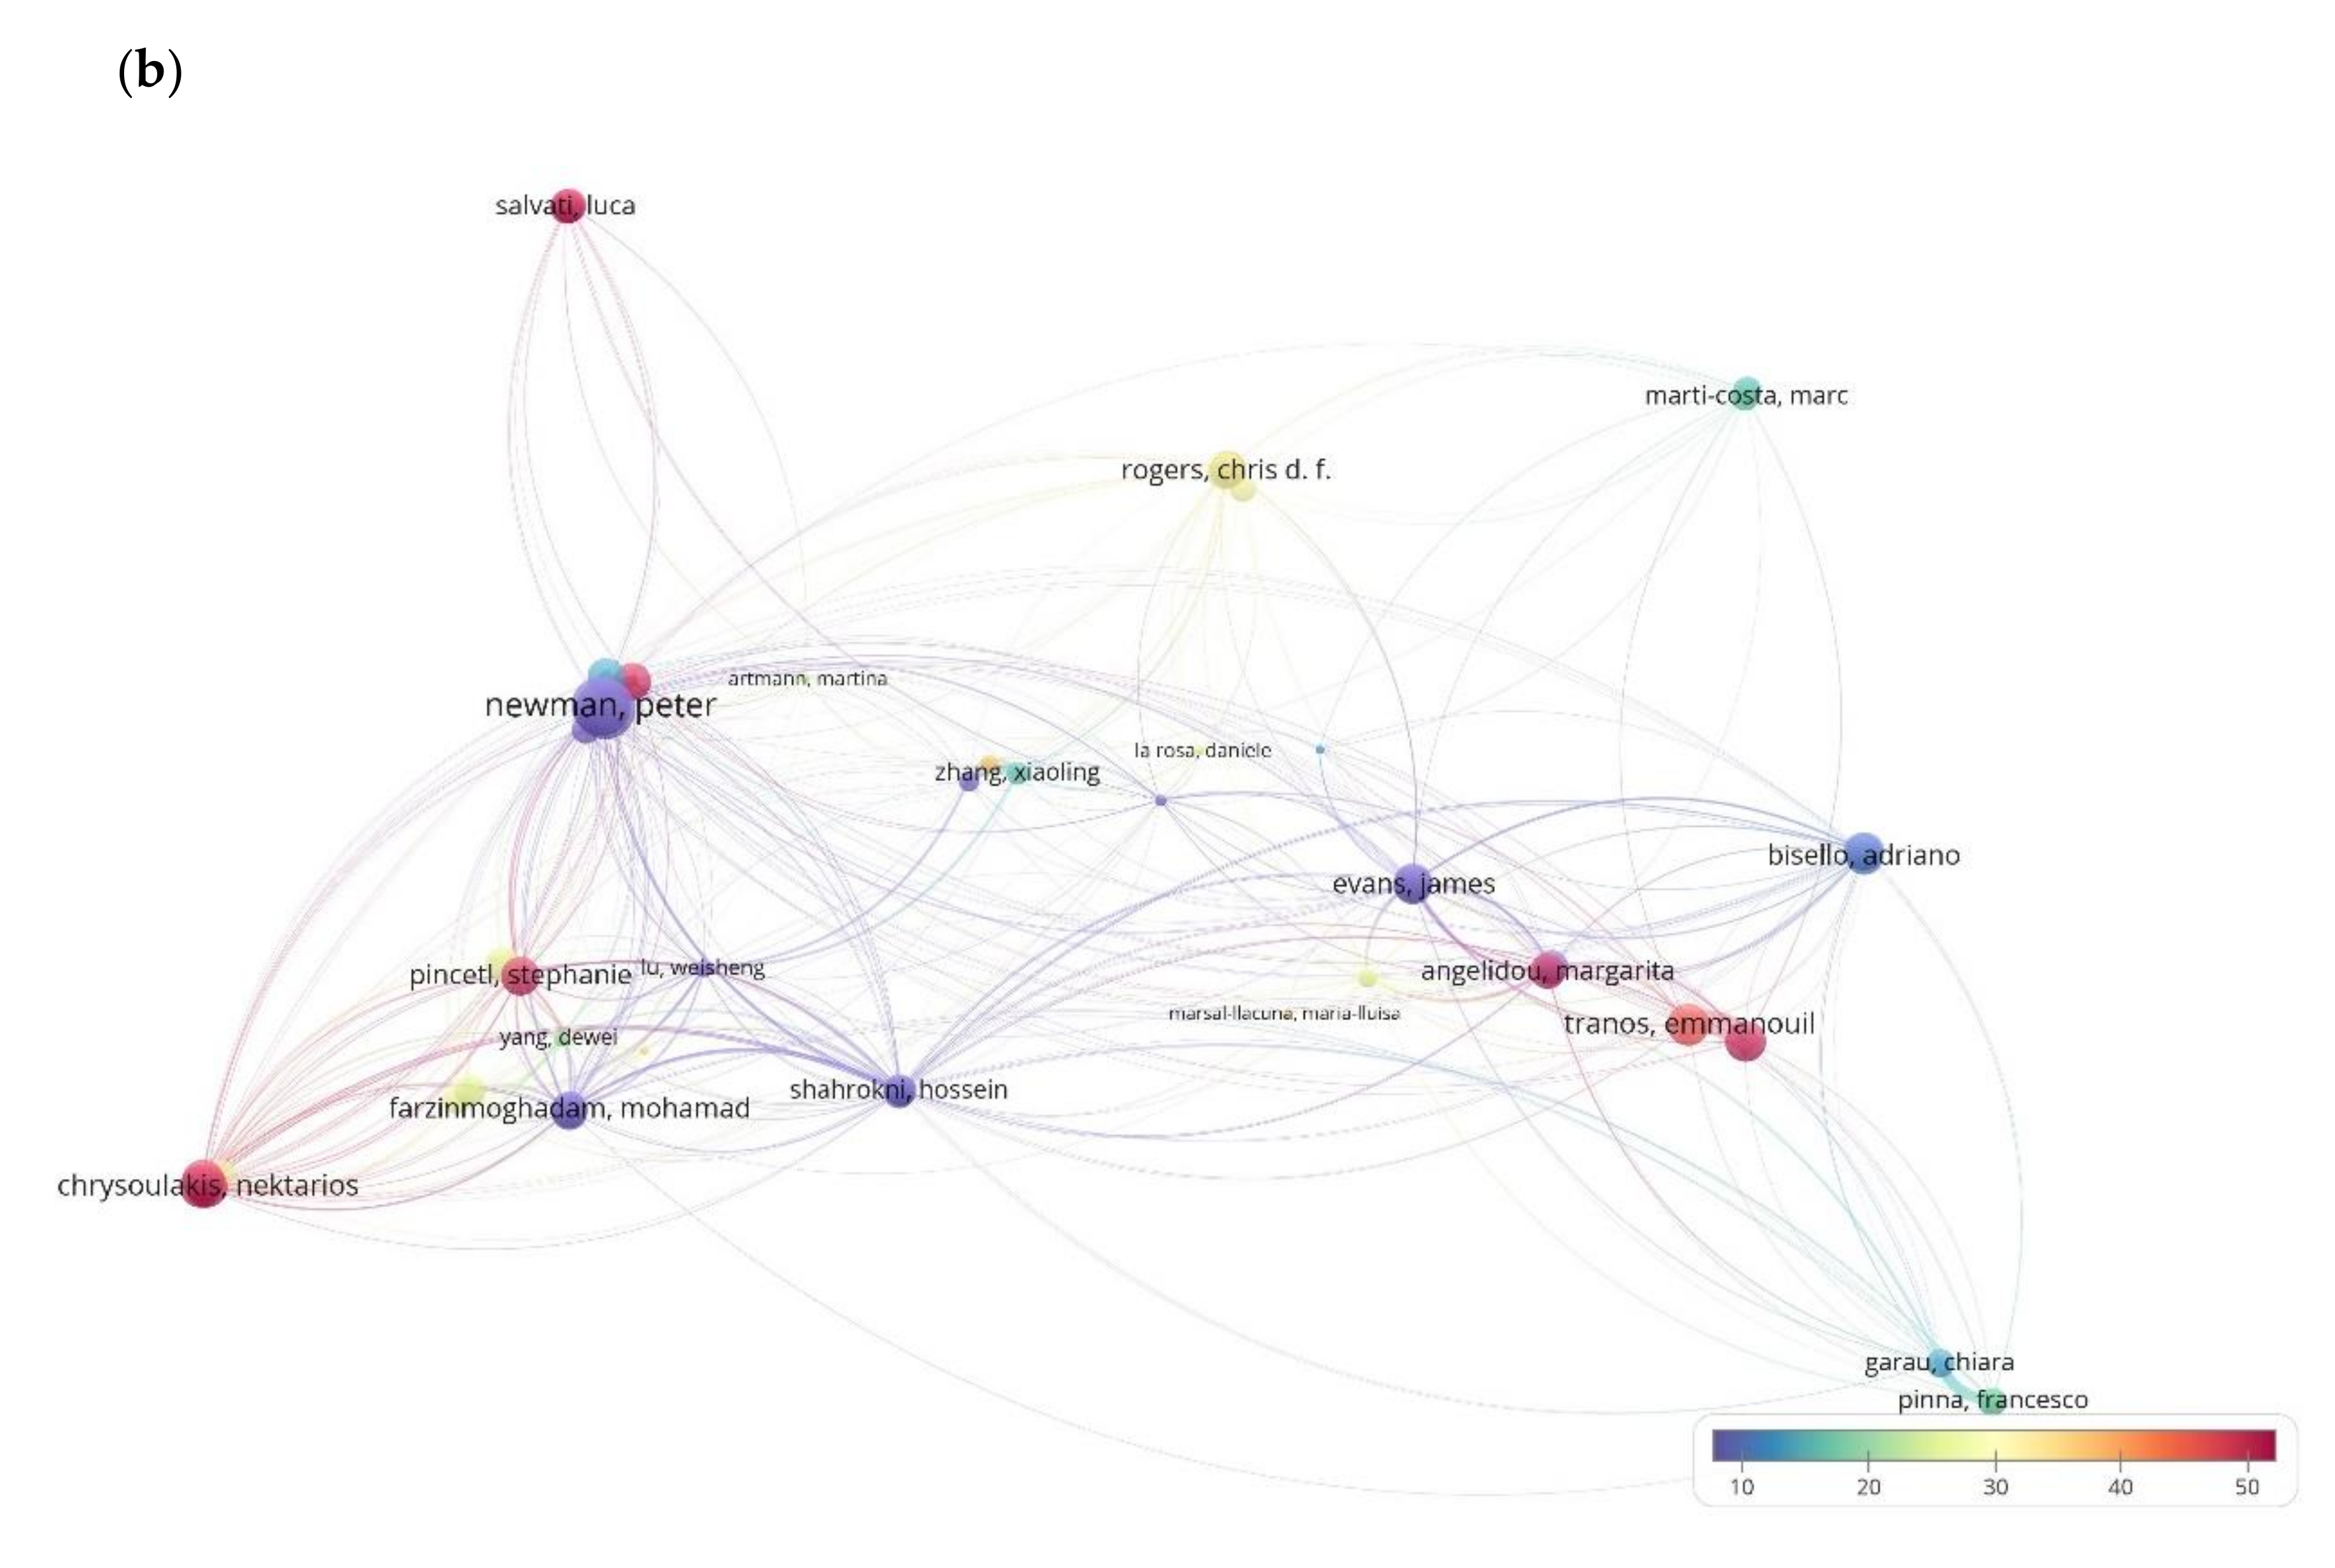
| CLUSTER 1 (17 items) | CLUSTER 2 (14 items) | CLUSTER 3 (13 items) | CLUSTER 4 (5 items) | ||||||||
|---|---|---|---|---|---|---|---|---|---|---|---|
| Authors | Total Link Strength | Avg. Citations | Authors | Total Link Strength | Avg. Citations | Authors | Total Link Strength | Avg. Citations | Authors | Total Link Strength | Avg. Citations |
| Angelidou Margarita | 125.38 | 62.50 | Artmann Martina | 10.00 | 24.00 | Chester Mikhail | 129.80 | 28.50 | Davoudi Simin | 89.33 | 7.00 |
| Bisello Adriano | 142.55 | 12.00 | Carlucci Margherita | 121.00 | 54.50 | Chrusoulakis Nektarios | 167.62 | 50.00 | Moglia Mangus | 142.00 | 68.50 |
| Brandt Nils | 103.81 | 10.5 | Chelleri Lorenzo | 21.75 | 7.50 | Farzinmoghadam Mohamad | 133.47 | 8.50 | Newman Peter | 292.25 | 6.33 |
| De Facto Stefano | 123.38 | 0.00 | La Rosa Daniele | 10.00 | 26.00 | Gonzalez Ainhoa | 167.62 | 50.00 | Newton Peter | 142.17 | 15.00 |
| Evans James | 147.39 | 5.50 | Li Feng | 57.00 | 10.00 | Liu Gengyuan | 98.75 | 29.50 | Thomson Giles | 292.25 | 6.33 |
| Garau Chiara | 93.90 | 15.00 | Lombardi D. Rachel | 136.50 | 37.00 | Lopes Myriam | 167.62 | 50.00 | |||
| Karvonen Andrew | 147.39 | 5.50 | Marti-Costa Marc | 93.50 | 18.33 | Lu Weisheng | 43.00 | 2.00 | |||
| Lazarevic David | 103.81 | 10.50 | Mcguirk Pauline M. | 6.00 | 13.50 | Mostafavi Nariman | 133.47 | 8.50 | |||
| Marsal-Llacuna Maria Luis | 3.00 | 34.50 | Pares Marc | 90.50 | 16.00 | Pincetl Stephanie | 149.17 | 51.67 | |||
| Masala Francesca | 84.12 | 19.00 | Porter Libby | 87.60 | 29.50 | Rosado Leonardo | 16.63 | 33.00 | |||
| Mosannenzadeh Farnaz | 142.25 | 12.00 | Rogers Chris D.F. | 137.17 | 28.00 | Spano Donatella | 107.13 | 31.50 | |||
| Nijkamp Peter | 162.33 | 309.0 | Salvati Luca | 121.00 | 54.50 | Yang Dewei | 39.10 | 21.50 | |||
| Pinna Francesco | 84.12 | 19.00 | Wang Rusong | 45.00 | 36.50 | Zhang Yan | 105.35 | 27.00 | |||
| Shahrokni Hossein | 103.81 | 10.50 | Zhang Xiaoling | 64.00 | 17.33 | ||||||
| Tranos Emmanuil | 166.71 | 45.00 | |||||||||
| Vettorato Daniele | 142.55 | 12.00 | |||||||||
| Yigitcanlar Tan | 45.11 | 27.00 | |||||||||
| References |
|---|
| Dempsey, N.; Bramley, G.; Power, S.; Brown, C. The Social Dimension of Sustainable Development: Defining Urban Social Sustainability. Sustain. Dev. 2011, 19, 289–300. doi:10.1002/sd.417. |
| While, A.; Jonas, A.E.G.; Gibbs, D. From Sustainable Development to Carbon Control: Eco-state. Restructuring and the Politics of Urban and Regional Development. Trans. Inst. Br. Geogr. 2010, 35, 76–93. doi:10.1111/j.1475-5661.2009.00362.x. |
| González, A.; Donnelly, A.; Jones, M.; Chrysoulakis, N.; Lopes, M. A Decision-Support System for Sustainable Urban Metabolism in Europe. Environ. Impact Assess. Rev. 2013, 38, 109–119. doi:10.1016/j.eiar.2012.06.007. |
| Cuthill, M. Strengthening the “social” in Sustainable Development: Developing a Conceptual Framework for ocial Sustainability in a Rapid Urban Growth Region in Australia. Sustain. Dev. 2010, 18, 362–373. doi:10.1002/sd.397. |
| Degen, M.; García, M. The Transformation of the “Barcelona Model”: An Analysis of Culture, Urban. Regeneration and Governance. Int. J. Urban Reg. Res. 2012, 36, 1022–1038. doi:10.1111/j.1468-2427.2012.01152.x. |
| Nevens, F.; Frantzeskaki, N.; Gorissen, L.; Loorbach, D. Urban Transition Labs: Co-Creating Transformative Action for Sustainable Cities. J. Clean. Prod. 2013, 50, 111–122. doi:10.1016/j.jclepro.2012.12.001. |
| McCormick, K.; Anderberg, S.; Coenen, L.; Neij, L. Advancing Sustainable Urban Transformation. J. Clean. Prod. 2013, 50, 1–11. doi:10.1016/j.jclepro.2013.01.003. |
| Barbosa, A.E.; Fernandes, J.N.; David, L.M. Key Issues for Sustainable Urban Stormwater Management. Water Res. 2012, 46, 6787–6798. doi:10.1016/j.watres.2012.05.029. |
| Marlow, D.R.; Moglia, M.; Cook, S.; Beale, D.J. Towards Sustainable Urban Water Management: A Critical Reassessment. Water Res. 2013, 47, 7150–7161. doi:10.1016/j.watres.2013.07.046. |
| Zhao, P. Sustainable Urban Expansion and Transportation in a Growing Megacity: Consequences of Urban. Sprawl for Mobility on the Urban Fringe of Beijing. Habitat Int. 2010, 34, 236–243. doi:10.1016/j.habitatint.2009.09.008. |
| Kennedy, C.; Pincetl, S.; Bunje, P. The Study of Urban Metabolism and Its Applications to Urban Planning and Design. Environ. Pollut. 2011, 159, 1965–1973. doi:10.1016/j.envpol.2010.10.022. |
| Chen, S.; Chen, B. Network Environ Perspective for Urban Metabolism and Carbon Emissions: A Case Study of Vienna, Austria. Environ. Sci. Technol. 2012, 46, 4498–4506. doi:10.1021/es204662k. |
| Pincetl, S.; Bunje, P.; Holmes, T. An Expanded Urban Metabolism Method: Toward a Systems Approach for Assessing Urban Energy Processes and Causes. Landsc. Urban Plan. 2012, 107, 193–202. doi:10.1016/j.landurbplan.2012.06.006. |
| Barles, S. Society, Energy and Materials: The Contribution of Urban Metabolism Studies to Sustainable Urban Development Issues. J. Environ. Plan. Manag. 2010, 53, 439–455. doi:10.1080/09640561003703772. |
| Pearson, L.J.; Pearson, L.; Pearson, C.J. Sustainable Urban Agriculture: Stocktake and Opportunities. Int. J. Agric. Sustain. 2010, 8, 7–19. doi:10.3763/ijas.2009.0468. |
| Zanella, A.; Bui, N.; Castellani, A.; Vangelista, L.; Zorzi, M. Internet of Things for Smart Cities. IEEE Internet Things J. 2014, 1, 22–32. doi:10.1109/JIOT.2014.2306328. |
| Caragliu, A.; del Bo, C.; Nijkamp, P. Smart Cities in Europe. J. Urban Technol. 2011, 18, 65–82. doi:10.1080/10630732.2011.601117. |
| Batty, M.; Axhausen, K.W.; Giannotti, F.; Pozdnoukhov, A.; Bazzani, A.; Wachowicz, M.; Ouzounis, G.; Portugali, Y. Smart Cities of the Future. Eur. Phys. J. Spec. Top. 2012, 214, 481–518. doi:10.1140/epjst/e2012-01703-3. |
| Albino, V.; Berardi, U.; Dangelico, R.M. Smart Cities: Definitions, Dimensions, Performance, and Initiatives. J. Urban Technol. 2015, 22, 1–19. doi:10.1080/10630732.2014.942092. |
| Lombardi, P.; Giordano, S.; Farouh, H.; Yousef, W. Modelling the Smart City Performance. Innovation 2012, 25, 137–149. doi:10.1080/13511610.2012.660325. |
| Haapio, A. Towards Sustainable Urban Communities. Environ. Impact Assess. Rev. 2012, 32, 165–169. doi:10.1016/j.eiar.2011.08.002. |
| Yigitcanlar, T.; Lee, S.H. Korean Ubiquitous-Eco-City: A Smart-Sustainable Urban Form or a Branding Hoax? Technol. Forecast. Soc. Chang. 2014, 89, 100–114. doi:10.1016/j.techfore.2013.08.034. |
| Jansson, Å. Reaching for a Sustainable, Resilient Urban Future Using the Lens of Ecosystem Services. Ecol. Econ. 2013, 86, 285–291. doi:10.1016/j.ecolecon.2012.06.013. |
| Zitti, M.; Ferrara, C.; Perini, L.; Carlucci, M.; Salvati, L. Long-Term Urban Growth and Land Use Efficiency in Southern Europe: Implications for Sustainable Land Management. Sustainability 2015, 7, 3359–3385. doi:10.3390/su7033359. |
| Pili, S.; Grigoriadis, E.; Carlucci, M.; Clemente, M.; Salvati, L. Towards Sustainable Growth? A Multi-Criteria Assessment of (Changing) Urban Forms. Ecol. Indic. 2017, 76, 71–80. doi:10.1016/j.ecolind.2017.01.008. |
| Haghshenas, H.; Vaziri, M. Urban Sustainable Transportation Indicators for Global Comparison. Ecol. Indic. 2012, 15, 115–121. doi:10.1016/j.ecolind.2011.09.010. |
| Moore, J.; Kissinger, M.; Rees, W.E. An Urban Metabolism and Ecological Footprint Assessment of Metro Vancouver. J. Environ. Manag. 2013, 124, 51–61. doi:10.1016/j.jenvman.2013.03.009. |
| Pojani, D.; Stead, D. Sustainable Urban Transport in the Developing World: Beyond Megacities. Sustainability 2015, 7, 7784–7805. doi:10.3390/su7067784. |
| Liu, Y. Modelling Sustainable Urban Growth in a Rapidly Urbanising Region Using a Fuzzy-Constrained Cellular Automata Approach. Int. J. Geogr. Inf. Sci. 2012, 26, 151–167. doi:10.1080/13658816.2011.577434. |
| Newton, P.; Glackin, S. Understanding Infill: Towards New Policy and Practice for Urban Regeneration in the Established Suburbs of Australia’s Cities. Urban Policy Res. 2014, 32, 121–143. doi:10.1080/08111146.2013.877389. |
| Dempsey, N.; Brown, C.; Bramley, G. The Key to Sustainable Urban Development in UK Cities? The Influence of Density on Social Sustainability. Prog. Plann. 2012, 77, 89–141. doi:10.1016/j.progress.2012.01.001. |
| Lees, L.; Melhuish, C. Arts-Led Regeneration in the UK: The Rhetoric and the Evidence on Urban Social Inclusion. Eur. Urban Reg. Stud. 2015, 22, 242–260. doi:10.1177/0969776412467474. |
| Martí-Costa, M.; Pradel i Miquel, M. The Knowledge City against Urban Creativity? Artists’ Workshops and Urban Regeneration in Barcelona. Eur. Urban Reg. Stud. 2012, 19, 92–108. doi:10.1177/0969776411422481. |
| Rius Ulldemolins, J. Culture and Authenticity in Urban Regeneration Processes: Place Branding in Central Barcelona. Urban Stud. 2014, 51, 3026–3045. doi:10.1177/0042098013515762. |
| Yigitcanlar, T.; Teriman, S. Rethinking Sustainable Urban Development: Towards an Integrated Planning and Development Process. Int. J. Environ. Sci. Technol. 2015, 12, 341–352. doi:10.1007/s13762-013-0491-x. |
| Romero-Lankao, P.; Gurney, K.R.; Seto, K.C.; Chester, M.; Duren, R.M.; Hughes, S.; Hutyra, L.R.; Marcotullio, P.; Baker, L.; Grimm, N.B.; et al. A Critical Knowledge Pathway to Low-Carbon, Sustainable Futures: Integrated Understanding of Urbanization, Urban Areas, and Carbon. Earth’s Future 2014, 2, 515–532. doi:10.1002/2014ef000258. |
| Lu, Y.; Geng, Y.; Qian, Y.; Han, W.; McDowall, W.; Bleischwitz, R. Changes of Human Time and Land Use Pattern in One Mega City’s Urban Metabolism: A Multi-Scale Integrated Analysis of Shanghai. J. Clean. Prod. 2016, 133, 391–401. doi:10.1016/j.jclepro.2016.05.174. |
| Chelleri, L.; Kua, H.W.; Sánchez, J.P.R.; Md Nahiduzzaman, K.; Thondhlana, G. Are People Responsive to a More Sustainable, Decentralized, and User-Driven Management of Urban Metabolism? Sustainability 2016, 8, 1–12. doi:10.3390/su8030275. |
| Mostafavi, N.; Farzinmoghadam, M.; Hoque, S.; Weil, B. Integrated Urban Metabolism Analysis Tool (IUMAT). Urban Policy Res. Taylor Fr. 2014, 53–69. doi:10.1080/08111146.2013.826578. |
| Goldstein, B.; Birkved, M.; Quitzau, M.B.; Hauschild, M. Quantification of Urban Metabolism through Coupling with the Life Cycle Assessment Framework: Concept Development and Case Study. Environ. Res. Lett. 2013, 8. doi:10.1088/1748-9326/8/3/035024. |
| Zhan, Y.; Lu, W.; Wing-Yan Tam, V.; Feng, Y. From urban metabolism to industrial ecosystem metabolism: A study of construction in Shanghai from 2004 to 2014. J. Clean. Prod. 2018, 202, 428–438. doi:10.1016/j.jclepro.2018.08.054. |
| Broto, V.C.; Allen, A.; Rapoport, E. Interdisciplinary Perspectives on Urban Metabolism. J. Ind. Ecol. 2012, 16, 851–861. doi:10.1111/j.1530-9290.2012.00556.x. |
| Bibri, S.E.; Krogstie, J. Smart Sustainable Cities of the Future: An Extensive Interdisciplinary Literature Review. Sustain. Cities Soc. 2017, 31, 183–212. doi:10.1016/j.scs.2017.02.016. |
| Ahvenniemi, H.; Huovila, A.; Pinto-Seppä, I.; Airaksinen, M. What Are the Differences between Sustainable nd Smart Cities? Cities 2017, 60, 234–245. doi:10.1016/j.cities.2016.09.009. |
| Yigitcanlar, T.; Kamruzzaman, M.; Foth, M.; Sabatini-Marques, J.; da Costa, E.; Ioppolo, G. Can Cities Become Smart without Being Sustainable? A Systematic Review of the Literature. Sustain. Cities Soc. 2019, 45, 348–365. doi:10.1016/j.scs.2018.11.033. |
| Macke, J.; Casagrande, R.M.; Sarate, J.A.R.; Silva, K.A. Smart City and Quality of Life: Citizens’ Perception in a Brazilian Case Study. J. Clean. Prod. 2018, 182, 717–726. doi:10.1016/j.jclepro.2018.02.078. |
| Mörtberg, U.; Haas, J.; Zetterberg, A.; Franklin, J.P.; Jonsson, D.; Deal, B. Urban Ecosystems and Sustainable Urban Development-Analysing and Assessing Interacting Systems in the Stockholm Region. Urban Ecosyst. 2013, 16, 763–782. doi:10.1007/s11252-012-0270-3. |
| Lombardi, D.R.; Porter, L.; Barber, A.; Rogers, C.D.F. Conceptualising Sustainability in UK Urban Regeneration: A Discursive Formation. Urban Stud. 2011, 48, 273–296. doi:10.1177/0042098009360690. |
| MacLeod, G. New Urbanism/Smart Growth in the Scottish Highlands: Mobile Policies and Post-Politics in Local Development Planning. Urban Stud. 2013, 50, 2196–2221. doi:10.1177/0042098013491164. |
| Webb, R.; Bai, X.; Smith, M.S.; Costanza, R.; Griggs, D.; Moglia, M.; Neuman, M.; Newman, P.; Newton, P.; Norman, B.; et al. Sustainable Urban Systems: Co-Design and Framing for Transformation. Ambio 2018, 47, 57–77. doi:10.1007/s13280-017-0934-6. |
| Thomson, G.; Newman, P. Urban Fabrics and Urban Metabolism- from Sustainable to Regenerative Cities. Resour. Conserv. Recycl. 2018, 132, 218–229. doi:10.1016/j.resconrec.2017.01.010. |
| Davoudi, S.; Sturzaker, J. Urban Form, Policy Packaging and Sustainable Urban Metabolism. Resour. Conserv. Recycl. 2017, 120, 55–64. doi:10.1016/j.resconrec.2017.01.011. |
| van Timmeren, A.; Zwetsloot, J.; Brezet, H.; Silvester, S. Sustainable Urban Regeneration Based on Energy Balance. Sustainability 2012, 4, 1488–1509. doi:10.3390/su4071488. |
References
- Steffen, W.; Crutzen, P.J.; Mcneill, J.R.; Events, P. The Anthropocene: Are Humans Now Overwhelming the Great Forces of Nature. AMBIO: J. Hum. Environ. 2007, 36, 614–621. [Google Scholar] [CrossRef]
- United Nations, Department of Economic and Social Affairs, & Population Division. The World’s Cities in 2016. Data Booklet (ST/ESA/ SER.A/392). 2016. Available online: http://www.un.org/en/development/desa/population/publications/pdf/urbanization/the_worlds_cities_in_2016_data_booklet.pdf (accessed on 18 February 2020).
- Gerőházi, É.; Hegedüs, J.; Szemzo, H.; Tosics, I.; Tomay, K.; Gere, L. The Impact of European Demographic Trends on Regional and Urban Development: Synthesis Report. 2011. Available online: https://www.eukn.eu/fileadmin/Files/Presidencies/2011_Hungary/the_impact_of_european_demographic_trends.pdf (accessed on 18 February 2020).
- Haase, D.; Haase, A.; Rink, D. Conceptualizing the Nexus between Urban Shrinkage and Ecosystem Services. Landsc. Urban Plan. 2014, 132, 159–169. [Google Scholar] [CrossRef]
- Bhatta, B. Review of Literature. In Urban Growth Analysis and Remote Sensing; SpringerBriefs in Geography: Berlin, Germany, 2012; pp. 9–32. [Google Scholar] [CrossRef]
- Enyedi, G.Y. A városnövekedés szakaszai; Akadémia Kiadó: Budapest, Hungary, 1988. [Google Scholar]
- Hosszu, S. Counter Urbanization: A Literature Study; Working Paper No 06/2009; Danish Institute of Rural Research and Development, University of Southern Denmark: Esbjerg, Denmark, 2009. [Google Scholar]
- Ahmad, F.; Goparaju, L. Analysis of Urban Sprawl Dynamics Using Geospatial Technology in Ranchi City. J. Environ. Geogr. 2016, 9, 7–13. [Google Scholar] [CrossRef] [Green Version]
- Torrens, P.; Alberti, M. Measuring Sprawl; (CASA Paper 27); Centre for Advanced Spatial Analysis (CASA), University College London: London, UK, 2000. [Google Scholar]
- Jaeger, J.A.G.; Bertiller, R.; Schwick, C.; Kienast, F. Suitability criteria for measures of urban Sprawl. Ecol. Indic. 2010, 10, 427–441. [Google Scholar] [CrossRef]
- European Environment Agency (EEA). Urban Sprawl in Europe: Joint EEA-FOEN report No 11/2016 for EEA and FOEN. 2016. Available online: https://www.eea.europa.eu/publications/urban-sprawl-in-europe (accessed on 18 February 2020).
- Frumkin, H. Urban Sprawl and Public Health. Public Health Rep. 2002, 117, 201–217. [Google Scholar] [CrossRef]
- Albino, V.; Berardi, U.; Dangelico, R.M. Smart Cities: Definitions, Dimensions, Performance, and Initiatives. J. Urban Technol. 2017, 22, 3–21. [Google Scholar] [CrossRef]
- Bhatta, B. Causes and Consequences of Urban Growth and Sprawl. In Analysis of Urban Growth and Sprawl from Remote Sensing Data; Advances in Geographic Information Science; Springer: Berlin/Heidelberg, Germany, 2010; pp. 17–36. [Google Scholar] [CrossRef]
- Flis, I.; van Eck, N.J. Framing psychology as a discipline (1950–1999): A large-scale term co-occurrence analysis of scientific literature in psychology. Hist. Psychol. 2018, 21, 334–362. [Google Scholar] [CrossRef] [PubMed] [Green Version]
- Van Nunen, K.; Li, J.; Reniers, G.; Ponnet, K. Bibliometric analysis of safety culture research. Safety Sci. 2018, 108, 248–258. [Google Scholar] [CrossRef]
- Krauskopf, E. A bibliometric analysis of the Journal of Infection and Public Health: 2008–2016. J. Infect. Public Heal. 2018, 11, 224–229. [Google Scholar] [CrossRef] [PubMed]
- Park, J.Y.; Nagy, Z. Comprehensive analysis of the relationship between thermal comfort and building control research - A data-driven literature review. Renew. Sustain. Energy Rev. 2018, 82, 2664–2679. [Google Scholar] [CrossRef]
- Dyer, M.; Corsini, F.; Certomà, C. Making urban design a public participatory goal: Toward evidence-based urbanism. Proc. Instit. Civil Eng. Urban Des. Plan. 2017, 170, 173–186. [Google Scholar] [CrossRef]
- Van Eck, N.J.; Waltman, L.; Van den Berg, J.; Kaymak, U. Visualizing the computational intelligence field. IEEE Comput. Intell. M. 2006, 1, 6–10. [Google Scholar] [CrossRef] [Green Version]
- Van Eck, N.J.; Waltman, L. VOS: A new method for visualizing similarities between objects. In Advances in Data Analysis; Proceedings of the 30th Annual Conference of the German Classification Society; Lenz, H.-J., Decker, R., Eds.; Springer: Berlin/Heidelberg, Germany, 2007; pp. 299–306. [Google Scholar] [CrossRef]
- Van Eck, N.J.; Waltman, L. Bibliometric mapping of the computational intelligence field. IJUFKS 2007, 15, 625–645. [Google Scholar] [CrossRef]
- Van Eck, N.J.; Waltman, L. How to normalize cooccurrence data? An analysis of some well-known similarity measures. JASIST 2009, 60, 1635–1651. [Google Scholar] [CrossRef] [Green Version]
- Van Eck, N.J.; Waltman, L. Software survey: VOSviewer, a computer program for bibliometric mapping. Scientometrics 2010, 84, 523–538. [Google Scholar] [CrossRef] [PubMed] [Green Version]
- Van Eck, N.J.; Waltman, L. Visualizing bibliometric networks. In Measuring Scholarly Impact: Methods and Practice; Ding, Y., Rousseau, R., Wolfram, D., Eds.; Springer: Cham, Switzerland, 2014; pp. 285–320. [Google Scholar] [CrossRef]
- Perianes-Rodriguez, A.; Waltman, L.; van Eck, N.J. Constructing Bibliometric Networks: A Comparison between Full and Fractional Counting. J. Informetr. 2016, 10, 1178–1195. [Google Scholar] [CrossRef] [Green Version]


| Documents | |||||
|---|---|---|---|---|---|
| Keywords/Terms | D1 | D2 | D3 | D4 | D5 |
| K1 | 1 | 2 | 3 | 4 | 5 |
| K2 | 1 | 2 | 3 | 1 | 2 |
| K3 | 1 | 1 | 2 | ||
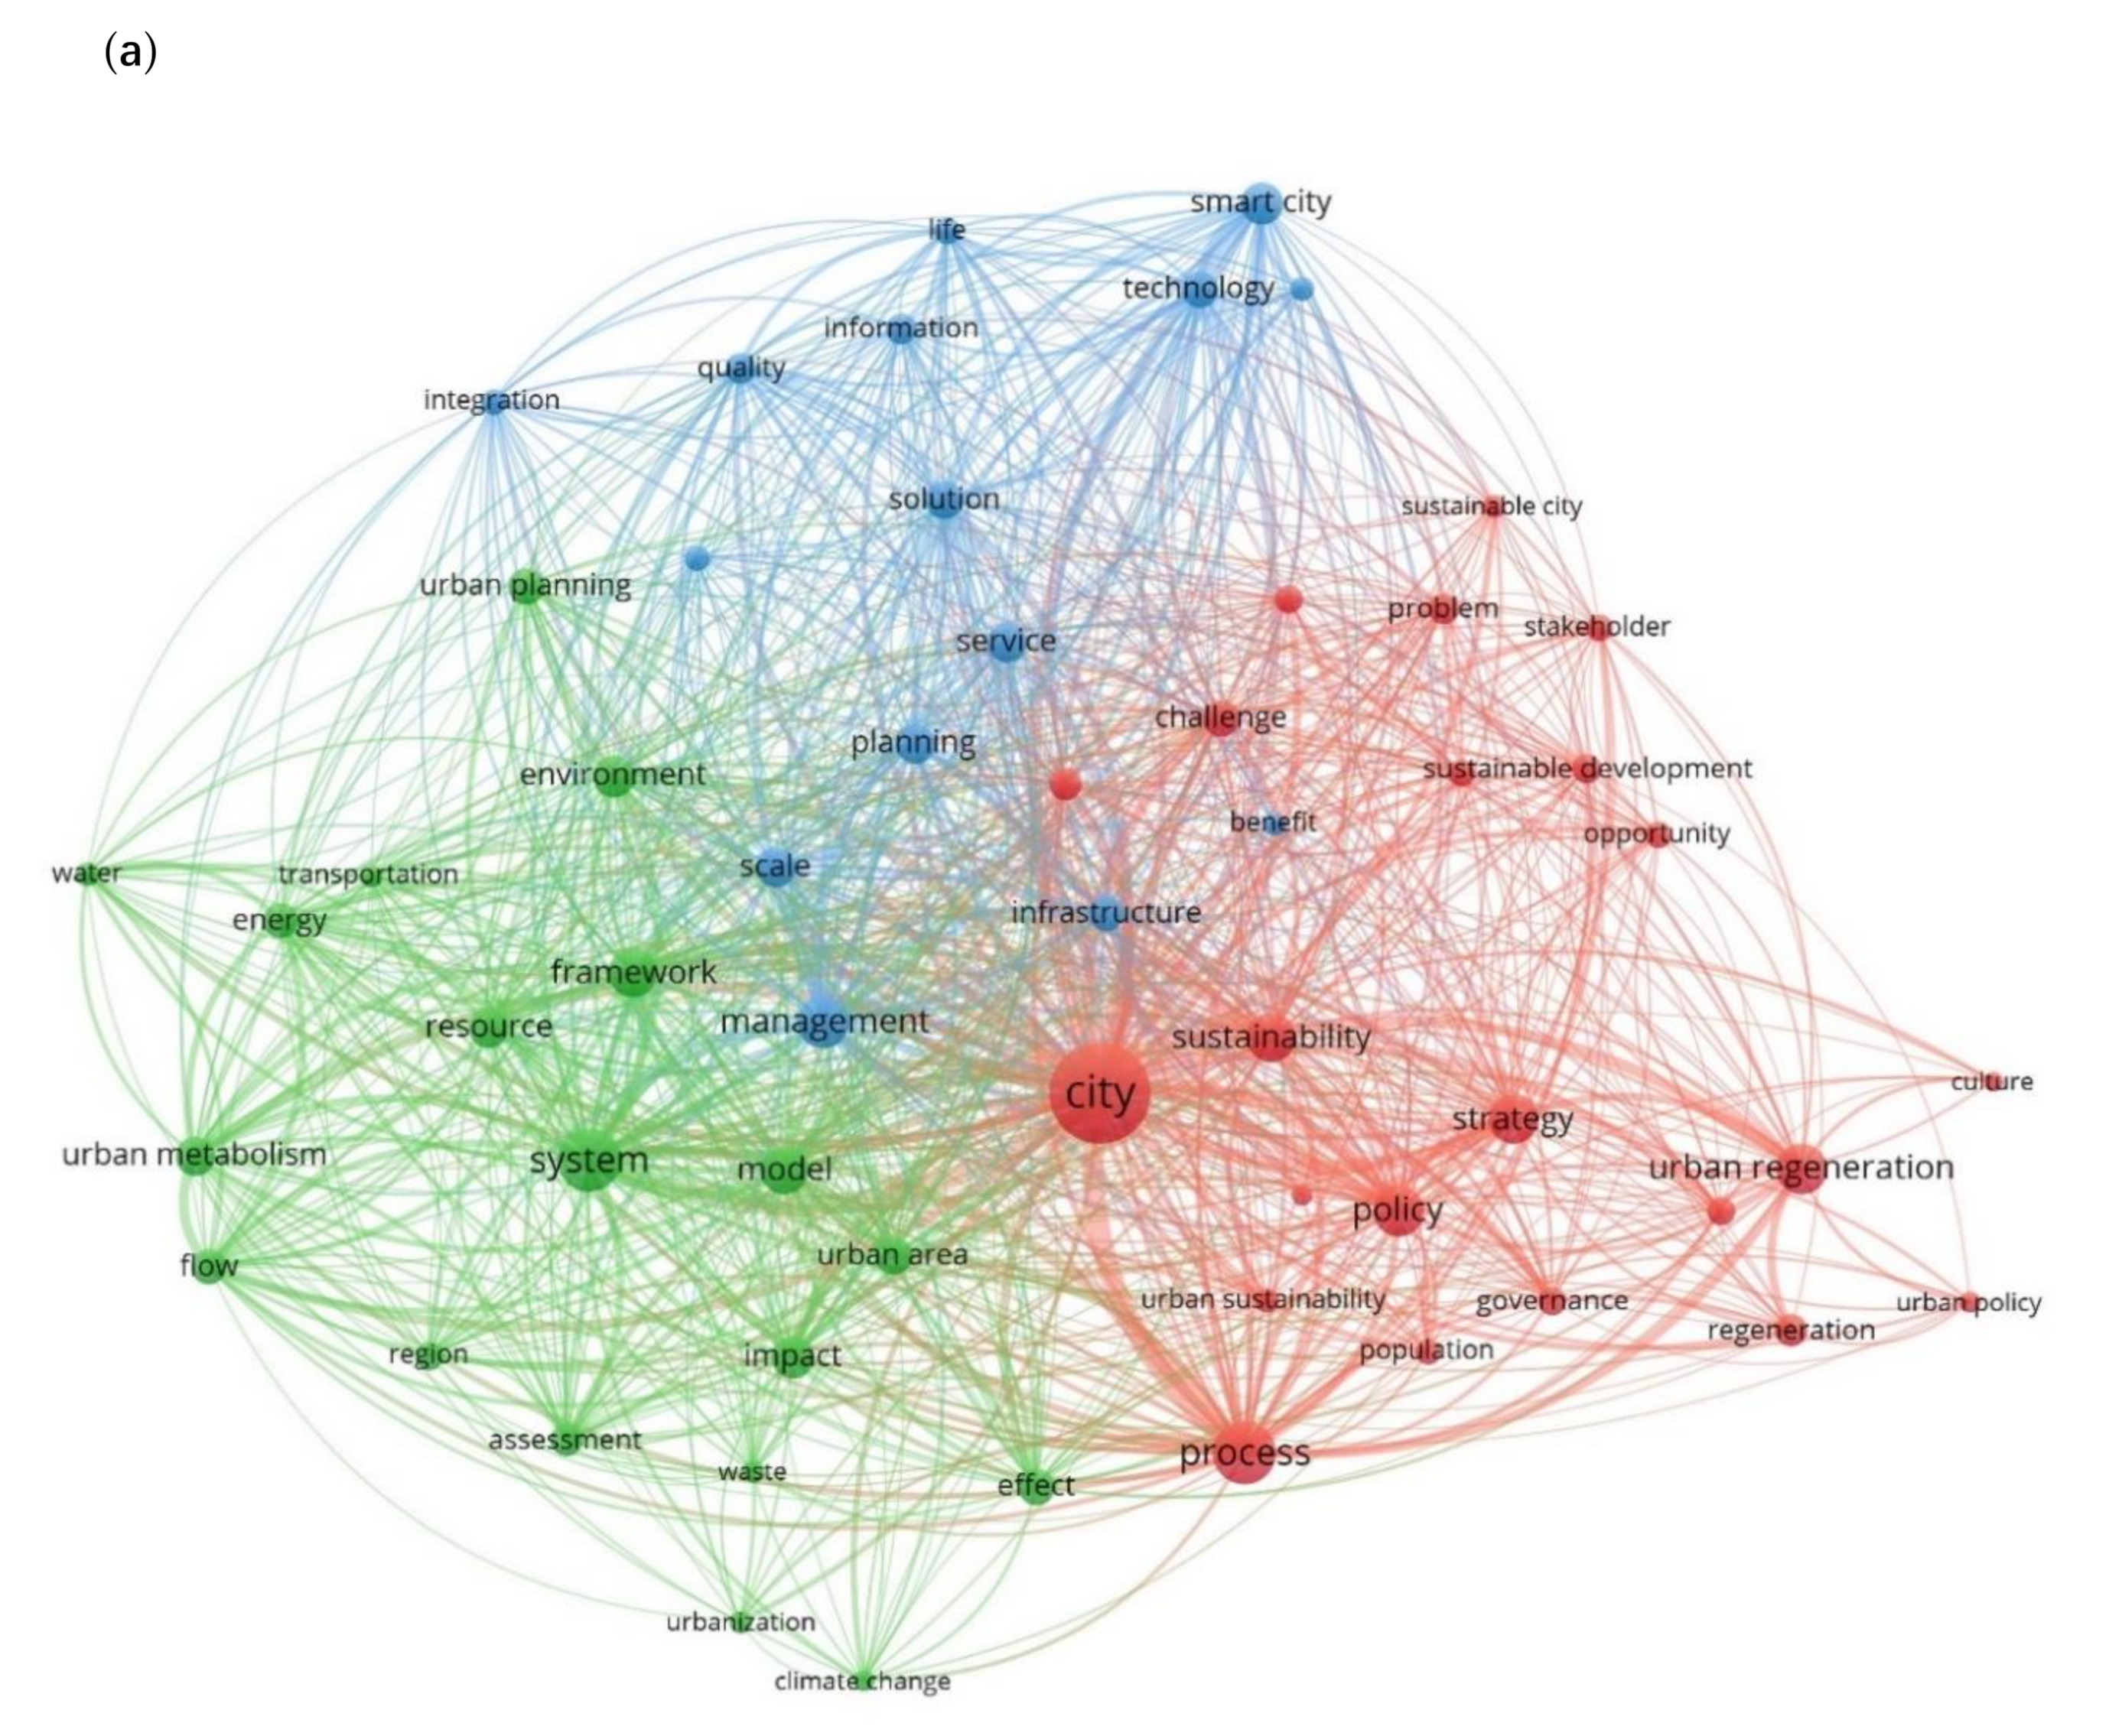
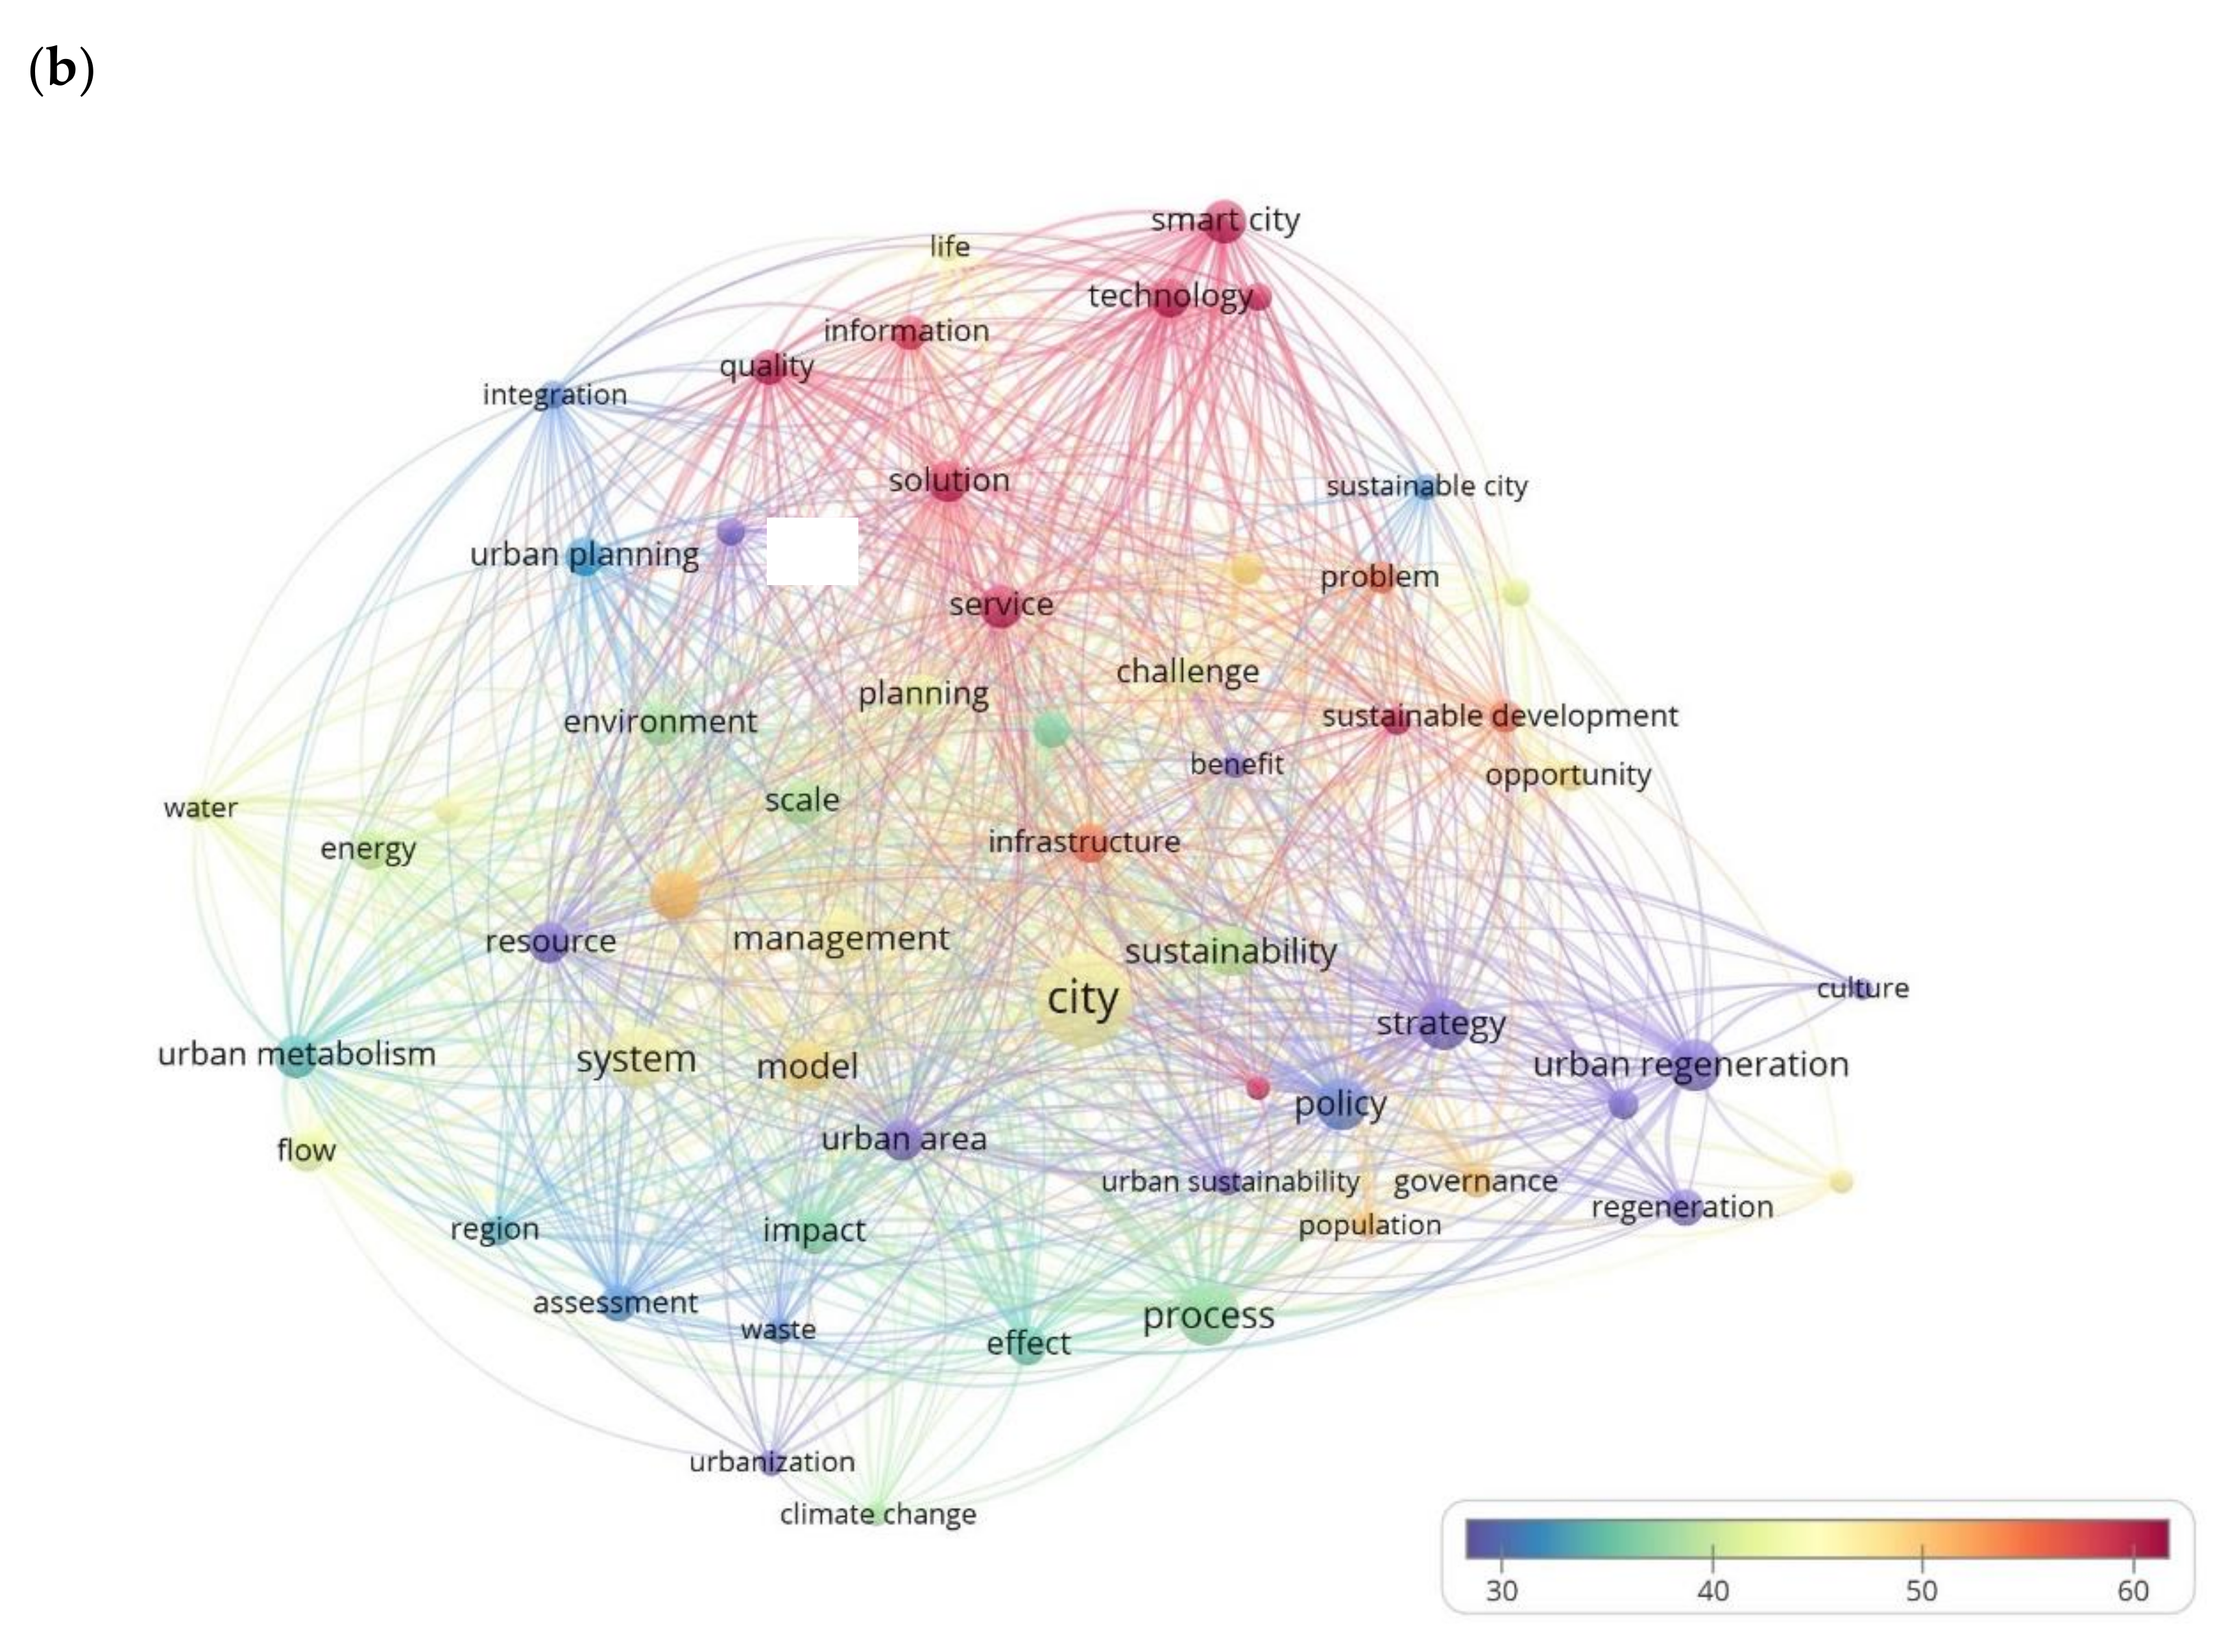
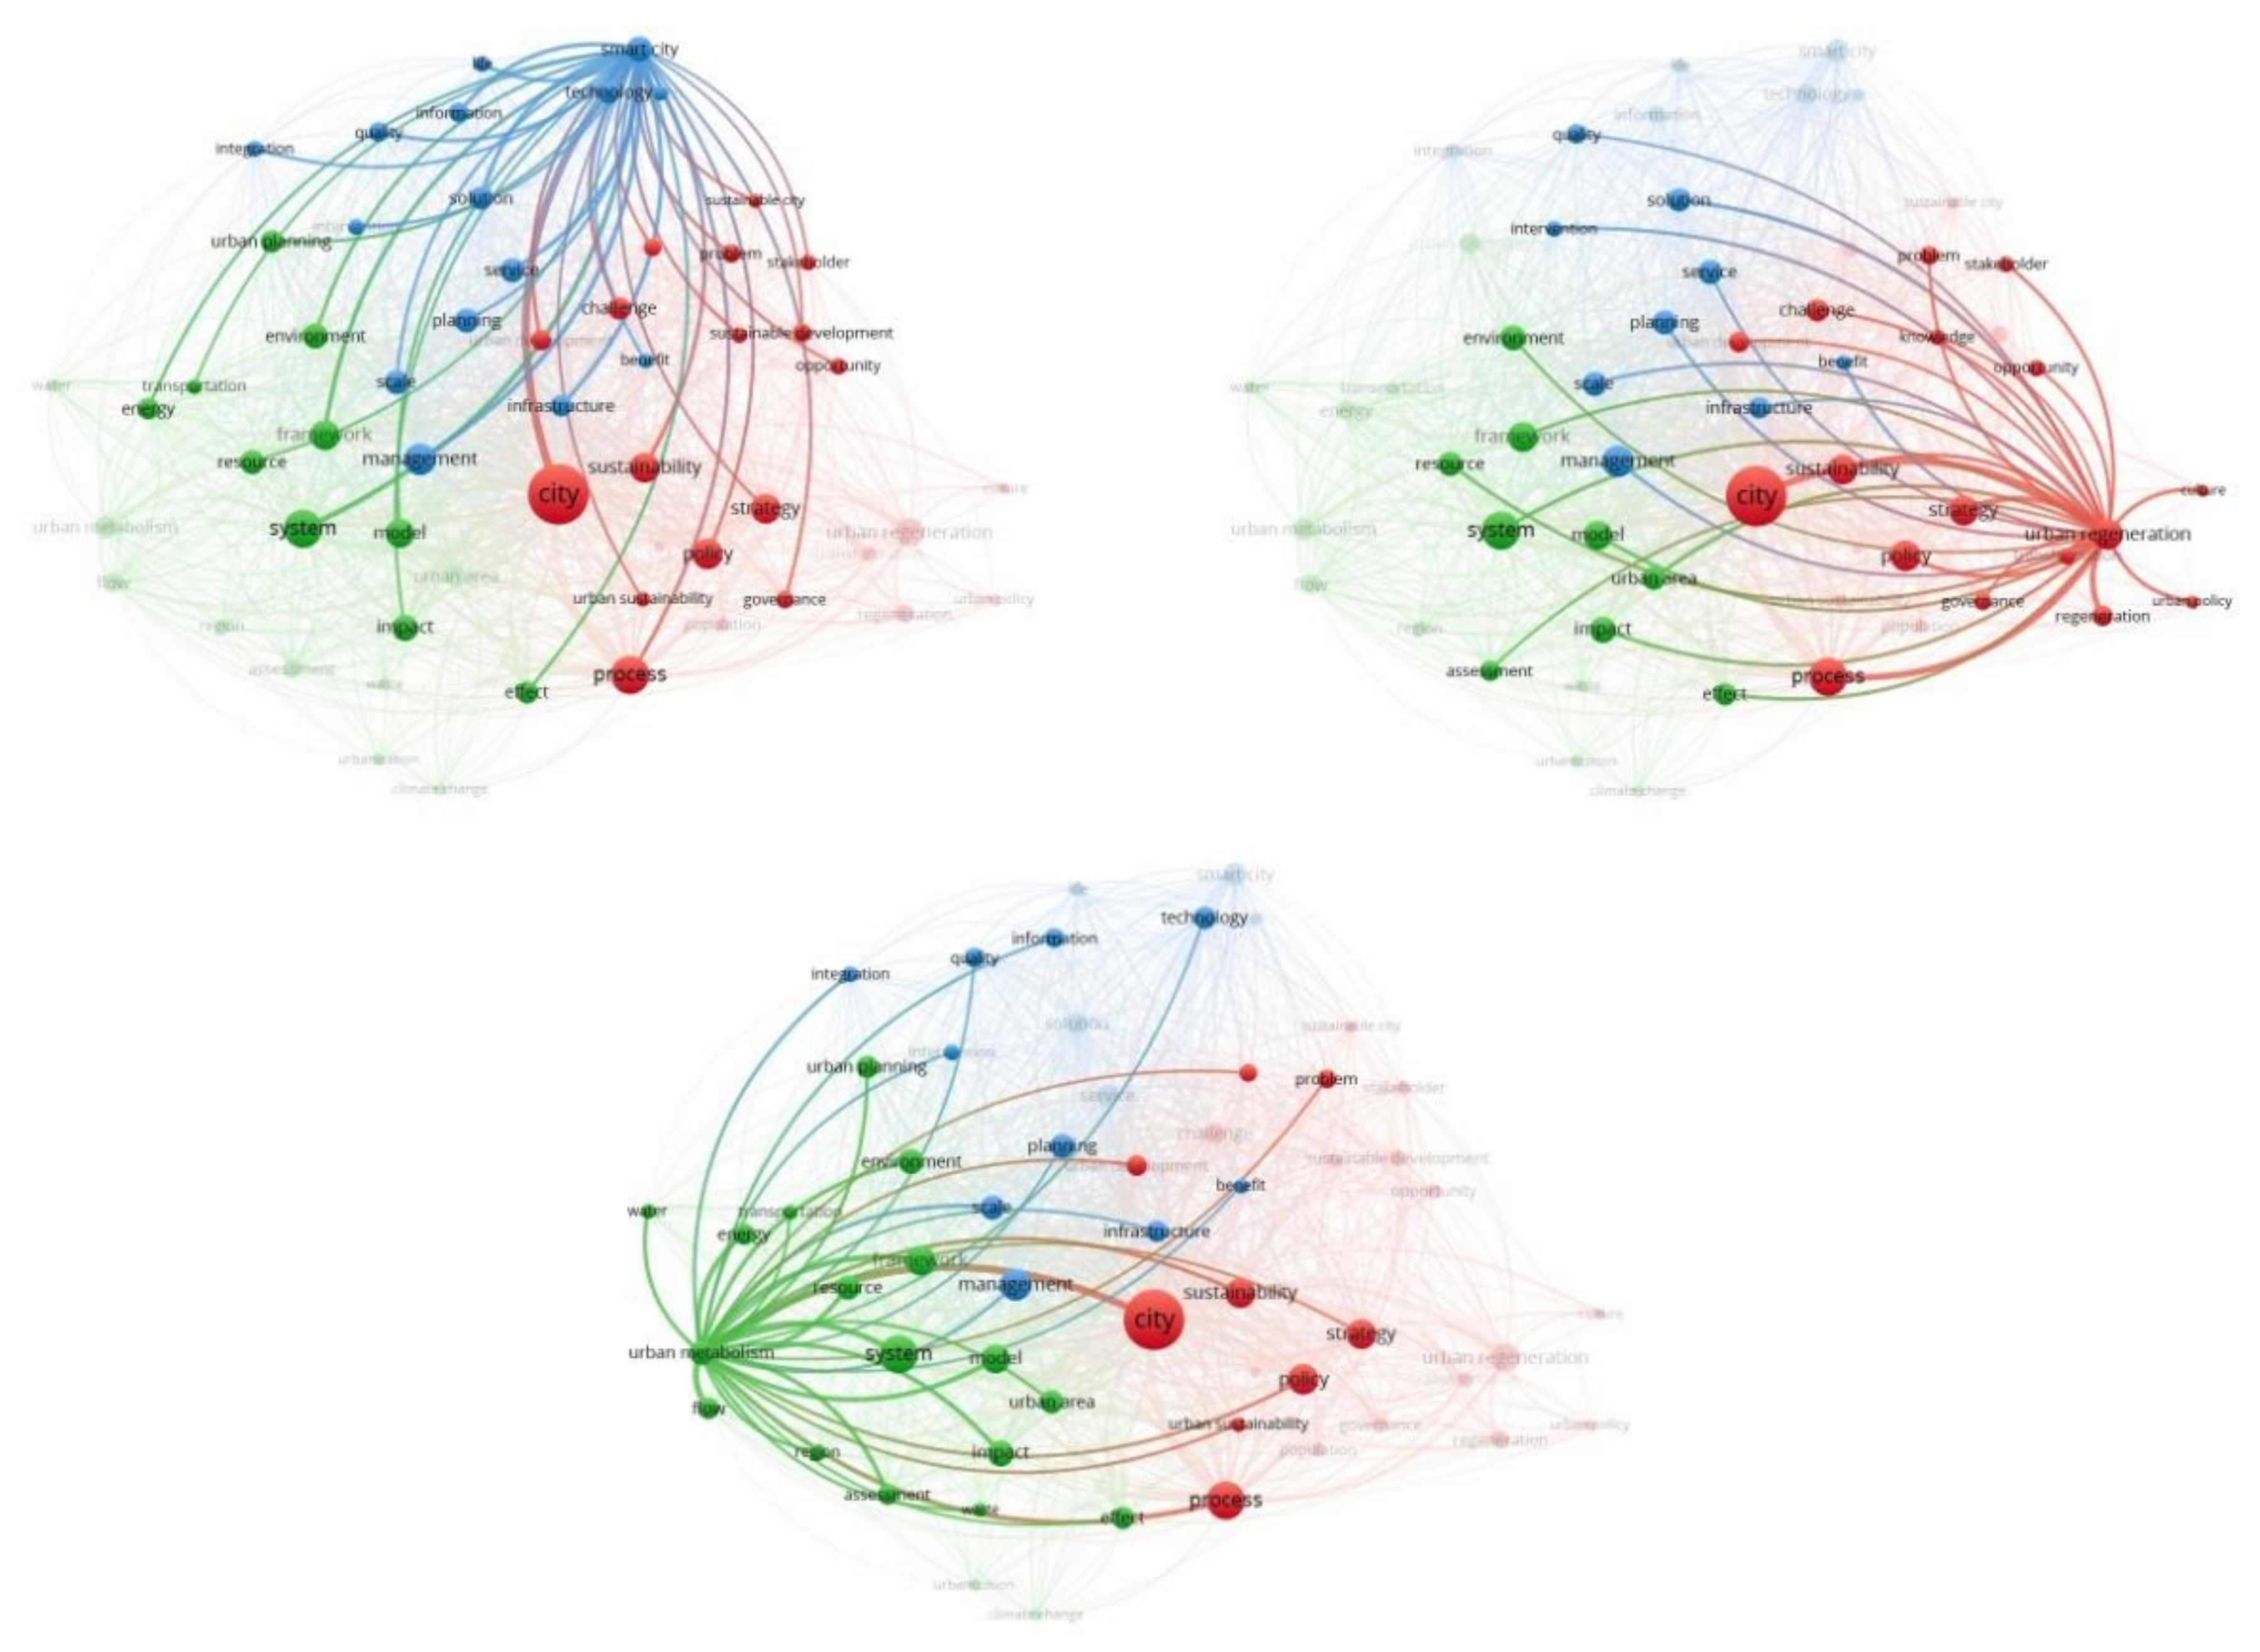
| CLUSTER 1 (23 Items) | CLUSTER 2 (19 Items) | CLUSTER 3 (15 Items) | |||
|---|---|---|---|---|---|
| Keywords | No. Occurrences | Keywords | No. Occurrences | Keywords | No. Occurrences |
| Challenge | 32 | Assessment | 27 | Benefit | 16 |
| City | 143 | Climate change | 14 | Citizen | 17 |
| Culture | 12 | Effect | 32 | Information | 25 |
| Governance | 22 | Energy | 30 | Infrastructure | 30 |
| Knowledge | 19 | Environment | 38 | Integration | 18 |
| Opportunity | 20 | Flow | 30 | Intervention | 18 |
| Policy | 50 | Framework | 48 | Life | 19 |
| Population | 18 | Impact | 39 | Management | 53 |
| Problem | 24 | Model | 47 | Planning | 35 |
| Process | 72 | Region | 21 | Quality | 25 |
| Regeneration | 27 | Resource | 35 | Scale | 36 |
| Stakeholder | 19 | System | 71 | Service | 36 |
| Strategy | 50 | Transportation | 16 | Smart city | 38 |
| Sustainability | 49 | Urban area | 34 | Solution | 33 |
| Sustainable city | 15 | Urban metabolism | 36 | Technology | 32 |
| Sustainable development | 23 | Urban planning | 31 | ||
| Sustainable urban development | 22 | Urbanization | 15 | ||
| Transformation | 21 | Waste | 15 | ||
| Urban development | 27 | Water | 17 | ||
| Urban environment | 14 | ||||
| Urban policy | 14 | ||||
| Urban regeneration | 52 | ||||
| Urban sustainability | 17 | ||||
| CLUSTER 1 (23 Items) | CLUSTER 2 (19 Items) | CLUSTER 3 (15 Items) | |||
|---|---|---|---|---|---|
| Keywords | Avg. Citations | Keywords | Avg. Citations | Keywords | Avg. Citations |
| Challenge | 44.22 | Assessment | 32.37 | Benefit | 26.88 |
| City | 46.08 | Climate change | 39.07 | Citizen | 89.65 |
| Culture | 26.17 | Effect | 35.66 | Information | 57.72 |
| Governance | 50.05 | Energy | 40.57 | Infrastructure | 54.53 |
| Knowledge | 100.11 | Environment | 39.16 | Integration | 31.89 |
| Opportunity | 48.35 | Flow | 43.23 | Intervention | 15.78 |
| Policy | 31.31 | Framework | 50.58 | Life | 45.42 |
| Population | 50.44 | Impact | 37.10 | Management | 46.09 |
| Problem | 54.46 | Model | 48.45 | Planning | 43.77 |
| Process | 38.00 | Region | 34.24 | Quality | 64.76 |
| Regeneration | 21.15 | Resource | 23.36 | Scale | 39.42 |
| Stakeholder | 42.84 | System | 45.38 | Service | 74.25 |
| Strategy | 26.54 | Transportation | 44.88 | Smart city | 91.68 |
| Sustainability | 40.37 | Urban area | 25.09 | Solution | 59.06 |
| Sustainable city | 32.40 | Urban metabolism | 34.92 | Technology | 88.41 |
| Sustainable development | 54.70 | Urban planning | 33.03 | ||
| Sustainable urban development | 48.77 | Urbanization | 30.13 | ||
| Transformation | 25.81 | Waste | 31.93 | ||
| Urban development | 37.44 | Water | 41.71 | ||
| Urban environment | 72.71 | ||||
| Urban policy | 46.79 | ||||
| Urban regeneration | 15.17 | ||||
| Urban sustainability | 19.76 | ||||
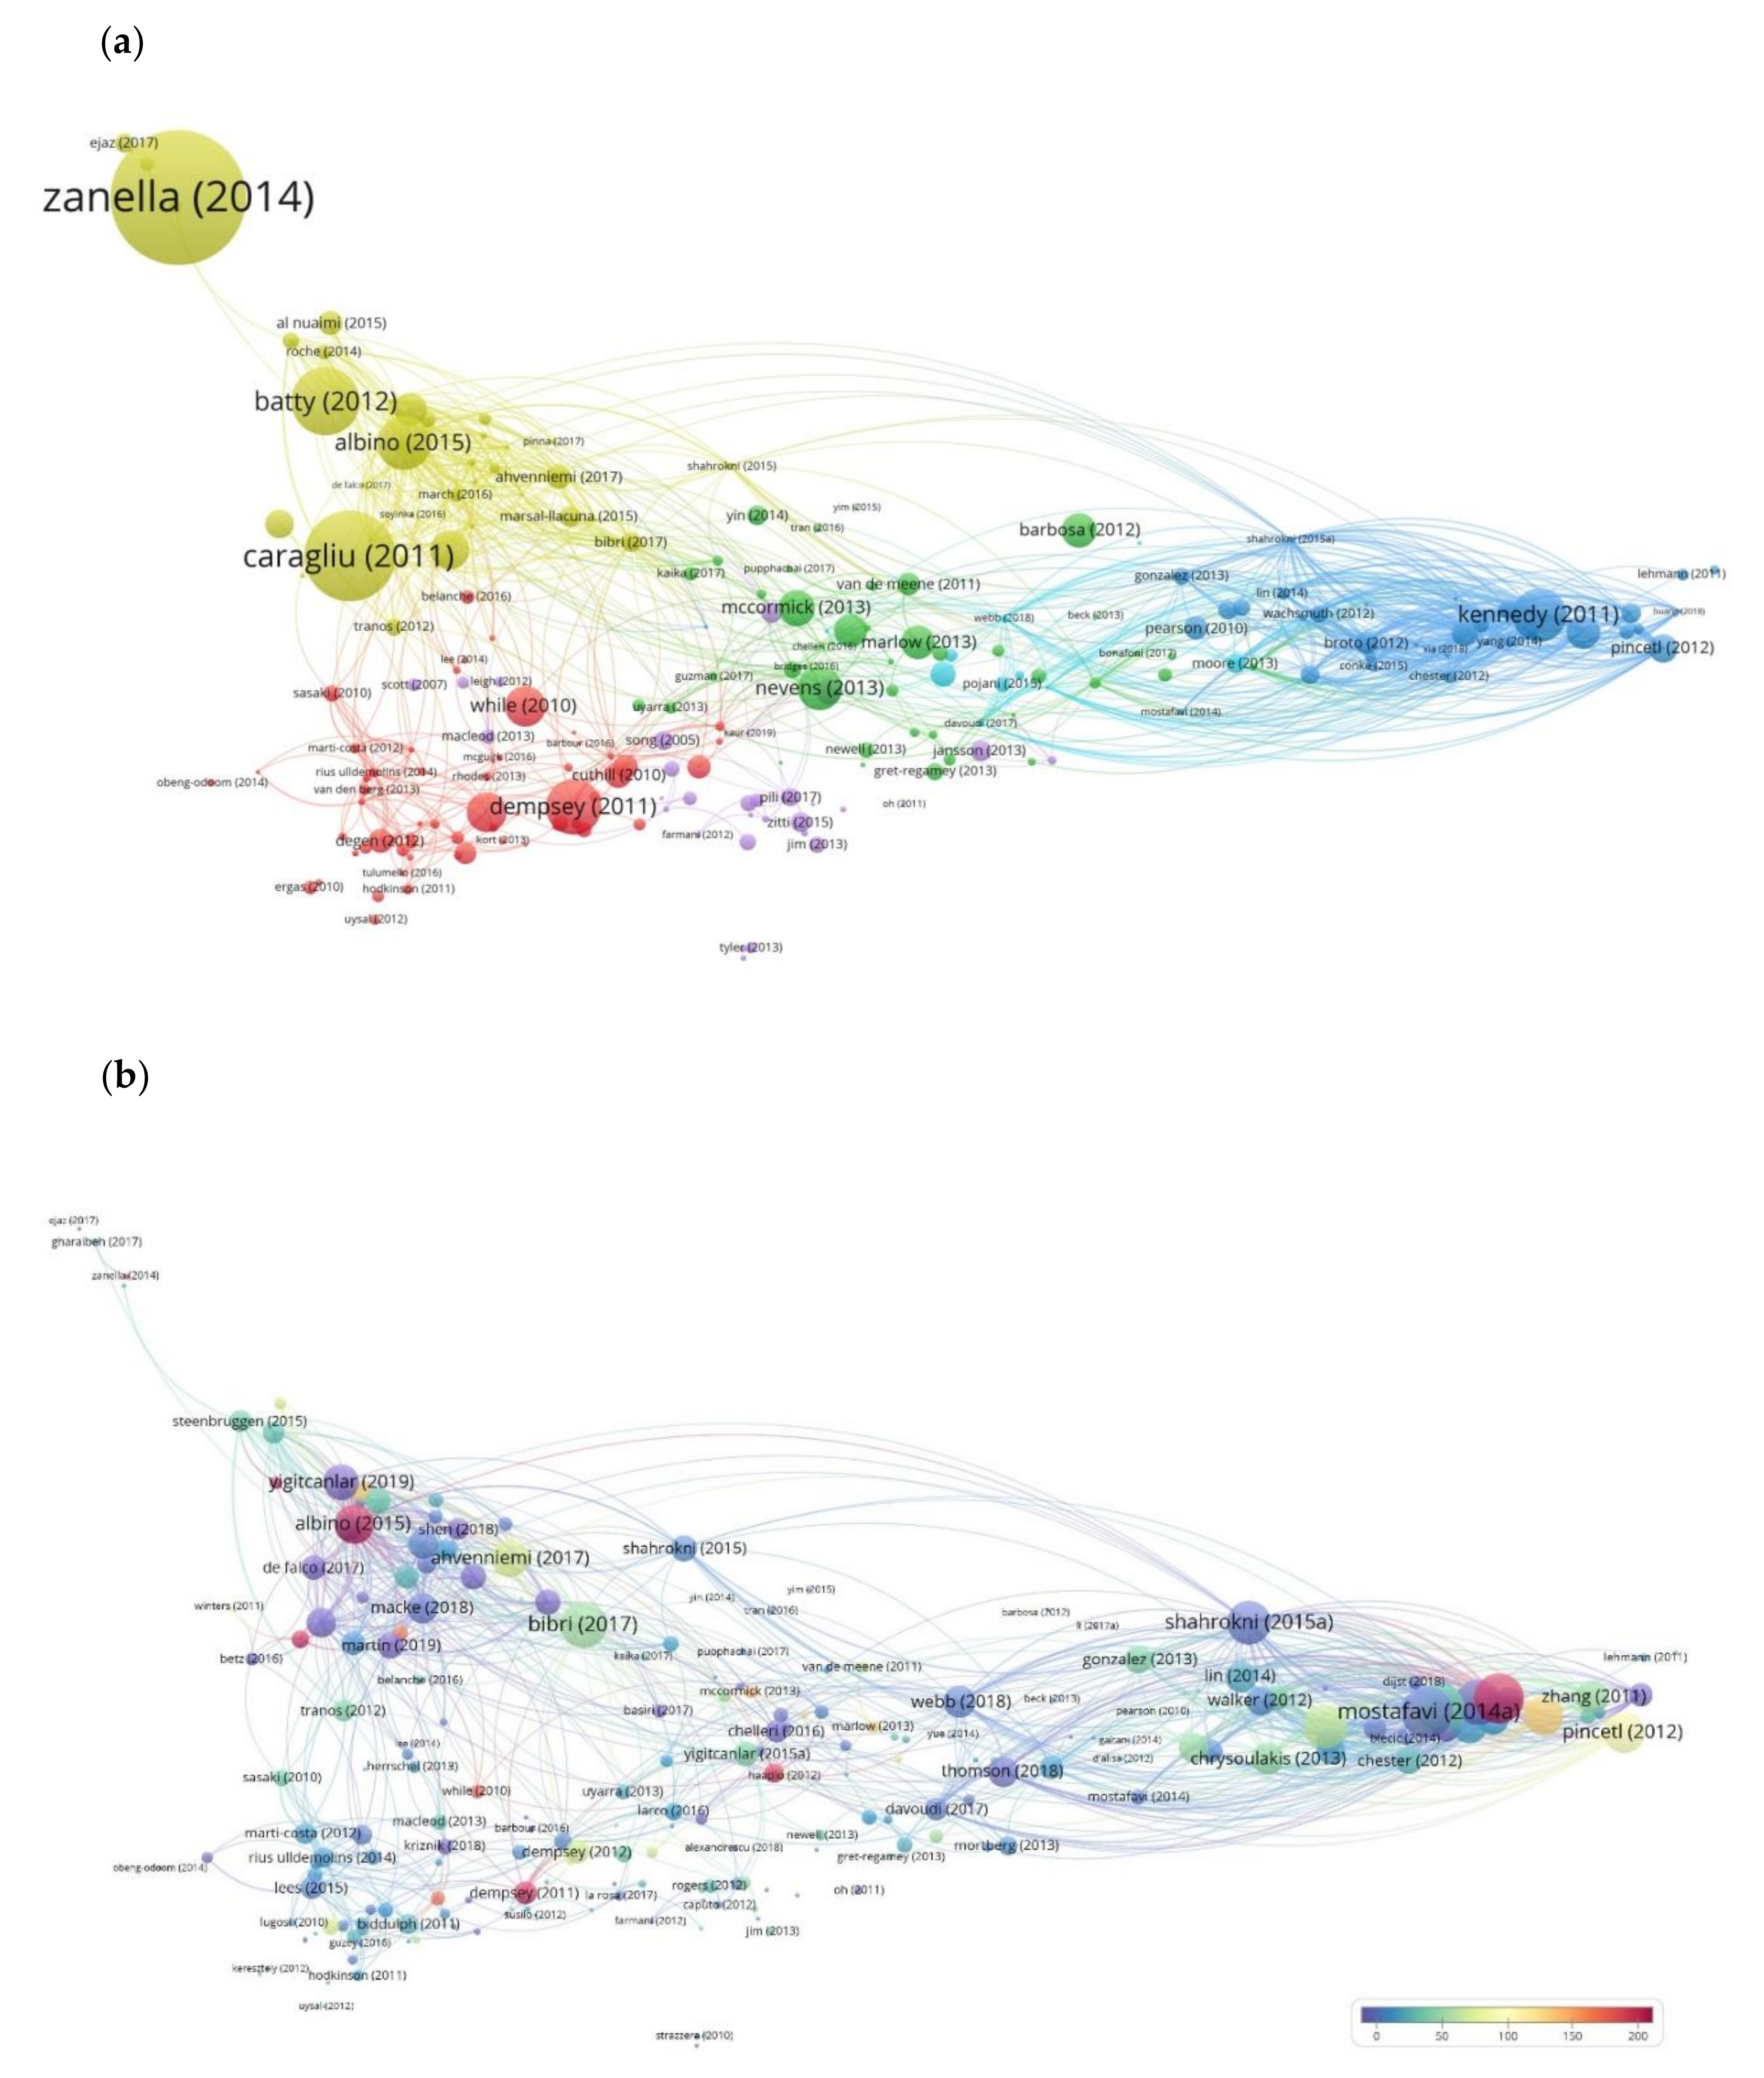
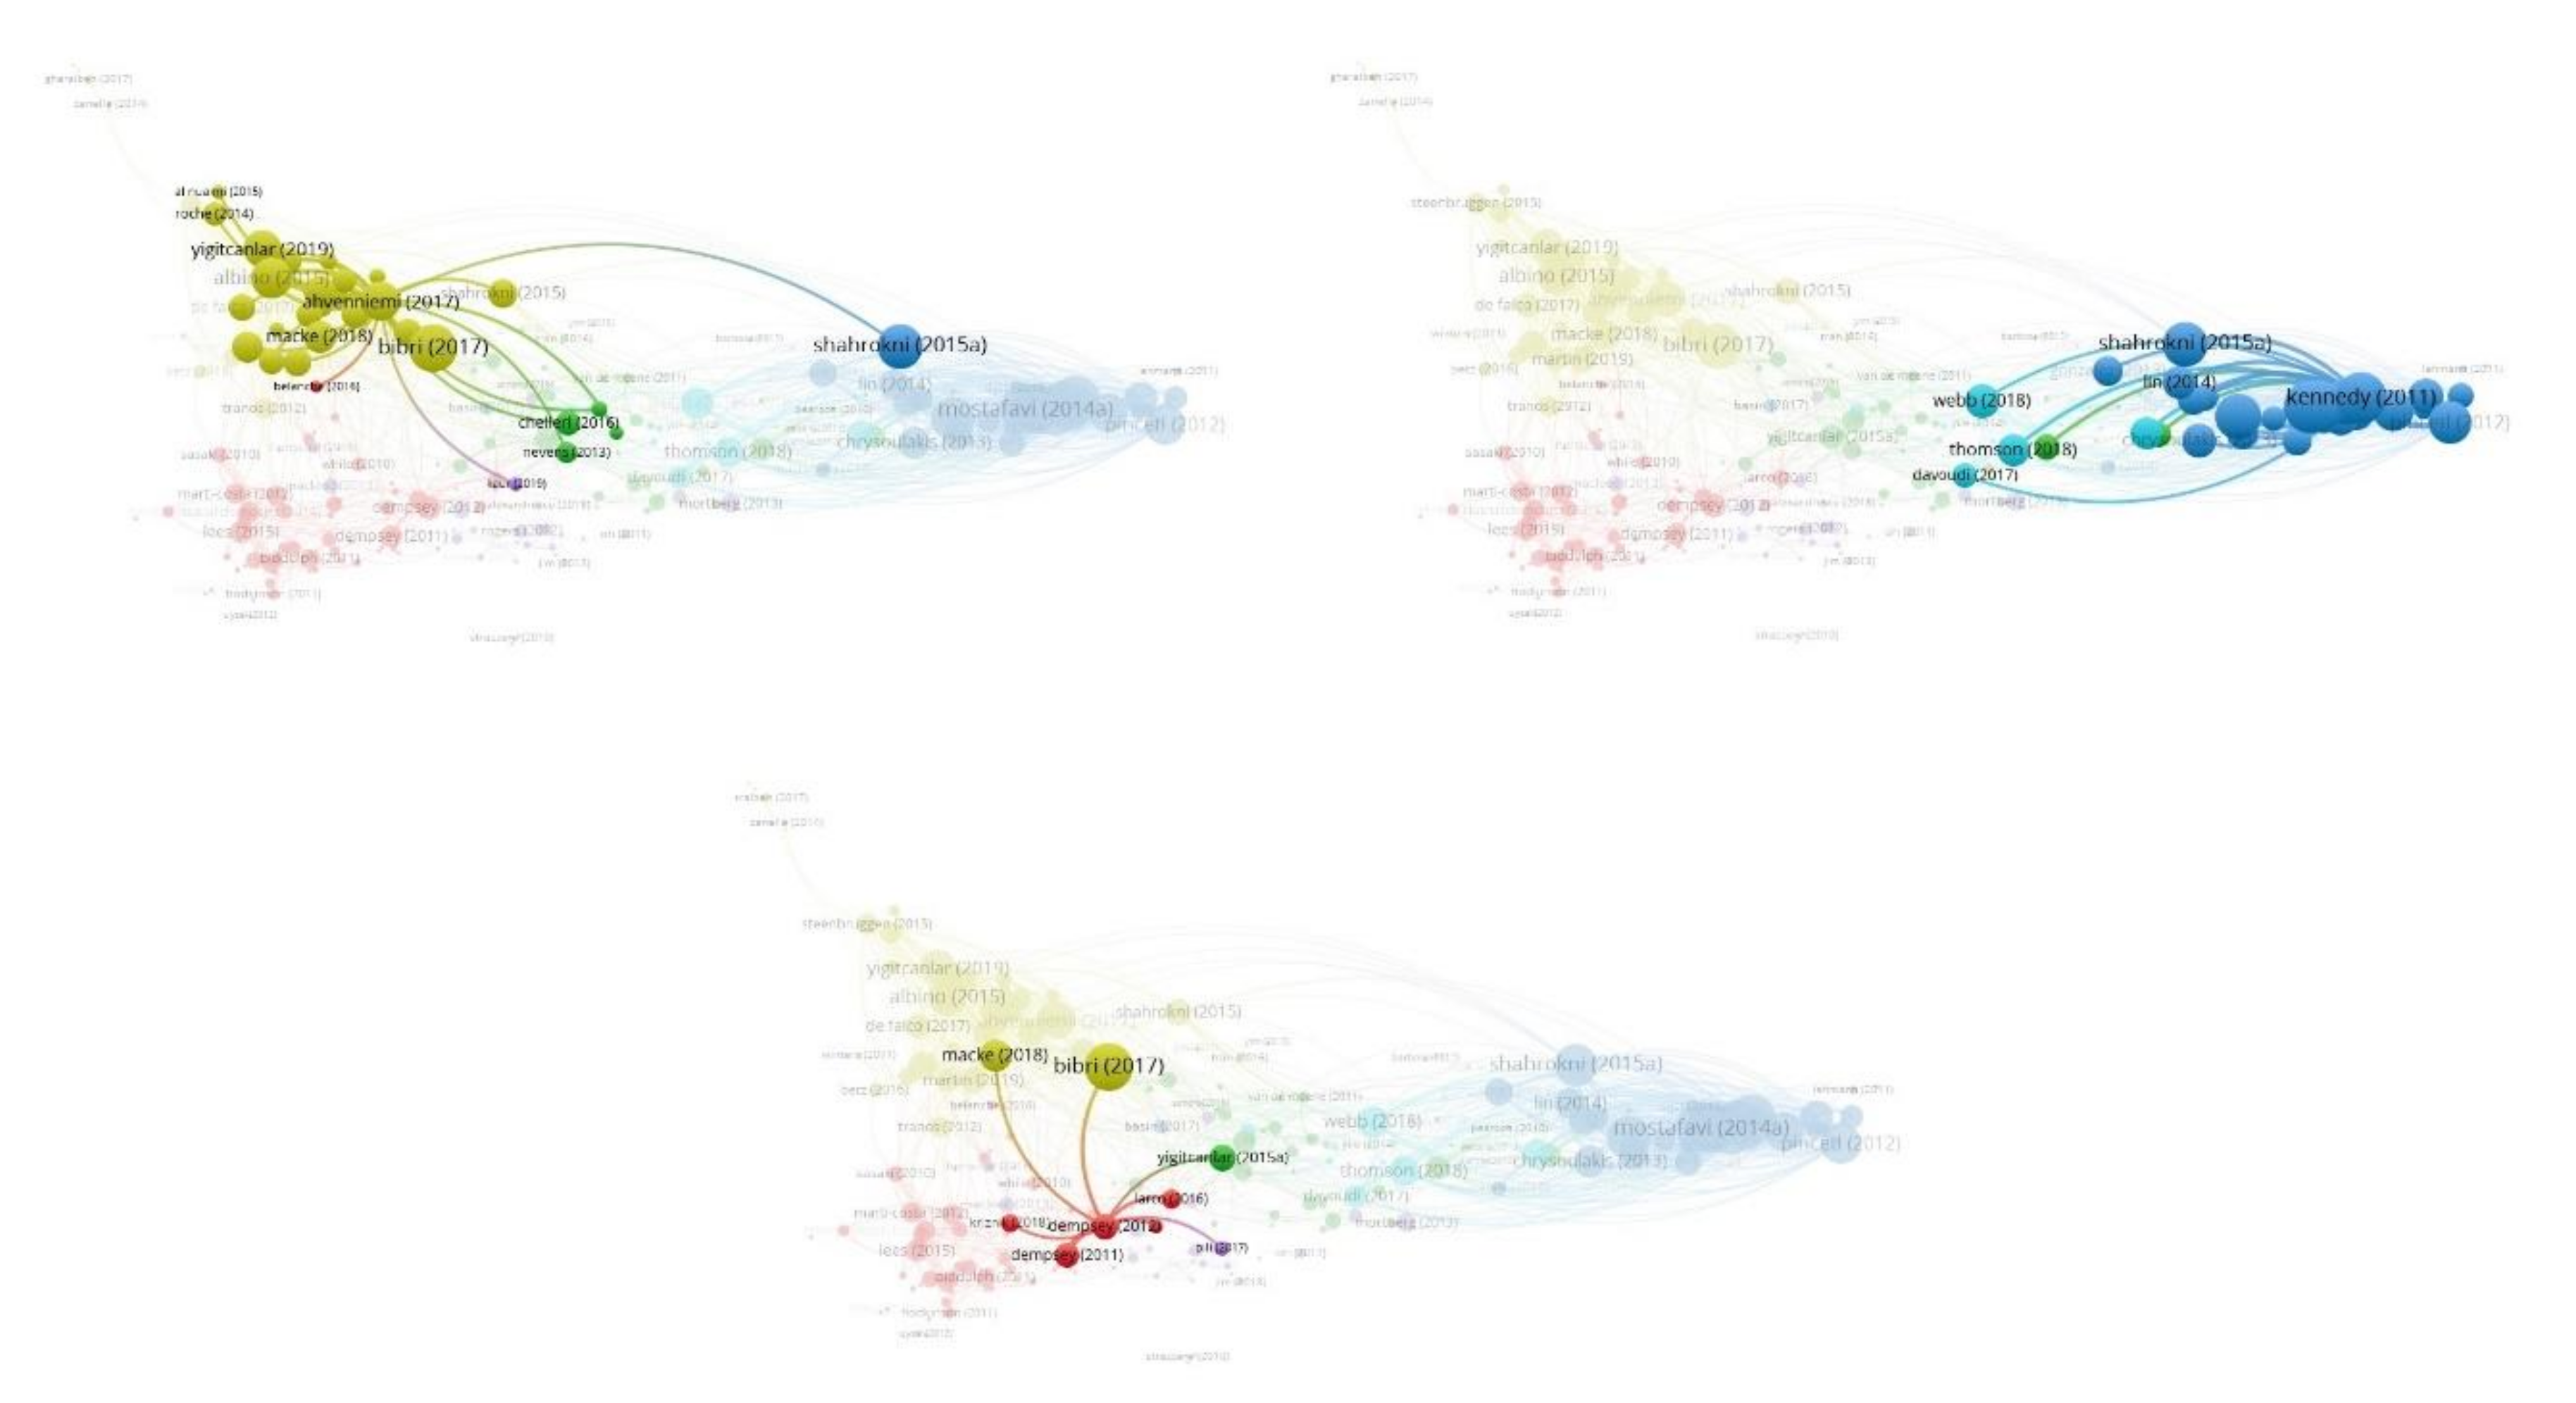
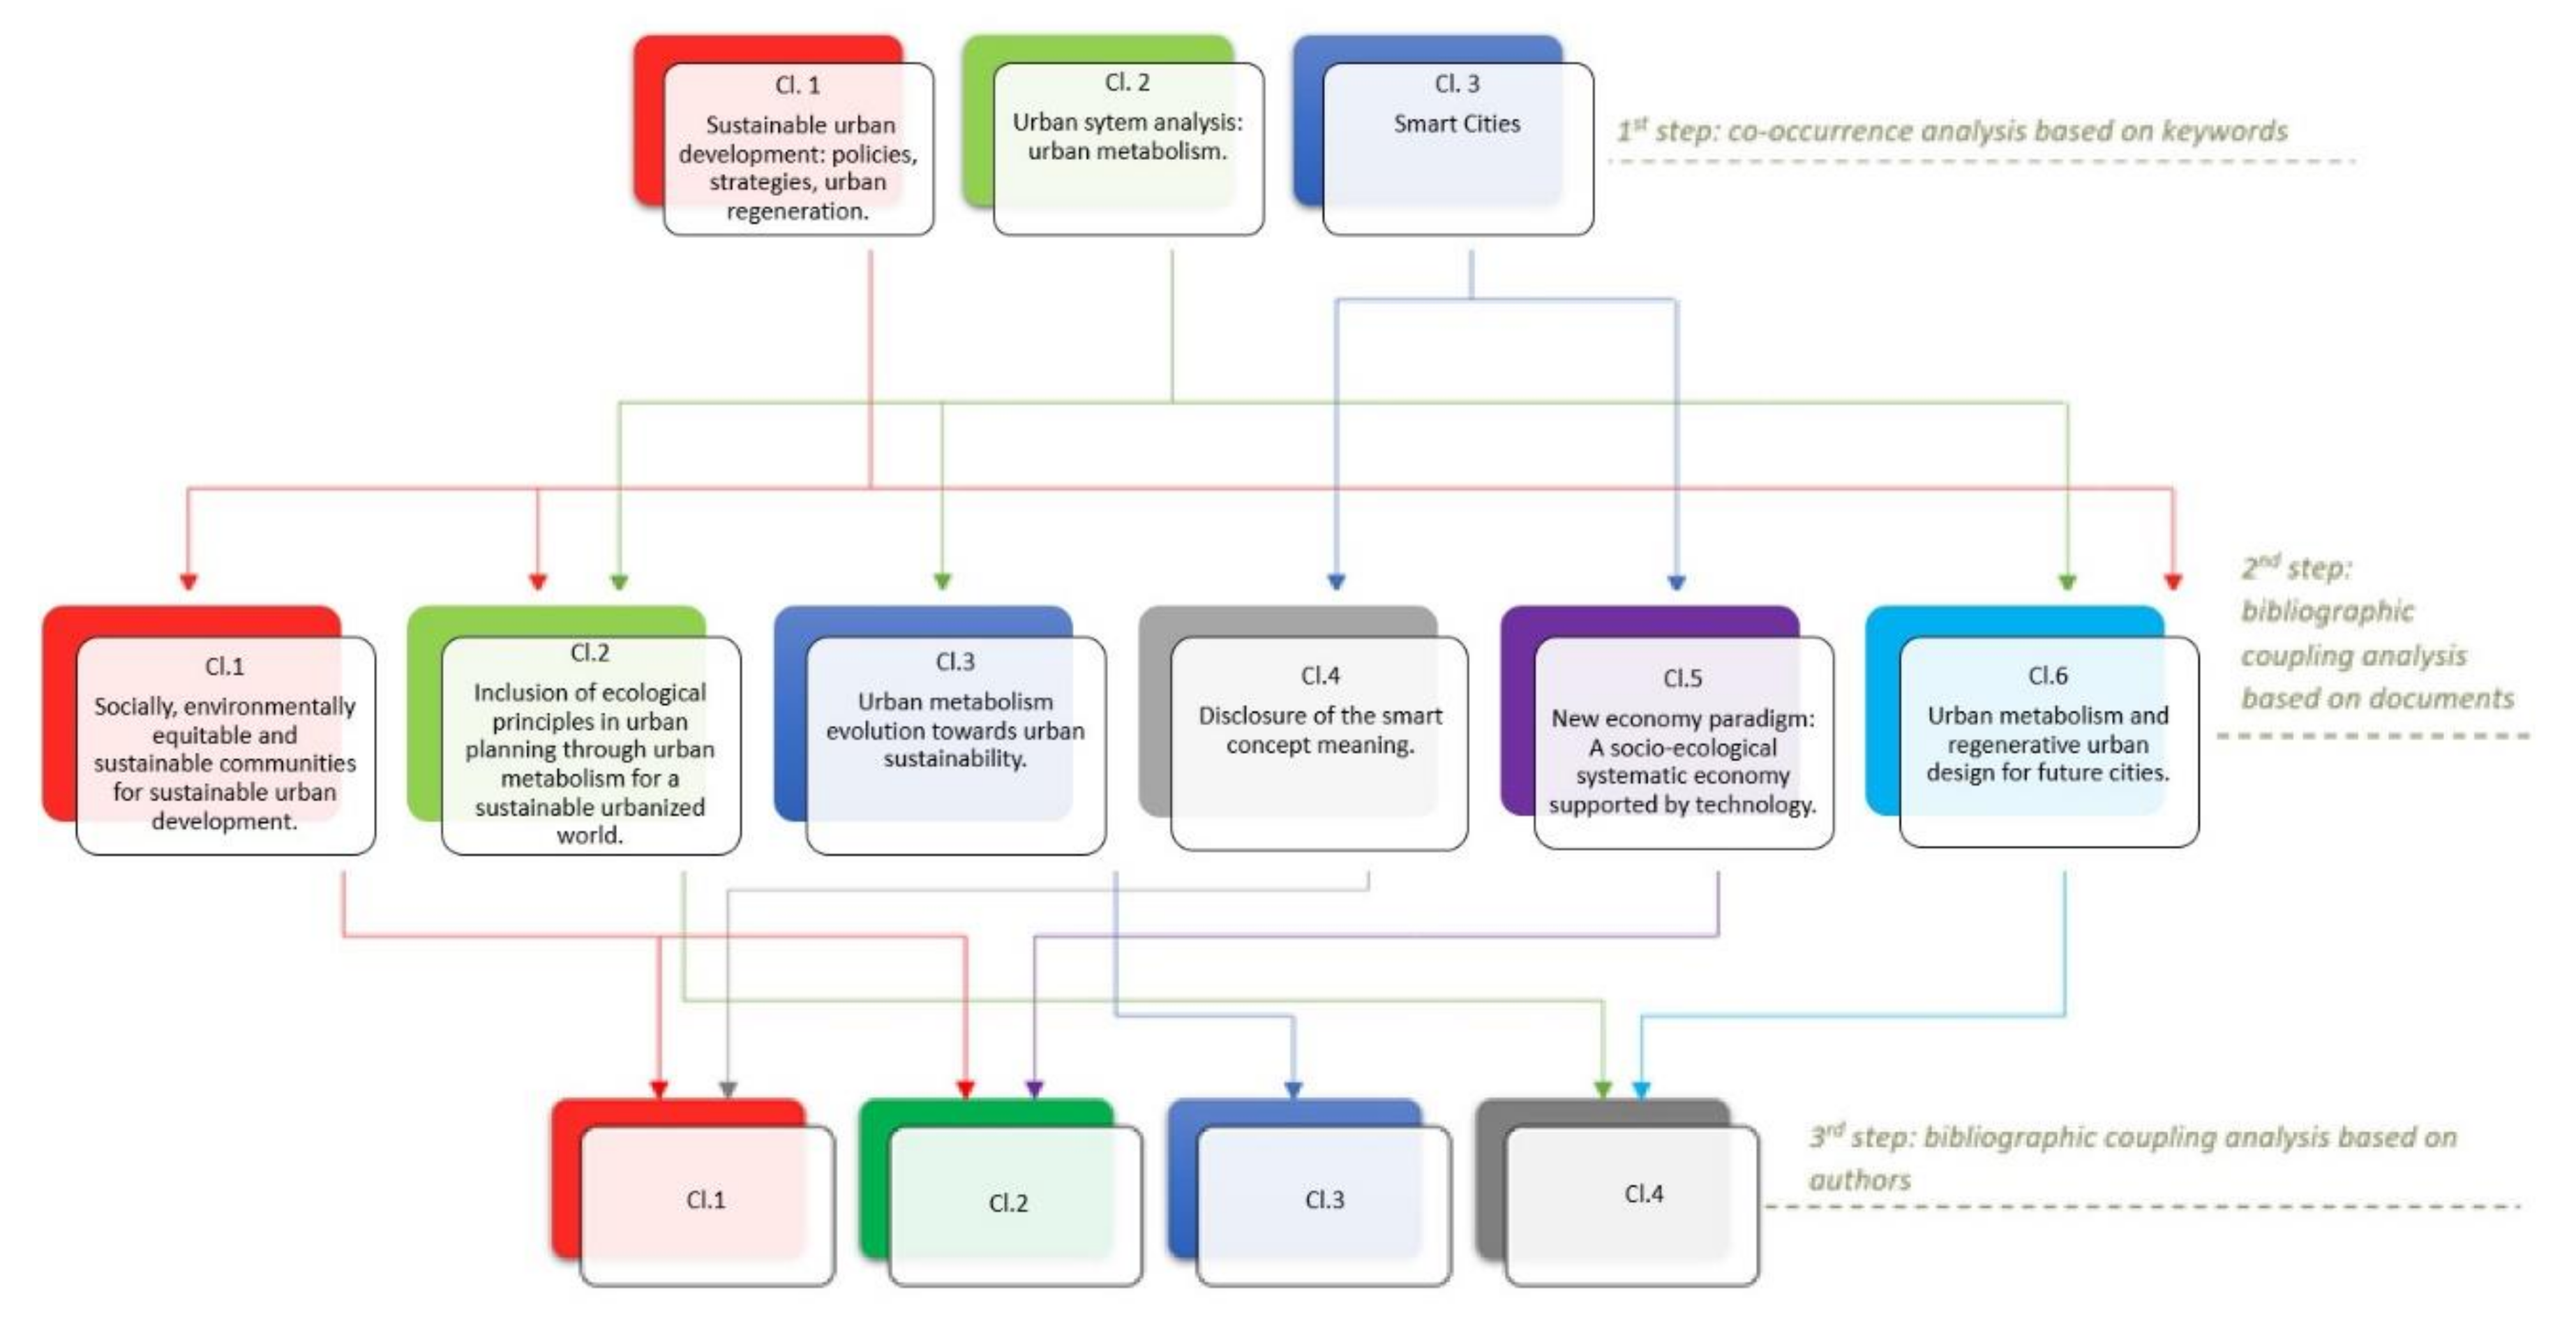
| No. Citations | No. Links | Total Link Strength | Important Publications | Main Topics of the Clusters | |
|---|---|---|---|---|---|
| CLUSTER 1 (60 Items) | 76 | 38 | 87 | Dempsey et al. (2012) | Socially, environmentally equitable, and sustainable communities for sustainable urban development. |
| 12 | 35 | 83 | Lees and Melhuish (2015) | ||
| 275 | 40 | 82 | Dempsey et al. (2011) | ||
| 23 | 32 | 72 | Martí-Costa and Miquel (2011) | ||
| 22 | 35 | 70 | Rius Ulldemolins (2014) | ||
| CLUSTER 2 (47 Items) | 3 | 56 | 93 | Yigitcanlar and Teriman (2015) | Inclusion of ecological principles in urban planning through urban metabolism for a sustainable urbanized world. |
| 26 | 44 | 87 | Romero-Lankao et al. (2014) | ||
| 14 | 41 | 81 | Lu et al. (2016) | ||
| 2 | 62 | 80 | Chelleri et al. (2016) | ||
| 191 | 36 | 62 | Nevens et al. (2013) | ||
| CLUSTER 3 (40 Items) | 7 | 53 | 282 | Mostafavi et al. (2014a) | Urban metabolism evolution towards urban sustainability. |
| 258 | 46 | 266 | Kennedy at el. (2011) | ||
| 42 | 52 | 252 | Goldstein et al. (2013) | ||
| 1 | 50 | 232 | Zhang et al. (2018) | ||
| 70 | 55 | 222 | Broto et al. (2012) | ||
| CLUSTER 4 (40 Items) | 58 | 78 | 242 | Bibri and Krogstie (2017) | Disclosure of the smart concept meaning. |
| 260 | 52 | 188 | Albino et al. (2015) | ||
| 77 | 55 | 177 | Ahvenniemi et al. (2017) | ||
| 0 | 46 | 162 | Yigitcanlar et al. (2019) | ||
| 8 | 56 | 127 | Macke et al. (2018) | ||
| CLUSTER 5 (31 Items) | 17 | 48 | 62 | Mortberg et al. (2013) | New economy paradigm: A socio-ecological systematic economy supported by technology. |
| 40 | 44 | 52 | Lombardi et al. (2011) | ||
| 37 | 32 | 49 | MacLeod (2013) | ||
| 60 | 31 | 39 | Jansson (2013) | ||
| 60 | 19 | 36 | Yigicanlar and Lee (2014) | ||
| CLUSTER 6 (9 Items) | 11 | 73 | 138 | Webb et al. (2018) | Urban metabolism and regenerative urban design for future cities. |
| 4 | 64 | 127 | Thomson and Newman (2018) | ||
| 56 | 51 | 124 | Moore et al. (2013) | ||
| 10 | 54 | 82 | Davoudi and Sturzaker (2017) | ||
| 6 | 40 | 45 | Van Timmeren et al. (2012) |
| Link Strength | Most Connected Authors | |
|---|---|---|
| CLUSTER 1(17 Items) | 151.35 | Tranos Emmanouil, Nijkamp Peter |
| 118.58 | Evans James, Karvonen Andrew | |
| 99.80 | De Falco Stefano, Angelidou Margarita | |
| 66.86 | Mosannenzadeh Farnaz, Bisello Adriano, Vettorato Daniele | |
| 40.91 | Lazarevic David, Brandt Nils, Shahrokni Hossein | |
| CLUSTER 2 (14 Items) | 118.20 | Carlucci Margherita, Salvatti Luca |
| 90.77 | Lombardi Rachel, Rogers Chris D. F. | |
| 88.53 | Pares Marc, Marti-Costa Marc | |
| 40.23 | Porter Libby, Rogers Chris D. F. | |
| 39.90 | Porter Libby, Lombardi Rachel | |
| CLUSTER 3 (13 Items) | 107.80 | Chester Mikhail, Pincetl Stephanie |
| 99.64 | Farzinmoghadam Mohamad, Mostafavi Nariman | |
| 77.82 | Zhang Yan, Liu Gengyuan | |
| 61.44 | Lopes Myriam, Chrysoulakis Nektarios, Gonzalez Ainhoa | |
| 32.60 | Spano Donatella, Lopes Myriam, Gonzalez Ainhoa, Chrysoulakis Nektarios | |
| CLUSTER 4 (40 Items) | 142.43 | Thomson Giles, Newman Peter |
| 44.36 | Newton Peter, Thomson Giles | |
| 44.36 | Newton Peter, Newman Peter | |
| 43.61 | Moglia Mangus, Thomson Giles | |
| 43.61 | Moglia Mangus, Newman Peter |
| No. Cit. | No. Links | Important Cited References | |
|---|---|---|---|
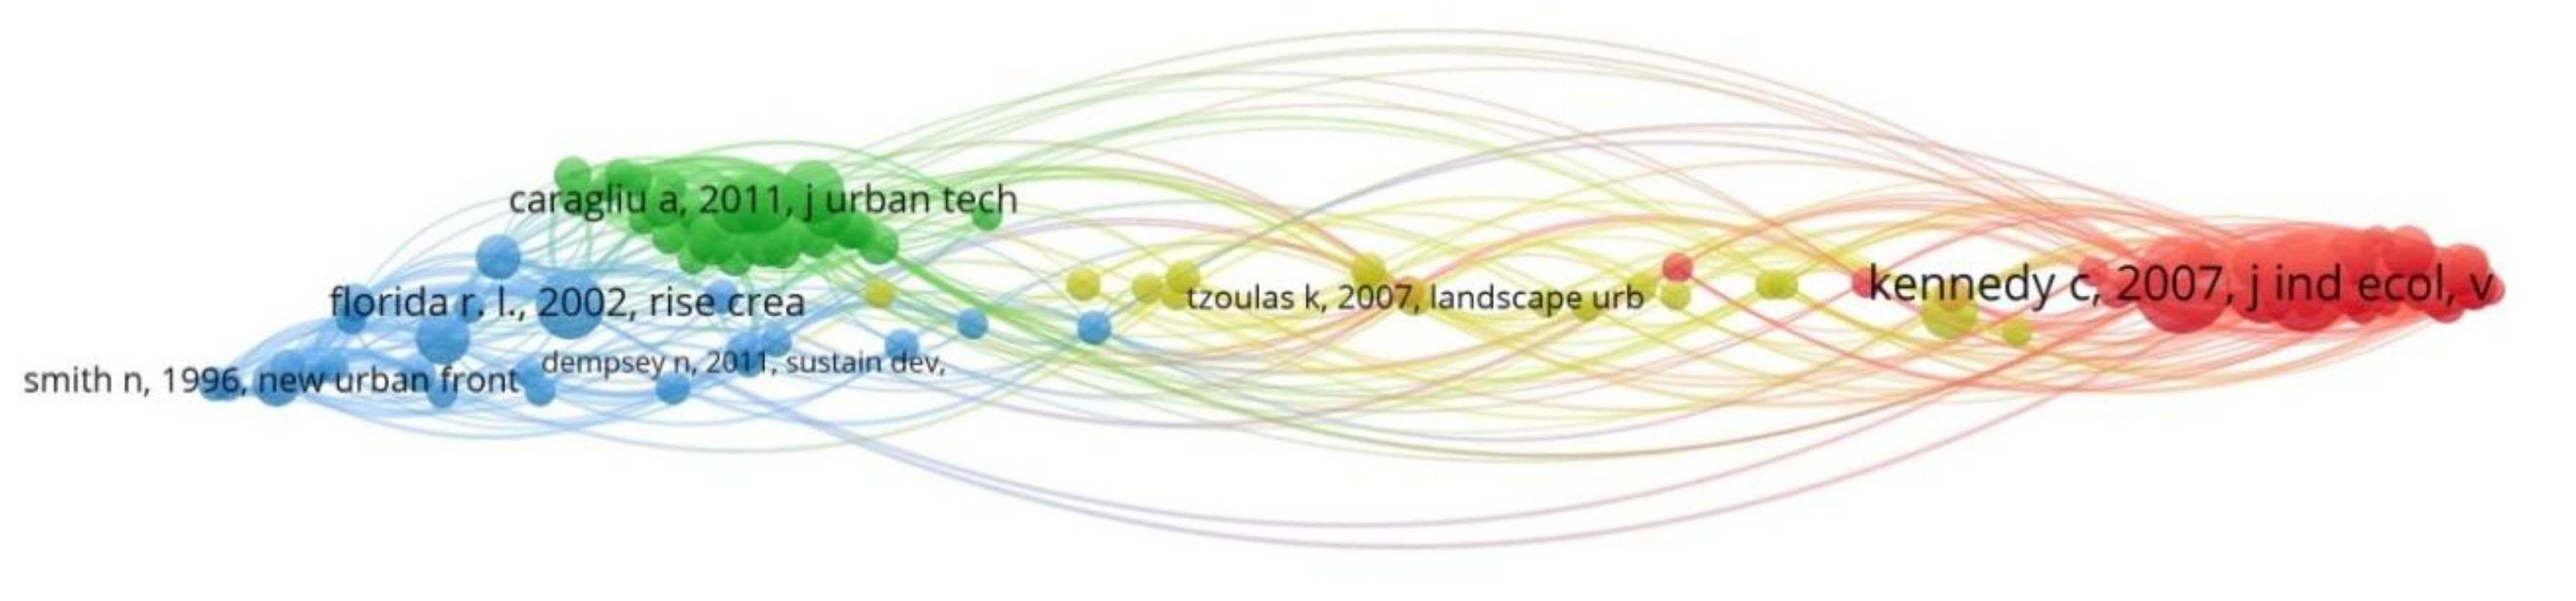
| CLUSTER 1 (43 Items) | 29 | 63 | Kennedy, C.A., Cuddihy, J., Engel Yan, J., 2007. The changing metabolism of cities. Journal of Industrial Ecology 2007 (11), 43-59 |
| 26 | 53 | Wolman, A., 1965. The metabolism of cities. Scientific American 213 (3), 179-190 | |
| 20 | 55 | Newman, P.W.G., Birrell, R., Holmes, D., Mathers, C., Newton, P., Oakley, G., O’Connor, A., Walker, B., Spessa, A., Tait, D., 1996. Human settlements. In: Australian State of the Environment Report. Department of Environment, Sport and Territories, Canberra, Australia. | |
| 18 | 51 | Kennedy, C., P. Pincetl, and P. Bunje. 2011. The study of urban metabolism and its applications to urban planning and design. Environmental Pollution 159(8–9): 1965–1973. | |
| 12 | 46 | Niza, S., L. Rosado, and P. Ferrao. 2009. Urban metabolism: Methodological advances in urban material flow accounting based on the Lisbon case. Journal of Industrial Ecology 13(3): 384–405. | |
| CLUSTER 2 (34 Items) | 15 | 58 | Hollands, R.G., 2008. “Will the Real Smart City Please Stand Up?” City: Analysis of Urban Trends, Culture, Theory, Policy, Action 12: 3, 303–320. |
| 15 | 57 | Caragliu, A., Del Bo, C., & Nijkamp, P. (2009). Smart cities in europe, serie researchmemoranda 0048. VU University Amsterdam, Faculty of Economics, BusinessAdministration and Econometrics. | |
| 14 | 51 | Giffinger, R., Fertner, Ch, Kramar, H., Kalasek, R., Pichler-Milanovic, N., et al. (2007). Smart cities-ranking of European medium-sized cities. Centre of RegionalScience (SRF), Vienna University of Technology. | |
| 13 | 49 | Vanolo, A. (2014). Smartmentality: The smart city as a disciplinary strategy. Urban Studies, 51, 883–898. | |
| 11 | 46 | Neirotti, P., De Marco, A., Cagliano, A. C., Mangano, G., & Scorrano, F. (2014). Current trends in smart city initiatives: Some stylised facts. Cities, 38, 25–36. | |
| CLUSTER 3 (24 Items) | 17 | 33 | Florida, R. (2002) The rise of the creative class. Basic Books, New York. |
| 12 | 26 | Harvey D (1989) From managerialism to entrepreneurialism: The transformation in urban governance in late capitalism. Geografiska Annaler: Series B, Human Geography 71(1): 3–17. | |
| 10 | 13 | Smith, Neil (1996). The new urban frontier. Gentrification and the revanchist city. London: Routledge. | |
| 9 | 35 | Florida, R (2005). Cities and the Creative Class. Routledge, New York. | |
| 7 | 17 | Peck, J (2005) Struggling with the creative class. International Journal of Regional Research 29(4), 740–770. | |
| CLUSTER 4 (16 Items) | 13 | 35 | Grimm, N. B., Faeth, S. H., Golubiewski, N. E., Redman, C. L., Wu, J., Bai, X., et al. (2008). Global change and the ecology of cities. Science, 756–760. |
| 7 | 16 | Tzoulas, K., Korpela, K., Venn, S., Yli-Pelkonen, V., Kaźmierczak, A., Niemela, J., & James, P. (2007). Promoting ecosystem and human health in urban areas using Green Infrastructure: A literature review. Landscape and Urban Planning, 81(3), 167–178. | |
| 6 | 37 | Campbell, S. (1996). Green cities, growing cities, just cities? Urban planning and the contradiction of sustainable development. Journal of the American Planning Association, 62, 296–312. |
© 2020 by the authors. Licensee MDPI, Basel, Switzerland. This article is an open access article distributed under the terms and conditions of the Creative Commons Attribution (CC BY) license (http://creativecommons.org/licenses/by/4.0/).
Share and Cite
Peponi, A.; Morgado, P. Smart and Regenerative Urban Growth: A Literature Network Analysis. Int. J. Environ. Res. Public Health 2020, 17, 2463. https://doi.org/10.3390/ijerph17072463
Peponi A, Morgado P. Smart and Regenerative Urban Growth: A Literature Network Analysis. International Journal of Environmental Research and Public Health. 2020; 17(7):2463. https://doi.org/10.3390/ijerph17072463
Chicago/Turabian StylePeponi, Angeliki, and Paulo Morgado. 2020. "Smart and Regenerative Urban Growth: A Literature Network Analysis" International Journal of Environmental Research and Public Health 17, no. 7: 2463. https://doi.org/10.3390/ijerph17072463