Cultural Differences in Tweeting about Drinking Across the US

 , ,
, ,
Abstract
:1. Introduction
2. Materials and Methods
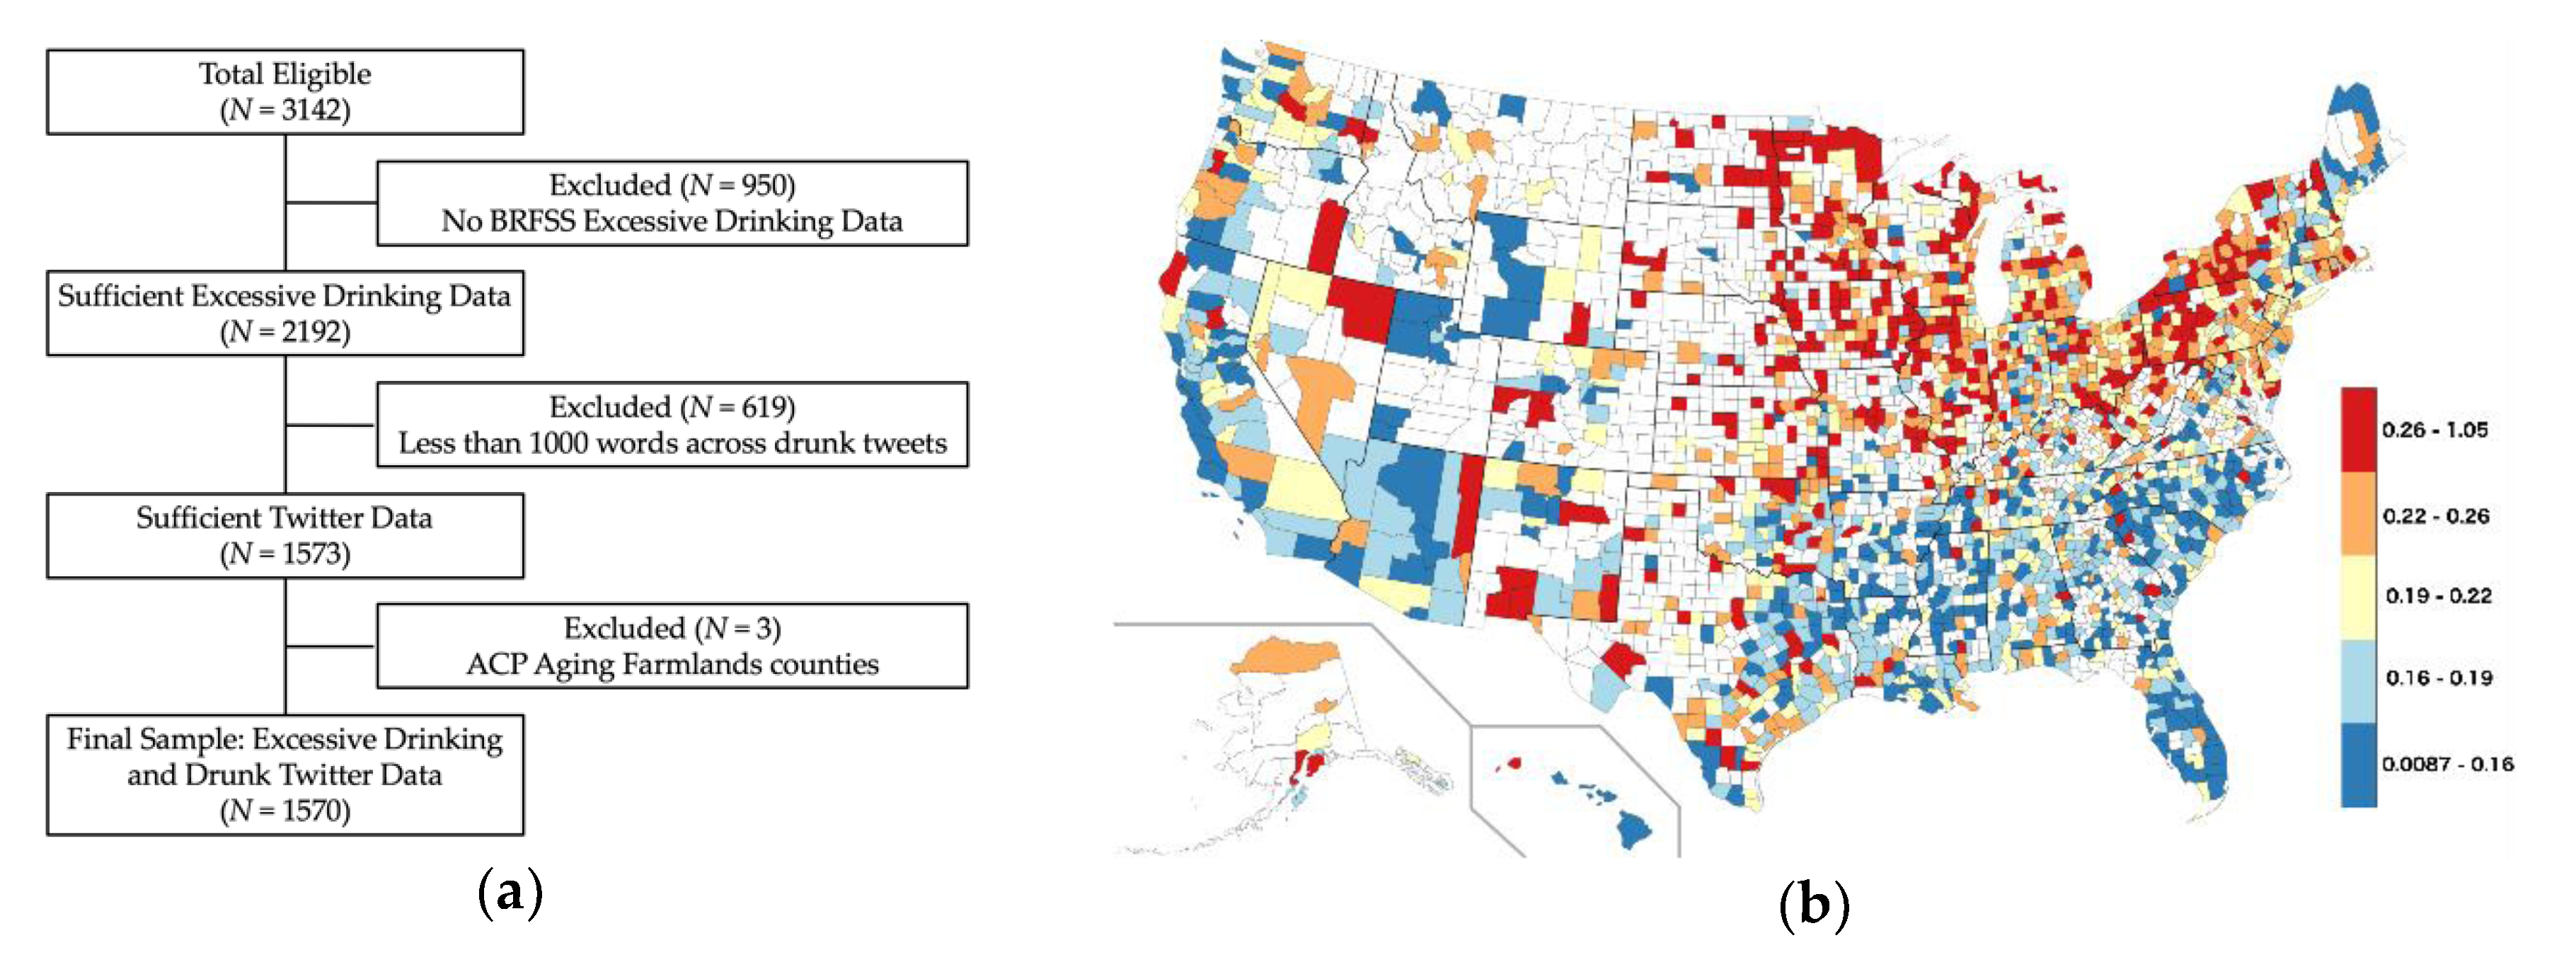
2.1. Data
2.1.1. Excessive Alcohol Consumption Data
2.1.2. Drinking Keyword Filtering
2.1.3. Twitter Data
2.1.4. American Communities Project
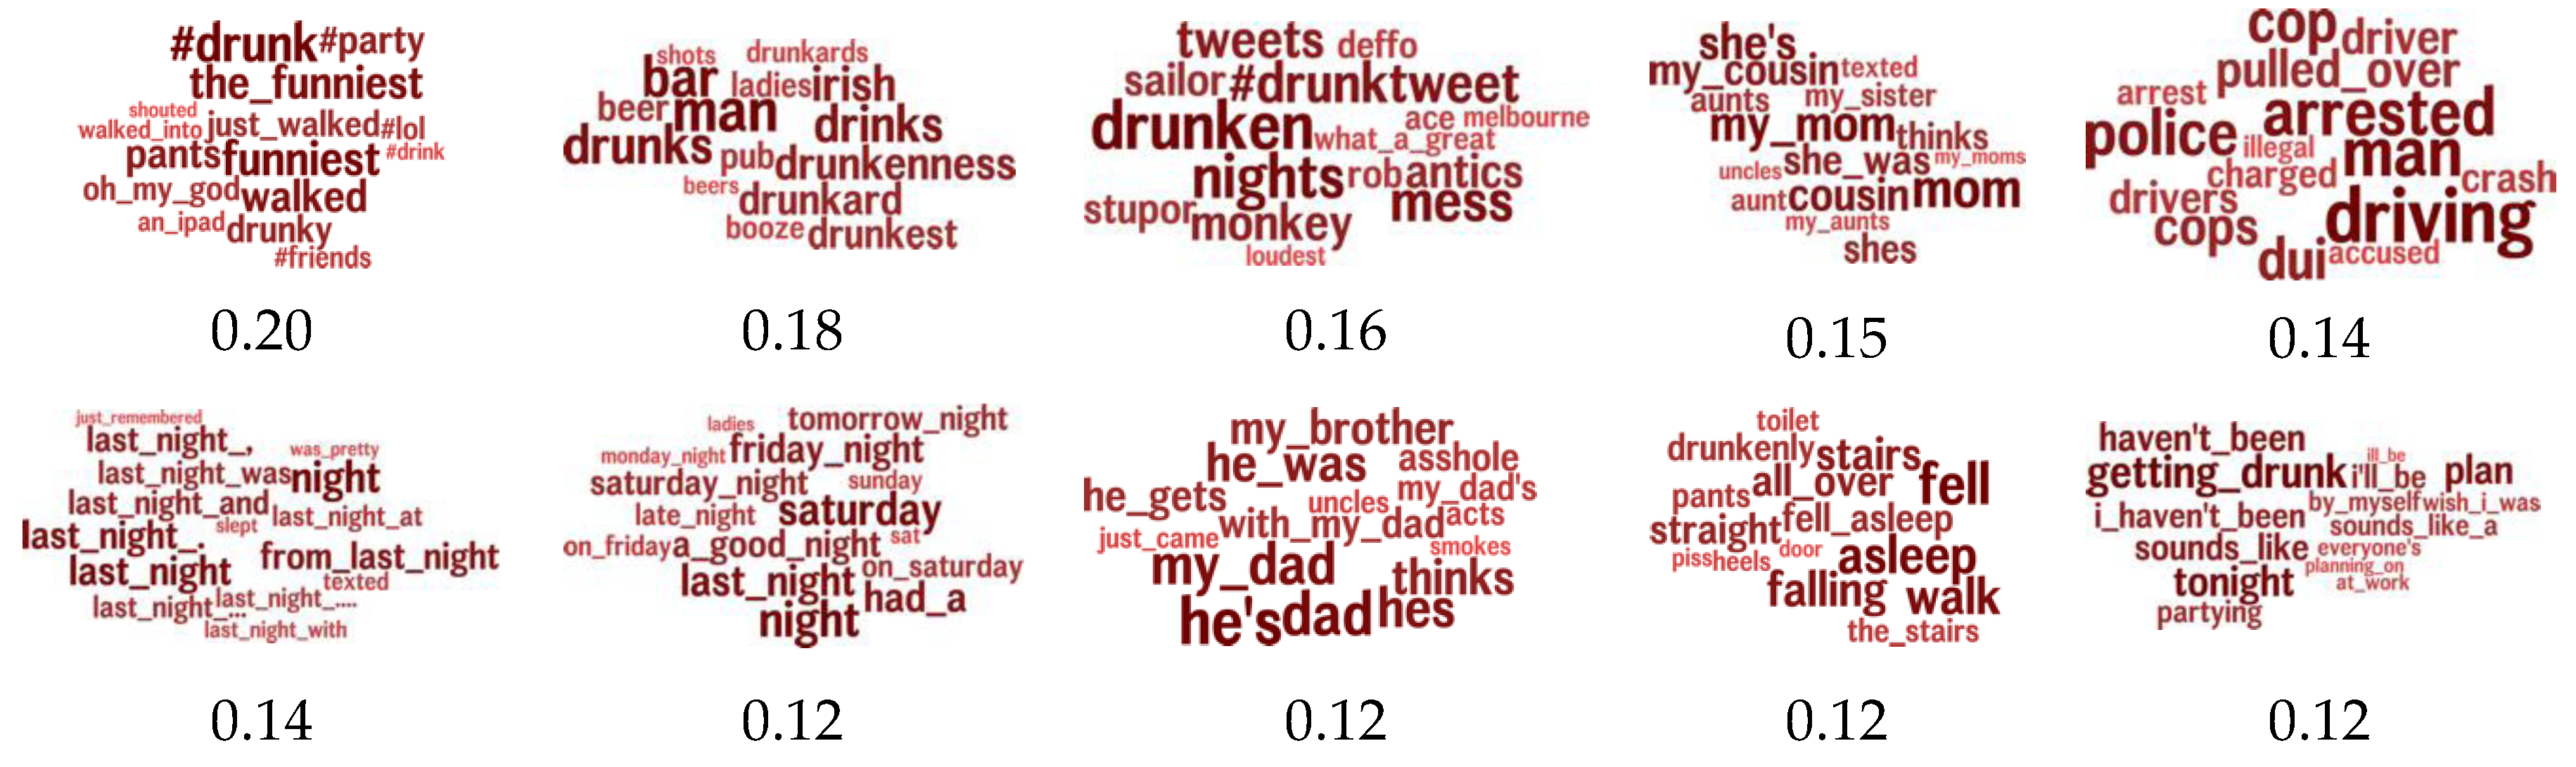
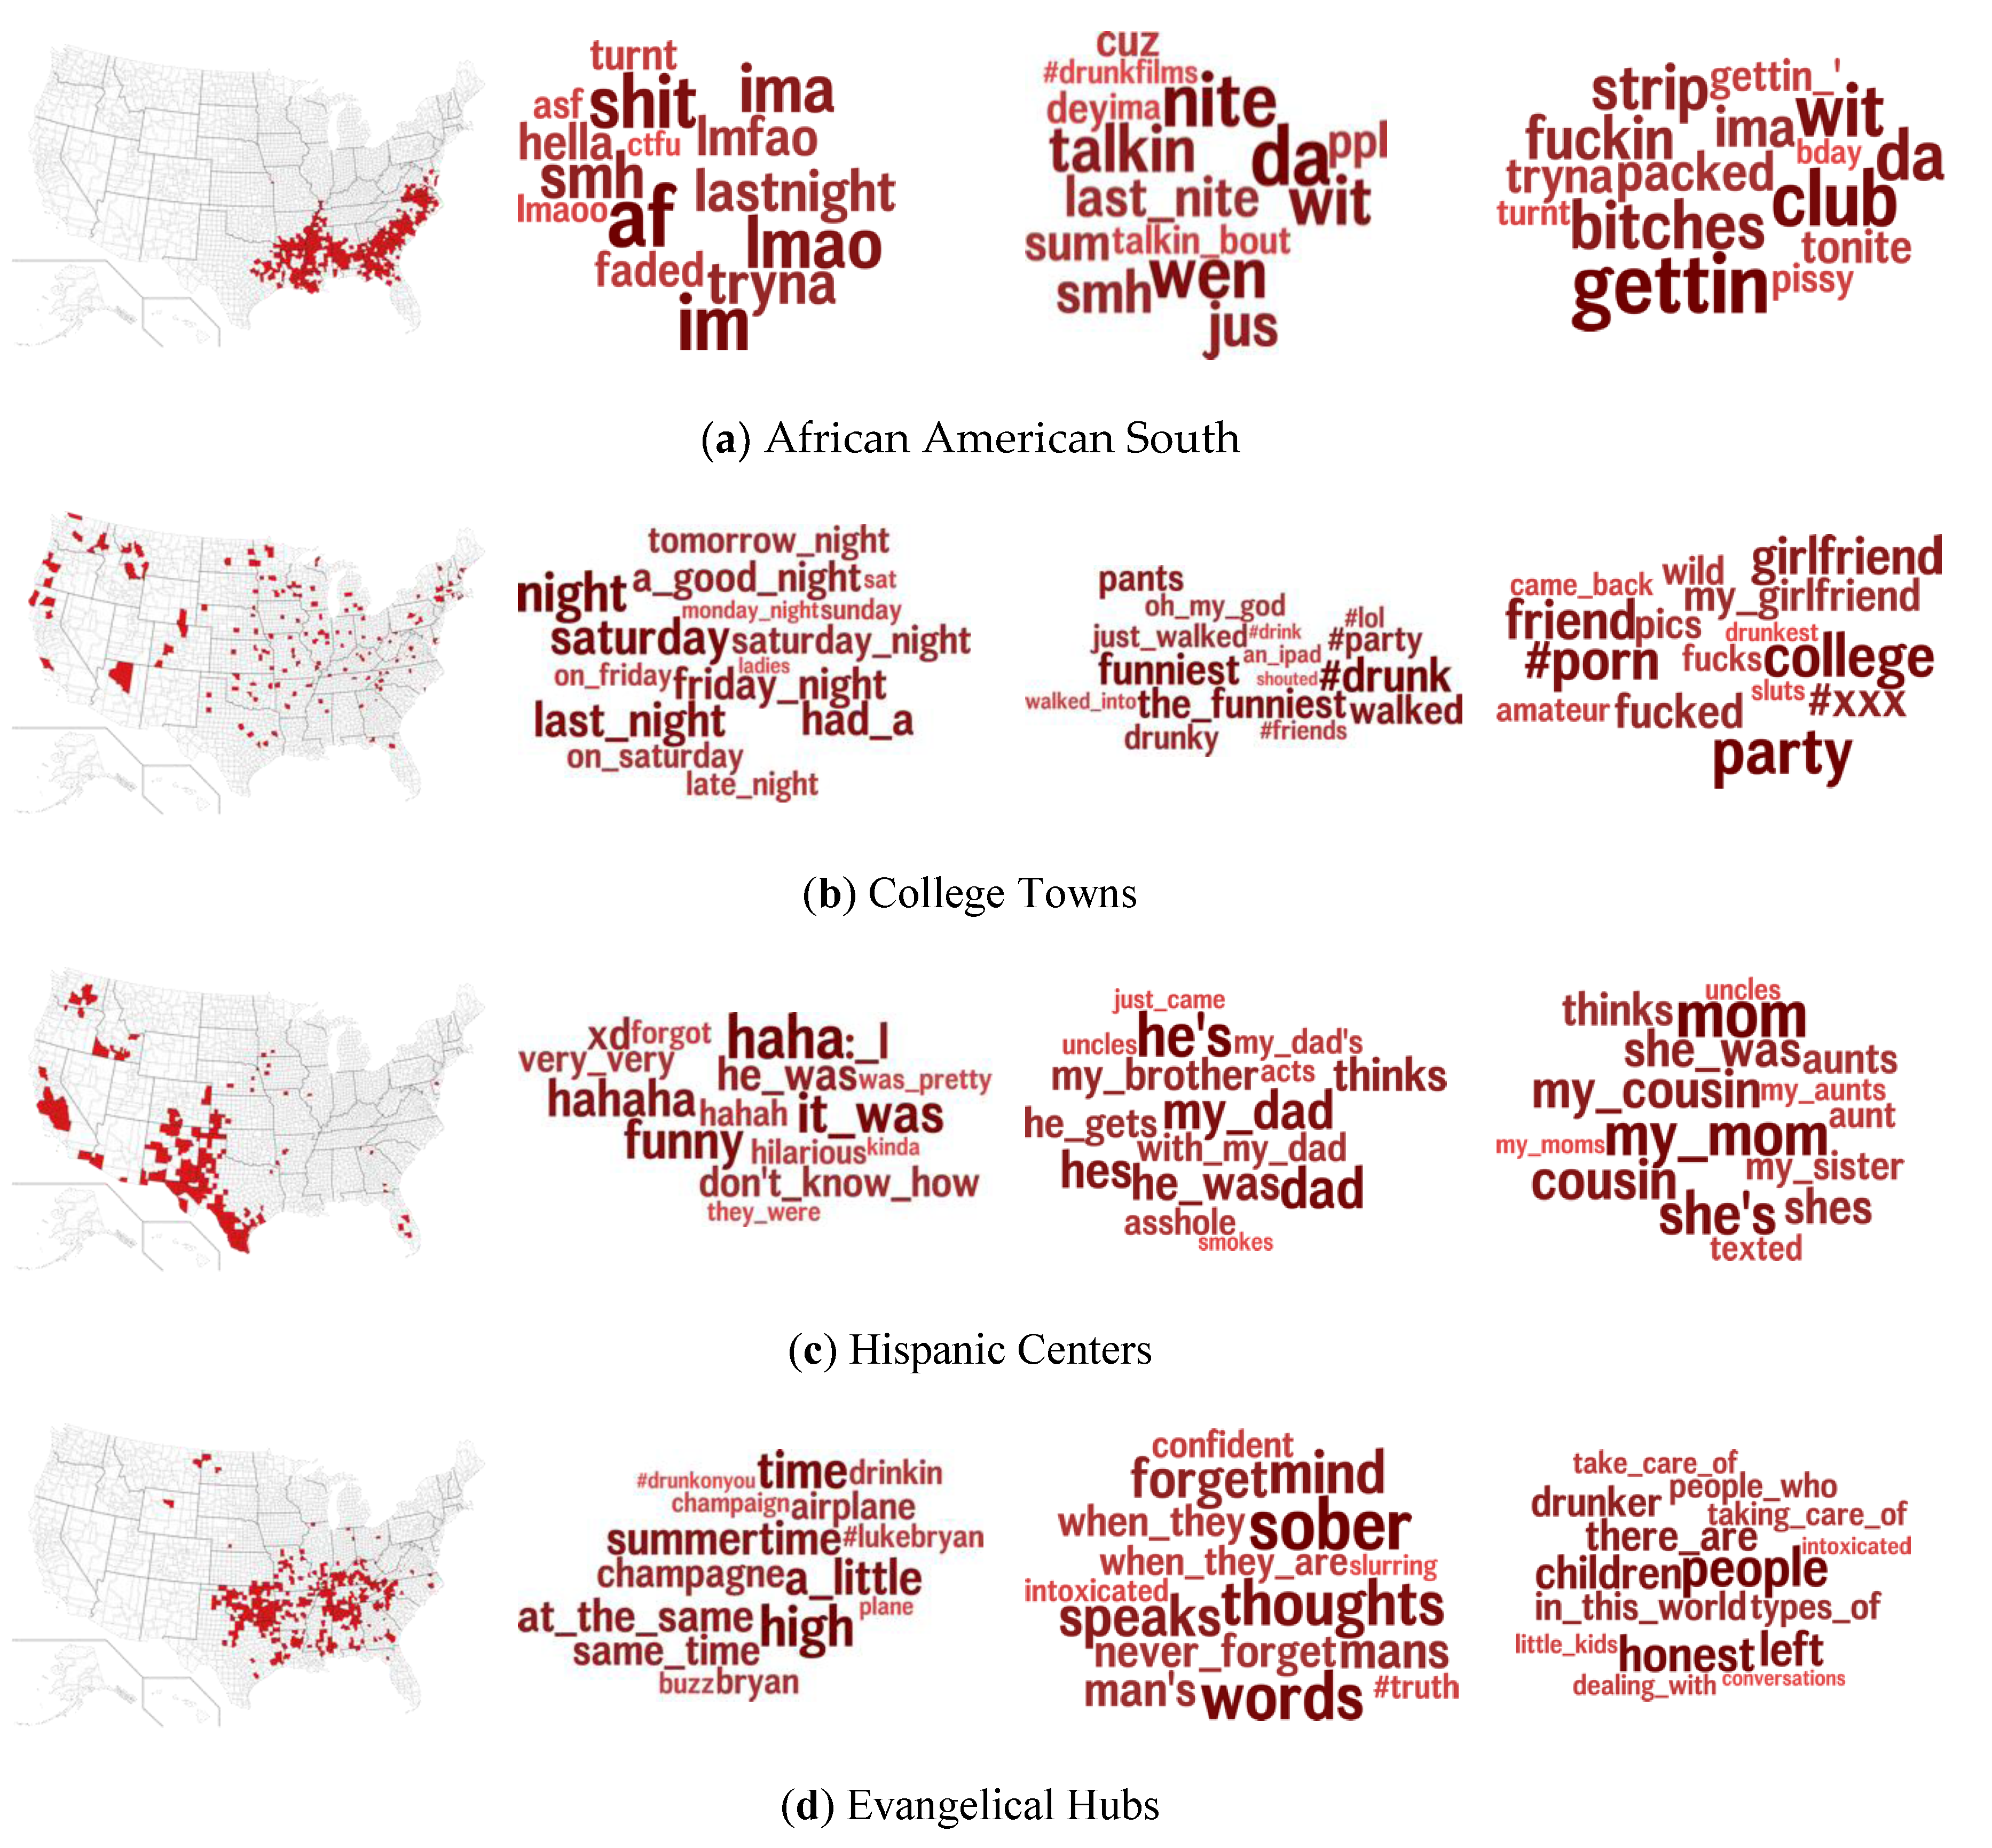
2.2. Topic Modeling
2.3. Statistical Methods
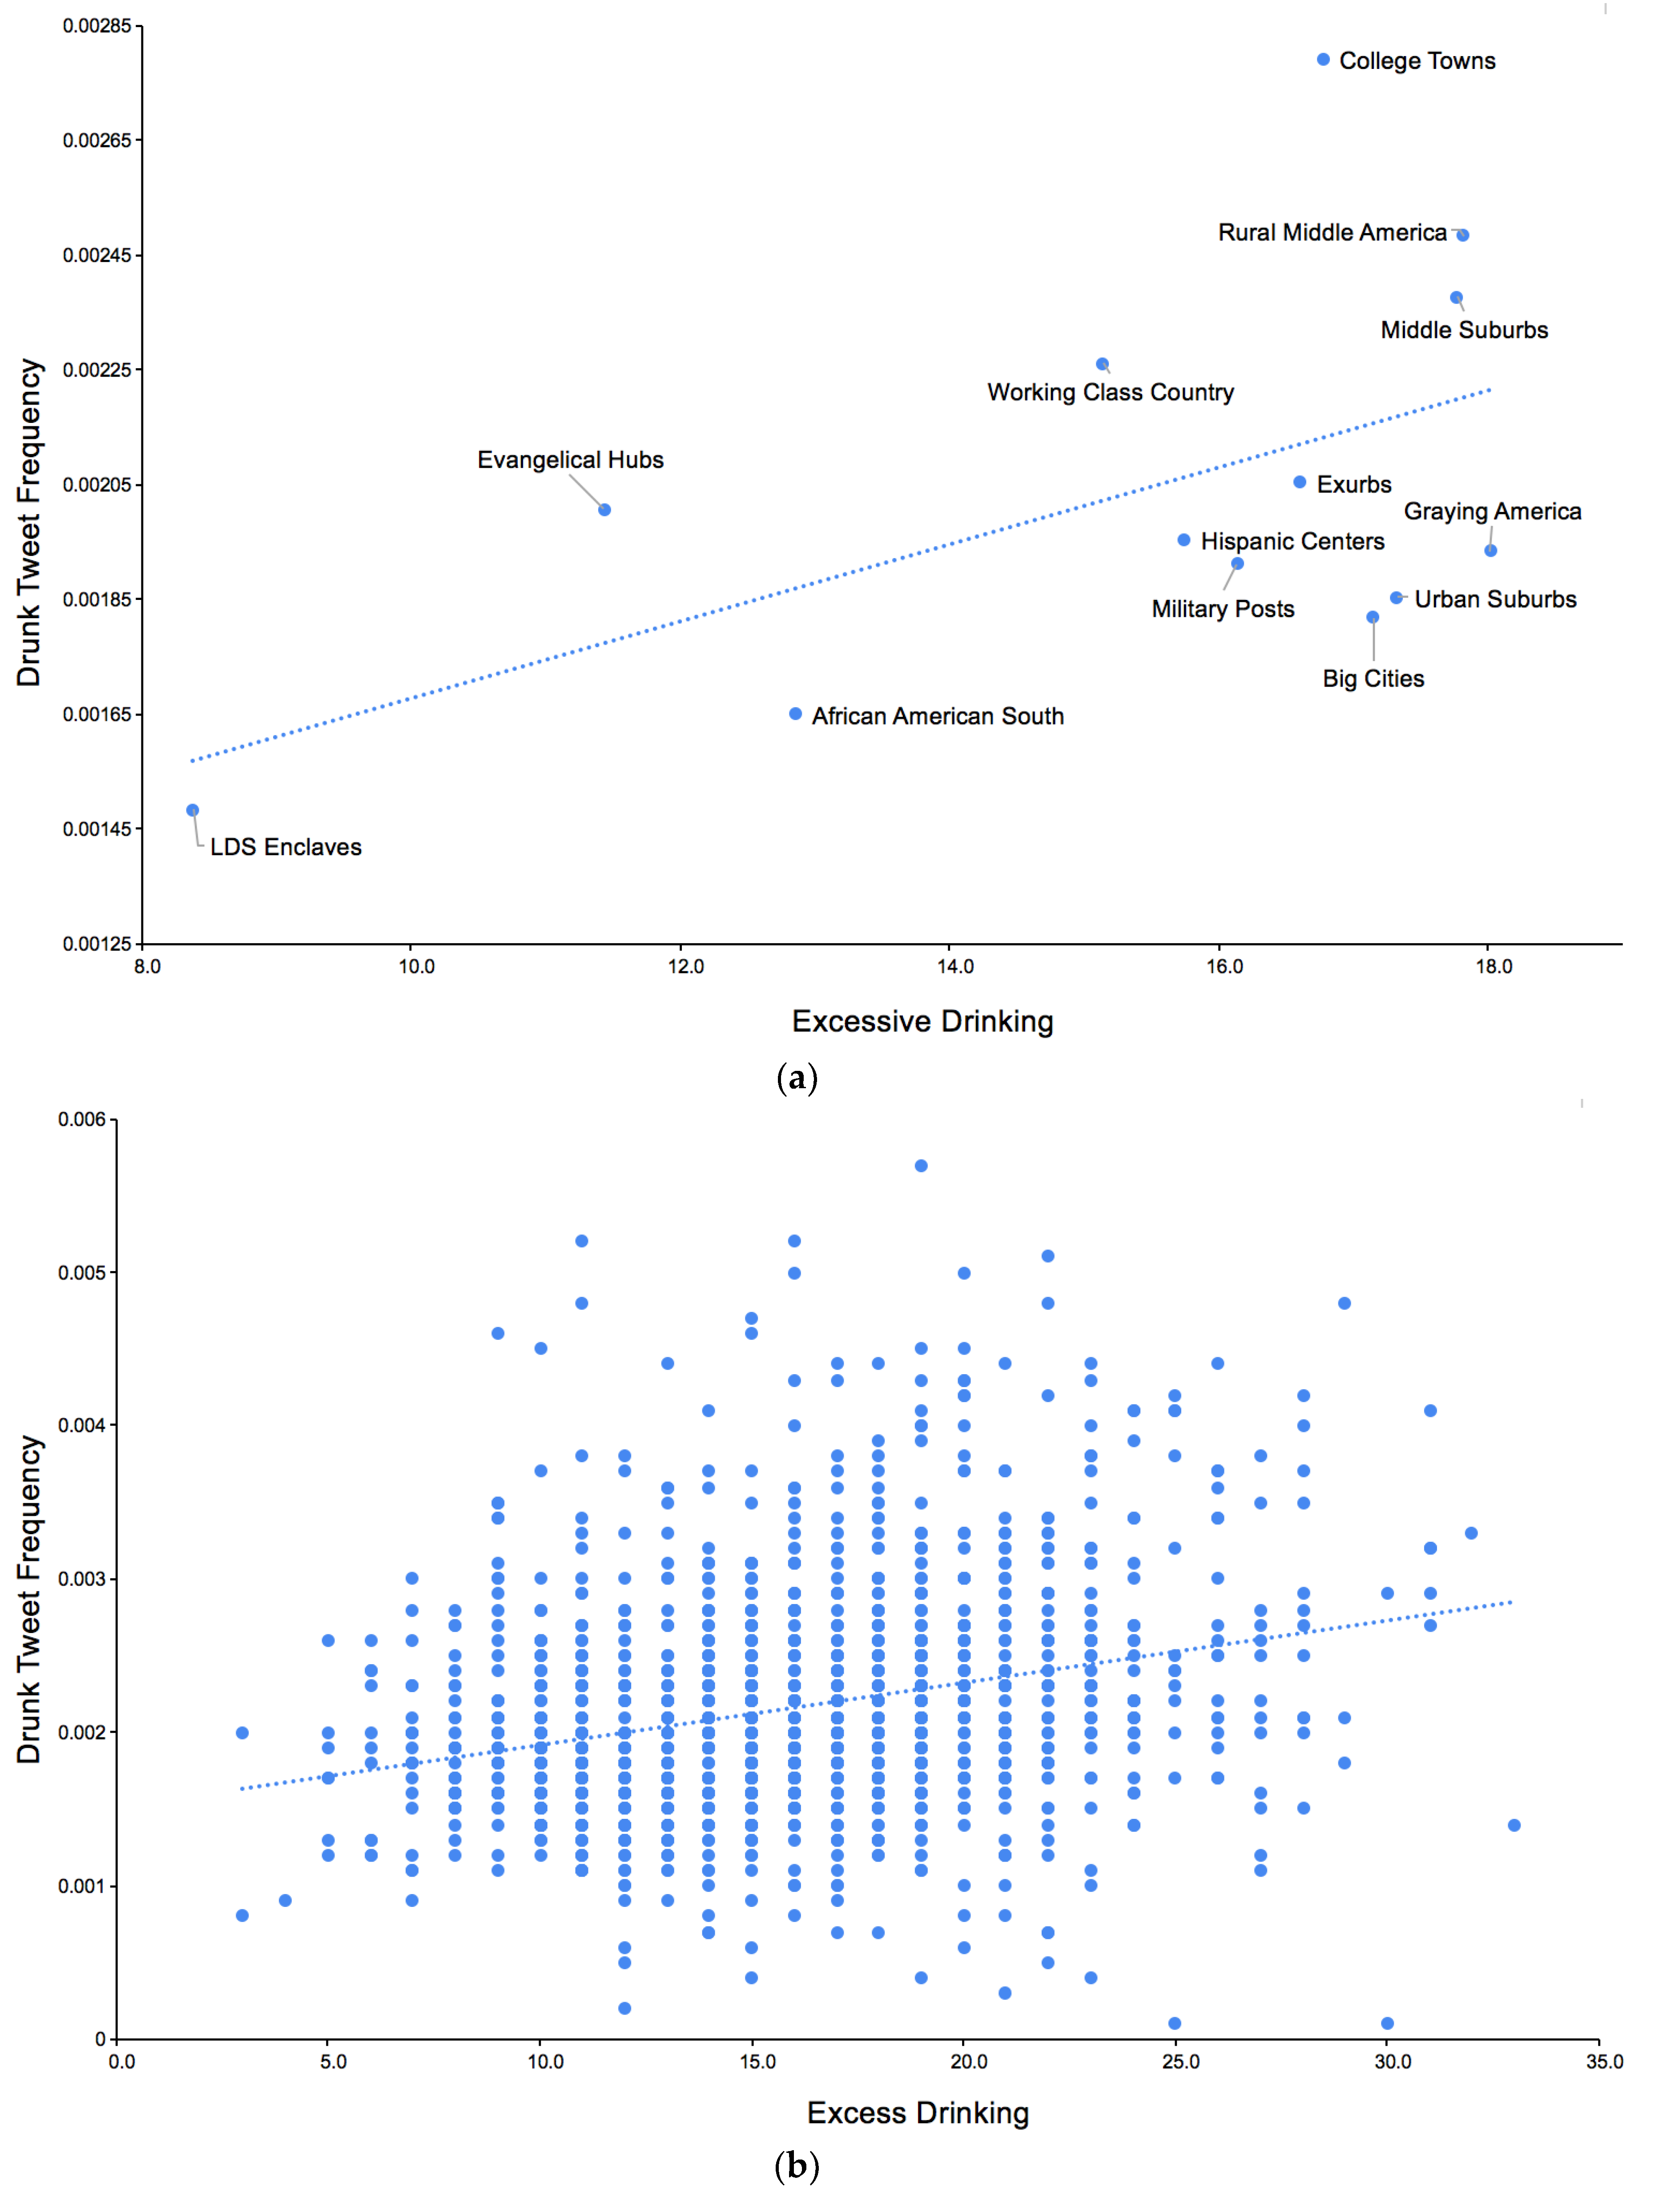
2.3.1. Drunk Tweeting and Excessive Drinking
2.3.2. Differential Language Analysis
2.3.3. Self versus Other Drinking
2.3.4. Sentiment
3. Results
3.1. Community Correlations with Excessive Drinking
3.2. Differential Language Analysis
3.3. Self versus Other Drinking
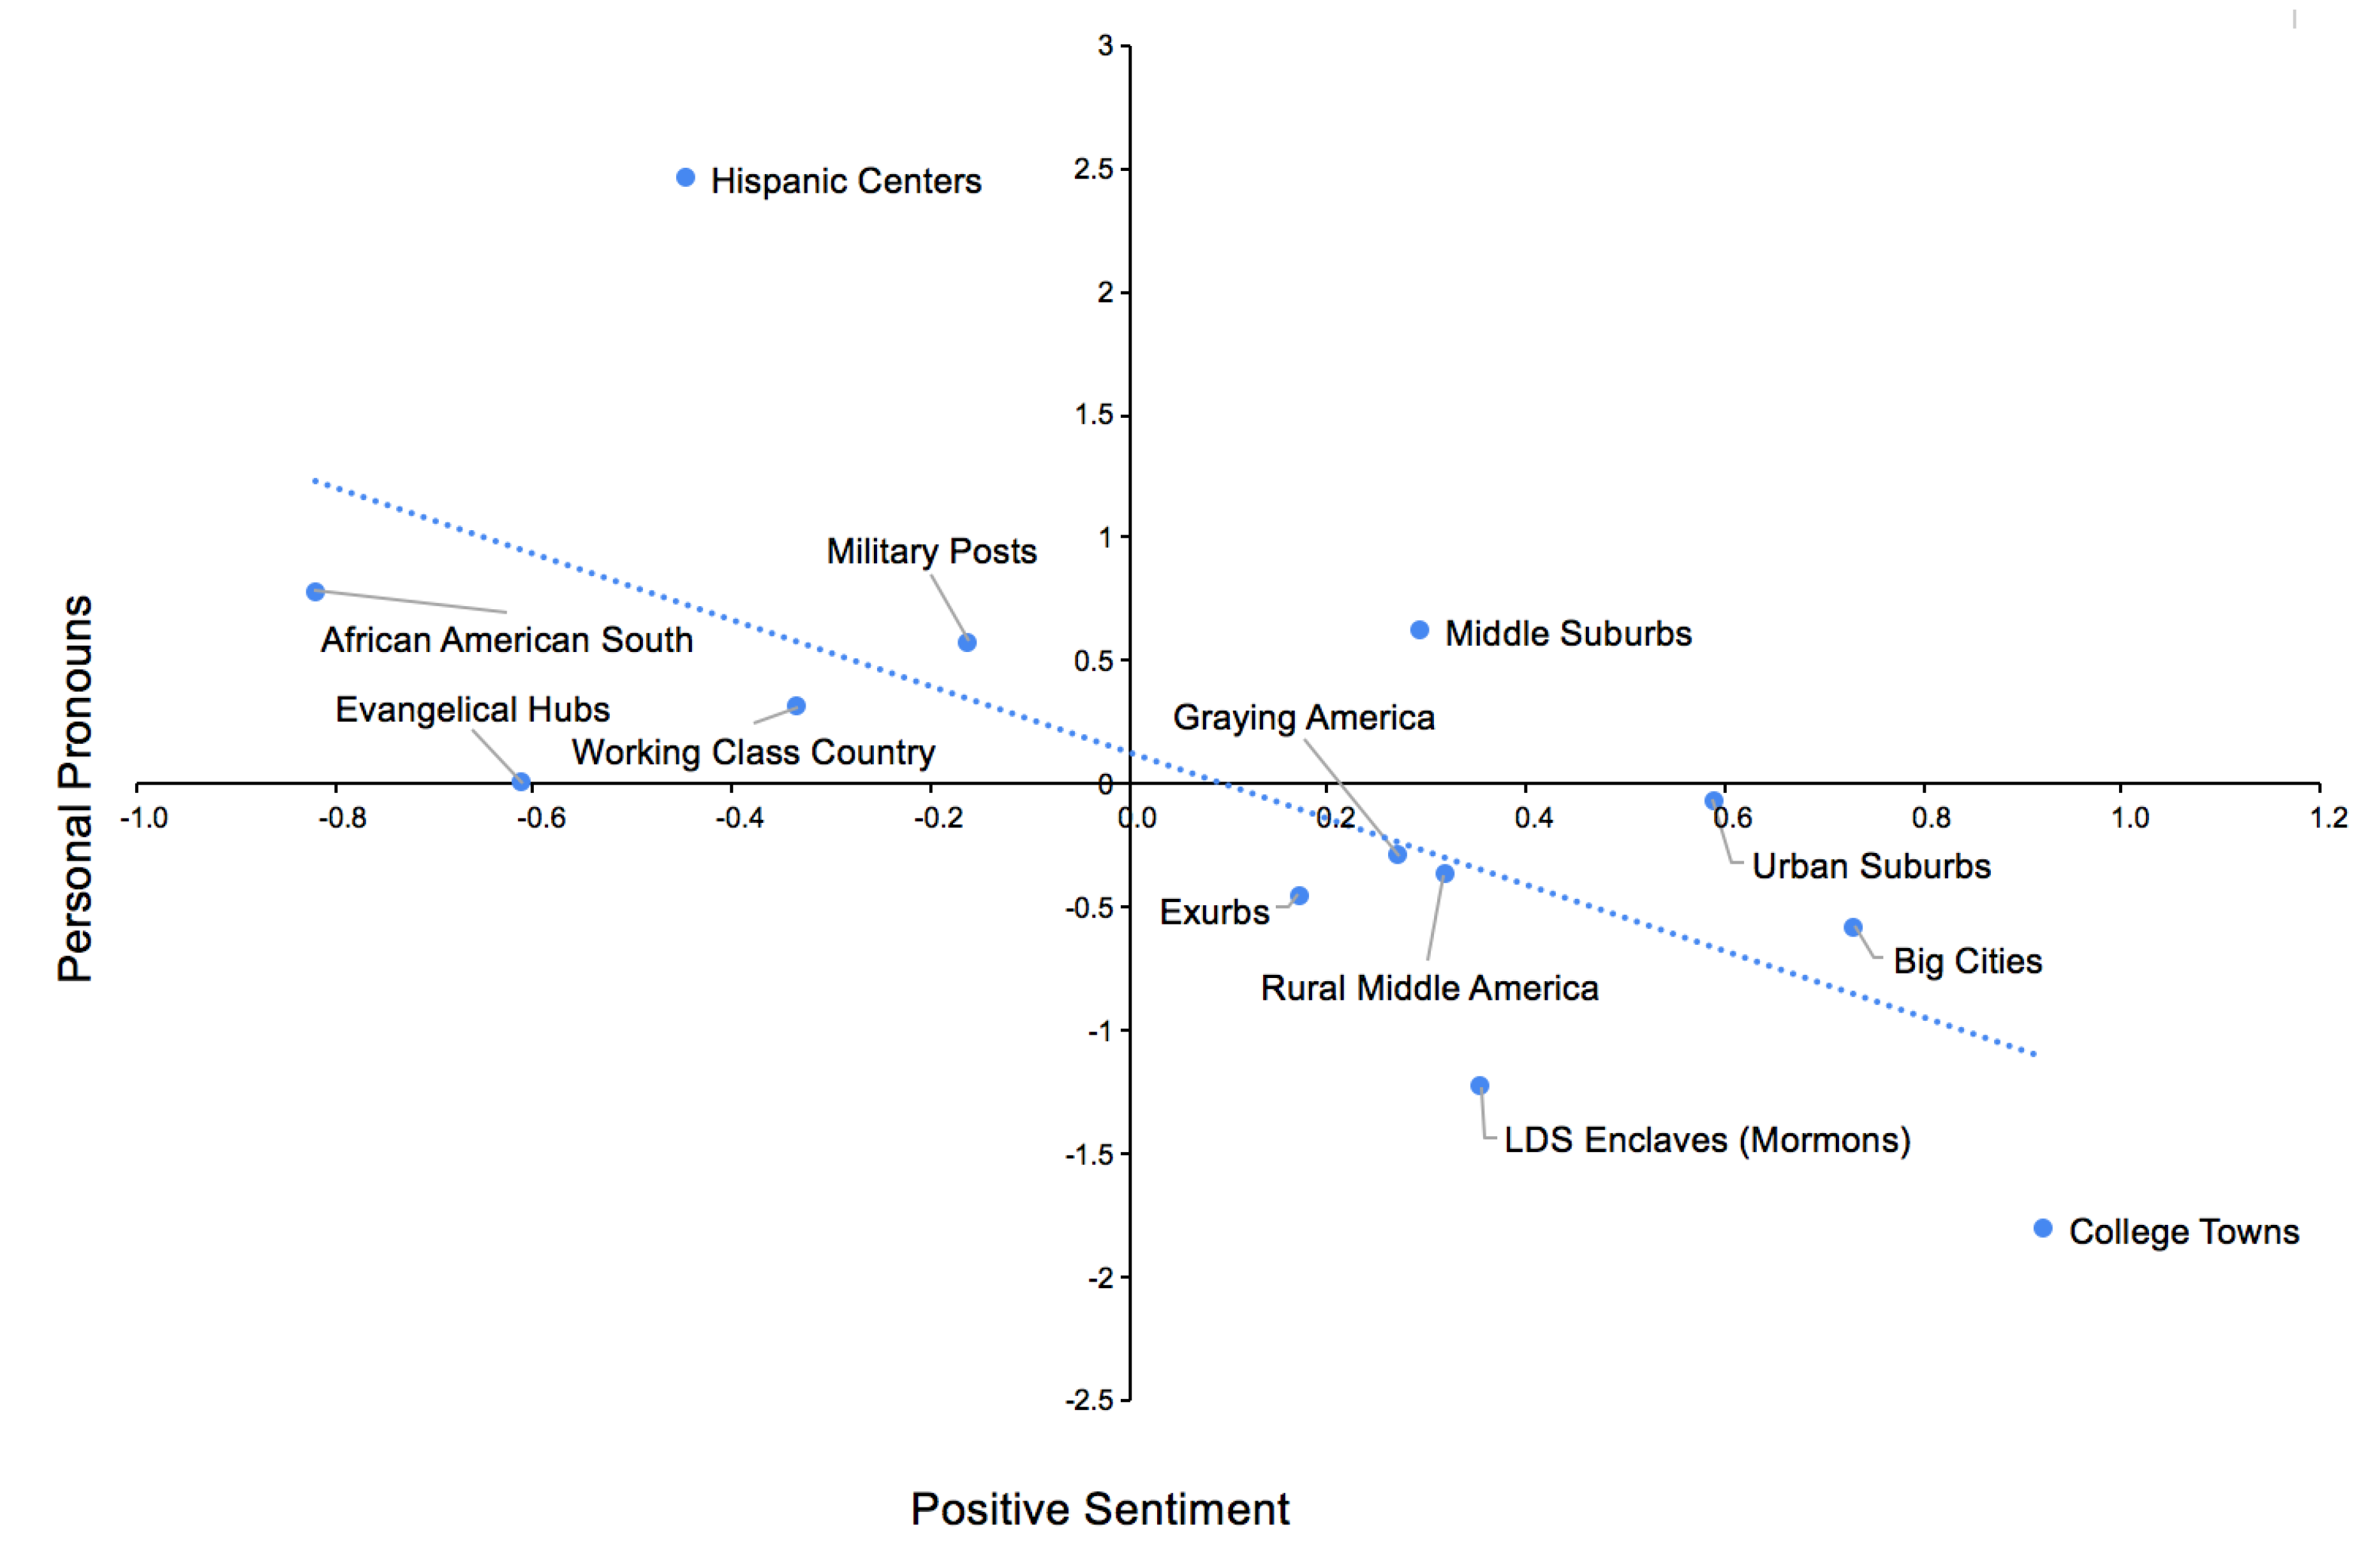
3.4. Sentiment
4. Discussion
5. Conclusions
Author Contributions
Funding
Conflicts of Interest
Appendix A

| alcohol | bottle | hangover | pub |
| alcoholics | bottles | happy hour | shot(s) |
| alcoholism | brewery | hungover | sober |
| ale | champagne | lager | tailgate |
| bar | ciroc | liquor | tailgating |
| beer | cocktail | lounge | tequila |
| beer goggles | cocktails | margarita(s) | tipsy |
| beers | drank | pint | vodka |
| booze | drink | pints | wasted |
| boozey | drinking | pregame | whiskey |
| boozy | gin | pregaming | wine |
References
- Centers for Disease Control and Prevention (CDC). Alcohol-Related Disease Impact (ARDI); CDC: Atlanta, GA, USA, 2008. [Google Scholar]
- Mokdad, A.H.; Marks, J.S.; Stroup, D.F.; Gerberding, J.L. Actual causes of death in the United States, 2000. JAMA 2004, 291, 1238–1245. [Google Scholar] [CrossRef] [PubMed]
- Stahre, M.; Roeber, J.; Kanny, D.; Brewer, R.D.; Zhang, X. Contribution of excessive alcohol consumption to deaths and years of potential life lost in the United States. Prev. Chronic Dis. 2014, 11, E109. [Google Scholar] [CrossRef] [PubMed] [Green Version]
- Drinking Levels Defined. Available online: https://www.niaaa.nih.gov/alcohol-health/overview-alcohol-consumption/moderate-binge-drinking (accessed on 20 December 2019).
- Alcohol Facts and Statistics. Available online: https://www.niaaa.nih.gov/publications/brochures-and-fact-sheets/alcohol-facts-and-statistics (accessed on 20 December 2019).
- White, A.; Hingson, R. The burden of alcohol use: Excessive alcohol consumption and related consequences among college students. Alcohol Res. Curr. Rev. 2013, 35. [Google Scholar] [CrossRef]
- Xu, F.; Mawokomatanda, T.; Flegel, D.; Pierannunzi, C.; Garvin, W.; Chowdhury, P.; Salandy, S.; Crawford, C.; Town, M. Surveillance for certain health behaviors among states and selected local areas—Behavioral Risk Factor Surveillance System, United States, 2011. Morb. Mortal. Wkly. Rep. Surveill. Summ. 2014, 63, 1–149. [Google Scholar]
- Lyerla, R.; Stroup, D.F. Toward a Public Health Surveillance System for Behavioral Health. Public Health Rep. 2018, 133, 360–365. [Google Scholar] [CrossRef] [PubMed]
- Lynn, P.; Japec, L.; Lyberg, L. What’s so special about cross-national surveys? In Proceedings of the International Workshop on Comparative Survey Design and Implementation (CSDI), Madrid, Spain, 10–12 March 2005; GESIS: Mannheim, Germany, 2006; Volume 12, pp. 7–20. [Google Scholar]
- Dillman, D.A. Mail and other self-administered surveys in the 21st century: The beginning of a new era. Retrieved May 1998, 30, 2005. [Google Scholar]
- Diener, E.; Oishi, S.; Lucas, R.E. National accounts of subjective well-being. Am. Psychol. 2015, 70, 234. [Google Scholar] [CrossRef]
- Matz, S.C.; Gladstone, J.J.; Stillwell, D. Money buys happiness when spending fits our personality. Psychol. Sci. 2016, 27, 715–725. [Google Scholar] [CrossRef]
- Schwartz, H.A.; Eichstaedt, J.C.; Kern, M.L.; Dziurzynski, L.; Ramones, S.M.; Agrawal, M.; Shah, A.; Kosinski, M.; Stillwell, D.; Seligman, M.E.; et al. Personality, gender, and age in the language of social media: The open-vocabulary approach. PLoS ONE 2013, 8, e73791. [Google Scholar] [CrossRef]
- Curtis, B.L.; Lookatch, S.J.; Ramo, D.E.; McKay, J.R.; Feinn, R.S.; Kranzler, H.R. Meta-Analysis of the Association of Alcohol-Related Social Media Use with Alcohol Consumption and Alcohol-Related Problems in Adolescents and Young Adults. Alcohol. Clin. Exp. Res. 2018, 42, 978–986. [Google Scholar] [CrossRef]
- Stavrakantonakis, I.; Gagiu, A.E.; Kasper, H.; Toma, I.; Thalhammer, A. An approach for evaluation of social media monitoring tools. Common Value Manag. 2012, 52, 52–64. [Google Scholar]
- Nguyen, Q.C.; McCullough, M.; Meng, H.W.; Paul, D.; Li, D.; Kath, S.; Loomis, G.; Nsoesie, E.O.; Wen, M.; Smith, K.R.; et al. Geotagged US tweets as predictors of county-level health outcomes, 2015–2016. Am. J. Public Health 2017, 107, 1776–1782. [Google Scholar] [CrossRef] [PubMed]
- Kursuncu, U.; Gaur, M.; Lokala, U.; Thirunarayan, K.; Sheth, A.; Arpinar, I.B. Predictive analysis on Twitter: Techniques and applications. In Emerging Research Challenges and Opportunities in Computational Social Network Analysis and Mining; Springer International Publishing: Cham, Switzerland, 2019; pp. 67–104. [Google Scholar]
- Culotta, A. Lightweight methods to estimate influenza rates and alcohol sales volume from Twitter messages. Lang. Resour. Eval. 2013, 47, 217–238. [Google Scholar] [CrossRef]
- Culotta, A. Estimating county health statistics with twitter. In Proceedings of the 32nd Annual ACM Conference on Human Factors in Computing Systems, Toronto, ON, Canada, 26 April–1 May 2014; ACM: New York, NY, USA; pp. 1335–1344. [Google Scholar]
- Eichstaedt, J.C.; Schwartz, H.A.; Kern, M.L.; Park, G.; Labarthe, D.R.; Merchant, R.M.; Jha, S.; Agrawal, M.; Dziurzynski, L.A.; Sap, M.; et al. Psychological language on Twitter predicts county-level heart disease mortality. Psychol. Sci. 2015, 26, 159–169. [Google Scholar] [CrossRef] [Green Version]
- Ginsberg, J.; Mohebbi, M.H.; Patel, R.S.; Brammer, L.; Smolinski, M.S.; Brilliant, L. Detecting influenza epidemics using search engine query data. Nature 2009, 457, 1012. [Google Scholar] [CrossRef]
- Jena, A.B.; Karaca-Mandic, P.; Weaver, L.; Seabury, S.A. Predicting new diagnoses of HIV infection using internet search engine data. Clin. Infect. Dis. 2013, 56, 1352–1353. [Google Scholar] [CrossRef]
- Paul, M.J.; Dredze, M. You are what you tweet: Analyzing twitter for public health. In Proceedings of the Fifth International AAAI Conference on Weblogs and Social Media, Barcelona, Spain, 17–21 July 2011. [Google Scholar]
- Curtis, B.; Giorgi, S.; Buffone, A.E.; Ungar, L.H.; Ashford, R.D.; Hemmons, J.; Summers, D.; Hamilton, C.; Schwartz, H.A. Can Twitter be used to predict county excessive alcohol consumption rates? PLoS ONE 2018, 13, e0194290. [Google Scholar] [CrossRef] [Green Version]
- Cavazos-Rehg, P.A.; Krauss, M.J.; Sowles, S.J.; Bierut, L.J. “Hey everyone, I’m drunk.” An evaluation of drinking-related Twitter chatter. J. Stud. Alcohol Drugs 2015, 76, 635–643. [Google Scholar] [CrossRef] [Green Version]
- Preotiuc-Pietro, D.; Samangooei, S.; Cohn, T.; Gibbins, N.; Niranjan, M. Trendminer: An architecture for real time analysis of social media text. In Proceedings of the Sixth International AAAI Conference on Weblogs and Social Media, Dublin, Ireland, 4–7 June 2012. [Google Scholar]
- Giorgi, S.; Preotiuc-Pietro, D.; Buffone, A.; Rieman, D.; Ungar, L.H.; Schwartz, H.A. The remarkable benefit of user-level aggregation for lexical-based population-level predictions. In Proceedings of the 2014 Conference on Empirical Methods in Natural Language Processing (EMNLP), Brussels, Belgium, 31 October–4 November 2018; pp. 1167–1172. [Google Scholar]
- Lui, M.; Baldwin, T. langid. py: An off-the-shelf language identification tool. In Proceedings of the Association for Computational Linguistics 2012 System Demonstrations, Jeju Island, Korea, 8–14 July 2012; pp. 25–30. [Google Scholar]
- Schwartz, H.A.; Eichstaedt, J.C.; Kern, M.L.; Dziurzynski, L.; Lucas, R.E.; Agrawal, M.; Park, G.J.; Lakshmikanth, S.K.; Jha, S.; Seligman, M.E.; et al. Characterizing geographic variation in well-being using tweets. In Proceedings of the Seventh International AAAI Conference on Weblogs and Social Media, Boston, MA, USA, 8–11 July 2013. [Google Scholar]
- Chinni, D.; Gimpel, J. Our Patchwork Nation: The Surprising Truth about the” Real” America; Penguin: New York, NY, USA, 2011. [Google Scholar]
- Blei, D.M.; Ng, A.Y.; Jordan, M.I. Latent dirichlet allocation. J. Mach. Learn. Res. 2003, 3, 993–1022. [Google Scholar]
- Schwartz, H.A.; Giorgi, S.; Sap, M.; Crutchley, P.; Ungar, L.; Eichstaedt, J. DLATK: Differential language analysis toolkit. In Proceedings of the 2017 Conference on Empirical Methods in Natural Language Processing: System Demonstrations, Copenhagen, Denmark, 9–11 September 2017; pp. 55–60. [Google Scholar]
- Monroe, B.L.; Colaresi, M.P.; Quinn, K.M. Fightin’ words: Lexical feature selection and evaluation for identifying the content of political conflict. Political Anal. 2008, 16, 372–403. [Google Scholar] [CrossRef]
- Jurafsky, D.; Chahuneau, V.; Routledge, B.R.; Smith, N.A. Narrative framing of consumer sentiment in online restaurant reviews. First Monday 2014, 19, 4. [Google Scholar] [CrossRef]
- Gelfand, A.E.; Smith, A.F. Sampling-based approaches to calculating marginal densities. J. Am. Stat. Assoc. 1990, 85, 398–409. [Google Scholar] [CrossRef]
- McCallum, A.K. Mallet: A machine Learning for Language Toolkit. 2002. Available online: http://mallet.cs.umass.edu (accessed on 22 July 2015).
- Benjamini, Y.; Hochberg, Y. Controlling the false discovery rate: A practical and powerful approach to multiple testing. J. R. Stat. Soc. Ser. B (Methodol.) 1995, 57, 289–300. [Google Scholar] [CrossRef]
- Pennebaker, J.W.; Boyd, R.L.; Jordan, K.; Blackburn, K. The Development and Psychometric Properties of LIWC2015; The University of Texas at Austin: Austin, TA, USA, 2015. [Google Scholar]
- Mohammad, S.M.; Kiritchenko, S.; Zhu, X. NRC-Canada: Building the state-of-the-art in sentiment analysis of tweets. arXiv 2013, arXiv:1308.6242. [Google Scholar]
- Green, L.J. African American English: A Linguistic Introduction; Cambridge University Press: Cambridge, UK, 2002. [Google Scholar]
- Carr, J.L.; VanDeusen, K.M. Risk factors for male sexual aggression on college campuses. J. Fam. Violence 2004, 19, 279–289. [Google Scholar] [CrossRef]
- Allem, J.P.; Ferrara, E.; Uppu, S.P.; Cruz, T.B.; Unger, J.B. E-cigarette surveillance with social media data: Social bots, emerging topics, and trends. JMIR Public Health Surveill. 2017, 3, e98. [Google Scholar] [CrossRef] [Green Version]
- Unger, J.B.; Urman, R.; Cruz, T.B.; Majmundar, A.; Barrington-Trimis, J.; Pentz, M.A.; McConnell, R. Talking about tobacco on Twitter is associated with tobacco product use. Prev. Med. 2018, 114, 54–56. [Google Scholar] [CrossRef]
- Nguyen, A.; Hoang, Q.; Nguyen, H.; Nguyen, D.; Tran, T. Evaluating marijuana-related tweets on Twitter. In Proceedings of the 2017 IEEE 7th Annual Computing and Communication Workshop and Conference (CCWC), Las Vegas, NV, USA, 9–11 January 2017; pp. 1–7. [Google Scholar]


| Spatial Unit | N | Correlation with Excessive Drinking |
|---|---|---|
| County | 1573 | 0.26 [0.21, 0.31] (p < 0.001) |
| State | 46 | 0.45 [0.18, 0.72] (p = 0.002) |
| American Communities Project (ACP) | 14 | 0.55 [−0.007, 1.103] (p = 0.053) |
| Self | Other | |
|---|---|---|
| Hispanic Centers | 1.90 | 0.18 |
| African American South | 1.53 | 2.55 |
| Middle Suburbs | 1.00 | 0.18 |
| Military Posts | 0.97 | 0.38 |
| Urban Suburbs | 0.73 | 0.18 |
| Big Cities | 0.31 | 0.77 |
| Native American Lands | −0.59 | 0.38 |
| LDS Enclaves | −0.61 | −1.20 |
| Graying America | −0.69 | 0.58 |
| Rural Middle America | −0.74 | −1.59 |
| College Towns | −0.75 | −1.20 |
| Exurbs | −0.81 | −0.41 |
| Evangelical Hubs | −0.97 | −0.01 |
| Working Class Country | −1.26 | −0.80 |
© 2020 by the authors. Licensee MDPI, Basel, Switzerland. This article is an open access article distributed under the terms and conditions of the Creative Commons Attribution (CC BY) license (http://creativecommons.org/licenses/by/4.0/).
Share and Cite
Giorgi, S.; Yaden, D.B.; Eichstaedt, J.C.; Ashford, R.D.; Buffone, A.E.K.; Schwartz, H.A.; Ungar, L.H.; Curtis, B. Cultural Differences in Tweeting about Drinking Across the US. Int. J. Environ. Res. Public Health 2020, 17, 1125. https://doi.org/10.3390/ijerph17041125
Giorgi S, Yaden DB, Eichstaedt JC, Ashford RD, Buffone AEK, Schwartz HA, Ungar LH, Curtis B. Cultural Differences in Tweeting about Drinking Across the US. International Journal of Environmental Research and Public Health. 2020; 17(4):1125. https://doi.org/10.3390/ijerph17041125
Chicago/Turabian StyleGiorgi, Salvatore, David B. Yaden, Johannes C. Eichstaedt, Robert D. Ashford, Anneke E.K. Buffone, H. Andrew Schwartz, Lyle H. Ungar, and Brenda Curtis. 2020. "Cultural Differences in Tweeting about Drinking Across the US" International Journal of Environmental Research and Public Health 17, no. 4: 1125. https://doi.org/10.3390/ijerph17041125