Risk Prediction Models for Melanoma: A Systematic Review on the Heterogeneity in Model Development and Validation

 , , , , and
Abstract
:1. Introduction
2. Materials and Methods
2.1. Eligibility Criteria and Search Strategy
2.2. Data Extraction
2.3. Data Processing
3. Results
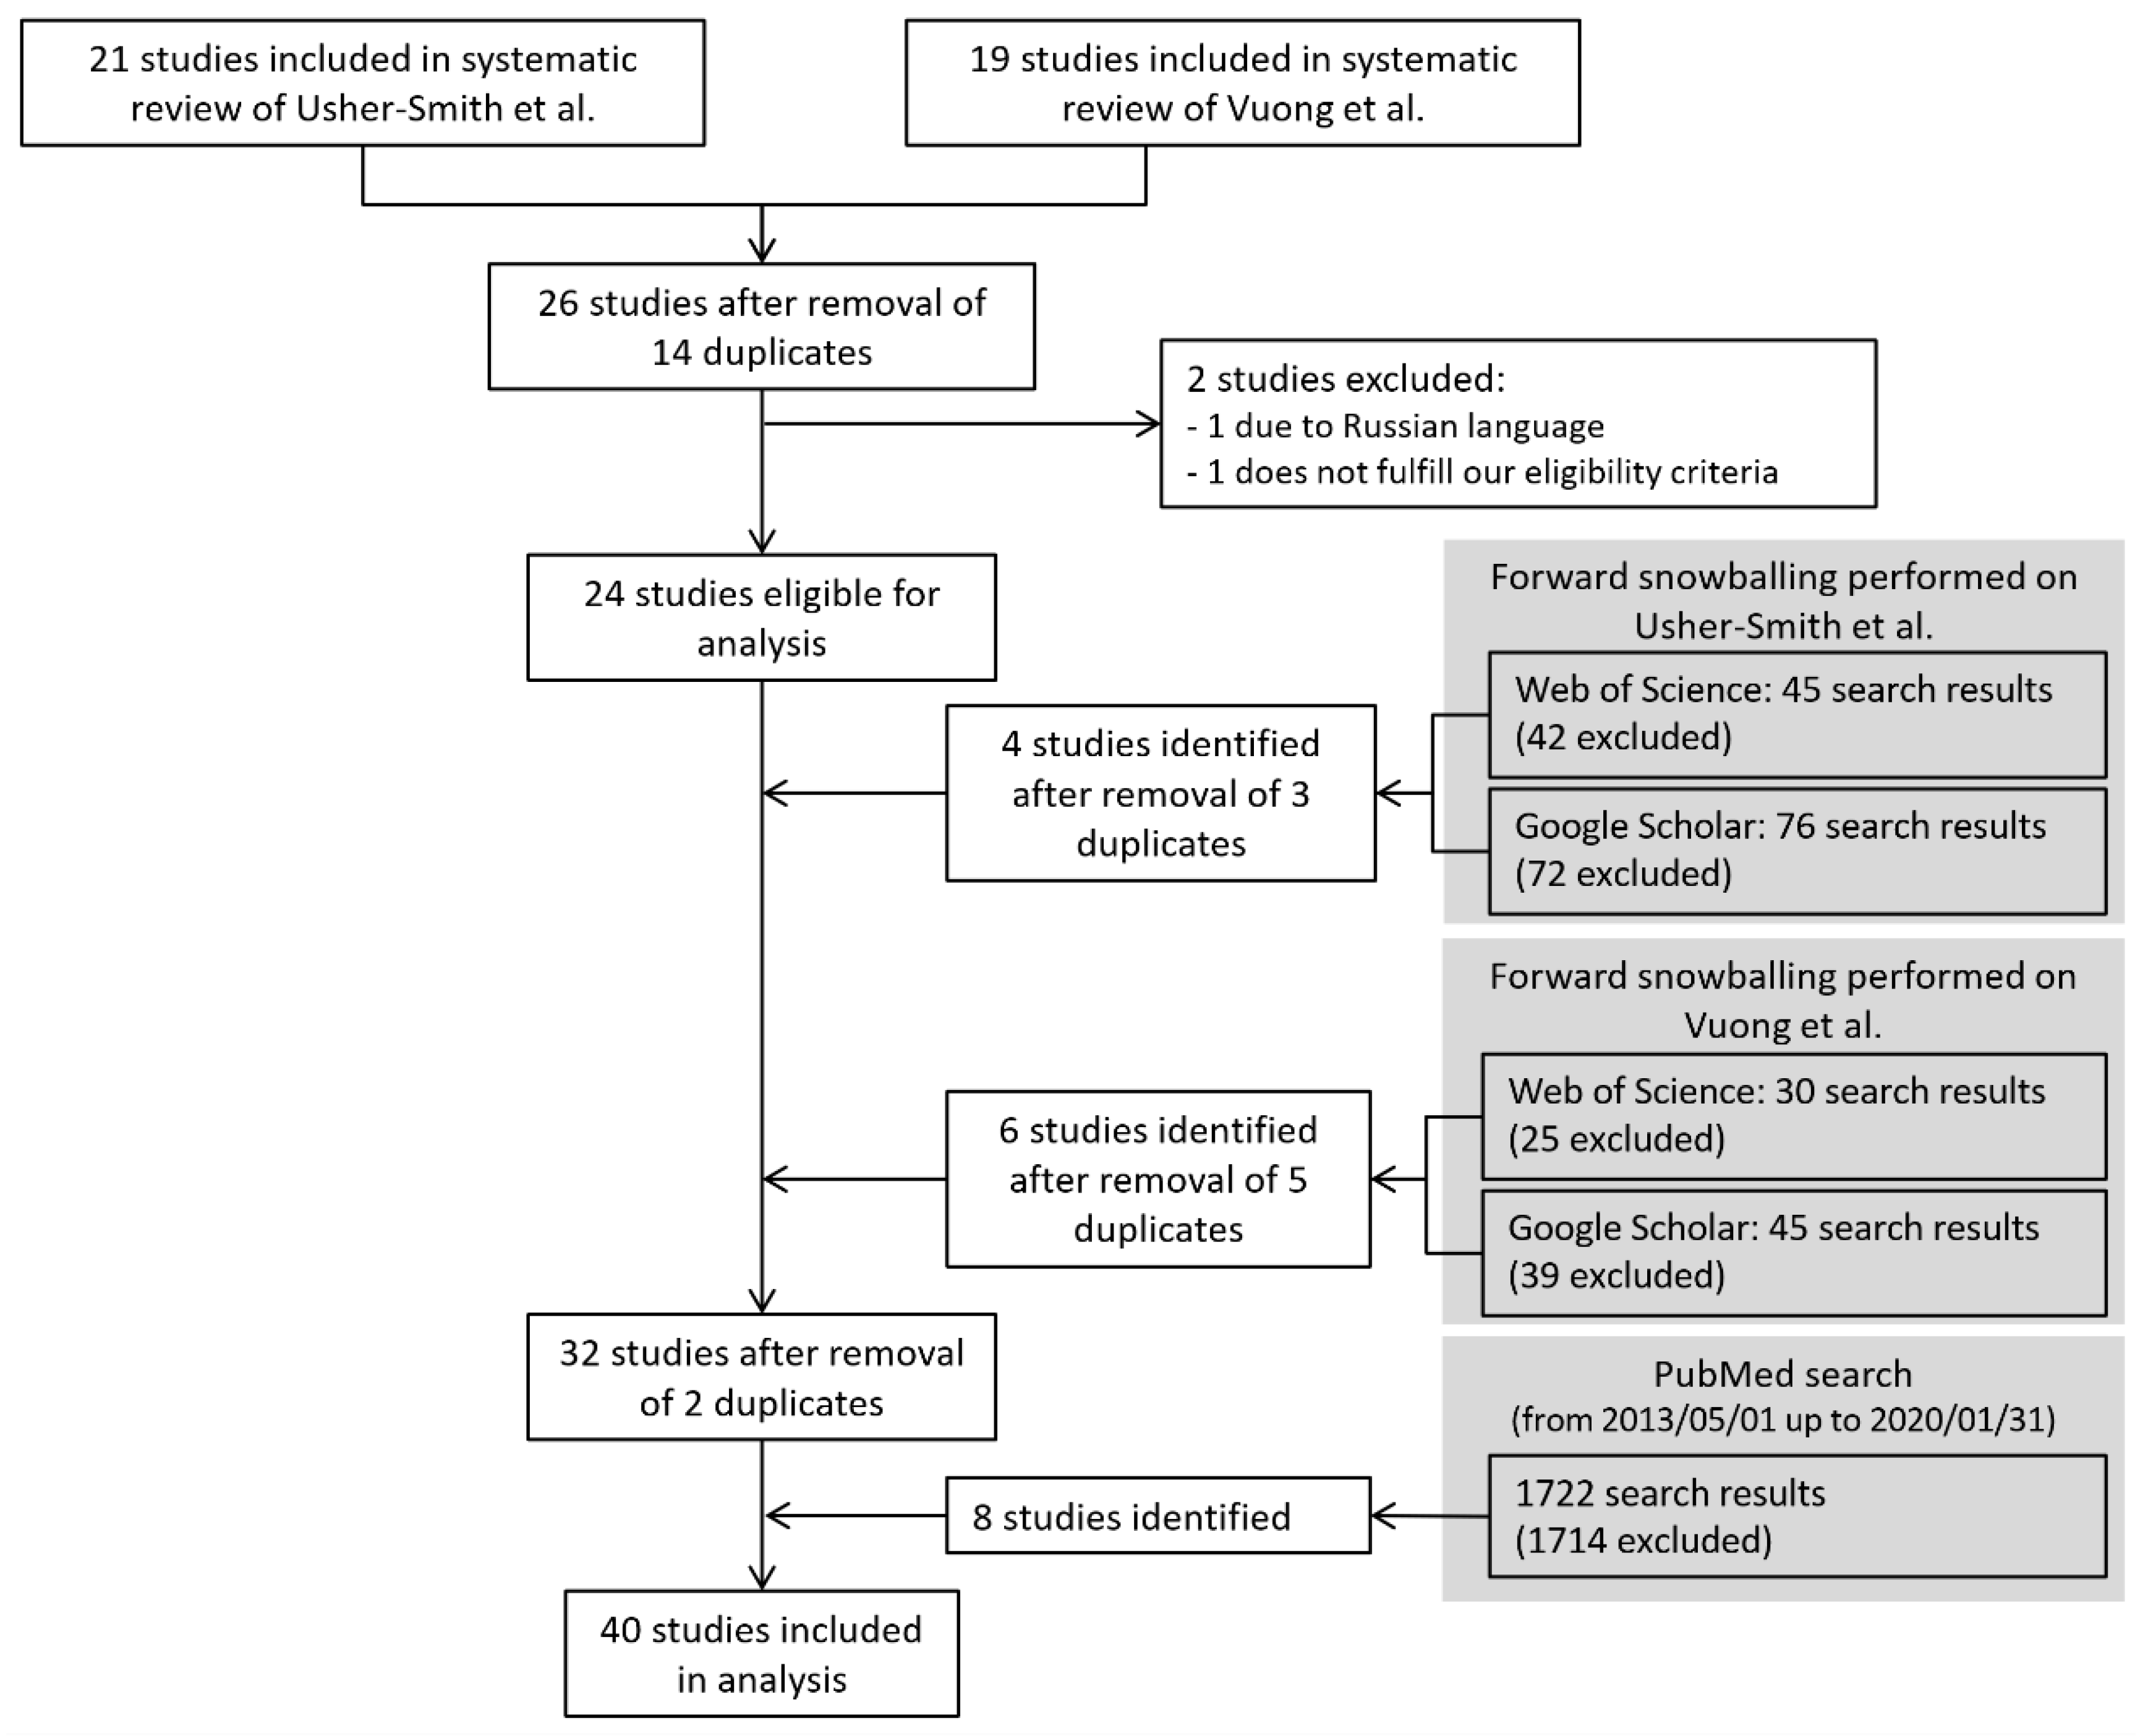
3.1. Study Selection
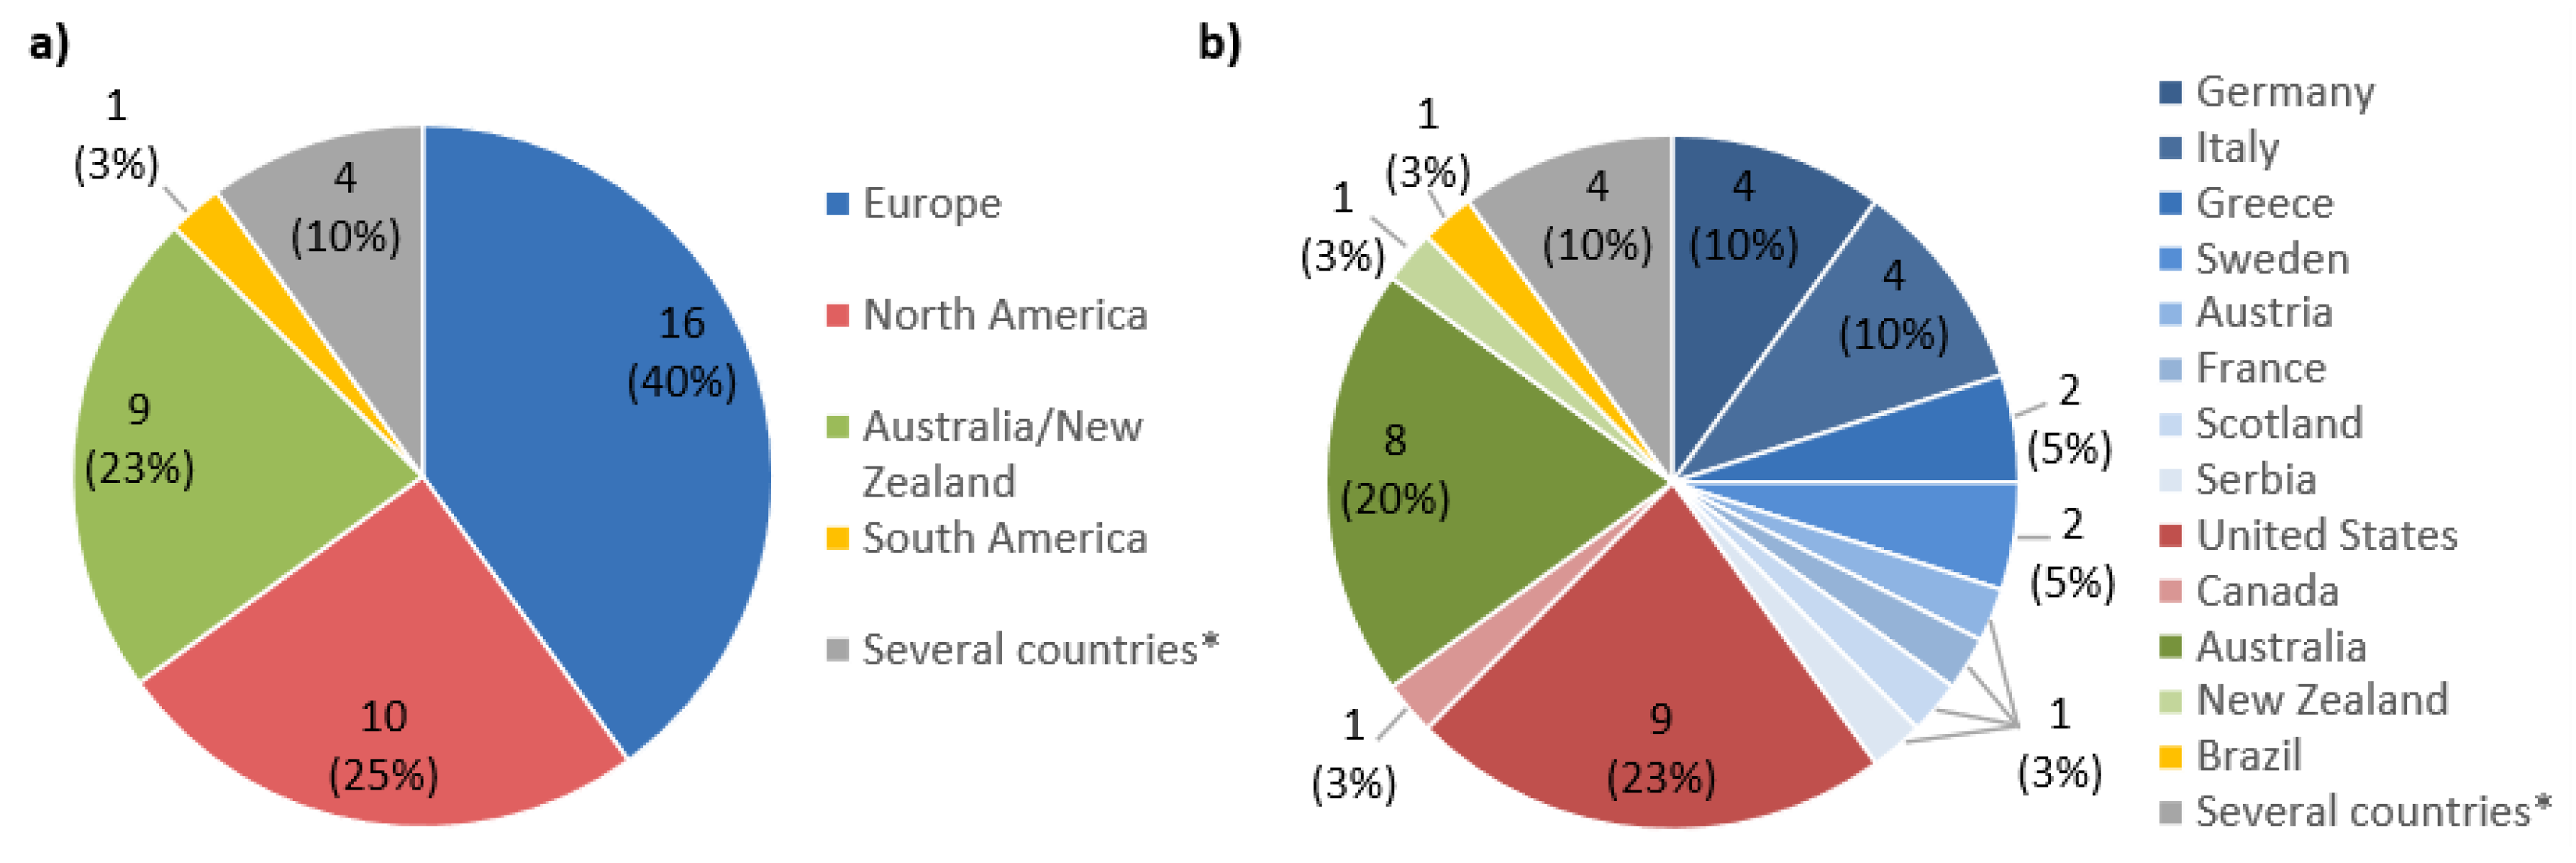
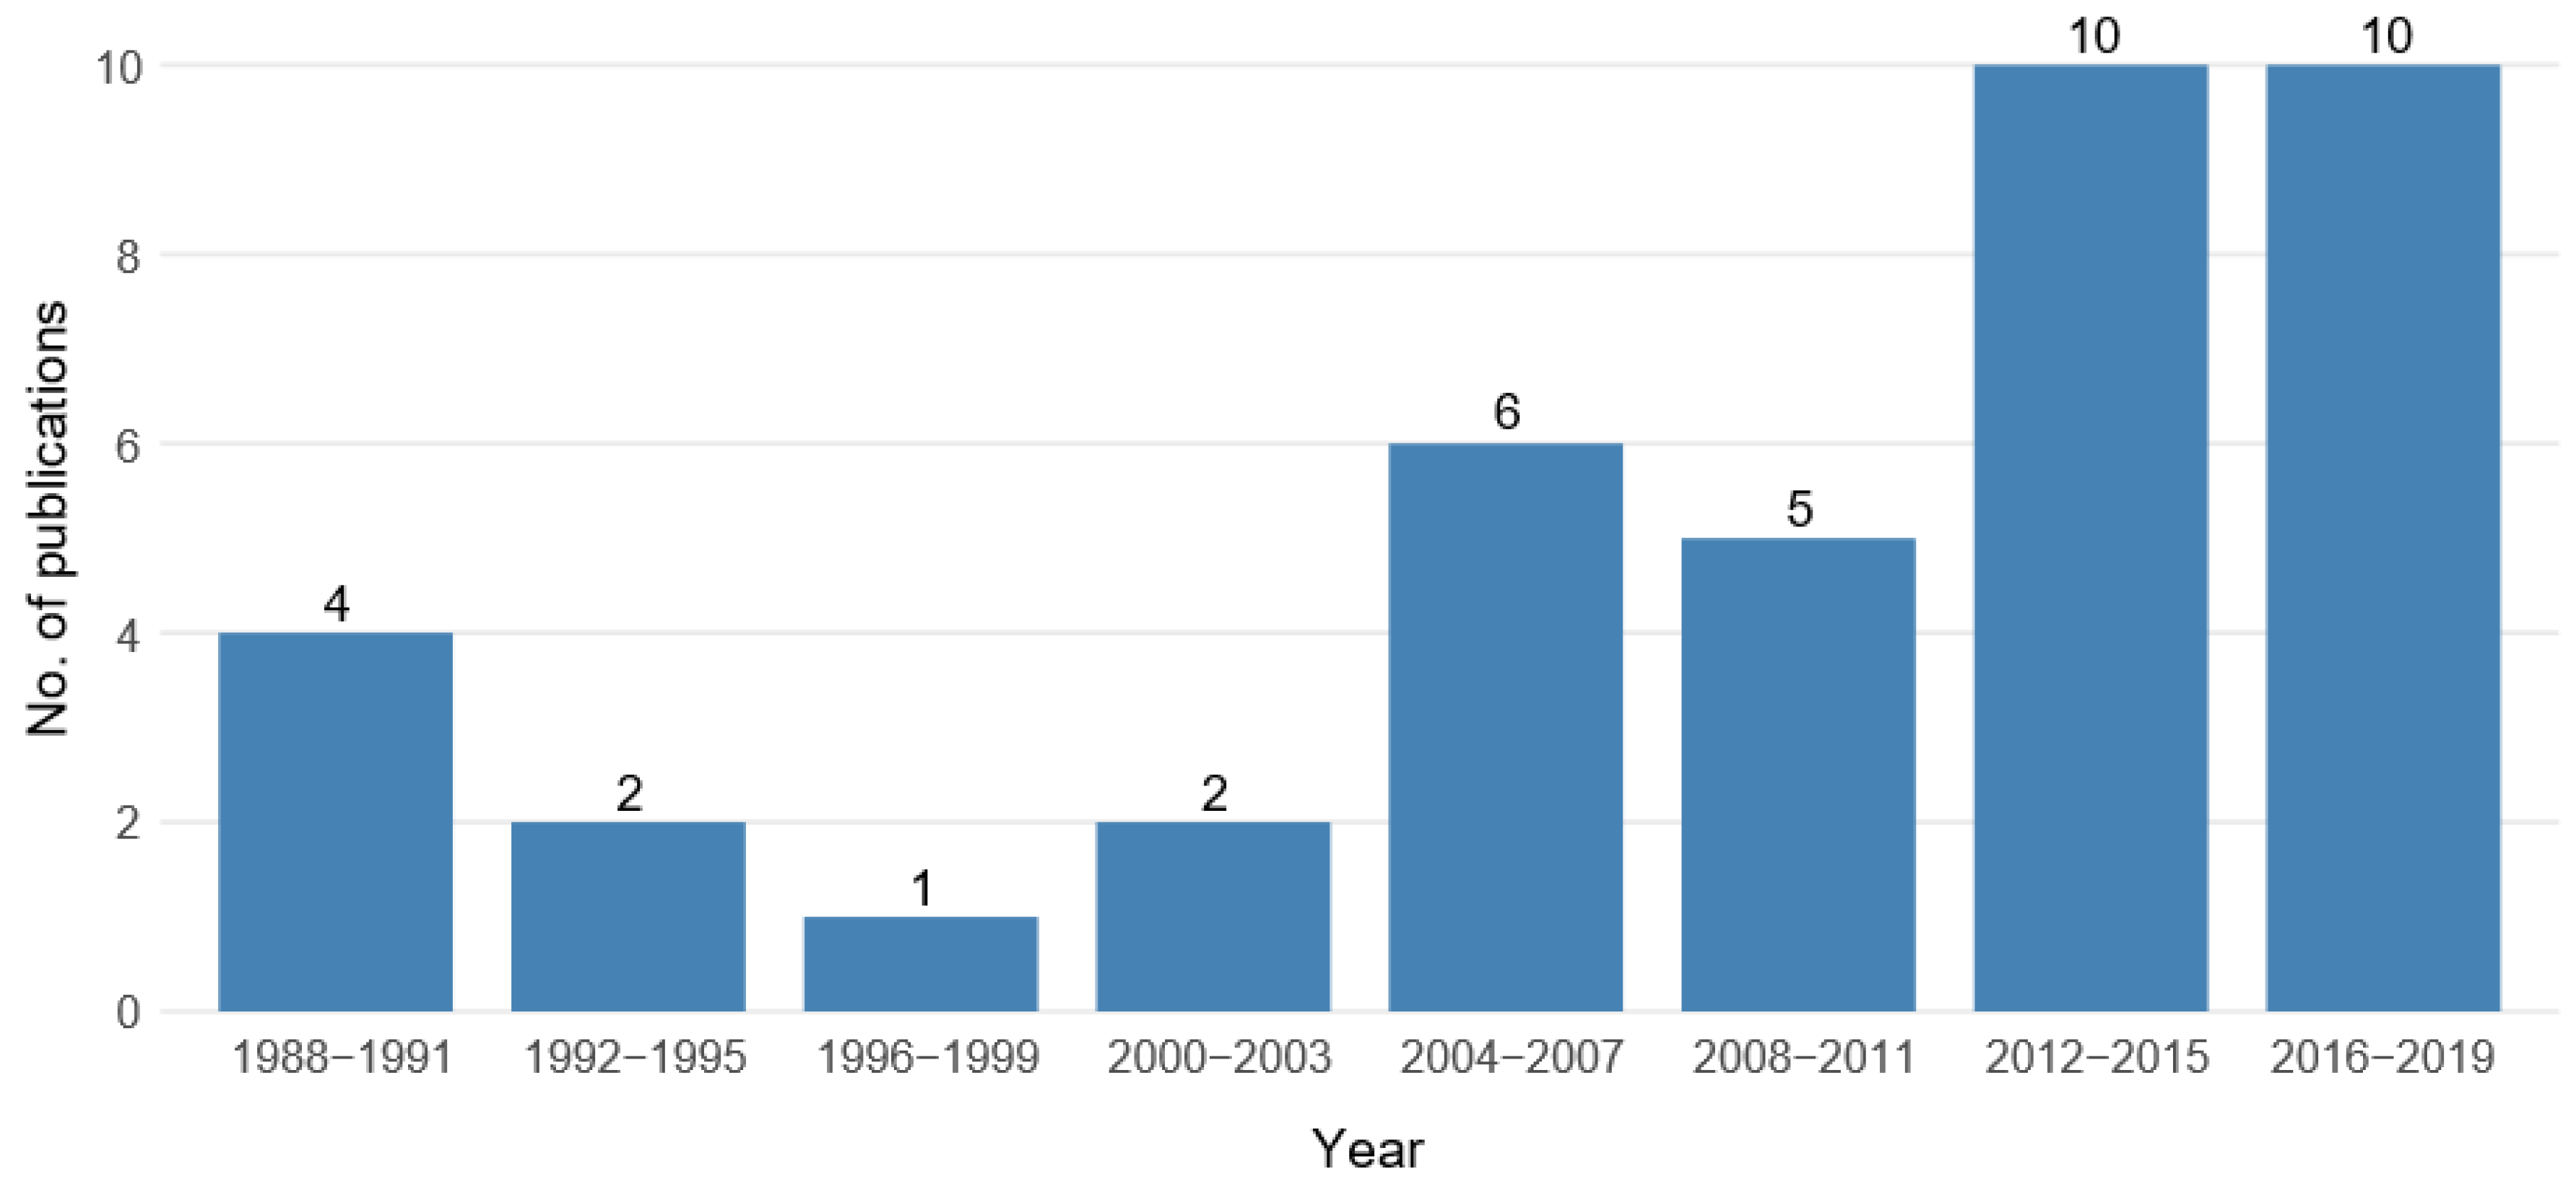
3.2. Study Characteristics
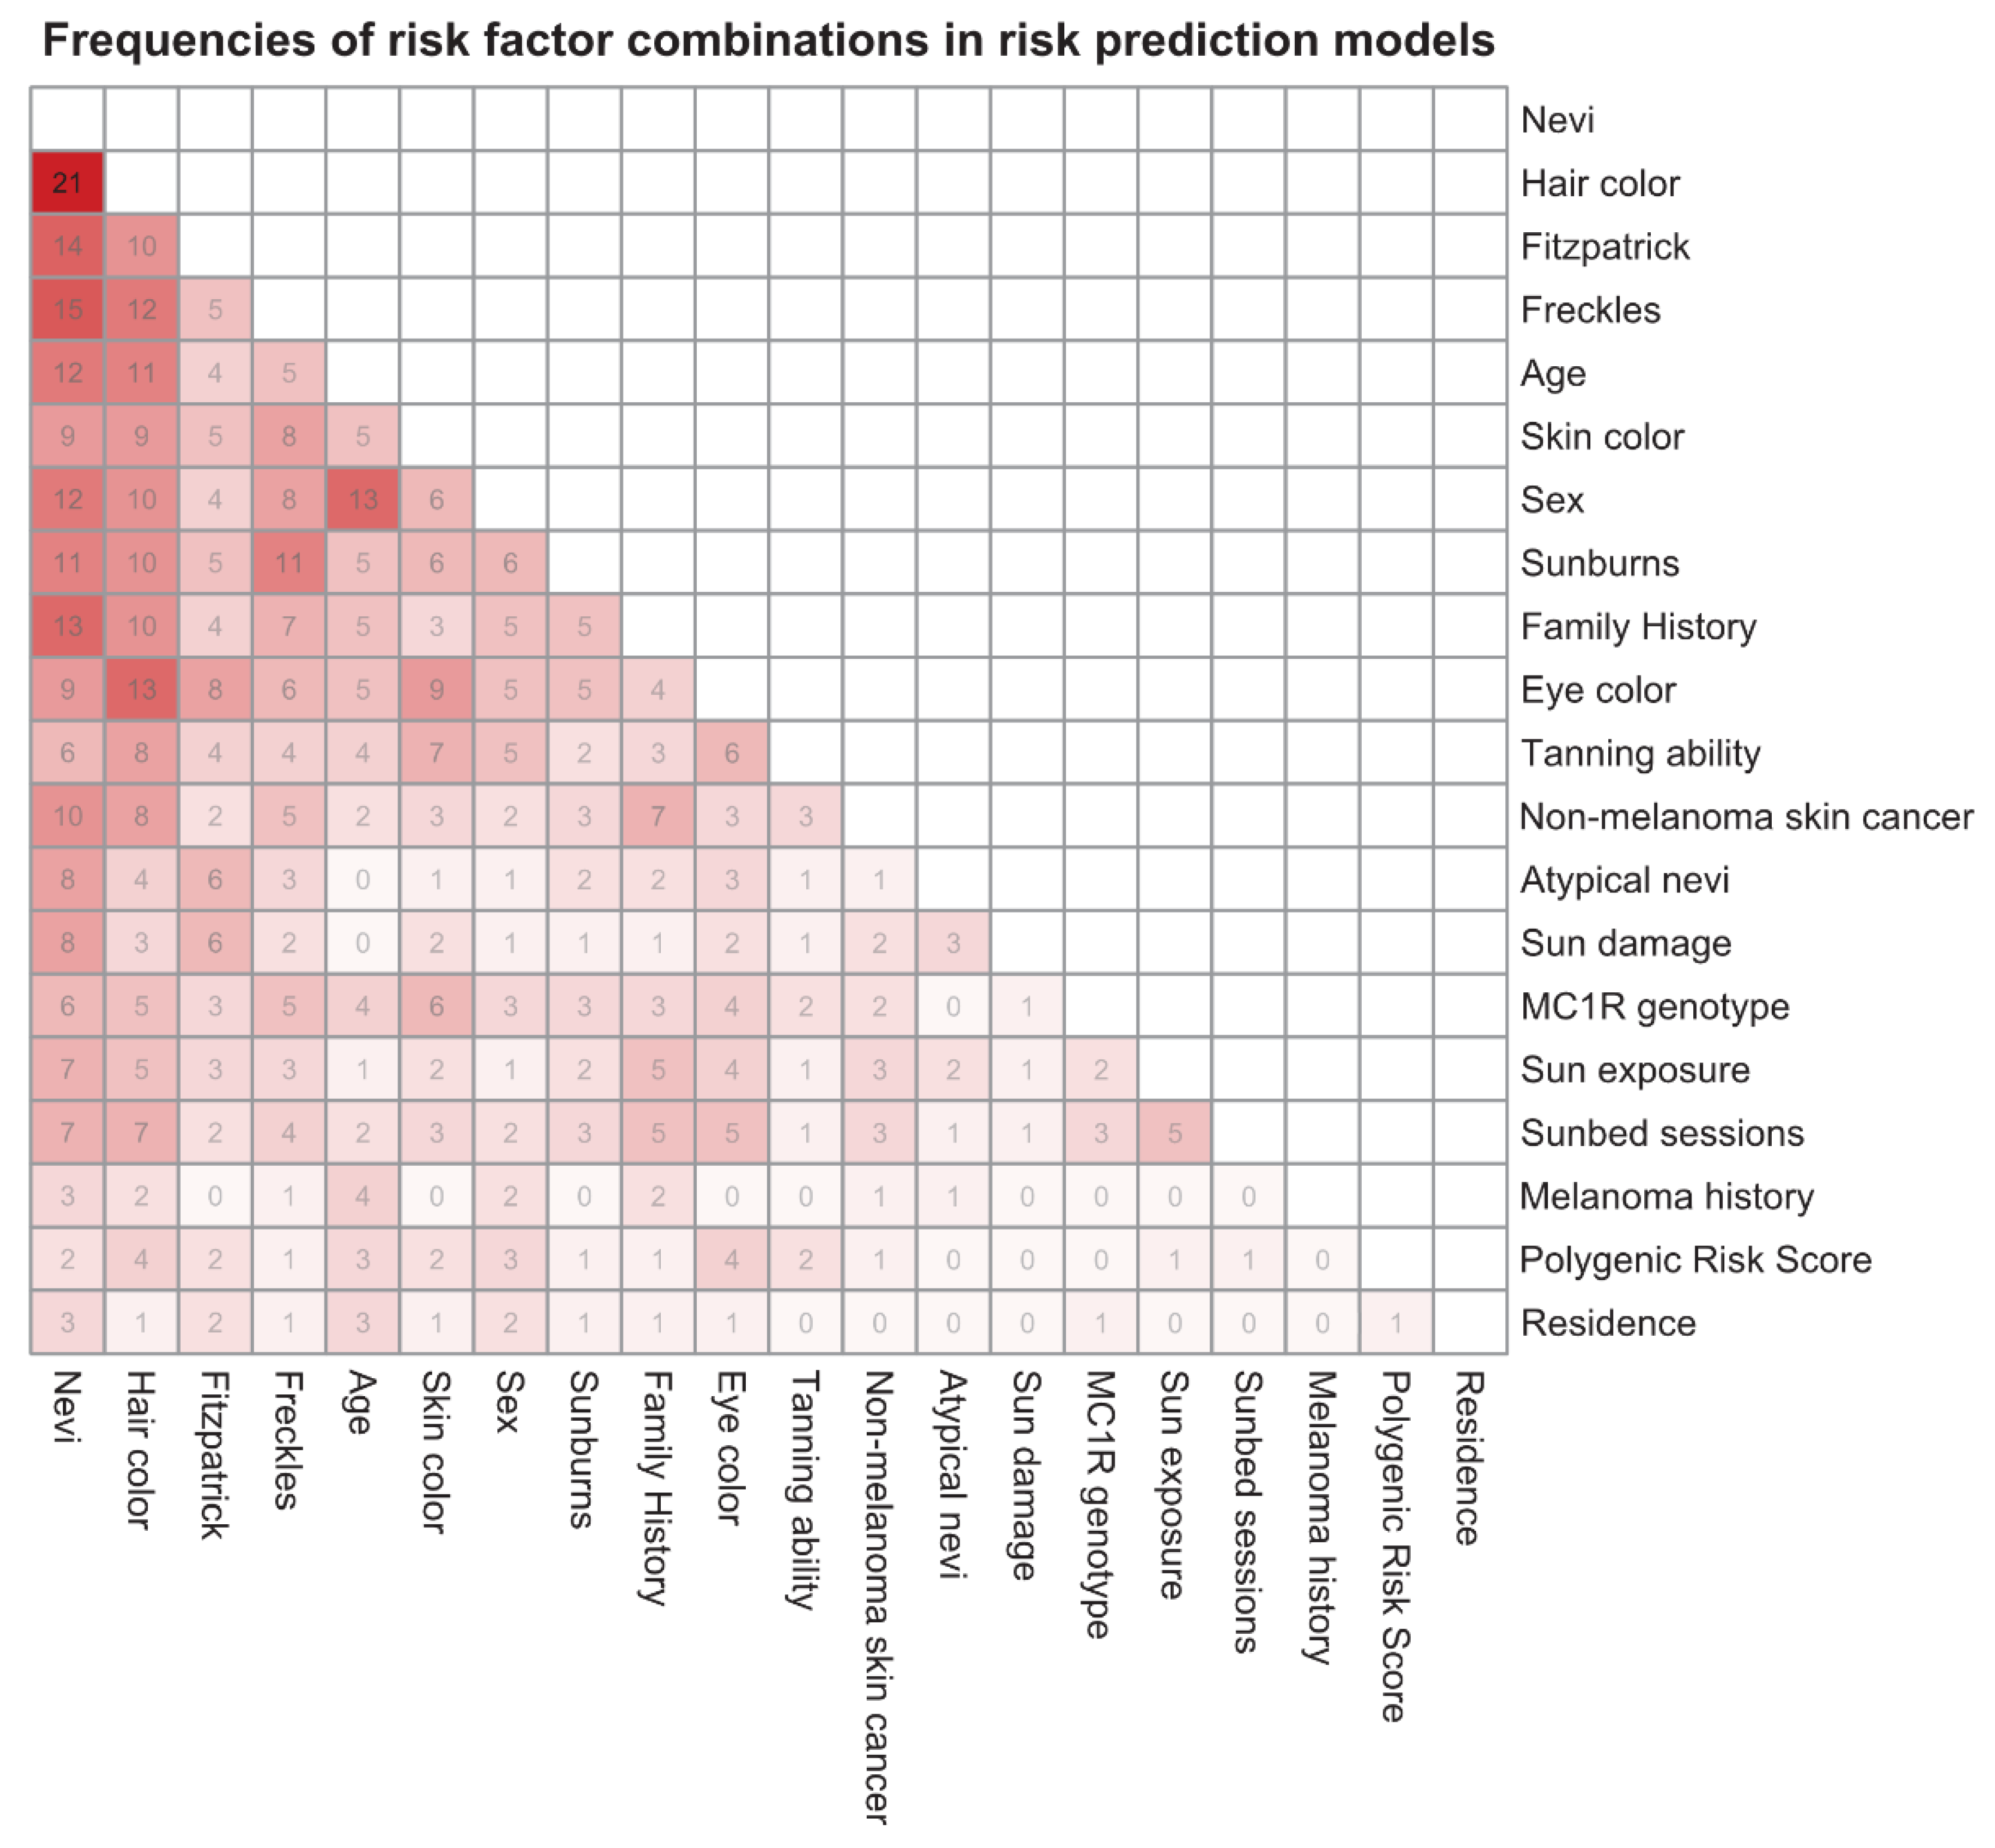
3.3. Risk Factors Included in the Prediction Models
3.4. Validation and Model Performance
4. Discussion
5. Conclusions
Supplementary Materials
Author Contributions
Funding
Conflicts of Interest
Appendix A

| Author (Year) | Study Design | Size of Study Sample | Year(s) of Data Collection | Country | Analytic Model | Risk Measure | Variables in Final Model (1) |
|---|---|---|---|---|---|---|---|
| English and Armstrong (1988) [20] | Case-control study | 511 cases, 511 controls | 1980–1981 | Australia | Logistic regression | Risk score | Number of raised nevi on arms, age on arrival in Australia, mean time spent outdoors in summer aged 10–24, family history, personal history of non-melanoma skin cancer |
| Garbe et al. (1989) [25] | Case-control study | 200 cases, 200 cases | 1987 | Germany | Logistic regression | Relative risks | Number of melanocytic common nevi, number of atypical nevi, actinic lentigines, occupational sun exposure, skin type |
| MacKie et al. (1989) [30] | Case-control study | 280 cases, 280 controls | 1987 | Scotland | Logistic regression | Relative risk (risk groups) | Benign nevi >2 mm, freckling, atypical nevi >5 mm, episodes of severe sunburn |
| Augustsson et al. (1991) [40] | Case-control study | 121 cases, 379 controls | 1986–1988 | Sweden | Logistic regression | Relative risks | Skin type, hair color, eye color, total body nevus ≥2 mm count, number of dysplastic nevi |
| Marret et al. (1992) [32] | Case-control study | 583 cases, 608 controls | 1984–1986 | Canada | Logistic regression | Relative risk | Hair color, skin reaction to repeated sun exposure, freckle density, nevi density |
| Garbe et al. (1994) [24] | Case-control study | 513 cases, 498 controls | 1990–1991 | Germany | Logistic regression | Relative risk estimates (risk groups) | Number of melanocytic common nevi, actinic lentigines, atypical nevi, skin type |
| Barbini et al. (1998) [17] | Case-control study | 150 cases, 546 controls | 1992–1995 | Italy | Linear discriminant analysis | Risk score (negative score → low risk) | Colorimetric variables, Fitzpatrick |
| Landi et al. (2001) [29] | Case-control study | 183 cases, 179 controls | 1994–1999 | Italy | Logistic regression | Odds ratios | Dysplastic nevi, skin color, tanning ability, eye color |
| Harbauer e al. (2003) [28] | Case-control study | 202 cases, 202 controls | 2001 | Austria | Logistic regression | Odds ratios | Skin type, UV damage, number of nevi |
| Dwyer et al. (2004) [19] | Case-control study | 244 cases, 483 controls | 1998–1999 | Australia | Logistic regression | Odds ratios | MC1R genotype, melanin density |
| Fargnoli et al. (2004) [21] | Case-control study | 100 cases, 200 controls | 2000–2001 | Italy | Logistic regression | Relative risk estimates (high risk: ≥ 2 (3) risk factors in model 3 (1)) | Model 1: Hair color, eye color, skin type Model 2: Hair color, eye color, skin type, occupational sun exposure, atypical nevi Model 3: Skin type, sun exposure, nevi, atypical nevi Model 4: Skin type, occupational sun exposure, nevi, atypical nevi |
| Cho et al. (2005) [18] | Cohort study | 535 cases, total 178,155 | 1976, 1986, 1989 | United States | Gail method | Risk score and 10-years-absolute risk | Sex, age, family history, sunburns, number of nevi on arms, hair color |
| Whiteman and Green (2005) [35] | Published case-control studies | NA | NA | Several countries | Not reported | 10-years absolute risk | Age, place of residence, number of melanocytic nevi, skin color, MC1R genotype |
| Fears et al. (2006) [22] | Case-control study | 718 cases, 945 controls | 1991–1992 | United States | Gail method | 5-year-absolute risk (high risk: p ≥ 0.15%) | Sex, skin color, sunburns, number of moles >5 mm (only men), number of moles ≥2 mm, freckling, severe sun damage (only men), tanning ability (only women) |
| Goldberg et al. (2007) [26] | Cohort study | 3329 cases, total 362,804 | 2001–2005 | United States | Logistic regression | Risk score (high risk: score 4–5) | Sex, regular dermatologist, history of previous melanoma, mole changing, age |
| Fortes et al. (2010) [23] | Case-control study | 304 cases, 305 controls | 2001–2003 | Italy | Risk score was calculated using effect estimates from meta-analysis | Individual risk score (high risk: risk score ≥ 3) | Freckles in childhood, skin color, number of common nevi, hair color, sunburns in childhood |
| Mar et al. (2011) [31] | Published meta-analysis and registry data | NA | NA | Australia | Gail method | 5-year-absolute risk | Common nevi, atypical nevi, freckles, hair color, family history, non-melanoma skin cancer, personal melanoma history |
| Nielsen et al. (2011) [33] | Cohort study | 215 cases, total 29,520 | 1990–1992 (Followup: –2007) | Sweden | Cox regression | Hazard ratios for each risk factor | Family history, number of nevi, hair color, sunbathing vacations, sunbed use |
| Quéreux et al. (2011) [37] | Case-control study | 171 cases, 1390 controls | 2007 | France | Gail method, logistic regression and combinatorial analysis | Risk Score | Gail method: Sunburn in childhood, family history, number of common nevi on arms, density of freckles, skin type, recalled total sun exposure Logistic regression and combinatorial analysis: Sex, age, skin type, presence of freckles, number of nevi on arms, severe blistering sunburn in childhood, life in a country at low latitude, family history |
| Williams et al. (2011) [36] | Case-control study | 386 cases, 727 controls | 1997 | United States | Logistic regression | Risk score (high risk: top 15%) | Sex, age, number of severe sunburns, hair color, freckles, number of raised moles, non-melanoma skin cancer history |
| Guther et al. (2012) [27] | Cohort study | 250 cases, total 108,281 | 2005–2006 | Germany | Logistic regression | Risk score (high risk: >0.0034) | Age, hair color, personal history of melanoma, suspicious melanocytic lesions |
| Smith et al. (2012) [39] | Case-control study | 923 cases, 813 controls | Not reported | United States | Not reported | Not reported | Model A: Sex, age, hair color, eye color, mole count, freckling, family melanoma history Model B: Model A + outdoor UV, indoor UV, MC1R |
| Bakos et al. (2013) [16] | Case-control study | 53 cases, 66 controls | 2005–2008 | Brazil | Risk score calculated using effect estimates from meta-analysis | Risk score (high risk: >3) | Presence of freckles in childhood, skin color, eye color, hair color, sunburn episodes throughout life |
| Cust et al. (2013) [45] | Case-control study | 413 cases, 263 controls | 2000–2002 | Australia | Logistic regression | Odds ratios | Base model: Age, sex, city Self-reported model: MC1R genotype, nevi, pigmentation score (2), sun and sunbed exposure (3), family history, non-melanoma skin cancer Physician-measured model: Nevi, MC1R genotype, non-melanoma skin cancer, solar lentigines, family history, pigmentation score (4) |
| Fang et al. (2013) [59] | Multiple case-control studies | 2298 cases, 6652 controls | NA | United States | Logistic regression | Odds ratios | Model 1: Single SNP Model 2: PRS (5) Model 3: Sex + age Model 4: Sex + age + pigmentation Model 5: Sex + age + pigmentation + PRS |
| Stefanaki et al. (2013) [34] | Case-control study | 284 cases, 284 controls | NA | Greece | Logistic regression | Odds ratios | Model A: Eye color, hair color, skin color, skin type, tanning, sunburns Model B: All predictors in model A + 3 strongest SNPs Model C: All predictors in model A + all SNPs |
| Nikolic et al. (2014) [57] | Case-control study | 341 cases, 356 controls | 2001–2012 | Serbia | Logistic regression + decision tree | Absolute risk | Level of education, intermitted exposure, use of sunbeds, HCT, solar damage of skin, Fitzpatrick, hair color, eye color, number of common nevi, number of dysplastic nevi, congenital nevi |
| Penn et al. (2014) [56] | Case-control study | 875 cases, 765 controls | 2004–2007 | United States | Logistic regression | Odds ratios | Base model: Age, sex, hair color, eye color, skin color, freckles, mole phenotype Full model: Base model + sun burns, indoors tanning, MC1R genotype |
| Sneyd et al. (2014) [61] | Case-control study | 368 cases, 270 controls | 1992–1994 | New Zealand | Logistic regression + Gail method | 5-year-absolute risk | Women: Skin color, 1st degree relative with large or unusual moles, number of moles, personal history of nonmelanoma skin cancer Men: Number of moles, personal history, age at diagnosis, occupation, birthplace |
| Davies et al. (2015) [51] | Multiple case-control studies | NA | NA | Several countries | Logistic regression | Risk score (with risk categories) | Hair color, skin type, freckles, family history, nevi distribution, number of large nevi, sunburn |
| Kypreou et al. (2016) [54] | Case-control study | 800 cases, 800 controls | 2000–2014 | Greece | Logistic regression | Odds ratios | Genetic risk score (6), age, sex, eye color, hair color, skin color, phototype, tanning ability |
| Vuong et al. (2016) [49] | Case-control study | 629 cases, 535 controls | 2000–2002 | Australia | Gail method | 20-year-absolute risk | Hair color, nevi density, family history, personal history of non-melanoma skin cancer, sunbed use |
| Cho et al. (2018) [58] | Cohort study | 422/289 cases (lifetime/incident melanoma); total 19,102 | NA–2015 | United States | Logistic regression + Cox regression | Odds ratios and hazard ratios | Genetic risk score (7) |
| Cust et al. (2018) [62] | Case-control study | 629 cases, 535 controls | 2000–2002 | Australia | Logistic regression | Odds ratios | Base model: Family history, hair color, nevi, personal history of non-melanoma skin cancer, sunburns in childhood, sunbed sessions, freckles, eye color, sun exposure Full model: Base model + PRS (8) |
| Gu et al. (2018) [60] | Case-control study | 15,976 cases, 25,504 controls | NA | Several countries | Logistic regression | 10- and 20-year-absolute risk | Model 1: Age, sex, country Model 2: (1) + eye color, hair color, skin type, common nevi Model 3: (1) + PRS (9) Model 4: (2) + PRS |
| Hübner et al. (2018) [53] | Cohort study based on data from SCREEN project | 585 cases, total 354,635 | 2003–2004 | Germany | Logistic regression | Odds ratios | Sex, age, personal melanoma history, family history, multiple common nevi, atypical nevi, congenital nevi |
| Olsen et al. (2018) [52] | Cohort study | 655 cases, total 41,954 | 2011–2014 | Australia | Cox regression | Hazard ratios | Model 1 (invasive melanoma): Age, sex, tanning ability, moles at age 21, hair color, number of previous skin lesions treated destructively, sunscreen use Model 2 (all melanoma): (1) + ethnicity, private health insurance, family history, past history of excisions for skin cancer, skin checks in past 3 years |
| Richter and Khoshgoftaar (2018) [55] | Cohort study based on EHR data | 17,246 cases, total 9,531,408 | 2011–2017 | United States | Logistic regression, decision tree + random forest | Risk score | Not reported |
| Tagliabue et al. (2018) [46] | Case-control study | 3830 cases, 2619 controls | NA | Several countries | Logistic regression | Odds ratios | Base model: Age, sex, sunburns, number of common nevi, RH-phenotype Base model + MC1R genotype |
| Vuong et al. (2019) [50] | Case-control study | 461 cases, 329 controls | 2000–2002 | Australia | Logistic regression | Relative risks | Number of nevi, solar lentigines, hair color, personal history of keratinocytic cancer |
References
- Matthews, N.H.; Li, W.Q.; Qureshi, A.A.; Weinstock, M.A.; Cho, E. Epidemiology of melanoma. In Cutaneous Melanoma: Etiology and Therapy; Ward, W.H., Farma, J.M., Eds.; Codon Publications: Brisbane, Australia, 2017. [Google Scholar]
- Aitken, J.F.; Elwood, M.; Baade, P.D.; Youl, P.; English, D. Clinical whole-body skin examination reduces the incidence of thick melanomas. Int. J. Cancer 2010, 126, 450–458. [Google Scholar] [CrossRef] [PubMed]
- Ferlay, J.; Soerjomataram, I.; Dikshit, R.; Eser, S.; Mathers, C.; Rebelo, M.; Parkin, D.M.; Forman, D.; Bray, F. Cancer incidence and mortality worldwide: Sources, methods and major patterns in GLOBOCAN 2012. Int. J. Cancer 2015, 136, E359–E386. [Google Scholar] [CrossRef] [PubMed]
- Erdmann, F.; Lortet-Tieulent, J.; Schuz, J.; Zeeb, H.; Greinert, R.; Breitbart, E.W.; Bray, F. International trends in the incidence of malignant melanoma 1953–2008—Are recent generations at higher or lower risk? Int. J. Cancer 2013, 132, 385–400. [Google Scholar] [CrossRef] [PubMed]
- International Agency for Research on Cancer. Available online: https://gco.iarc.fr/today/online-analysis-table?v=2018&mode=cancer&mode_population=continents&population=900&populations=900&key=asr&sex=0&cancer=39&type=0&statistic=5&prevalence=0&population_group=0&ages_group%5B%5D=0&ages_group%5B%5D=17&group_cancer=1&include_nmsc=1&include_nmsc_other=1 (accessed on 23 July 2020).
- Bertz, J. Epidemiologie des malignen Melanoms der Haut. Bundesgesunheitsbl Gesundh. Gesundh. 2001, 44, 484–490. [Google Scholar] [CrossRef]
- Breitbart, E.W.; Waldmann, A.; Nolte, S.; Capellaro, M.; Greinert, R.; Volkmer, B.; Katalinic, A. Systematic skin cancer screening in Northern Germany. J. Am. Acad Dermatol. 2012, 66, 201–211. [Google Scholar] [CrossRef]
- Boniol, M.; Autier, P.; Gandini, S. Melanoma mortality following skin cancer screening in Germany. BMJ Open 2015, 5, e008158. [Google Scholar] [CrossRef] [PubMed]
- Halvorsen, J.A.; Loberg, M.; Gjersvik, P.; Roscher, I.; Veierod, M.B.; Robsahm, T.E.; Nilsen, L.T.N.; Kalager, M.; Bretthauer, M. Why a randomized melanoma screening trial is not a good idea. Br. J. Dermatol. 2018, 179, 532–533. [Google Scholar] [CrossRef]
- U. S. Preventive Services Task Force; Bibbins-Domingo, K.; Grossman, D.C.; Curry, S.J.; Davidson, K.W.; Ebell, M.; Epling, J.W., Jr.; Garcia, F.A.; Gillman, M.W.; Kemper, A.R.; et al. Screening for Skin Cancer: US Preventive Services Task Force Recommendation Statement. JAMA 2016, 316, 429–435. [Google Scholar]
- Freedberg, K.A.; Geller, A.C.; Miller, D.R.; Lew, R.A.; Koh, H.K. Screening for malignant melanoma: A cost-effectiveness analysis. J. Am. Acad Dermatol. 1999, 41, 738–745. [Google Scholar] [CrossRef]
- Watts, C.G.; Cust, A.E.; Menzies, S.W.; Mann, G.J.; Morton, R.L. Cost-effectiveness of skin surveillance through a specialized clinic for patients at high risk of melanoma. J. Clin. Oncol. 2017, 35, 63–71. [Google Scholar] [CrossRef]
- Usher-Smith, J.A.; Emery, J.; Kassianos, A.P.; Walter, F.M. Risk prediction models for melanoma: A systematic review. Cancer Epidemiol. Biomark. Prev. 2014, 23, 1450–1463. [Google Scholar] [CrossRef] [PubMed]
- Glanz, K.; Volpicelli, K.; Jepson, C.; Ming, M.E.; Schuchter, L.M.; Armstrong, K. Effects of Tailored Risk Communications for Skin Cancer Prevention and Detection: The PennSCAPE Randomized Trial. Cancer Epidemiol. Biomark. Prev. 2015, 24, 415–421. [Google Scholar] [CrossRef] [PubMed]
- Vuong, K.; McGeechan, K.; Armstrong, B.K.; Cust, A.E. Risk prediction models for incident primary cutaneous melanoma: A systematic review. JAMA Dermatol. 2014, 150, 434–444. [Google Scholar] [CrossRef]
- Bakos, L.; Mastroeni, S.; Bonamigo, R.R.; Melchi, F.; Pasquini, P.; Fortes, C. A melanoma risk score in a Brazilian population. An. Bras. Dermatol. 2013, 88, 226–232. [Google Scholar] [CrossRef] [PubMed]
- Barbini, P.; Cevenini, G.; Rubegni, P.; Massai, M.R.; Flori, M.L.; Carli, P.; Andreassi, L. Instrumental measurement of skin colour and skin type as risk factors for melanoma: A statistical classification procedure. Melanoma Res. 1998, 8, 439–447. [Google Scholar] [CrossRef]
- Cho, E.; Rosner, B.A.; Feskanich, D.; Colditz, G.A. Risk factors and individual probabilities of melanoma for whites. J. Clin. Oncol. 2005, 23, 2669–2675. [Google Scholar] [CrossRef]
- Dwyer, T.; Stankovich, J.M.; Blizzard, L.; FitzGerald, L.M.; Dickinson, J.L.; Reilly, A.; Williamson, J.; Ashbolt, R.; Berwick, M.; Sale, M.M. Does the addition of information on genotype improve prediction of the risk of melanoma and nonmelanoma skin cancer beyond that obtained from skin phenotype? Am. J. Epidemiol. 2004, 159, 826–833. [Google Scholar] [CrossRef]
- English, D.R.; Armstrong, B.K. Identifying people at high-risk of cutaneous malignant-melanoma:Results from a case control study in Western Australia. Brit. Med. J. 1988, 296, 1285–1288. [Google Scholar] [CrossRef]
- Fargnoli, M.C.; Piccolo, D.; Altobelli, E.; Formicone, F.; Chimenti, S.; Peris, K. Constitutional and environmental risk factors for cutaneous melanoma in an Italian population. A case-control study. Melanoma Res. 2004, 14, 151–157. [Google Scholar] [CrossRef]
- Fears, T.R.; Guerry, D.; Pfeiffer, R.M.; Sagebiel, R.W.; Elder, D.E.; Halpern, A.; Holly, E.A.; Hartge, P.; Tucker, M.A. Identifying individuals at high risk of melanoma: A practical predictor of absolute risk. J. Clin. Oncol. 2006, 24, 3590–3596. [Google Scholar] [CrossRef]
- Fortes, C.; Mastroeni, S.; Bakos, L.; Antonelli, G.; Alessandroni, L.; Pilla, M.A.; Alotto, M.; Zappala, A.; Manoorannparampill, T.; Bonamigo, R.; et al. Identifying individuals at high risk of melanoma: A simple tool. Eur. J. Cancer Prev. 2010, 19, 393–400. [Google Scholar] [CrossRef] [PubMed]
- Garbe, C.; Buttner, P.; Weiss, J.; Soyer, H.P.; Stocker, U.; Kruger, S.; Roser, M.; Weckbecker, J.; Panizzon, R.; Bahmer, F.; et al. Risk-factors for developing cutaneous melanoma and criteria for identifying persons at risk—Multicenter case-control study of the Central Malignant Melanoma Registry of the German Dermatological Society. J. Investig. Dermatol. 1994, 102, 695–699. [Google Scholar] [CrossRef] [PubMed]
- Garbe, C.; Kruger, S.; Stadler, R.; Guggenmoosholzmann, I.; Orfanos, C.E. Markers and relative risk in a German population for developing malignant-melanoma. Int. J. Dermatol. 1989, 28, 517–523. [Google Scholar] [CrossRef] [PubMed]
- Goldberg, M.S.; Doucette, J.T.; Lim, H.W.; Spencer, J.; Carucci, J.A.; Rigel, D.S. Risk factors for presumptive melanoma in skin cancer screening: American Academy of Dermatology National Melanoma/Skin Cancer Screening Program experience 2001–2005. J. Am. Acad Dermatol. 2007, 57, 60–66. [Google Scholar] [CrossRef]
- Guther, S.; Ramrath, K.; Dyall-Smith, D.; Landthaler, M.; Stolz, W. Development of a targeted risk-group model for skin cancer screening based on more than 100 000 total skin examinations. J. Eur. Acad Dermatol. 2012, 26, 86–94. [Google Scholar] [CrossRef]
- Harbauer, A.; Binder, M.; Pehamberger, H.; Wolff, K.; Kittler, H. Validity of an unsupervised self-administered questionnaire for self-assessment of melanoma risk. Melanoma Res. 2003, 13, 537–542. [Google Scholar] [CrossRef]
- Landi, M.T.; Baccarelli, A.; Calista, D.; Pesatori, A.; Fears, T.; Tucker, M.A.; Landi, G. Combined risk factors for melanoma in a Mediterranean population. Br. J. Cancer 2001, 85, 1304–1310. [Google Scholar] [CrossRef]
- MacKie, R.M.; Freudenberger, T.; Aitchison, T.C. Personal risk-factor chart for cutaneous melanoma. Lancet 1989, 2, 487–490. [Google Scholar] [CrossRef]
- Mar, V.; Wolfe, R.; Kelly, J.W. Predicting melanoma risk for the Australian population. Australas. J. Dermatol. 2011, 52, 109–116. [Google Scholar] [CrossRef]
- Marrett, L.D.; King, W.D.; Walter, S.D.; From, L. Use of host factors to identify people at high-risk for cutaneous malignant-melanoma. CMAJ 1992, 147, 445–452. [Google Scholar]
- Nielsen, K.; Masback, A.; Olsson, H.; Ingvar, C. A prospective, population-based study of 40,000 women regarding host factors, UV exposure and sunbed use in relation to risk and anatomic site of cutaneous melanoma. Int. J. Cancer 2012, 131, 706–715. [Google Scholar] [CrossRef]
- Stefanaki, I.; Panagiotou, O.A.; Kodela, E.; Gogas, H.; Kypreou, K.P.; Chatzinasiou, F.; Nikolaou, V.; Plaka, M.; Kalfa, I.; Antoniou, C.; et al. Replication and predictive value of SNPs associated with melanoma and pigmentation traits in a Southern European case-control study. PLoS ONE 2013, 8, e55712. [Google Scholar] [CrossRef] [PubMed]
- Whiteman, D.C.; Green, A.C. A risk prediction tool for melanoma? Cancer Epidemiol. Biomark. Prev. 2005, 14, 761–763. [Google Scholar] [CrossRef] [PubMed]
- Williams, L.H.; Shors, A.R.; Barlow, W.E.; Solomon, C.; White, E. Identifying persons at highest risk of melanoma using self-assessed risk factors. J. Clin. Exp. Dermatol. Res. 2011, 2, 129. [Google Scholar]
- Quereux, G.; Moyse, D.; Lequeux, Y.; Jumbou, O.; Brocard, A.; Antonioli, D.; Dreno, B.; Nguyen, J.M. Development of an individual score for melanoma risk. Eur. J. Cancer Prev. 2011, 20, 217–224. [Google Scholar] [CrossRef] [PubMed]
- Weiss, J.; Garbe, C.; Bertz, J.; Blitz, H.; Burg, G.; Hennes, B.; Jung, E.G. Risk factors for the development of malignant melanoma in West Germany. Results of a multicenter-case control study. Hautarzt 1990, 41, 309–313. [Google Scholar]
- Smith, L.A.; Qian, M.; Ng, E.; Shao, Y.; Berwick, M.; Lazovich, D.; Polsky, D. Development of a melanoma risk prediction model incorporating MC1R genotype and indoor tanning exposure. J. Clin. Oncol. 2012, 30, 8574. [Google Scholar] [CrossRef]
- Augustsson, A. Melanocytic naevi, melanoma and sun exposure. Acta Derm. Venereol. Suppl. 1991, 166, 1–34. [Google Scholar]
- Zaridze, D.G.; Mukeriia, A.F.; Basieva, T.; Shlenskaia, I.N.; Bukin Iu, V. The role of endogenous and exogenous factors in the etiology of skin melanoma. Vopr. Onkol. 1992, 38, 141–147. [Google Scholar]
- Wohlin, C. Guidelines for snowballing in systematic literature studies and a replication in software engineering. In Proceedings of the 18th International Conference on Evaluation and Assessment in Software Engineering (EASE ’14); Association for Computing Machinery: New York, NY, USA, 2014; pp. 1–10. [Google Scholar]
- Felizardo, K.R.; Mendes, E.; Kalinowski, M.; Souza, É.F.; Vijaykumar, N.L. Using forward snowballing to update systematic reviews in software engineering. In Proceedings of the 10th ACM/IEEE International Symposium on Empirical Software Engineering and Measurement; Association for Computing Machinery: Ciudad Real, Spain, 2016. [Google Scholar]
- Mendes, E.; Felizardo, K.; Wohlin, C.; Kalinowski, M. Search strategy to update systematic literature reviews in software engineering. In 2019 45th Euromicro Conference on Software Engineering and Advanced Applications (SEAA); Institute of Electrical and Electronics Engineers Inc.: Kallithea-Chalkidiki, Greece, 2019; pp. 355–362. [Google Scholar]
- Cust, A.E.; Goumas, C.; Vuong, K.; Davies, J.R.; Barrett, J.H.; Holland, E.A.; Schmid, H.; Agha-Hamilton, C.; Armstrong, B.K.; Kefford, R.F.; et al. MC1R genotype as a predictor of early-onset melanoma, compared with self-reported and physician-measured traditional risk factors: An Australian case-control-family study. BMC Cancer 2013, 13, 406. [Google Scholar] [CrossRef]
- Tagliabue, E.; Gandini, S.; Bellocco, R.; Maisonneuve, P.; Newton-Bishop, J.; Polsky, D.; Lazovich, D.; Kanetsky, P.A.; Ghiorzo, P.; Gruis, N.A.; et al. MC1R variants as melanoma risk factors independent of at-risk phenotypic characteristics: A pooled analysis from the M-SKIP project. Cancer Manag. Res. 2018, 10, 1143–1154. [Google Scholar] [CrossRef]
- Steyerberg, E.W.; Vergouwe, Y. Towards better clinical prediction models: Seven steps for development and an ABCD for validation. Eur. Heart J. 2014, 35, 1925–1931. [Google Scholar] [CrossRef] [PubMed]
- Steyerberg, E.W.; Vickers, A.J.; Cook, N.R.; Gerds, T.; Gonen, M.; Obuchowski, N.; Pencina, M.J.; Kattan, M.W. Assessing the performance of prediction models: A framework for traditional and novel measures. Epidemiology 2010, 21, 128–138. [Google Scholar] [CrossRef]
- Vuong, K.; Armstrong, B.K.; Weiderpass, E.; Lund, E.; Adami, H.O.; Veierod, M.B.; Barrett, J.H.; Davies, J.R.; Bishop, D.T.; Whiteman, D.C.; et al. Development and external validation of a melanoma risk prediction model based on self-assessed risk factors. JAMA Dermatol. 2016, 152, 889–896. [Google Scholar] [CrossRef]
- Vuong, K.; Armstrong, B.K.; Drummond, M.; Hopper, J.L.; Barrett, J.H.; Davies, J.R.; Bishop, D.T.; Newton-Bishop, J.; Aitken, J.F.; Giles, G.G.; et al. Development and external validation study of a melanoma risk prediction model incorporating clinically assessed naevi and solar lentigines. Br. J. Dermatol. 2019, 182, 1262–1268. [Google Scholar] [CrossRef] [PubMed]
- Davies, J.R.; Chang, Y.M.; Bishop, D.T.; Armstrong, B.K.; Bataille, V.; Bergman, W.; Berwick, M.; Bracci, P.M.; Elwood, J.M.; Ernstoff, M.S.; et al. Development and validation of a melanoma risk score based on pooled data from 16 case-control studies. Cancer Epidem. Biomar. Prev. 2015, 24, 817–824. [Google Scholar] [CrossRef] [PubMed]
- Olsen, C.M.; Pandeya, N.; Thompson, B.S.; Dusingize, J.C.; Webb, P.M.; Green, A.C.; Neale, R.E.; Whiteman, D.C.; Study, Q. Risk stratification for melanoma: Models derived and validated in a purpose-designed prospective cohort. J. Natl. Cancer Inst. 2018, 110, 1075–1083. [Google Scholar] [CrossRef]
- Hübner, J.; Waldmann, A.; Eisemann, N.; Noftz, M.; Geller, A.C.; Weinstock, M.A.; Volkmer, B.; Greinert, R.; Breitbart, E.W.; Katalinic, A. Association between risk factors and detection of cutaneous melanoma in the setting of a population-based skin cancer screening. Eur. J. Cancer Prev. 2018, 27, 563–569. [Google Scholar] [CrossRef]
- Kypreou, K.P.; Stefanaki, I.; Antonopoulou, K.; Karagianni, F.; Ntritsos, G.; Zaras, A.; Nikolaou, V.; Kalfa, I.; Chasapi, V.; Polydorou, D.; et al. Prediction of melanoma risk in a Southern European population based on a weighted genetic risk score. J. Investig. Dermatol. 2016, 136, 690–695. [Google Scholar] [CrossRef]
- Richter, A.; Khoshgoftaar, T. Melanoma risk prediction with structured electronic health records. In ACM-BCB’18: 9th ACM International Conference on Bioinformatics, Computational Biology and Health Informatics; Association for Computing Machinery: New York, NY, USA, 2018. [Google Scholar]
- Penn, L.A.; Qian, M.; Zhang, E.; Ng, E.; Shao, Y.; Berwick, M.; Lazovich, D.; Polsky, D. Development of a melanoma risk prediction model incorporating MC1R genotype and indoor tanning exposure: Impact of mole phenotype on model performance. PLoS ONE 2014, 9, e101507. [Google Scholar]
- Nikolic, J.; Loncar-Turukalo, T.; Sladojevic, S.; Marinkovic, M.; Janjic, Z. Melanoma risk prediction models. Vojnosanit. Pregl. 2014, 71, 757–766. [Google Scholar] [CrossRef] [PubMed]
- Cho, H.G.; Ransohoff, K.J.; Yang, L.Y.; Hedlin, H.; Assimes, T.; Han, J.L.; Stefanick, M.; Tang, J.Y.; Sarin, K.Y. Melanoma risk prediction using a multilocus genetic risk score in the Women’s Health Initiative cohort. J. Am. Acad Dermatol. 2018, 79, 36–41. [Google Scholar] [CrossRef] [PubMed]
- Fang, S.Y.; Han, J.L.; Zhang, M.F.; Wang, L.E.; Wei, Q.Y.; Amos, C.I.; Lee, J.E. Joint Effect of Multiple Common SNPs Predicts Melanoma Susceptibility. PLoS ONE 2013, 8, e85642. [Google Scholar] [CrossRef] [PubMed]
- Gu, F.Y.; Chen, T.H.; Pfeiffer, R.M.; Fargnoli, M.C.; Calista, D.; Ghiorzo, P.; Peris, K.; Puig, S.; Menin, C.; De Nicolo, A.; et al. Combining common genetic variants and non-genetic risk factors to predict risk of cutaneous melanoma. Hum. Mol. Genet. 2018, 27, 4145–4156. [Google Scholar] [CrossRef] [PubMed]
- Sneyd, M.J.; Cameron, C.; Cox, B. Individual risk of cutaneous melanoma in New Zealand: Developing a clinical prediction aid. BMC Cancer 2014, 14, 359. [Google Scholar] [CrossRef] [PubMed]
- Cust, A.E.; Drummond, M.; Kanetsky, P.A.; Goldstein, A.M.; Barrett, J.H.; MacGregor, S.; Law, M.H.; Iles, M.M.; Bui, M.; Hopper, J.L.; et al. Assessing the incremental contribution of common genomic variants to melanoma risk prediction in two population-based studies. J. Investig. Dermatol. 2018, 138, 2617–2624. [Google Scholar] [CrossRef] [PubMed]
- World Cancer Research Fund. Available online: https://www.wcrf.org/dietandcancer/cancer-trends/skin-cancer-statistics (accessed on 6 March 2020).
- Roberts, M.R.; Asgari, M.M.; Toland, A.E. Genome-wide association studies and polygenic risk scores for skin cancer: Clinically useful yet? Br. J. Dermatol. 2019, 181, 1146–1155. [Google Scholar] [CrossRef]
- English, D.R.; MacLennan, R.; Rivers, J.; Kelly, J.; Armstrong, B.K. Epidemiological studies of melanocytic naevi protocol for identifying and recording naevi. In IARC Internal Report No 90/002; International Agency for Research on Cancer: Lyon, France, 1990. [Google Scholar]
- Stratigos, A.J.; Fargnoli, M.C.; De Nicolo, A.; Peris, K.; Puig, S.; Soura, E.; Menin, C.; Calista, D.; Ghiorzo, P.; Mandala, M.; et al. MelaNostrum: A consensus questionnaire of standardized epidemiologic and clinical variables for melanoma risk assessment by the melanostrum consortium. J. Eur. Acad Dermatol. Venereol. 2018, 32, 2134–2141. [Google Scholar] [CrossRef]
- Cargill, J.; Lucas, R.M.; Gies, P.; King, K.; Swaminathan, A.; Allen, M.W.; Banks, E. Validation of brief questionnaire measures of sun exposure and skin pigmentation against detailed and objective measures including vitamin D status. Photochem. Photobiol. 2013, 89, 219–226. [Google Scholar] [CrossRef]
- Koster, B.; Sondergaard, J.; Nielsen, J.B.; Allen, M.; Olsen, A.; Bentzen, J. The validated sun exposure questionnaire: Association of objective and subjective measures of sun exposure in a Danish population-based sample. Br. J. Dermatol. 2017, 176, 446–456. [Google Scholar] [CrossRef]
- Parr, C.L.; Hjartåker, A.; Laake, P.; Lund, E.; Veierød, M.B. Recall bias in melanoma risk factors and measurement error effects: A nested case-control study within the Norwegian Women and Cancer Study. Am. J. Epidemiol. 2009, 169, 257–266. [Google Scholar]
- Gefeller, O. Invited Commentary: Recall bias in melanoma—Much ado about almost nothing? Am. J. Epidemiol. 2009, 169, 267–270. [Google Scholar] [PubMed]
- Veierød, M.B.; Parr, C.L.; Lund, E.; Hjartåker, A. Reproducibility of self-reported melanoma risk factors in a large cohort study of Norwegian women. Melanoma Res. 2008, 18, 1–9. [Google Scholar] [PubMed]
- Koster, B.; Sondergaard, J.; Nielsen, J.B.; Olsen, A.; Bentzen, J. Reliability and consistency of a validated sun exposure questionnaire in a population-based Danish sample. Prev. Med. Rep. 2018, 10, 43–48. [Google Scholar]
- Pfahlberg, A.B.; Gefeller, O. Errors in assessing risk factors for melanoma: Lack of reproducibility is the minor problem. Melanoma Res. 2008, 18, 300–301. [Google Scholar] [PubMed]
- Vickers, A.J. Prediction models in cancer care. CA Cancer J. Clin 2011, 61, 315–326. [Google Scholar] [PubMed]
- Collins, G.S.; Moons, K.G. Comparing risk prediction models. BMJ 2012, 344, e3186. [Google Scholar]
- Siontis, G.C.; Tzoulaki, I.; Castaldi, P.J.; Ioannidis, J.P. External validation of new risk prediction models is infrequent and reveals worse prognostic discrimination. J. Clin. Epidemiol. 2015, 68, 25–34. [Google Scholar]
- Steyerberg, E.W.; Harrell, F.E., Jr. Prediction models need appropriate internal, internal-external, and external validation. J. Clin. Epidemiol. 2016, 69, 245–247. [Google Scholar]
- Steyerberg, E.W. Clinical Prediction Models: A Practical Approach to Development, Validation, and Updating; Springer: New York, NY, USA, 2009. [Google Scholar]
- Damen, J.A.; Hooft, L.; Schuit, E.; Debray, T.P.; Collins, G.S.; Tzoulaki, I.; Lassale, C.M.; Siontis, G.C.; Chiocchia, V.; Roberts, C.; et al. Prediction models for cardiovascular disease risk in the general population: Systematic review. BMJ 2016, 353, i2416. [Google Scholar]
- Mallett, S.; Royston, P.; Waters, R.; Dutton, S.; Altman, D.G. Reporting performance of prognostic models in cancer: A review. BMC Med. 2010, 8, 21. [Google Scholar] [CrossRef] [PubMed]
- Usher-Smith, J.A.; Walter, F.M.; Emery, J.D.; Win, A.K.; Griffin, S.J. Risk prediction models for colorectal cancer: A systematic review. Cancer Prev. Res. 2016, 9, 13–26. [Google Scholar] [CrossRef] [PubMed]
- Mahar, A.L.; Compton, C.; Halabi, S.; Hess, K.R.; Gershenwald, J.E.; Scolyer, R.A.; Groome, P.A. Critical assessment of clinical prognostic tools in melanoma. Ann. Surg. Oncol. 2016, 23, 2753–2761. [Google Scholar] [CrossRef] [PubMed]
- Collins, G.S.; Mallett, S.; Omar, O.; Yu, L.M. Developing risk prediction models for type 2 diabetes: A systematic review of methodology and reporting. BMC Med. 2011, 9, 103. [Google Scholar] [CrossRef]
- Collins, G.S.; Reitsma, J.B.; Altman, D.G.; Moons, K.G. Transparent reporting of a multivariable prediction model for individual prognosis or diagnosis (TRIPOD): The TRIPOD statement. BMJ 2015, 350, g7594. [Google Scholar] [CrossRef] [PubMed]
- Leitlinienprogramm Onkologie (Deutsche Krebsgesellschaft, Deutsche Krebshilfe, AWMF). S3-Leitlinie Prävention von Hautkrebs, Langversion 1. 1. 2014, AWMF Registernummer: 032/052OL. Available online: http://leitlinienprogramm-onkologie.de/Leitlinien.7.0.html (accessed on 9 September 2020).
- QIMR Berghofer Medical Research Institute. Available online: https://publications.qimrberghofer.edu.au/Custom/QSkinMelanomaRisk (accessed on 12 September 2020).
- Melanoma Institute Australia. Available online: https://www.melanomarisk.org.au/ (accessed on 12 September 2020).
- Moher, D.; Liberati, A.; Tetzlaff, J.; Altman, D.G.; Group, P. Preferred reporting items for systematic reviews and meta-analyses: The PRISMA statement. BMJ 2009, 339, b2535. [Google Scholar] [CrossRef]
- Wolff, R.F.; Moons, K.G.M.; Riley, R.D.; Whiting, P.F.; Westwood, M.; Collins, G.S.; Reitsma, J.B.; Kleijnen, J.; Mallett, S.; Groupdagger, P. PROBAST: A tool to assess the risk of bias and applicability of prediction model studies. Ann. Intern. Med. 2019, 170, 51–58. [Google Scholar] [CrossRef]


| Risk Factors | n | % |
|---|---|---|
| Phenotypic factors | ||
| Nevi | 35 | 77.8 |
| Hair color | 26 | 57.8 |
| Fitzpatrick | 17 | 37.8 |
| Freckles | 16 | 35.6 |
| Skin color | 15 | 33.3 |
| Eye color | 14 | 31.1 |
| Tanning ability | 10 | 22.2 |
| Genetic factors | ||
| MC1R genotype | 7 | 15.6 |
| Polygenic risk score | 5 | 11.1 |
| SNPs | 1 | 2.2 |
| Demographic factors | ||
| Age | 16 | 35.6 |
| Sex | 15 | 33.3 |
| Family history of melanoma | 13 | 28.9 |
| Residence | 3 | 6.7 |
| Level of education | 1 | 2.2 |
| Country of birth | 1 | 2.2 |
| Health insurance | 1 | 2.2 |
| Ethnicity | 1 | 2.2 |
| 1st degree relative with large or unusual moles | 1 | 2.2 |
| Sun exposure | ||
| Sunburns | 13 | 28.9 |
| Sunbed sessions | 7 | 15.6 |
| Sun exposure | 7 | 15.6 |
| Occupational sun exposure | 2 | 4.4 |
| Use of sunscreen | 2 | 4.4 |
| Skin lesions | ||
| Non-melanoma skin cancer | 10 | 22.2 |
| Atypical nevi | 10 | 22.2 |
| Sun damage | 8 | 17.8 |
| Melanoma history | 5 | 11.1 |
| Congenital nevi | 2 | 4.4 |
| Previous skin lesions treated destructively | 2 | 4.4 |
| Suspicious melanocytic lesions | 1 | 2.2 |
| Changing moles | 1 | 2.2 |
| Other risk factors | ||
| Skin checks | 2 | 4.4 |
| Hormonal contraceptive therapy | 1 | 2.2 |
| Age on arrival in Australia | 1 | 2.2 |
| Risk Factors | n | % |
|---|---|---|
| Size of nevi | ||
| ≥2 mm | 7 | 20.0 |
| ≥5 mm | 2 | 5.7 |
| >3 mm | 1 | 2.9 |
| ≥2 mm and ≥5 mm, respectively | 1 | 2.9 |
| Not reported | 24 | 68.6 |
| Site of nevi count (1) | ||
| Entire body | 17 | 48.5 |
| Both arms | 6 | 17.1 |
| Right arm | 2 | 5.7 |
| Forearm and back | 2 | 5.7 |
| Back | 2 | 5.7 |
| Left arm | 1 | 2.9 |
| Not reported | 6 | 17.1 |
| Assessment | ||
| Physician/nurse/trained examiner | 15 | 42.9 |
| Self-reported | 13 | 37.1 |
| Not reported | 7 | 20.0 |
| Measurement level | ||
| Categorical | 31 | 88.6 |
| Metric | 2 | 5.7 |
| Dichotomous | 1 | 2.9 |
| Not reported | 1 | 2.9 |
| Category | n | % |
|---|---|---|
| Definition of sunburn | ||
| Blistering | 4 | 30.8 |
| Pain and erythema or blisters for >24 h | 1 | 7.7 |
| Painful | 1 | 7.7 |
| Peeling of skin | 1 | 7.7 |
| No explanation given | 6 | 46.2 |
| Time period | ||
| Childhood | 5 | 38.5 |
| Lifetime | 5 | 38.5 |
| Not reported | 3 | 23.1 |
| Measurement level | ||
| Dichotomous | 8 | 61.5 |
| Categorial | 5 | 38.5 |
| Studies Published up to 2011 (n = 20) | Studies Published after 2011 (n = 20) | All Studies (n = 40) | ||||
|---|---|---|---|---|---|---|
| Validation | n | % | n | % | n | % |
| Internal validation | 5 | 25.0 | 13 | 65.0 | 18 | 45.0 |
| Cross-validation | 1 | 5.0 | 5 | 25.0 | 6 | 15.0 |
| Split sample | 3 | 15.0 | 3 | 15.0 | 6 | 15.0 |
| Bootstrapping | 1 | 5.0 | 5 | 25.0 | 6 | 15.0 |
| External validation | 1 | 5.0 | 5 | 25.0 | 6 | 15.0 |
| Both internal and external validation | 0 | 0.0 | 3 | 15.0 | 3 | 7.5 |
| Neither internal nor external validation | 14 | 70.0 | 5 | 25.0 | 19 | 47.5 |
| Performance measures | n | % | n | % | n | % |
| Calibration (1) | 2 | 10.0 | 9 | 45.0 | 11 | 27.5 |
| Hosmer–Lemeshow test | 2 | 10.0 | 7 | 35.0 | 9 | 22.5 |
| Graph (plot/intercept/slope) | 0 | 0.0 | 3 | 15.0 | 3 | 7.5 |
| Calibration in the large | 0 | 0.0 | 1 | 5.0 | 1 | 2.5 |
| Discrimination (2) | 9 | 45.0 | 20 | 100.0 | 29 | 72.5 |
| AUC | 8 | 40.0 | 18 | 90.0 | 26 | 65.0 |
| C-index | 0 | 0.0 | 3 | 15.0 | 3 | 7.5 |
| Discrimination slope | 0 | 0.0 | 1 | 5.0 | 1 | 2.5 |
| ROC plot (without AUC calculation) | 1 | 5.0 | 0 | 0.0 | 1 | 2.5 |
| Overall model performance (3) | 0 | 0.0 | 1 | 5.0 | 1 | 2.5 |
| Brier score | 0 | 0 | 1 | 5.0 | 1 | 2.5 |
| Nagelkerk’s R2 | 0 | 0 | 1 | 5.0 | 1 | 2.5 |
| Reclassification (4) | 0 | 0.0 | 4 | 20.0 | 4 | 10.0 |
| Net reclassification improvement | 0 | 0.0 | 4.0 | 20.0 | 4 | 10.0 |
| Integrated discrimination index | 0 | 0.0 | 2.0 | 10.0 | 2 | 5.0 |
| Clinically usefulness | 3 | 15.0 | 8 | 40.0 | 11 | 27.5 |
| Sensitivity/specificity | 3 | 15.0 | 5 | 25.0 | 8 | 20.0 |
| Decision curve | 0 | 0.0 | 3 | 15.0 | 3 | 7.5 |
| No performance measure at all | 11 | 55.0 | 0 | 0.0 | 11 | 27.5 |
Publisher’s Note: MDPI stays neutral with regard to jurisdictional claims in published maps and institutional affiliations. |
© 2020 by the authors. Licensee MDPI, Basel, Switzerland. This article is an open access article distributed under the terms and conditions of the Creative Commons Attribution (CC BY) license (http://creativecommons.org/licenses/by/4.0/).
Share and Cite
Kaiser, I.; Pfahlberg, A.B.; Uter, W.; Heppt, M.V.; Veierød, M.B.; Gefeller, O. Risk Prediction Models for Melanoma: A Systematic Review on the Heterogeneity in Model Development and Validation. Int. J. Environ. Res. Public Health 2020, 17, 7919. https://doi.org/10.3390/ijerph17217919
Kaiser I, Pfahlberg AB, Uter W, Heppt MV, Veierød MB, Gefeller O. Risk Prediction Models for Melanoma: A Systematic Review on the Heterogeneity in Model Development and Validation. International Journal of Environmental Research and Public Health. 2020; 17(21):7919. https://doi.org/10.3390/ijerph17217919
Chicago/Turabian StyleKaiser, Isabelle, Annette B. Pfahlberg, Wolfgang Uter, Markus V. Heppt, Marit B. Veierød, and Olaf Gefeller. 2020. "Risk Prediction Models for Melanoma: A Systematic Review on the Heterogeneity in Model Development and Validation" International Journal of Environmental Research and Public Health 17, no. 21: 7919. https://doi.org/10.3390/ijerph17217919