A Software for Calculating the Economic Aspects of Floating Offshore Renewable Energies


Abstract
:1. Introduction
2. Software Characteristics
2.1. Description of the Software
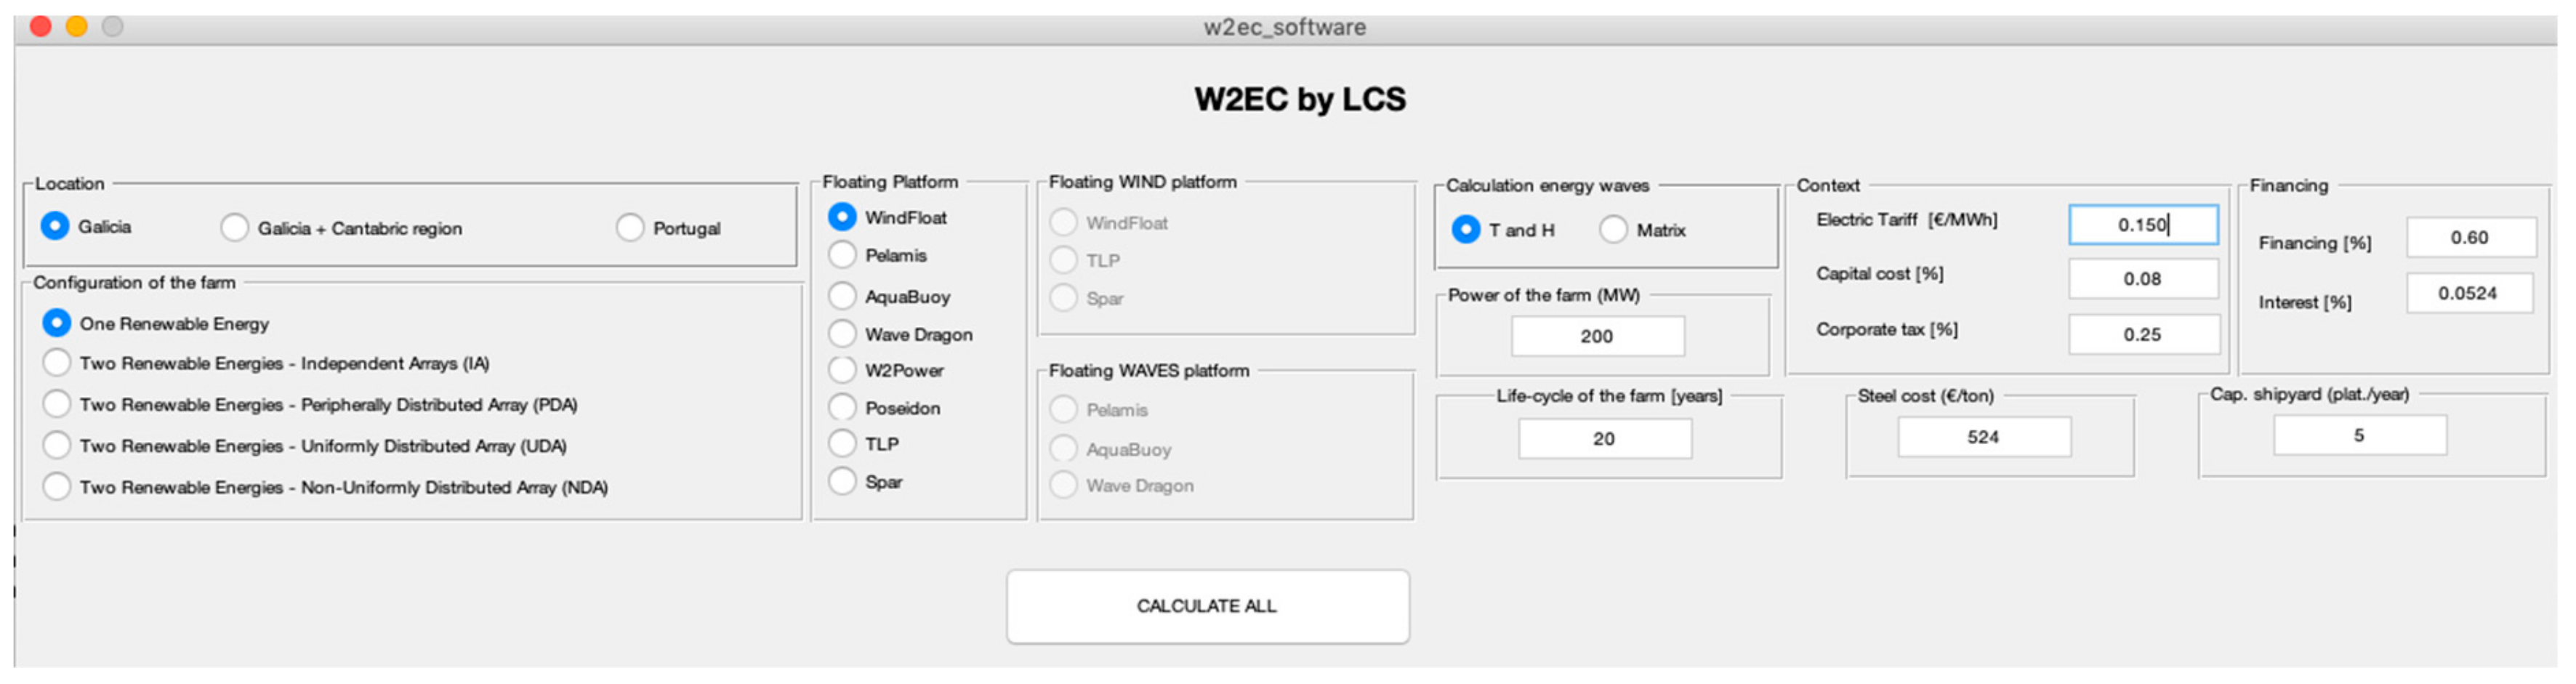
2.2. Inputs of the Software
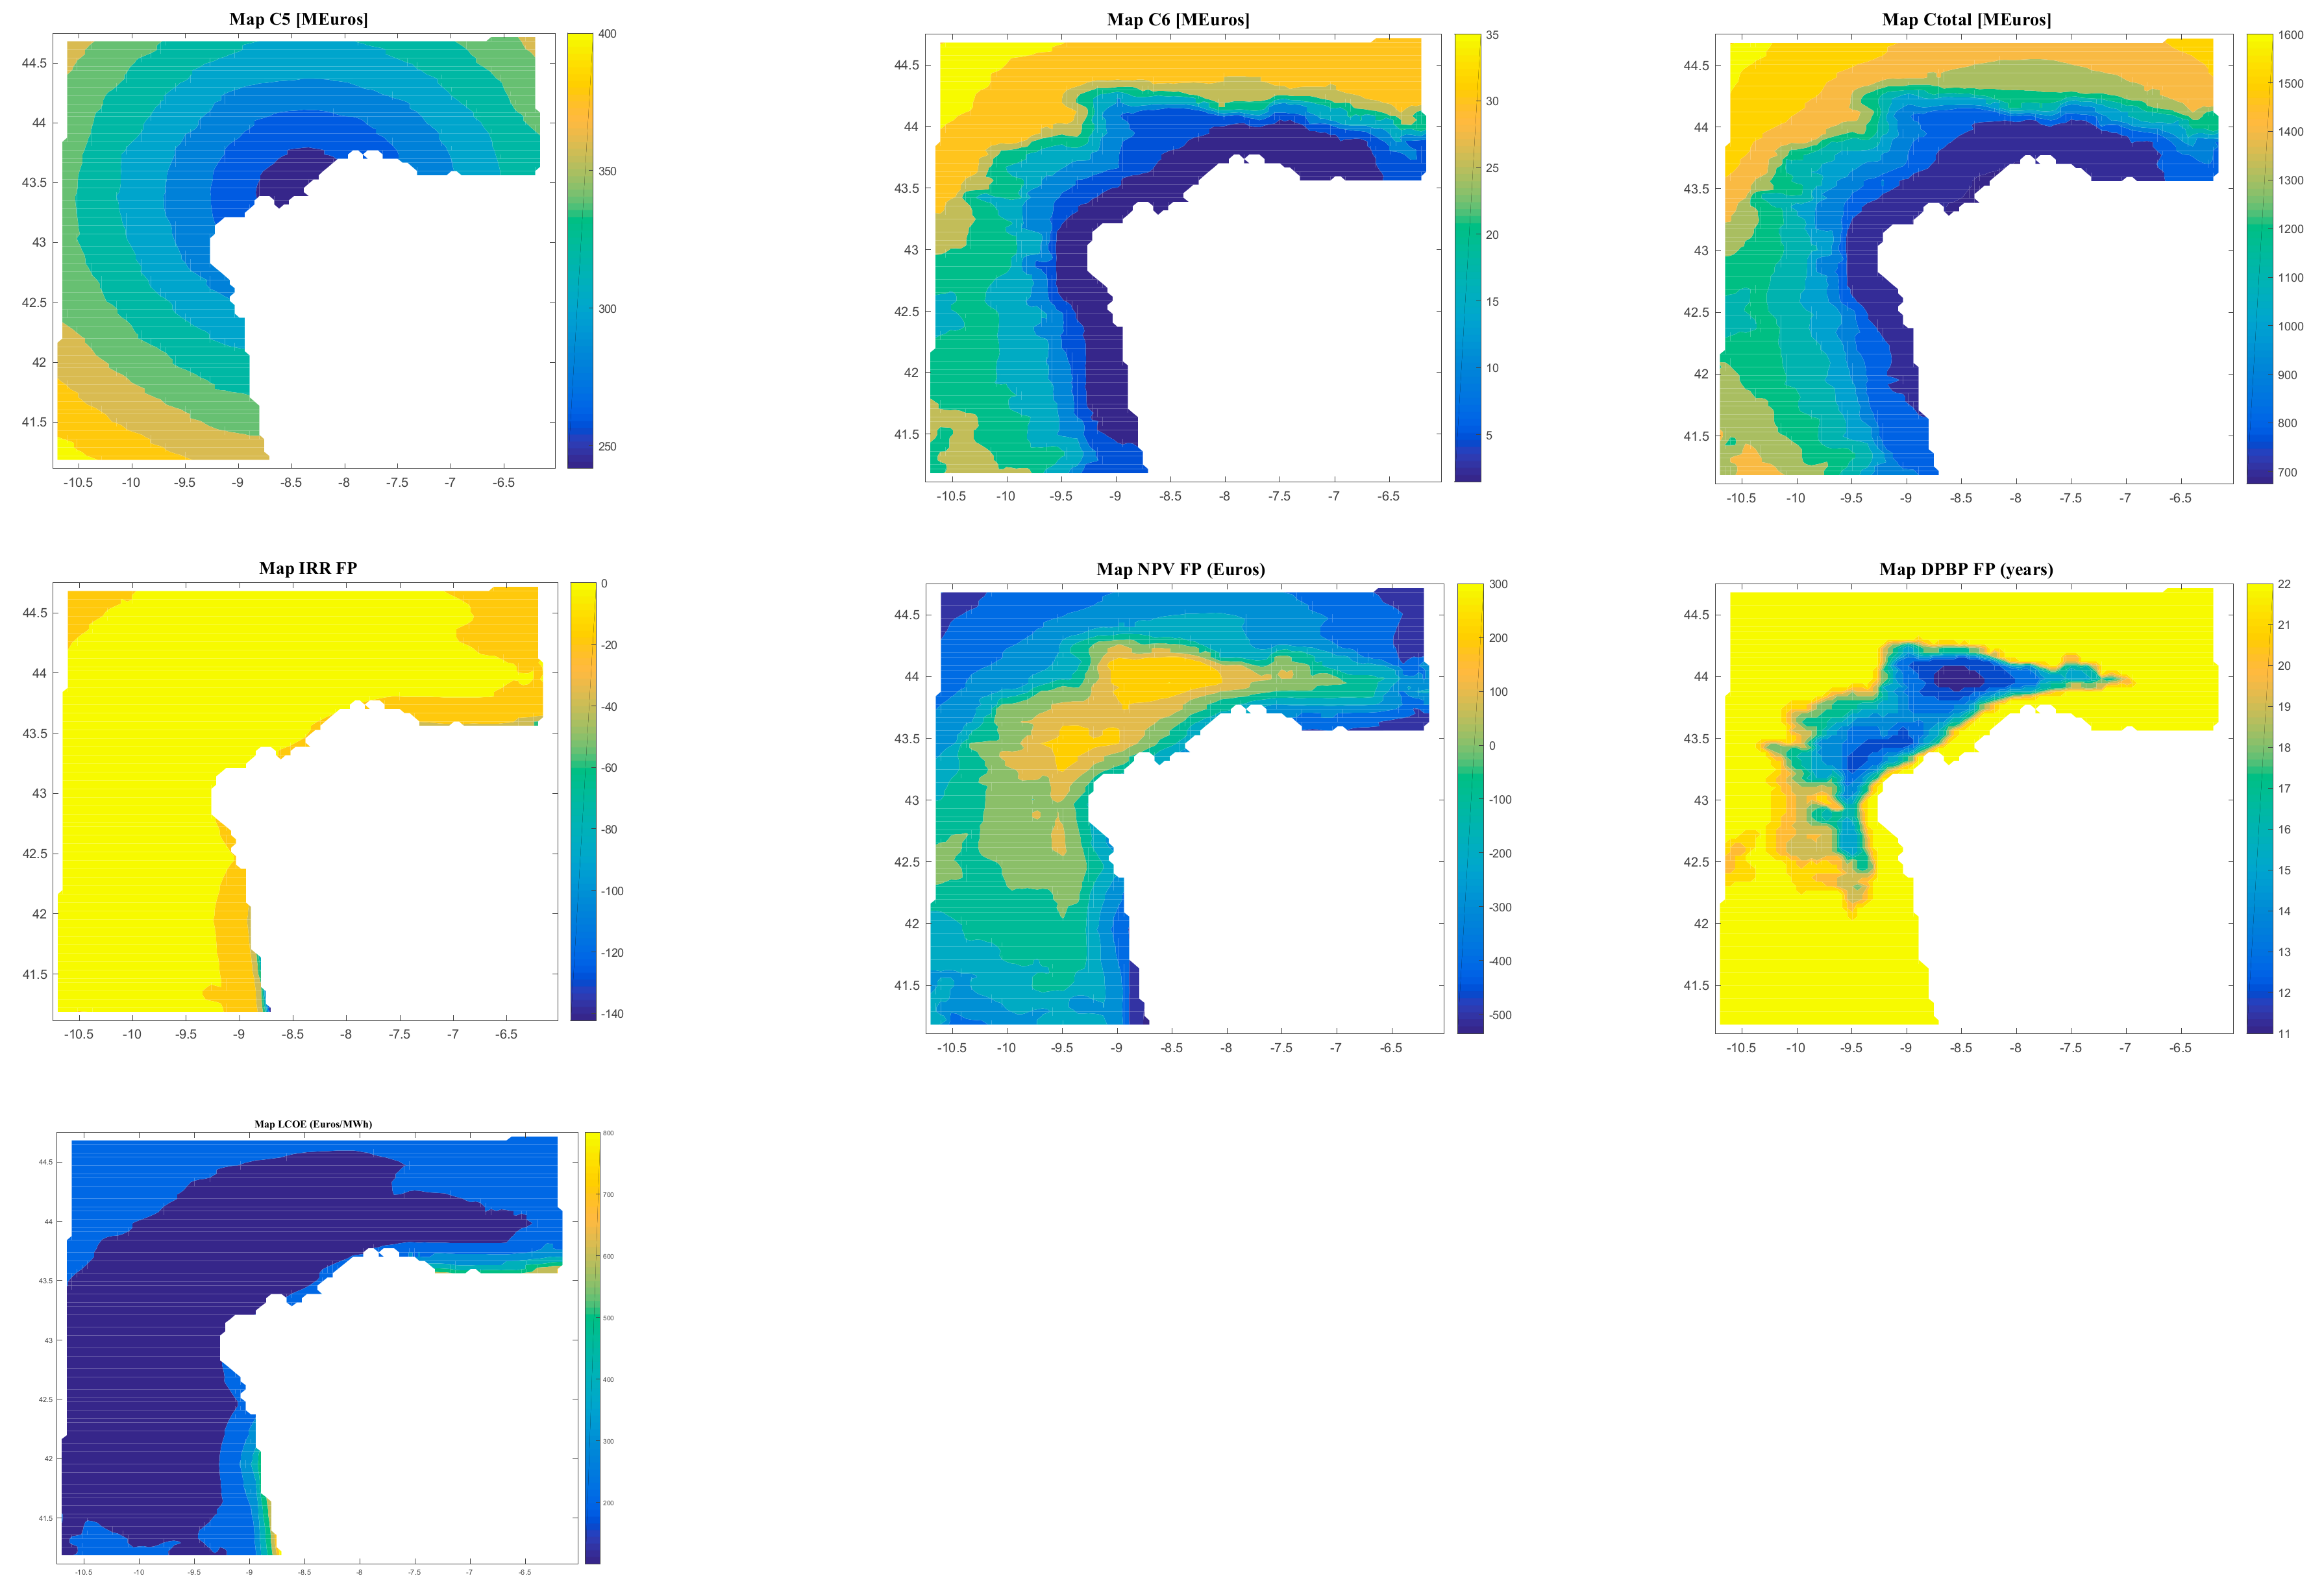
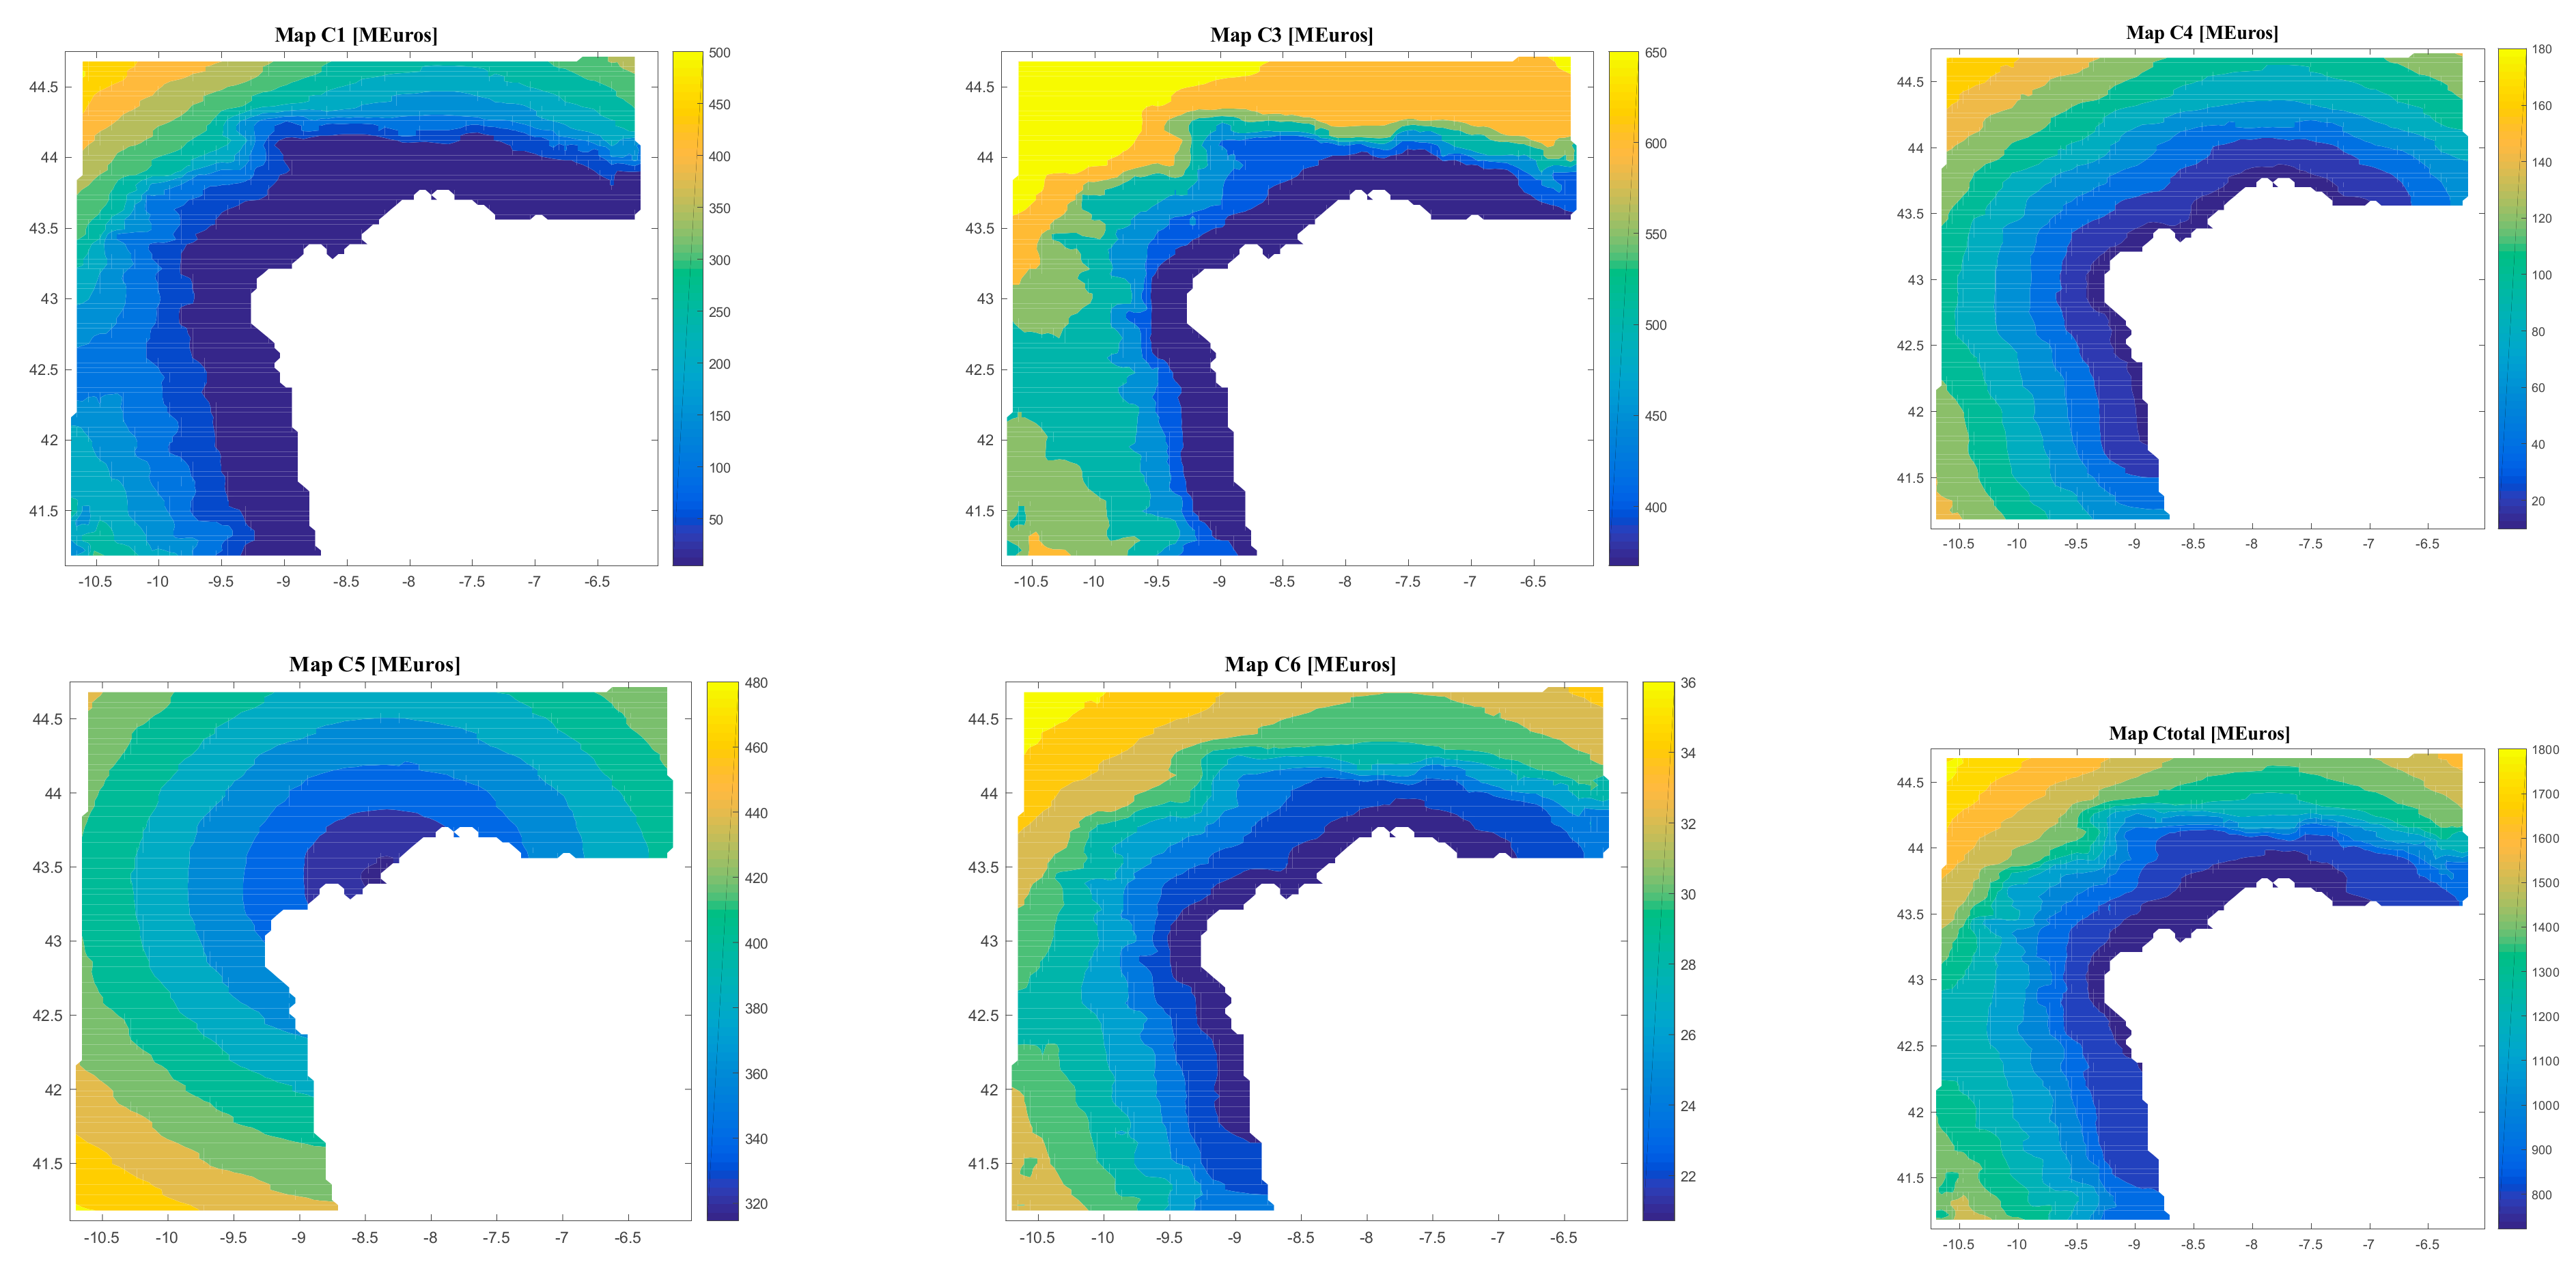
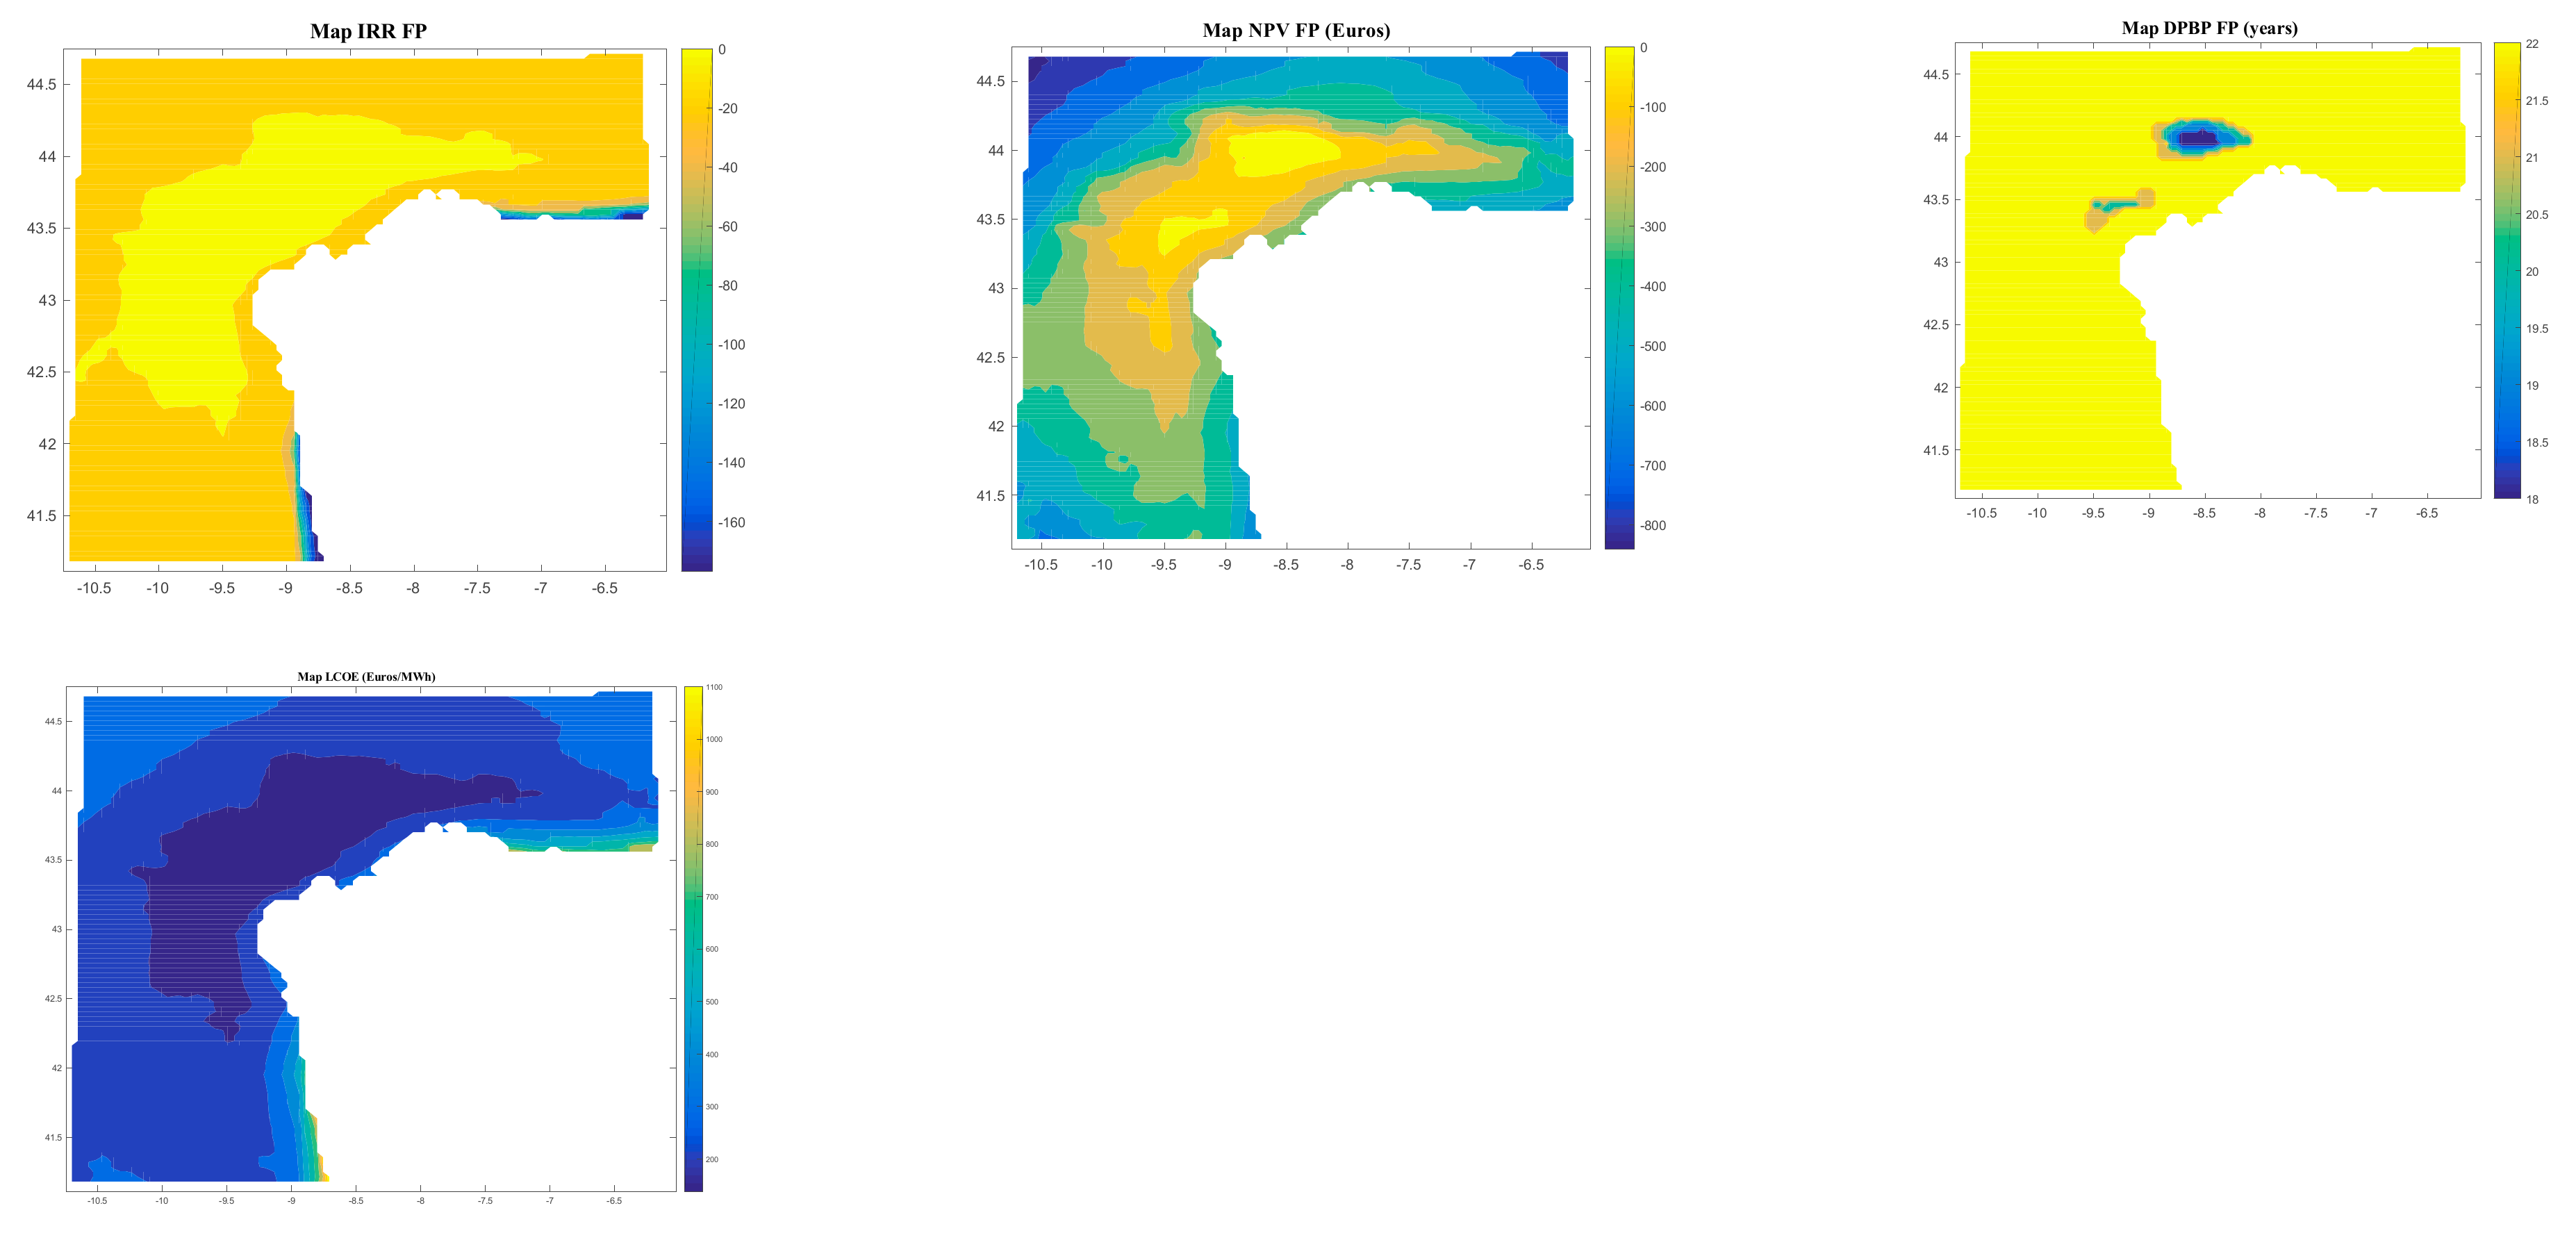
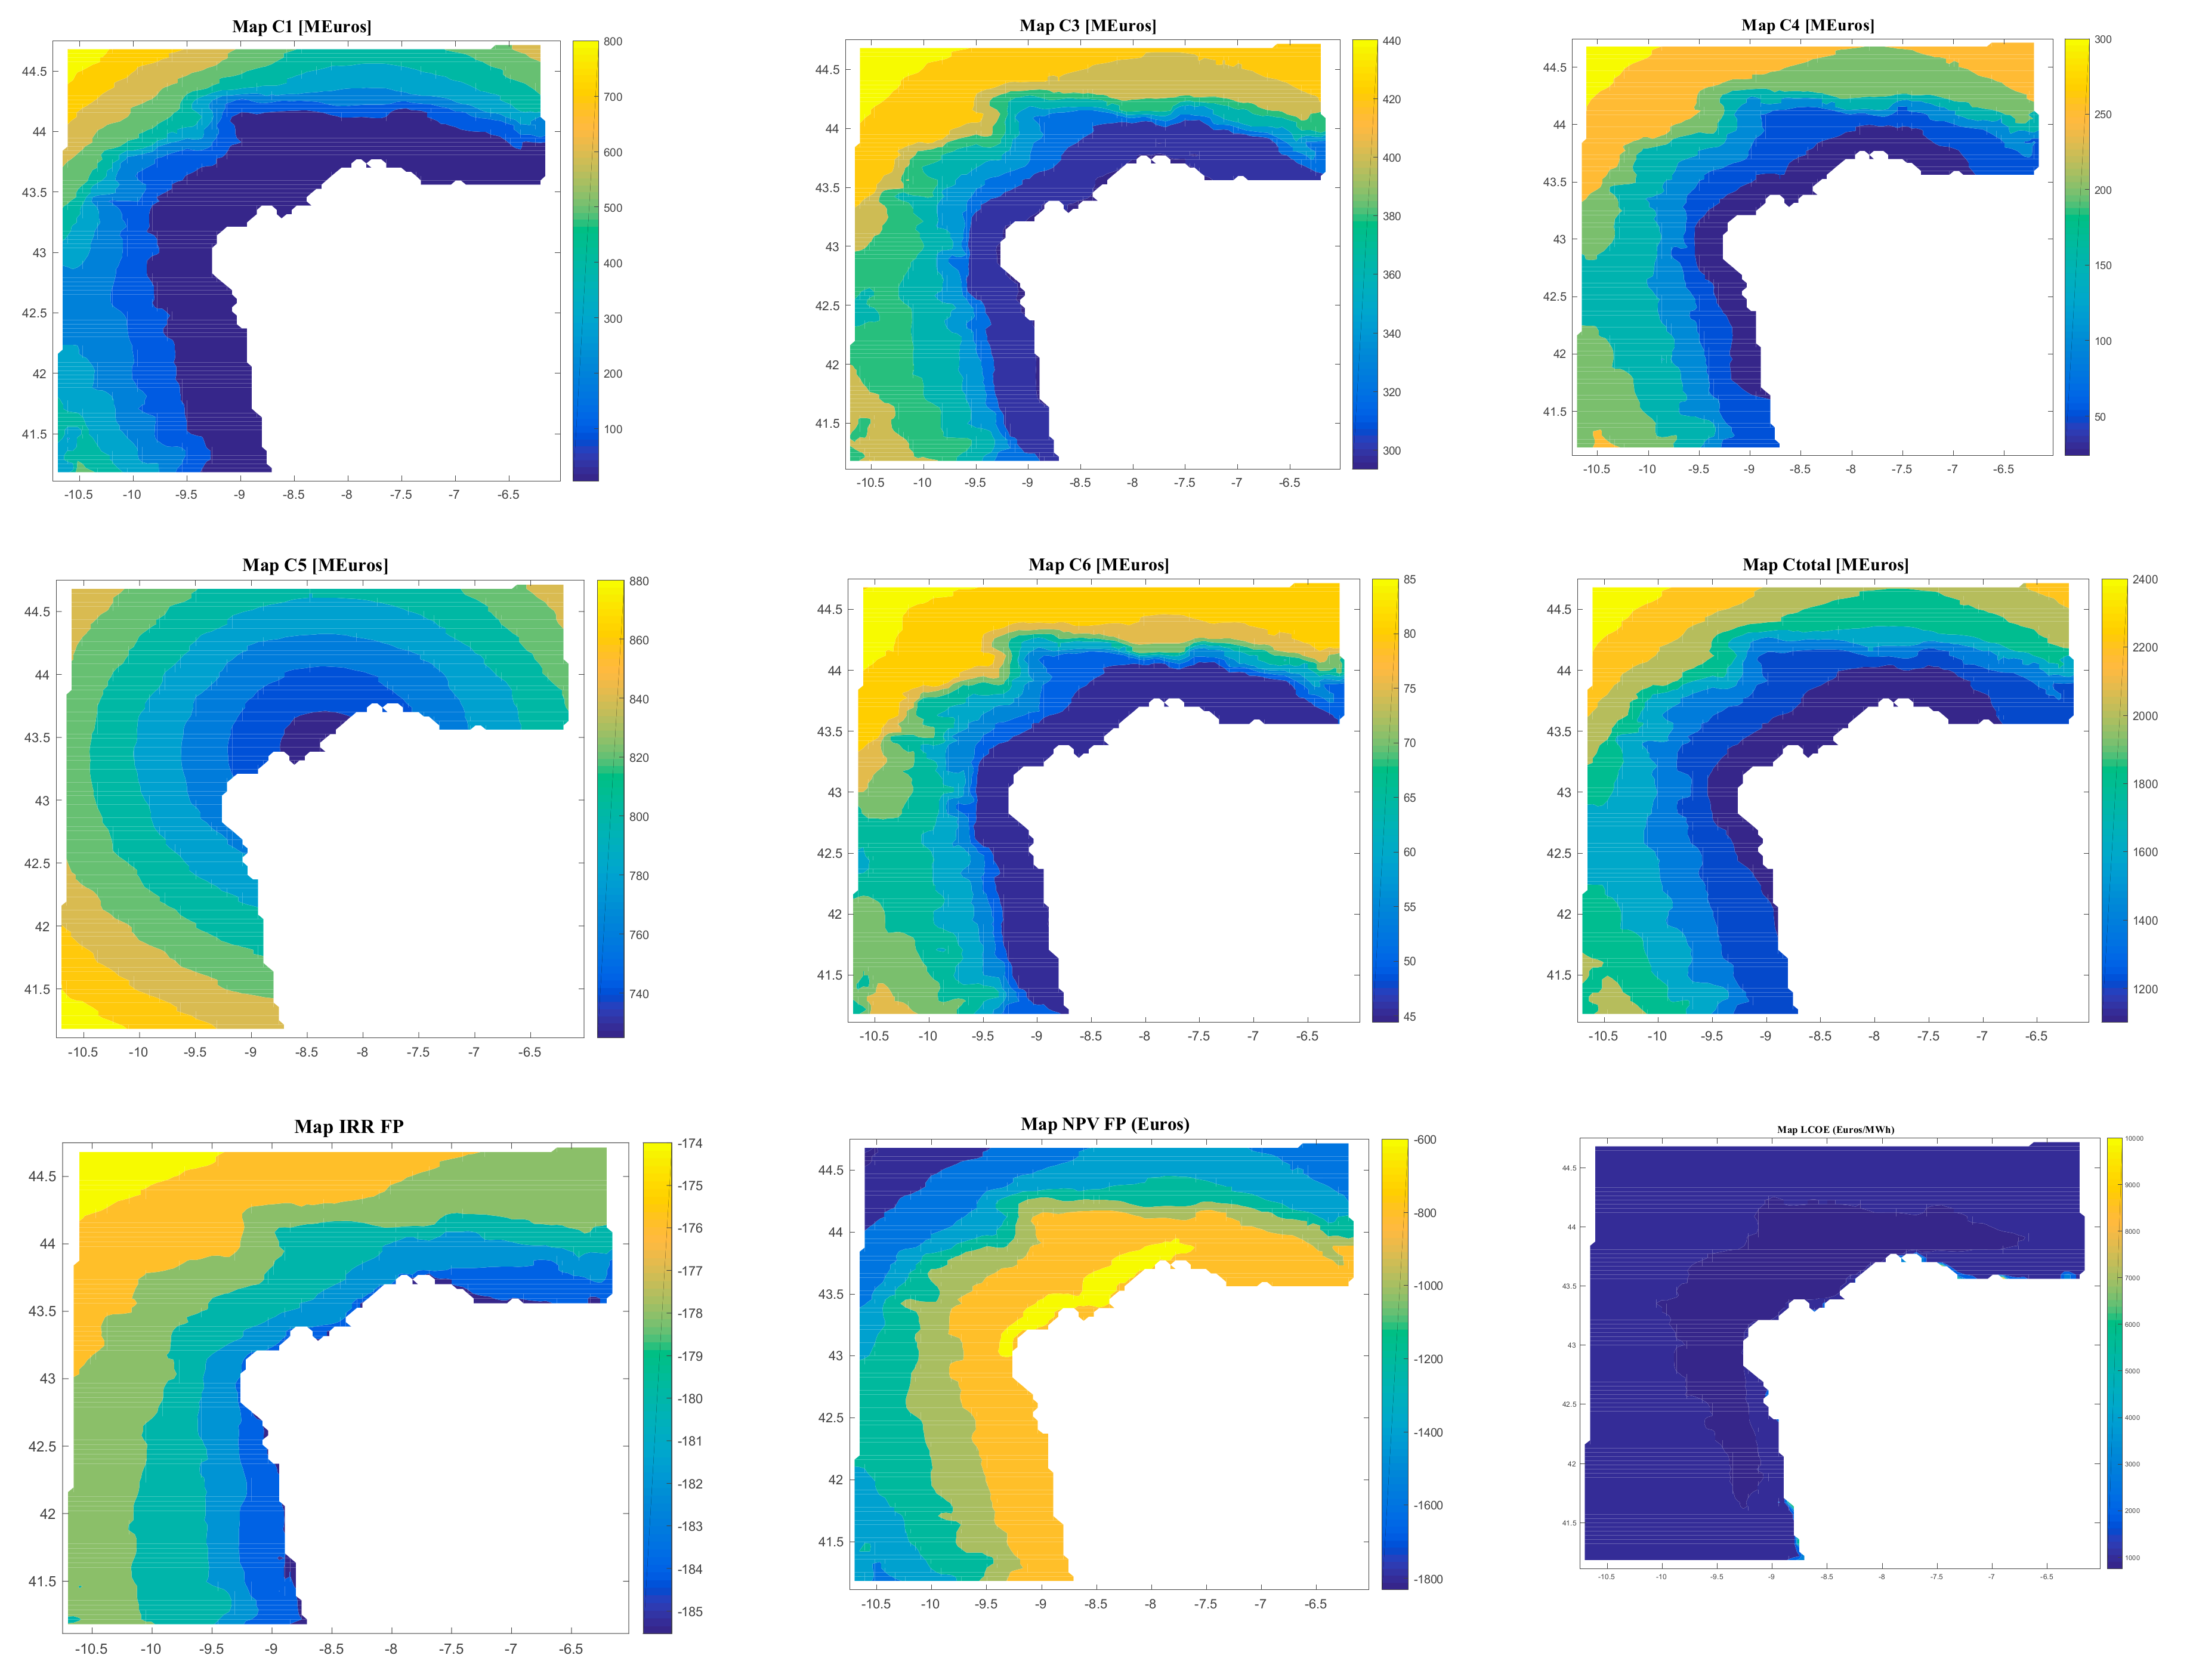
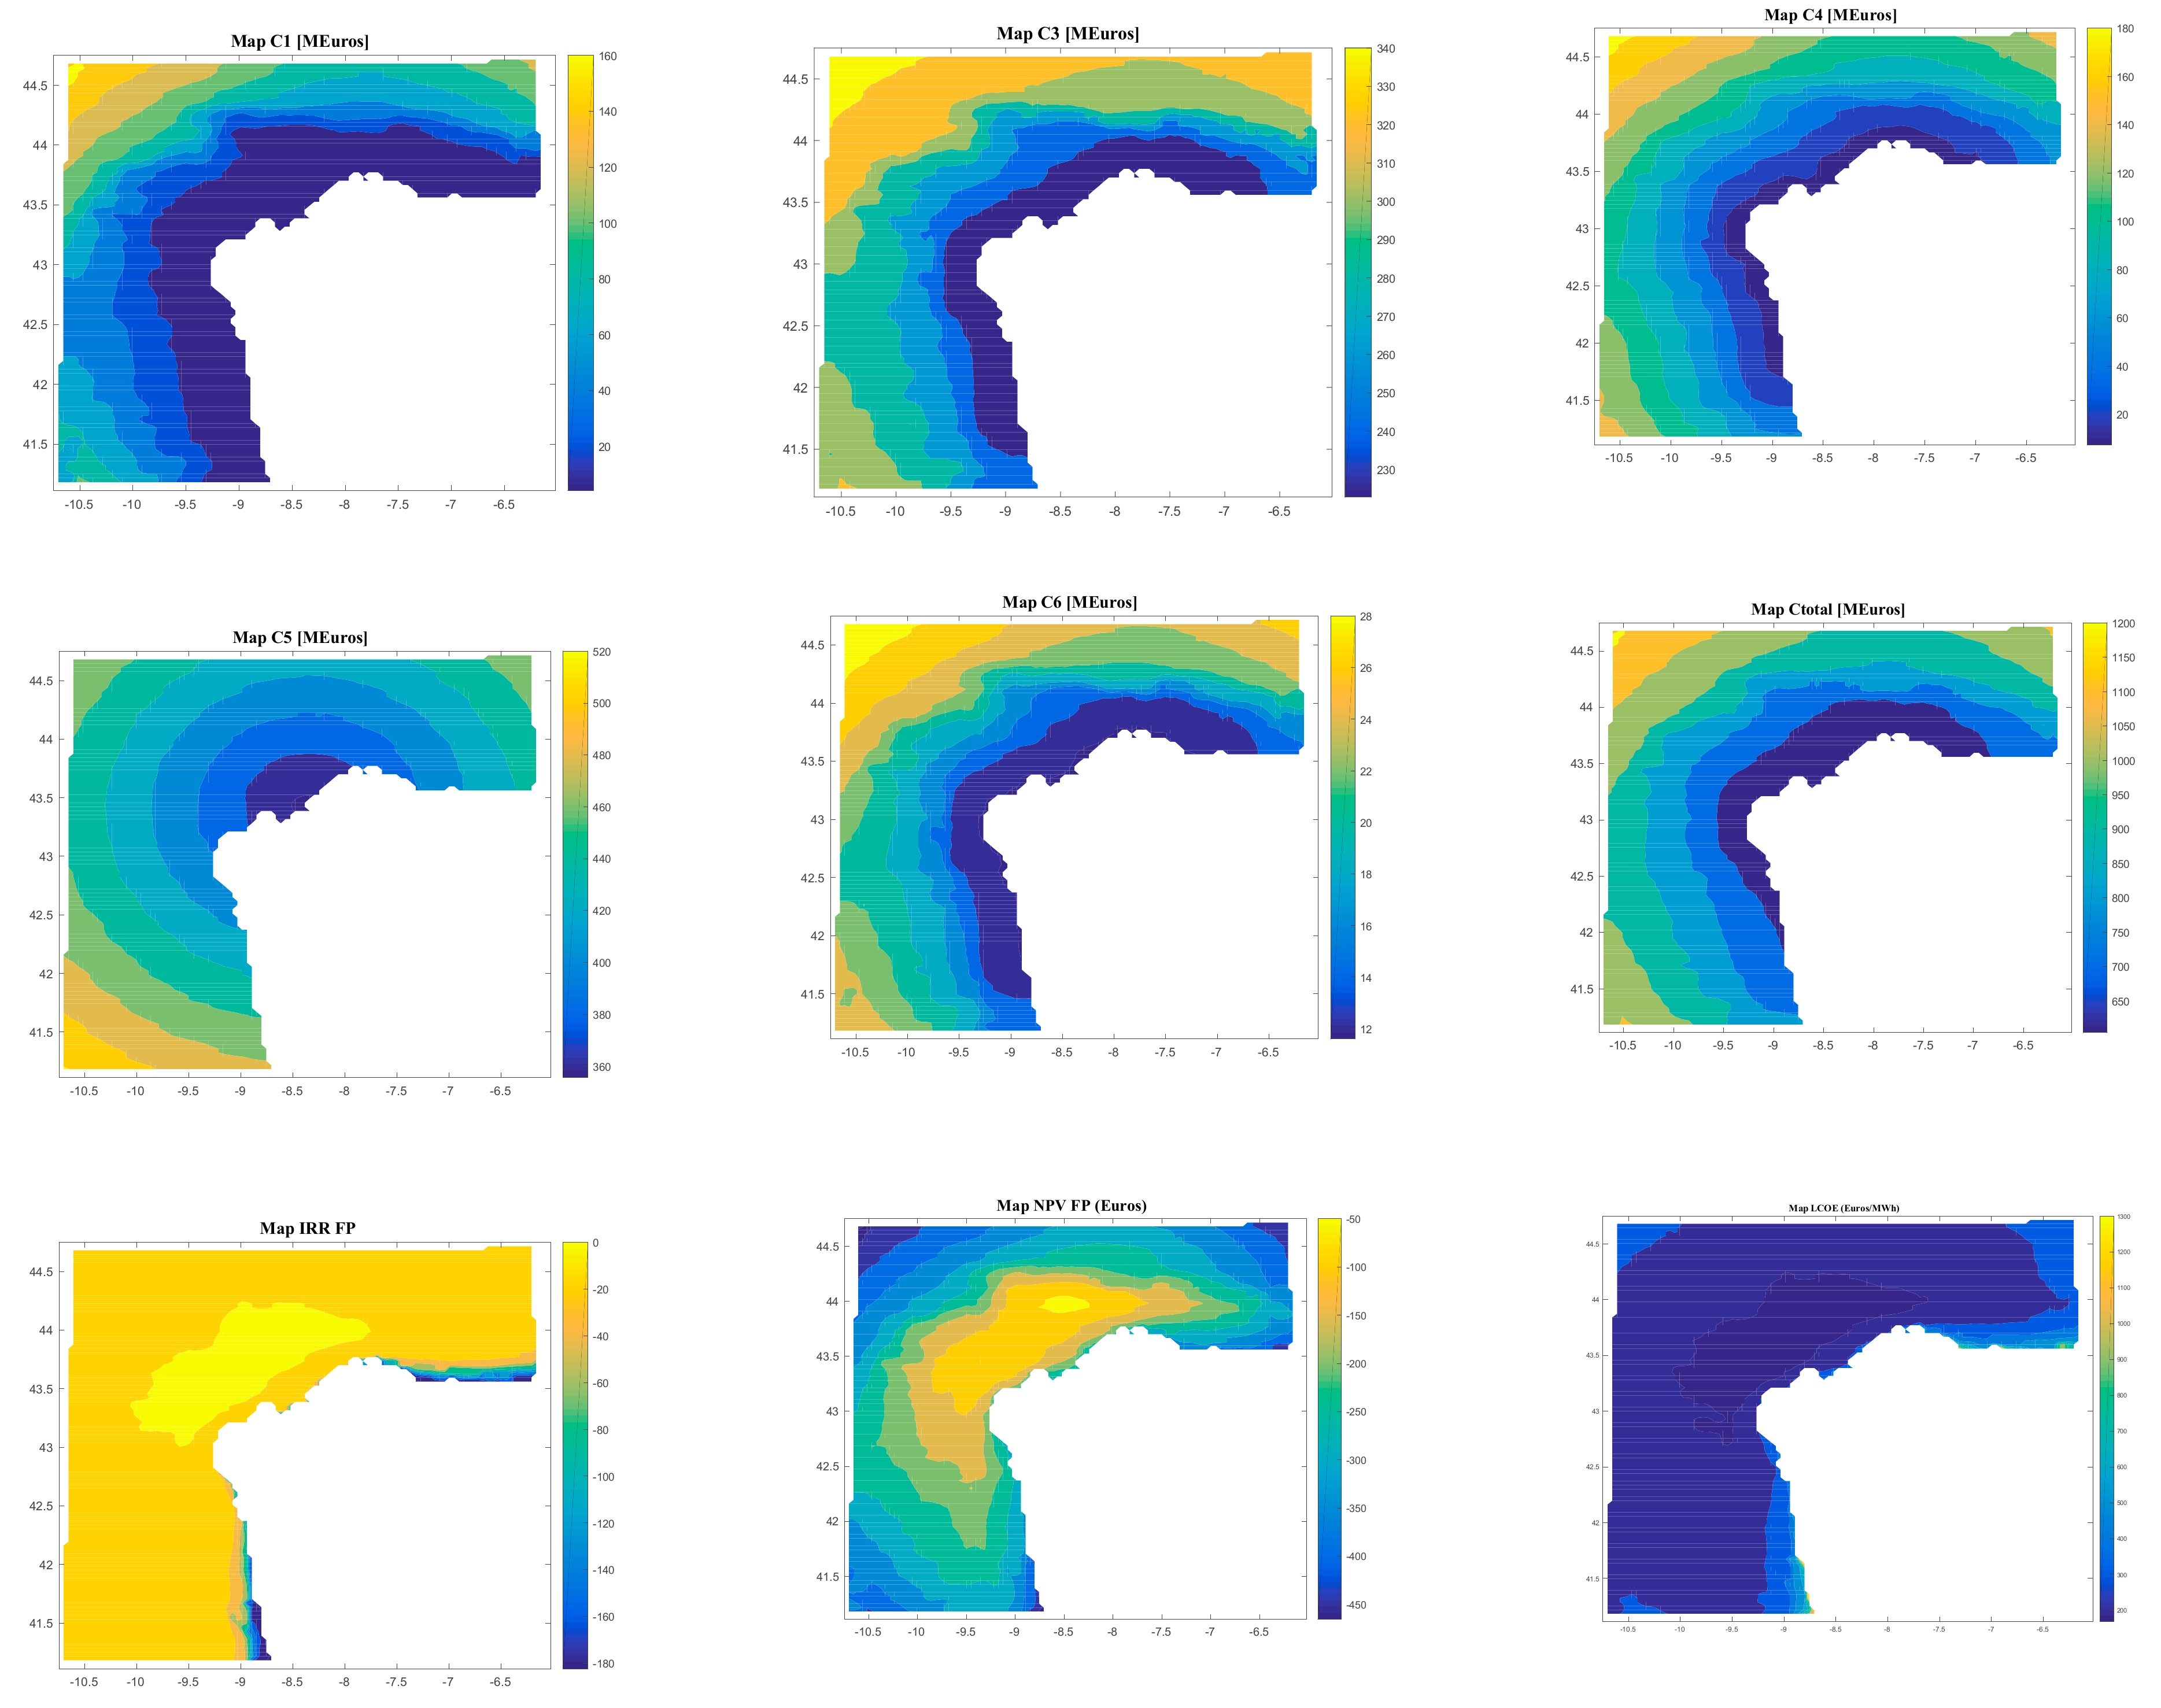
- Internal rate of return of the financed project (IRR FP; %).
- Net present value of the financed project (NPV FP; M€).
- Discounted payback period of the financed project (DPBP FP; years).
- Levelized cost of energy (LCOE; €/MWh).
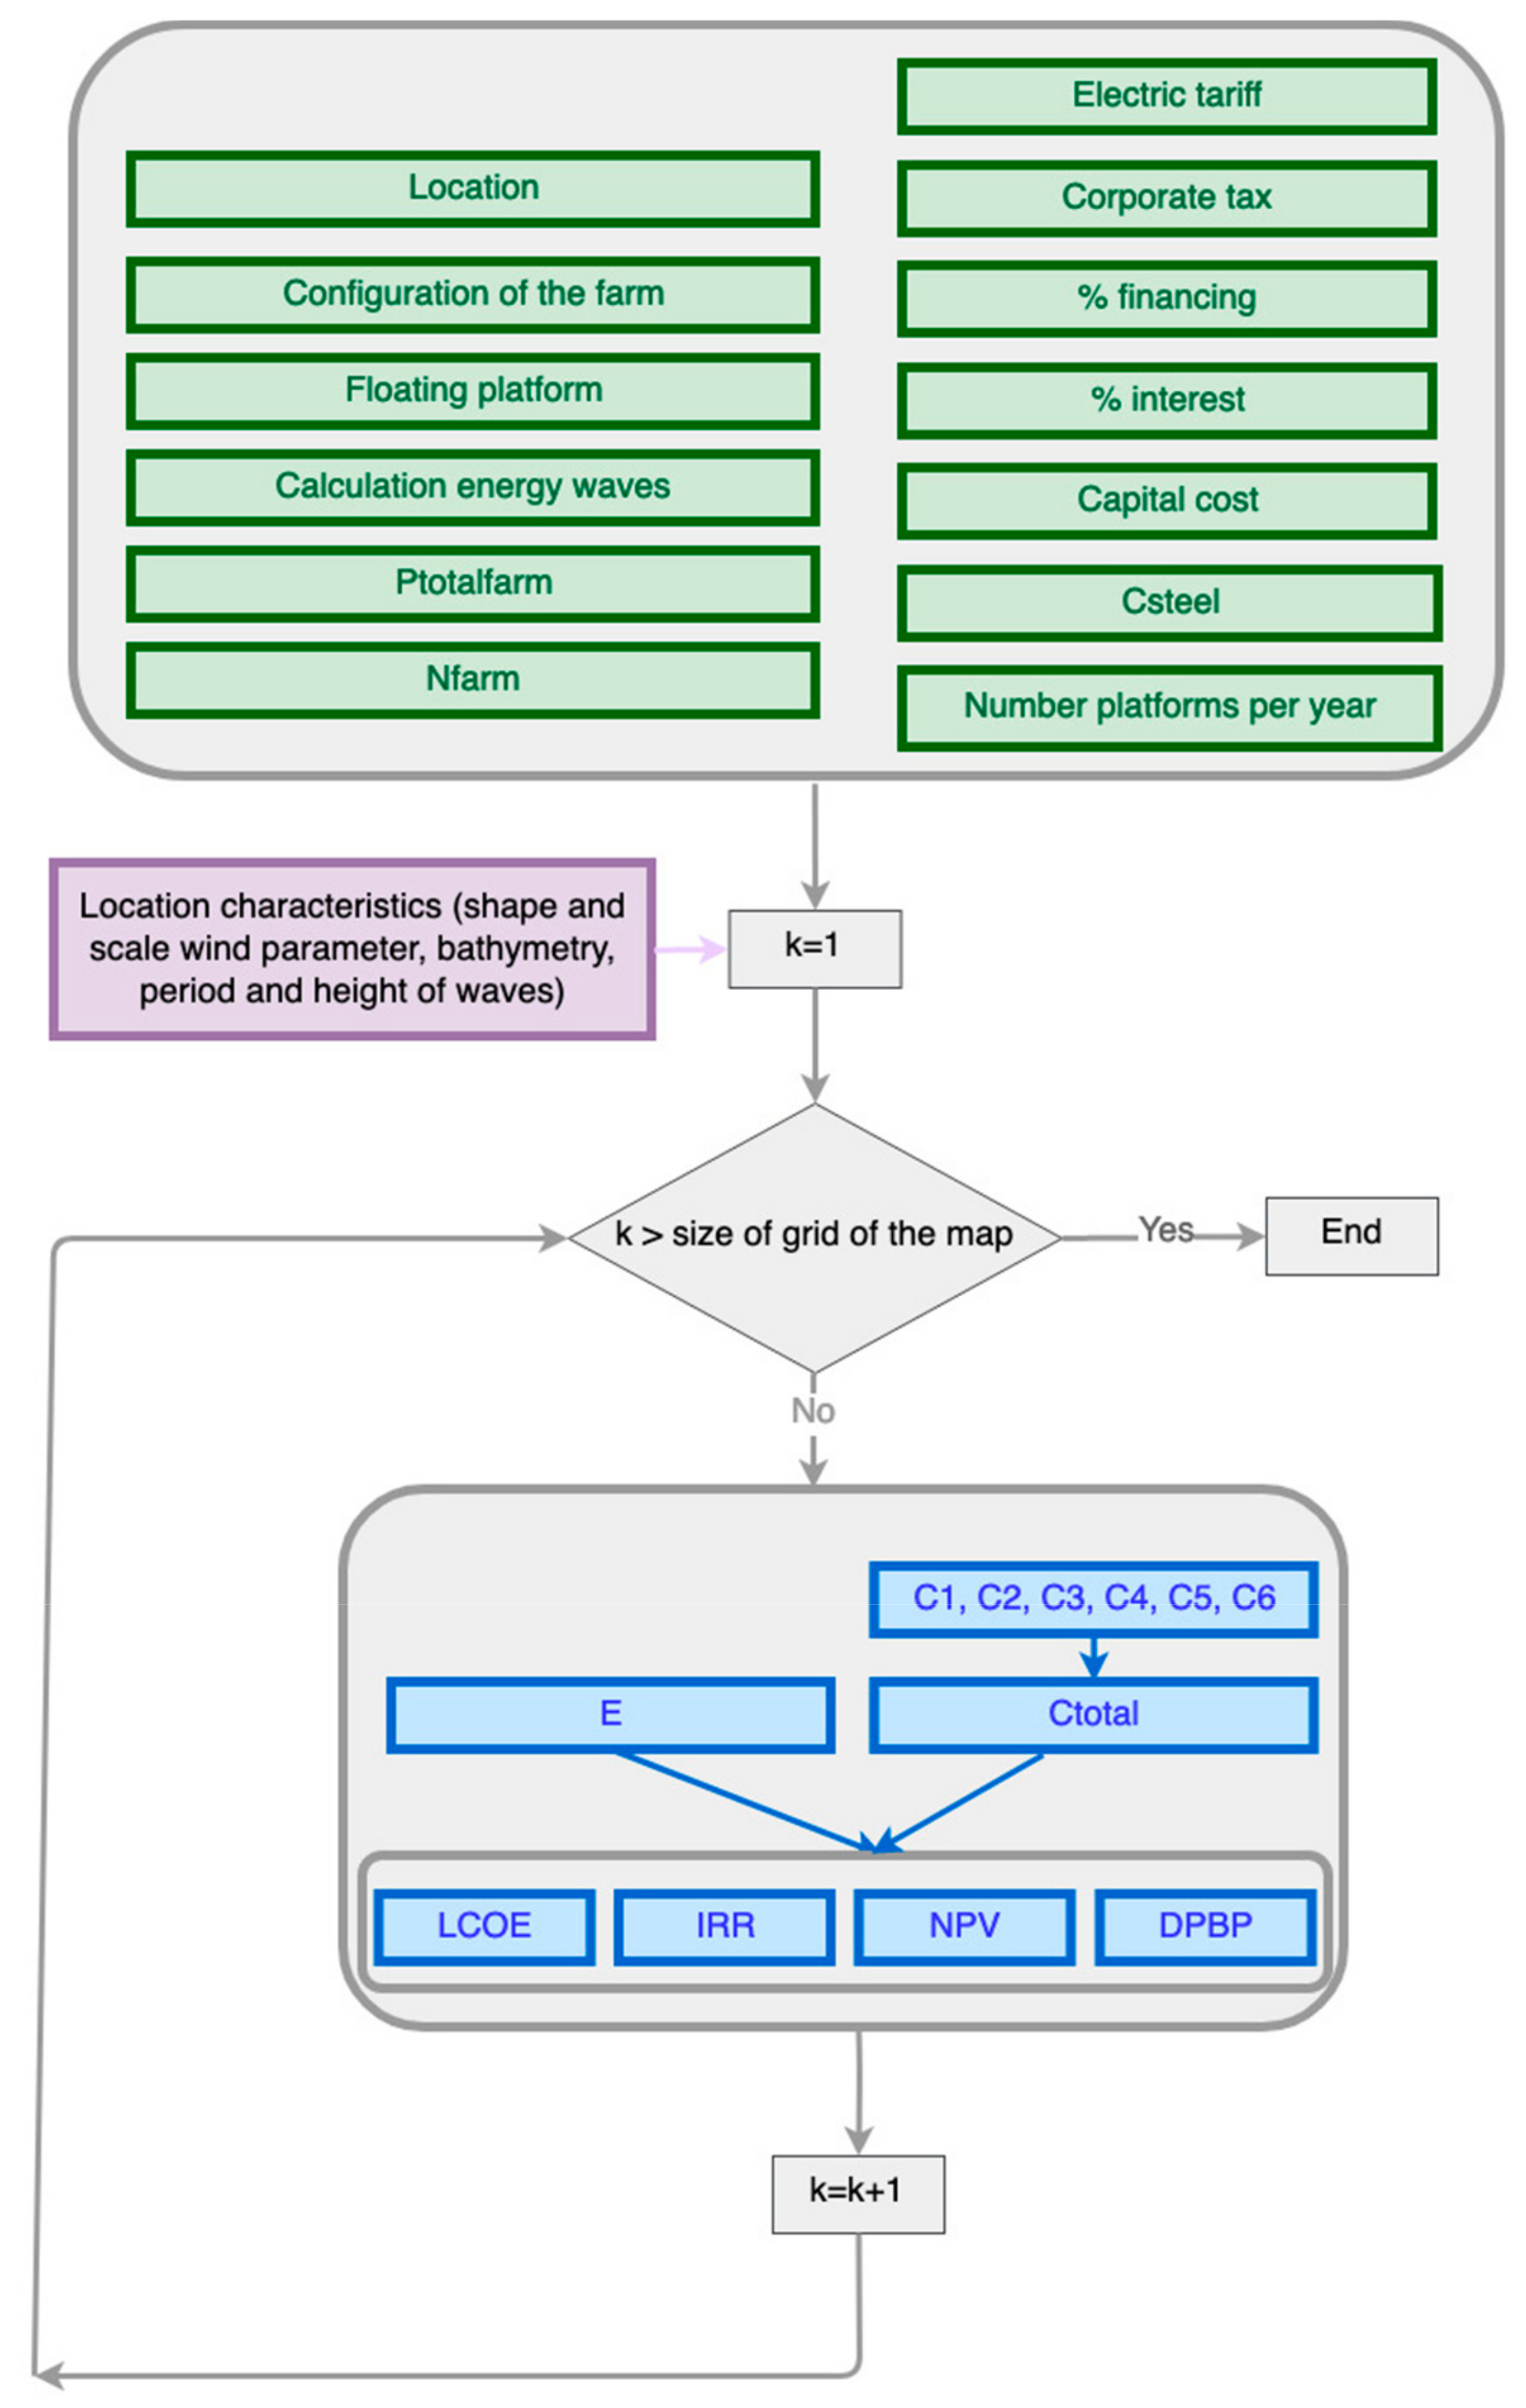
2.3. Criteria and Protocol
3. Case of Study and Results
3.1. Case of Study
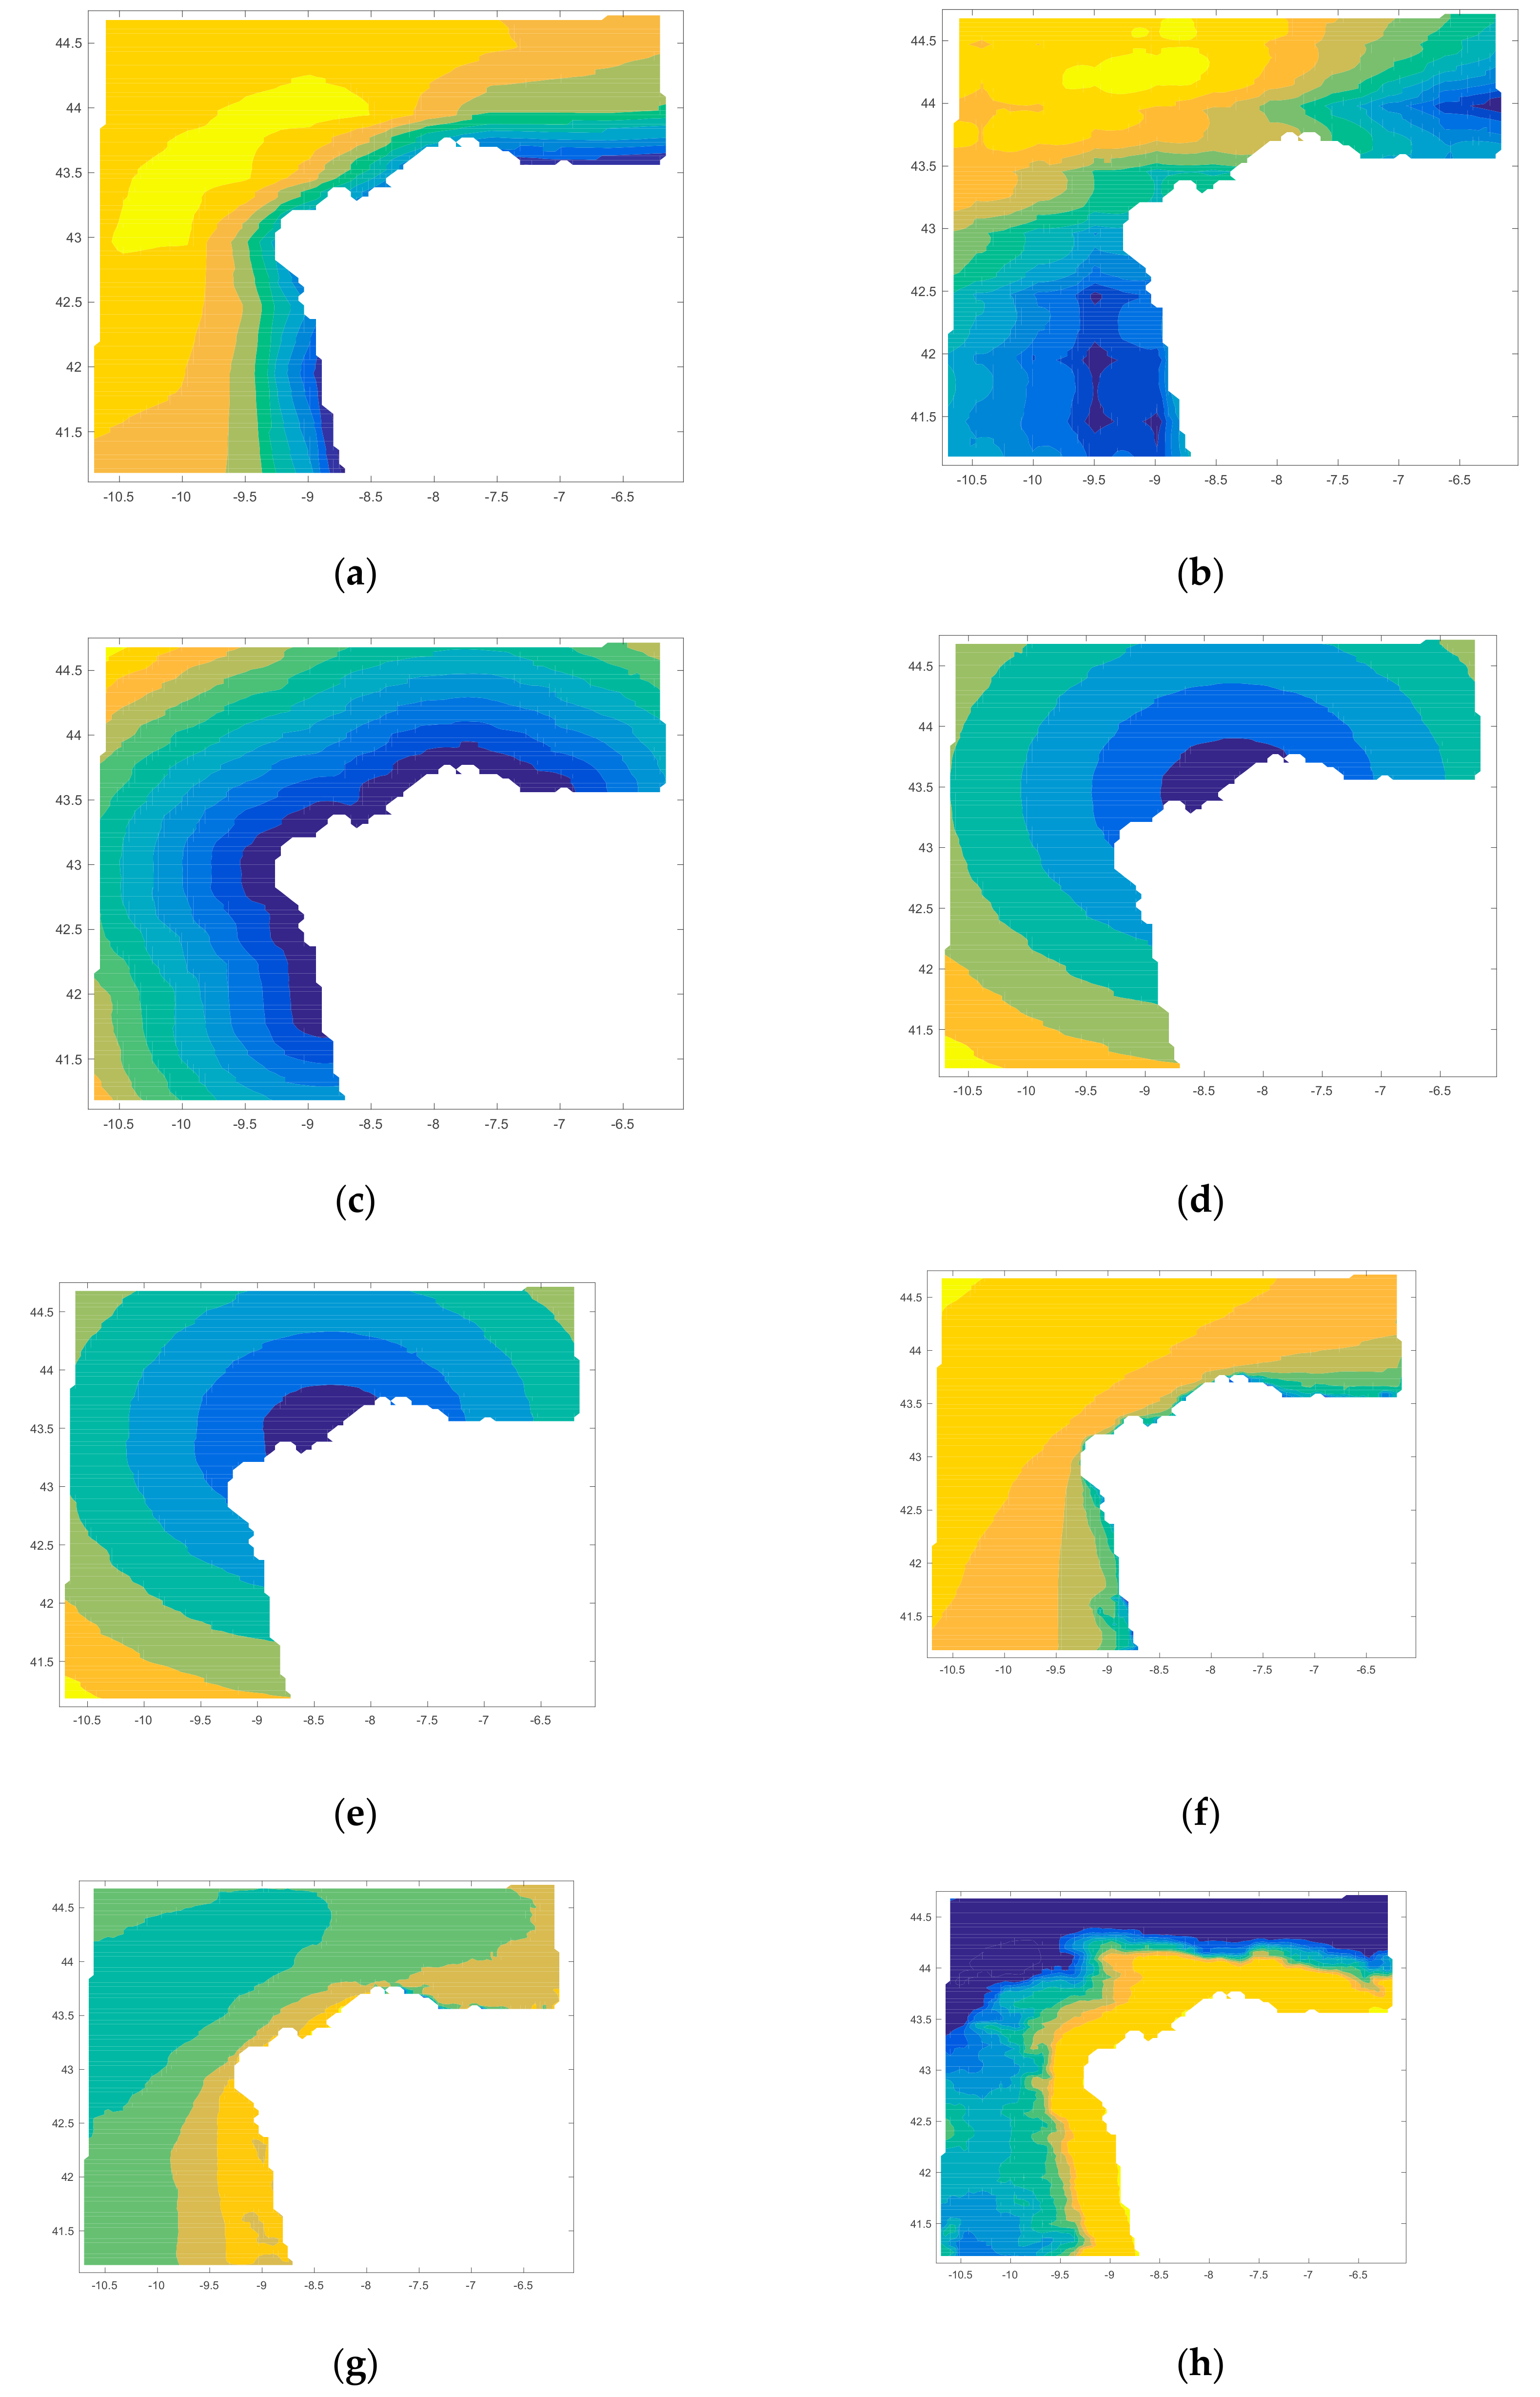
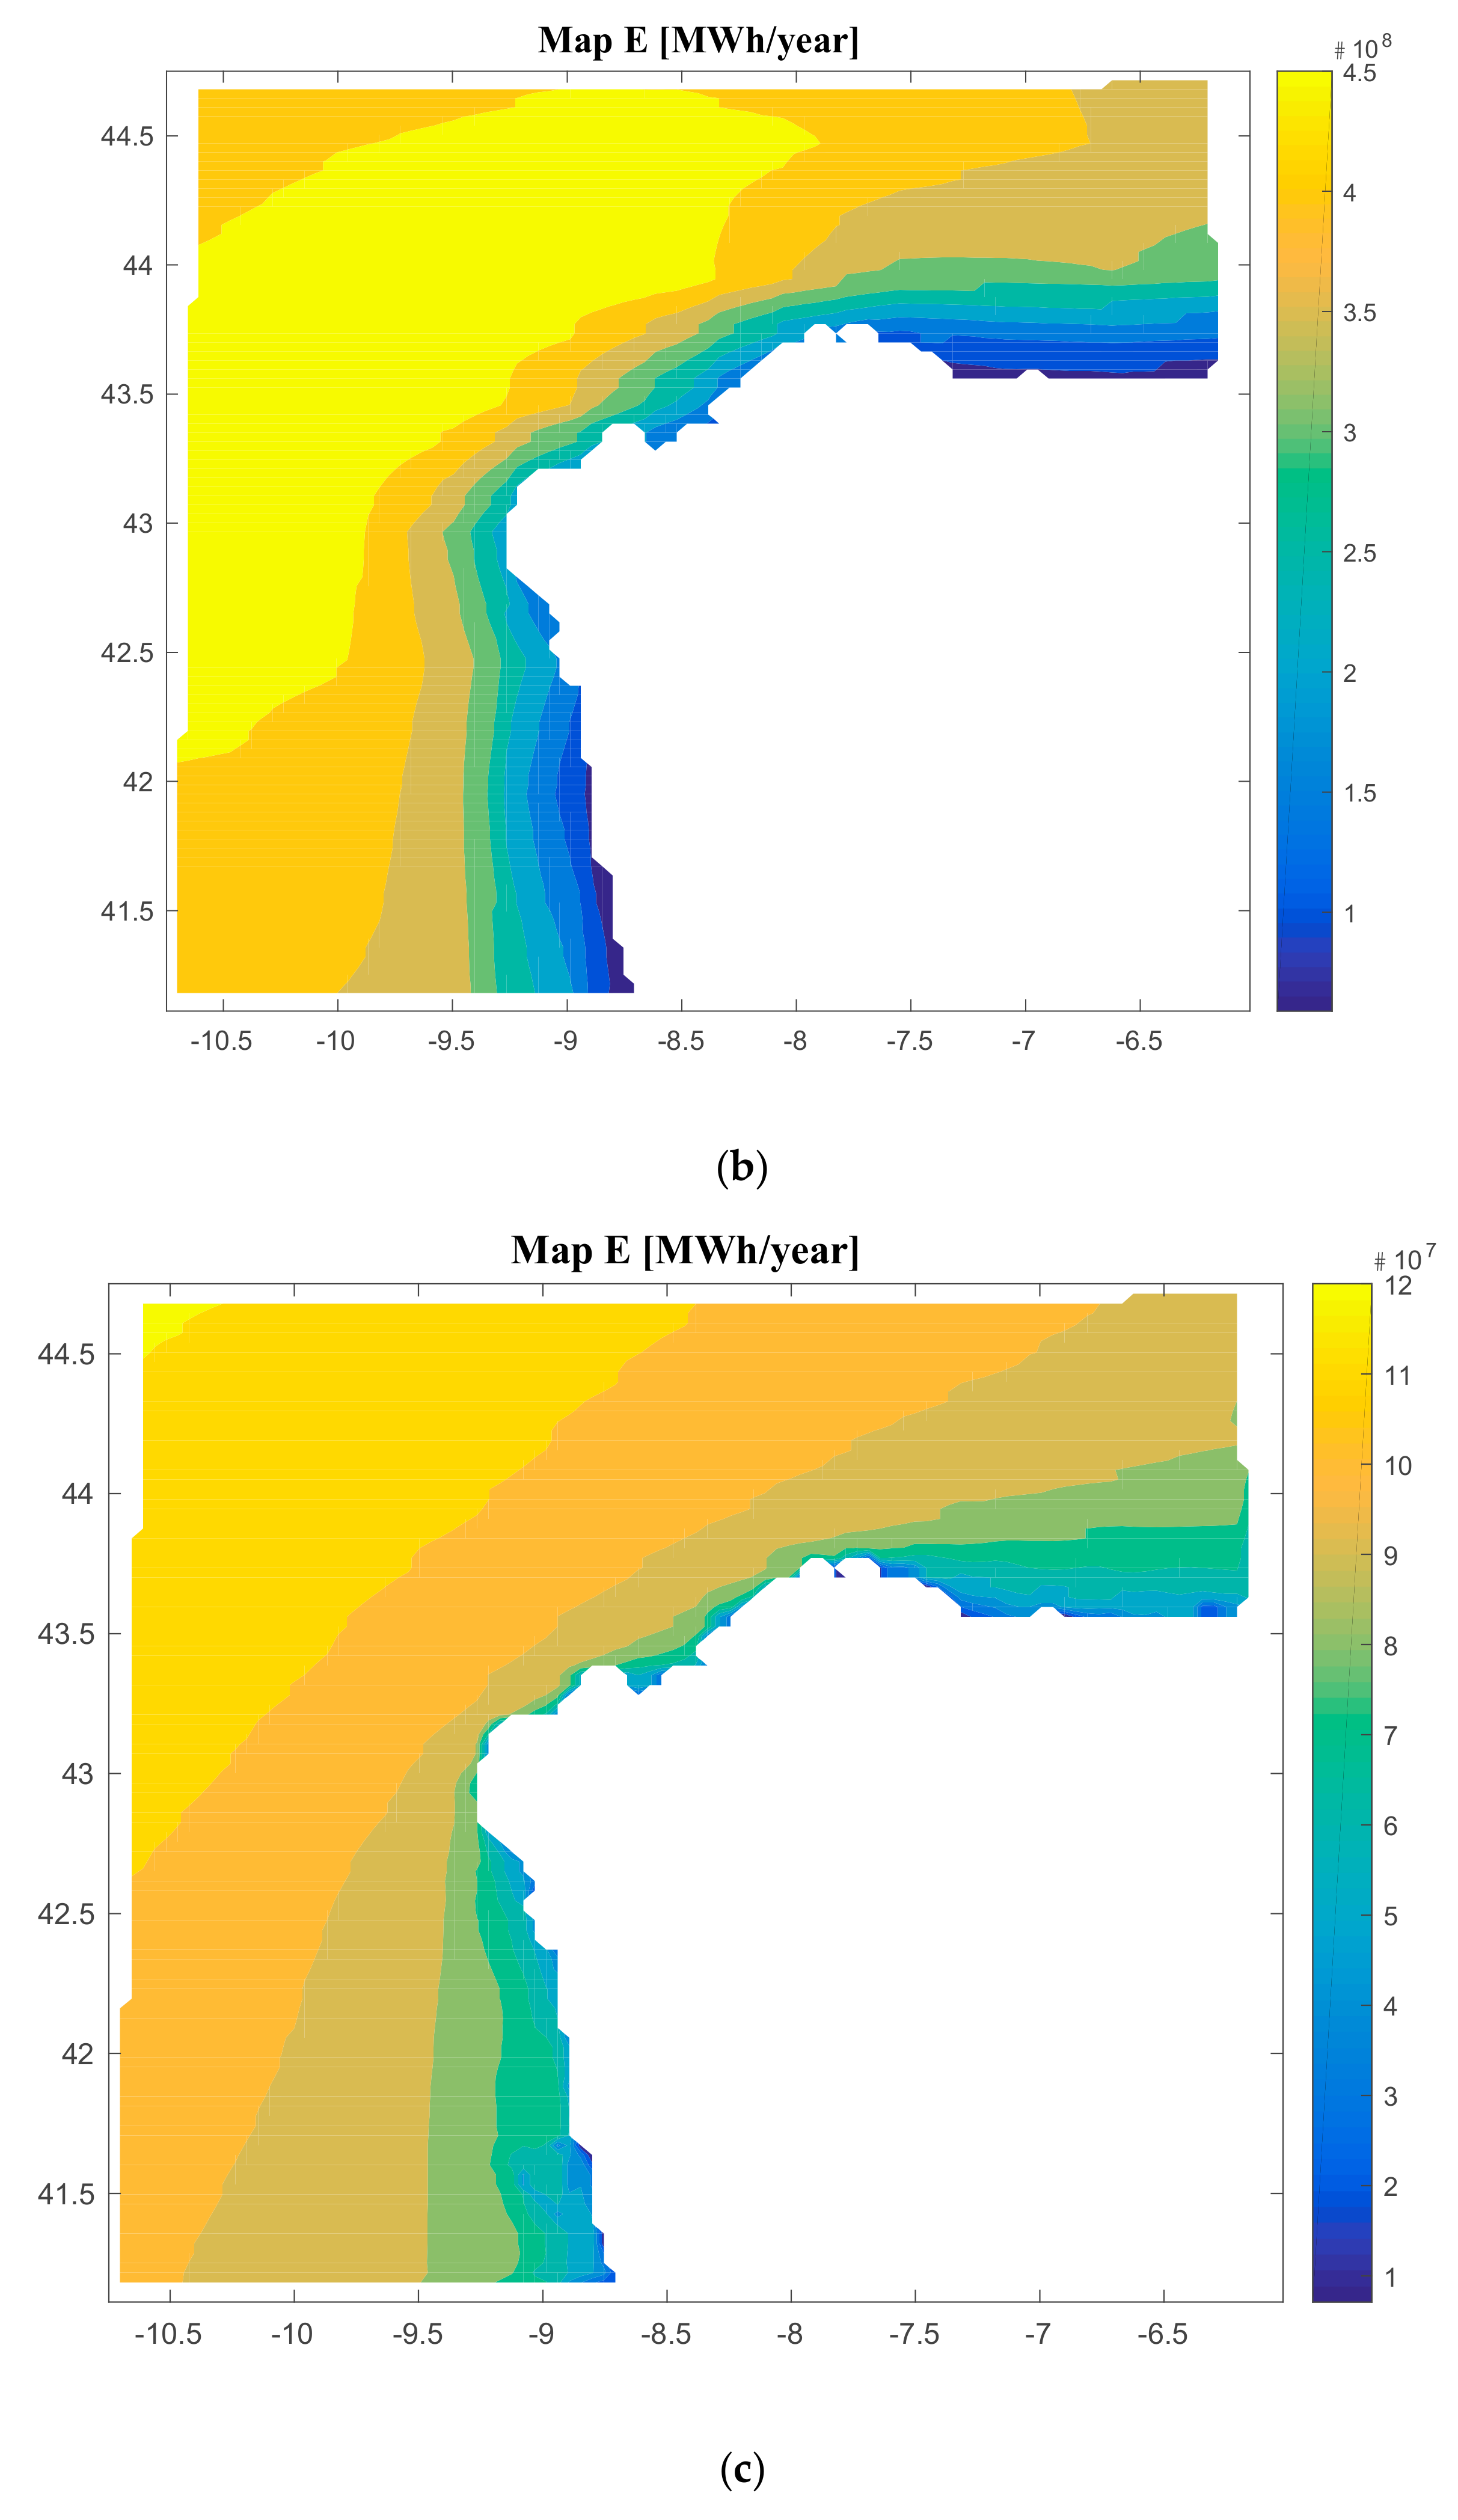
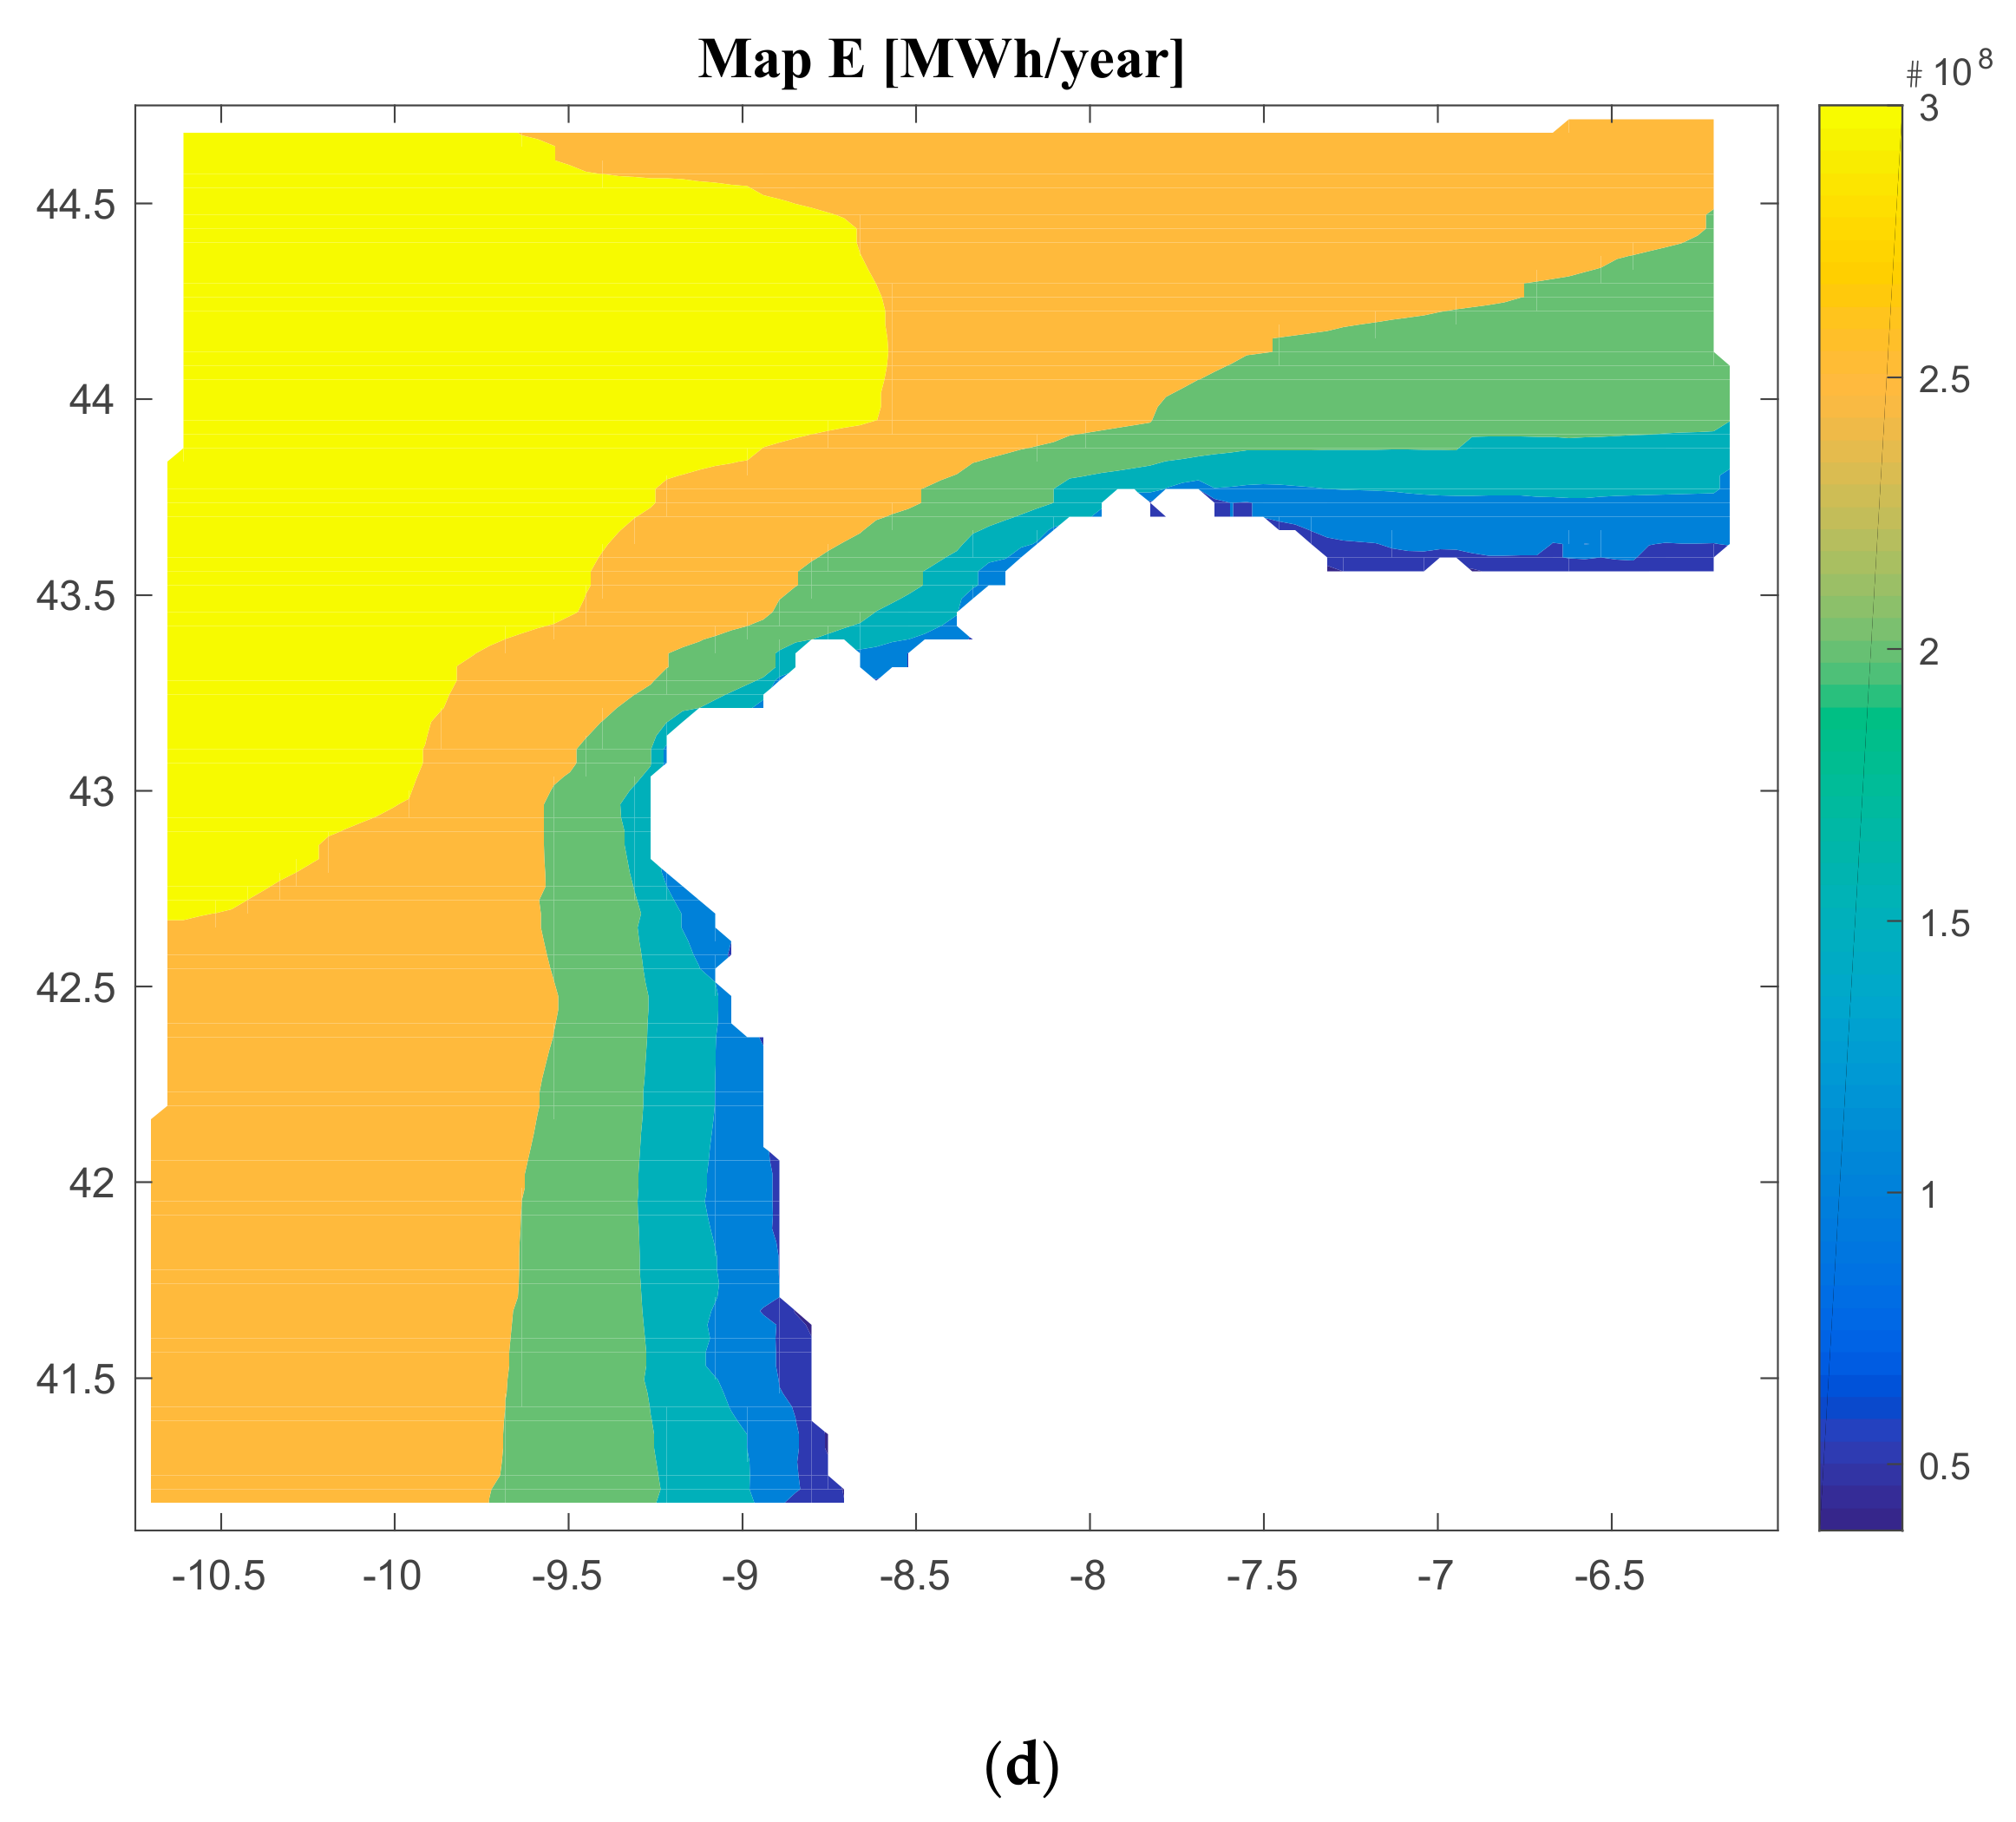
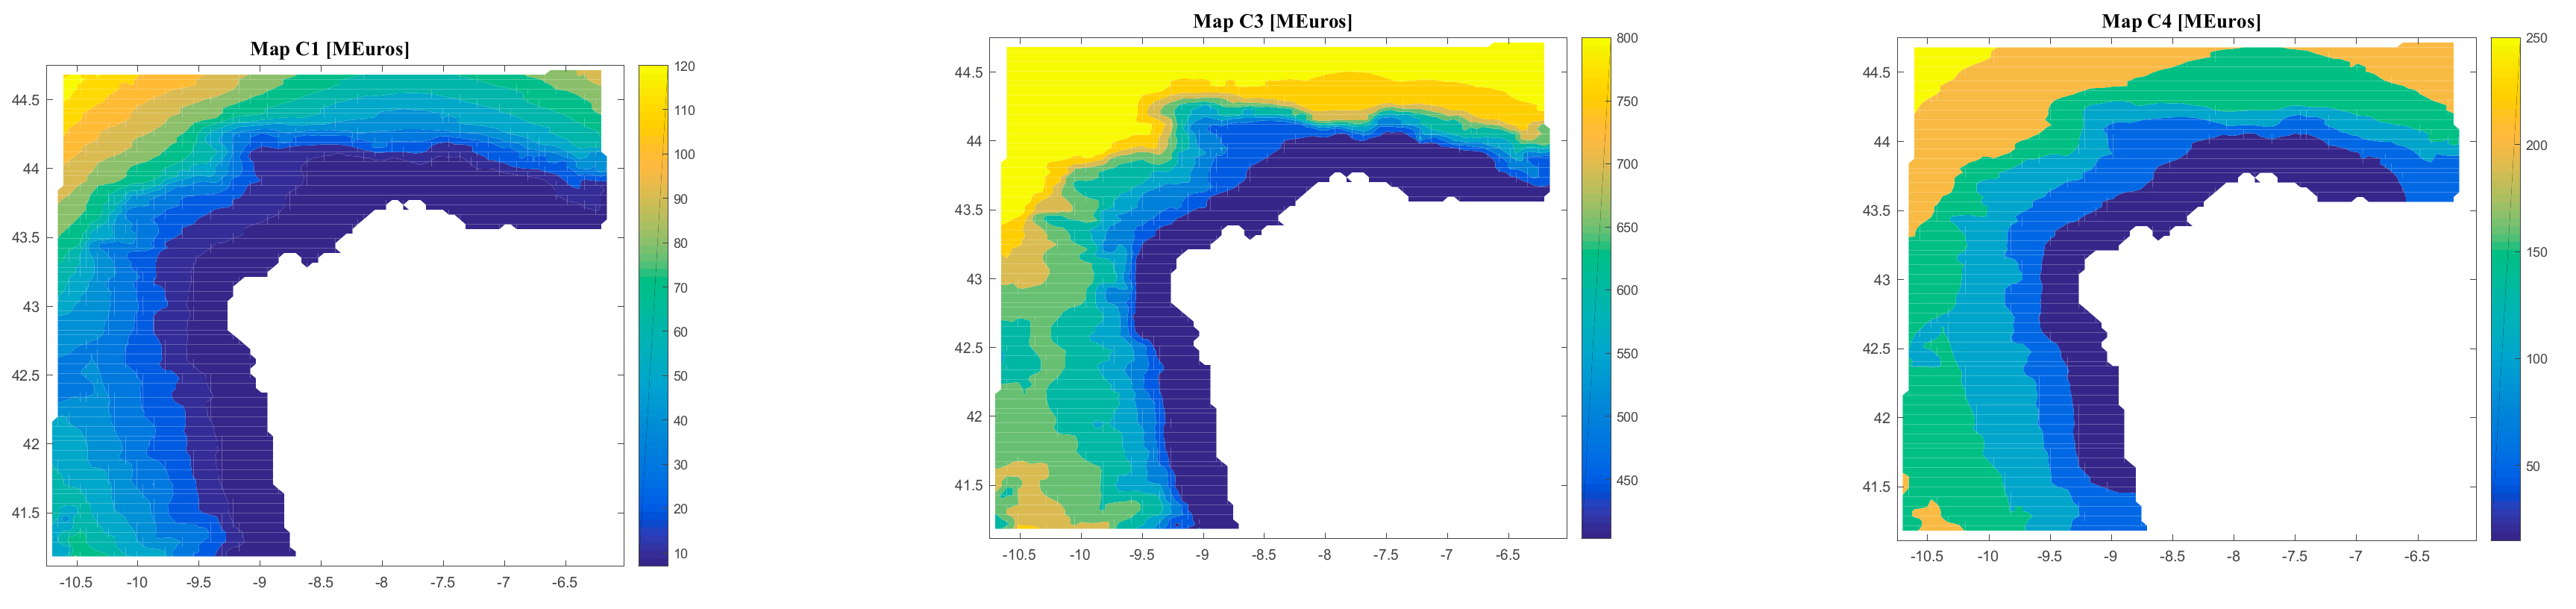
3.2. Results
4. Conclusions
Author Contributions
Funding
Conflicts of Interest
References
- Kallehave, D.; Byrne, B.W.; LeBlanc Thilsted, C.; Mikkelsen, K.K. Optimization of monopiles for offshore wind turbines. Philos. Trans. R. Soc. A Math. Phys. Eng. Sci. 2015, 373, 20140100. [Google Scholar] [CrossRef] [PubMed] [Green Version]
- Henderson, A.R.; Witcher, D. Floating offshore wind energy - a review of the current status and an assessment of the prospects. Wind Eng. 2010, 34, 1–16. [Google Scholar] [CrossRef]
- Wind Europe. Offshore Wind in Europe; Wind Europe: Brussels, Belgium, 2018. [Google Scholar]
- Henderson, A.R.; Leutz, R.; Fujii, T. Potential for floating offshore wind energy in japanese waters. In Proceedings of the 12th International Offshore and Polar Engineering Conference, Kitakyushu, Japan, 26–31 May 2002; International Society of Offshore and Polar Engineers: Mountain View, CA, USA, 2002; Volume 3, pp. 505–512. [Google Scholar]
- Kosugi, A.; Ogata, R.; Kagemoto, H.; Akutsu, Y.; Kinoshita, T. A feasibility study on a floating wind farm off Japan coast. In Proceedings of the 12th 2002 International Offshore and Polar Engineering Conference, Kitakyushu, Japan, 26–31 May 2002. [Google Scholar]
- Ulazia, A.; Gonzalez-Roji, S.J.; Ibarra-Berastegi, G.; Carreno-Madinabeitia, S.; Saenz, J.; Nafarrate, A. Seasonal Air Density Variations over the East of Scotland and the Consequences for Offshore Wind Energy. In Proceedings of the 7th International IEEE Conference on Renewable Energy Research and Applications (ICRERA 2018), Paris, France, 14–17 October 2018; Volume 5, pp. 261–265. [Google Scholar]
- Myhr, A.; Bjerkseter, C.; Ågotnes, A.; Nygaard, T.A. Levelised cost of energy for offshore floating wind turbines in a lifecycle perspective. Renew. Energy 2014, 66, 714–728. [Google Scholar] [CrossRef] [Green Version]
- Repsol Repsol. Available online: http://www.repsol.es (accessed on 26 December 2019).
- Navantia Navantia. Available online: http://www.navantia.es (accessed on 26 December 2019).
- Schillings, C.; Wanderer, T.; Cameron, L.; van der Wal, J.T.; Jacquemin, J.; Veum, K. A decision support system for assessing offshore wind energy potential in the North Sea. Energy Policy 2012, 49, 541–551. [Google Scholar] [CrossRef] [Green Version]
- Castro-Santos, L.; Prado Garcia, G.; Estanqueiro, A.; Justino, P.A.P.S. The Levelized Cost of Energy (LCOE) of wave energy using GIS based analysis: The case study of Portugal. Int. J. Electr. Power Energy Syst. 2015, 65, 21–25. [Google Scholar] [CrossRef] [Green Version]
- Itiki, R.; Di Santo, S.G.; Costa, E.C.M.; Monaro, R.M. Methodology for mapping operational zones of VSC-HVDC transmission system on offshore ports. Int. J. Electr. Power Energy Syst. 2017, 93, 266–275. [Google Scholar] [CrossRef]
- Castro-Santos, L.; Filgueira-Vizoso, A.; Lamas-Galdo, I.; Carral-Couce, L. Methodology to calculate the installation costs of offshore wind farms located in deep waters. J. Clean. Prod. 2018, 170, 1124–1135. [Google Scholar] [CrossRef]
- Aubault, A.; Cermelli, C.; Roddier, D. Windfloat: a floating foundation for offshore wind turbines. Part III: Structural analysis. In Proceedings of the 28th ASME International Conference on Ocean, offshore and Arctic Engineering (OMAE 2009), Honolulu, HI, USA, 31 May–5 June 2009; pp. 1–8. [Google Scholar]
- Maciel, J. The WindFloat Project; EDP: Lisbon, Portugal, 2010. [Google Scholar]
- Matha, D. Model Development and Loads Analysis of an Offshore Wind Turbine on a Tension Leg Platform with a Comparison to Other Floating Turbine Concepts; National Renewable Energy Laboratory (NREL): Golden, CO, USA, 2010.
- Oguz, E.; Clelland, D.; Day, A.H.; Incecik, A.; López, J.A.; Sánchez, G.; Almeria, G.G. Experimental and numerical analysis of a TLP floating offshore wind turbine. Ocean Eng. 2018, 147, 591–605. [Google Scholar] [CrossRef] [Green Version]
- Driscoll, F.; Jonkman, J.; Robertson, A.; Sirnivas, S.; Skaare, B.; Nielsen, F.G. Validation of a FAST Model of the Statoil-hywind Demo Floating Wind Turbine. Energy Procedia 2016, 94, 3–19. [Google Scholar] [CrossRef] [Green Version]
- Athanasia, A. Deep offshore and new foundation concepts. In DeepWind2013; DeepWind: Trondheim, Norway, 2013; p. 17. [Google Scholar]
- Jonkman, J.; Matha, D. Dynamics of offshore floating wind turbines — analysis of three concepts. Wind Energy 2011, 14, 557–569. [Google Scholar] [CrossRef]
- Jonkman, J.; Matha, D. A Quantitative Comparison of the Responses of Three Floating Platforms; National Renewable Energy Laboratory (NREL): Stockholm, Sweden, 2010.
- Sclavounos, P.D.; Lee, S.; DiPietro, J. Floating offshore wind turbines: Tension leg platform and taught leg buoy concepts supporting 3–5 mw wind turbines. In Proceedings of the European Wind Energy Conference (EWEC), Warsaw, Poland, 20–23 April 2010; pp. 1–7. [Google Scholar]
- Collu, M.; Kolios, A.A.J.; Chabardehi, A.; Brennan, F. Marine Renewable and Offshore Wind Energy; RINA—Royal Institution of Naval Architects: London, UK, 2010; pp. 63–74. [Google Scholar]
- Wind Europe. Driving Cost Reductions in Offshore Wind. Available online: https://windeurope.org/about-wind/reports/driving-cost-reductions-offshore-wind/ (accessed on 27 November 2017).
- Pelamis Wave Power Pelamis. Available online: http://www.pelamiswave.com (accessed on 26 December 2019).
- Weinstein, A.; Fredrikson, G.; Jane, M.; Group, P.; Denmark, K.N.R. AquaBuOY—The Offshore Wave Energy Converter Numerical Modeling and Optimization; IEEE: Piscataway, NJ, USA, 2003; pp. 1854–1859. [Google Scholar]
- Castro-Santos, L.; Silva, D.; Bento, A.R.; Salvação, N.; Soares, C.G. Economic feasibility ofwave energy farms in Portugal. Energies 2018, 11, 1–16. [Google Scholar] [CrossRef] [Green Version]
- Pelagic Power AS W2Power. Available online: http://www.pelagicpower.no/ (accessed on 17 December 2016).
- Castro-Santos, L.; Martins, E.; Soares, C.G. Methodology to calculate the costs of a floating offshore renewable energy farm. Energies 2016, 9, 324. [Google Scholar] [CrossRef] [Green Version]
- Castro-Santos, L.; Filgueira-Vizoso, A.; Carral-Couce, L.; Formoso, J.Á.F. Economic feasibility of floating offshore wind farms. Energy 2016, 112, 868–882. [Google Scholar] [CrossRef]
- Castro-Santos, L.; Diaz-Casas, V. Life-cycle cost analysis of floating offshore wind farms. Renew. Energy 2014, 66, 41–48. [Google Scholar]
- Dunnett, D.; Wallace, J.S. Electricity generation from wave power in Canada. Renew. Energy 2009, 34, 179–195. [Google Scholar] [CrossRef]
- Page, W.D.W. Wave Dragon Technology. Available online: http://www.wavedragon.net (accessed on 7 September 2016).
- Floating Power Plant AS Poseidon Floating Power. Available online: http://www.floatingpowerplant.com/ (accessed on 17 February 2016).
- Castro-Santos, L.; Martins, E.; Guedes Soares, C. Economic comparison of technological alternatives to harness offshore wind and wave energies. Energy 2017, 140, 1121–1130. [Google Scholar] [CrossRef]
- Silva, D.; Bento, A.R.; Martinho, P.; Guedes Soares, C. High Resolution local wave energy modelling in the Iberian Peninsula. Energy 2015, 91, 1099–1112. [Google Scholar] [CrossRef]
- Silva, D.; Rusu, E.; Guedes Soares, C. Evaluation of Various Technologies for Wave Energy Conversion in the Portuguese Nearshore. Energies 2013, 6, 1344–1364. [Google Scholar] [CrossRef]
- Castro-Santos, L.; Martins, E.; Guedes Soares, C. Cost assessment methodology for hybrid floating offshore renewable energy platforms. Renew. Energy 2016, 97, 866–880. [Google Scholar] [CrossRef]
- Roddier, D.; Cermelli, C. Windfloat: A floating foundation for offshore wind turbines. Part I: Design basis and qualification process. In Proceedings of the 28th ASME International Conference on Ocean, Offshore and Arctic Engineering (OMAE 2009), Honolulu, HI, USA, 31 May–5 June 2009; pp. 1–9. [Google Scholar]


| Input | Types |
|---|---|
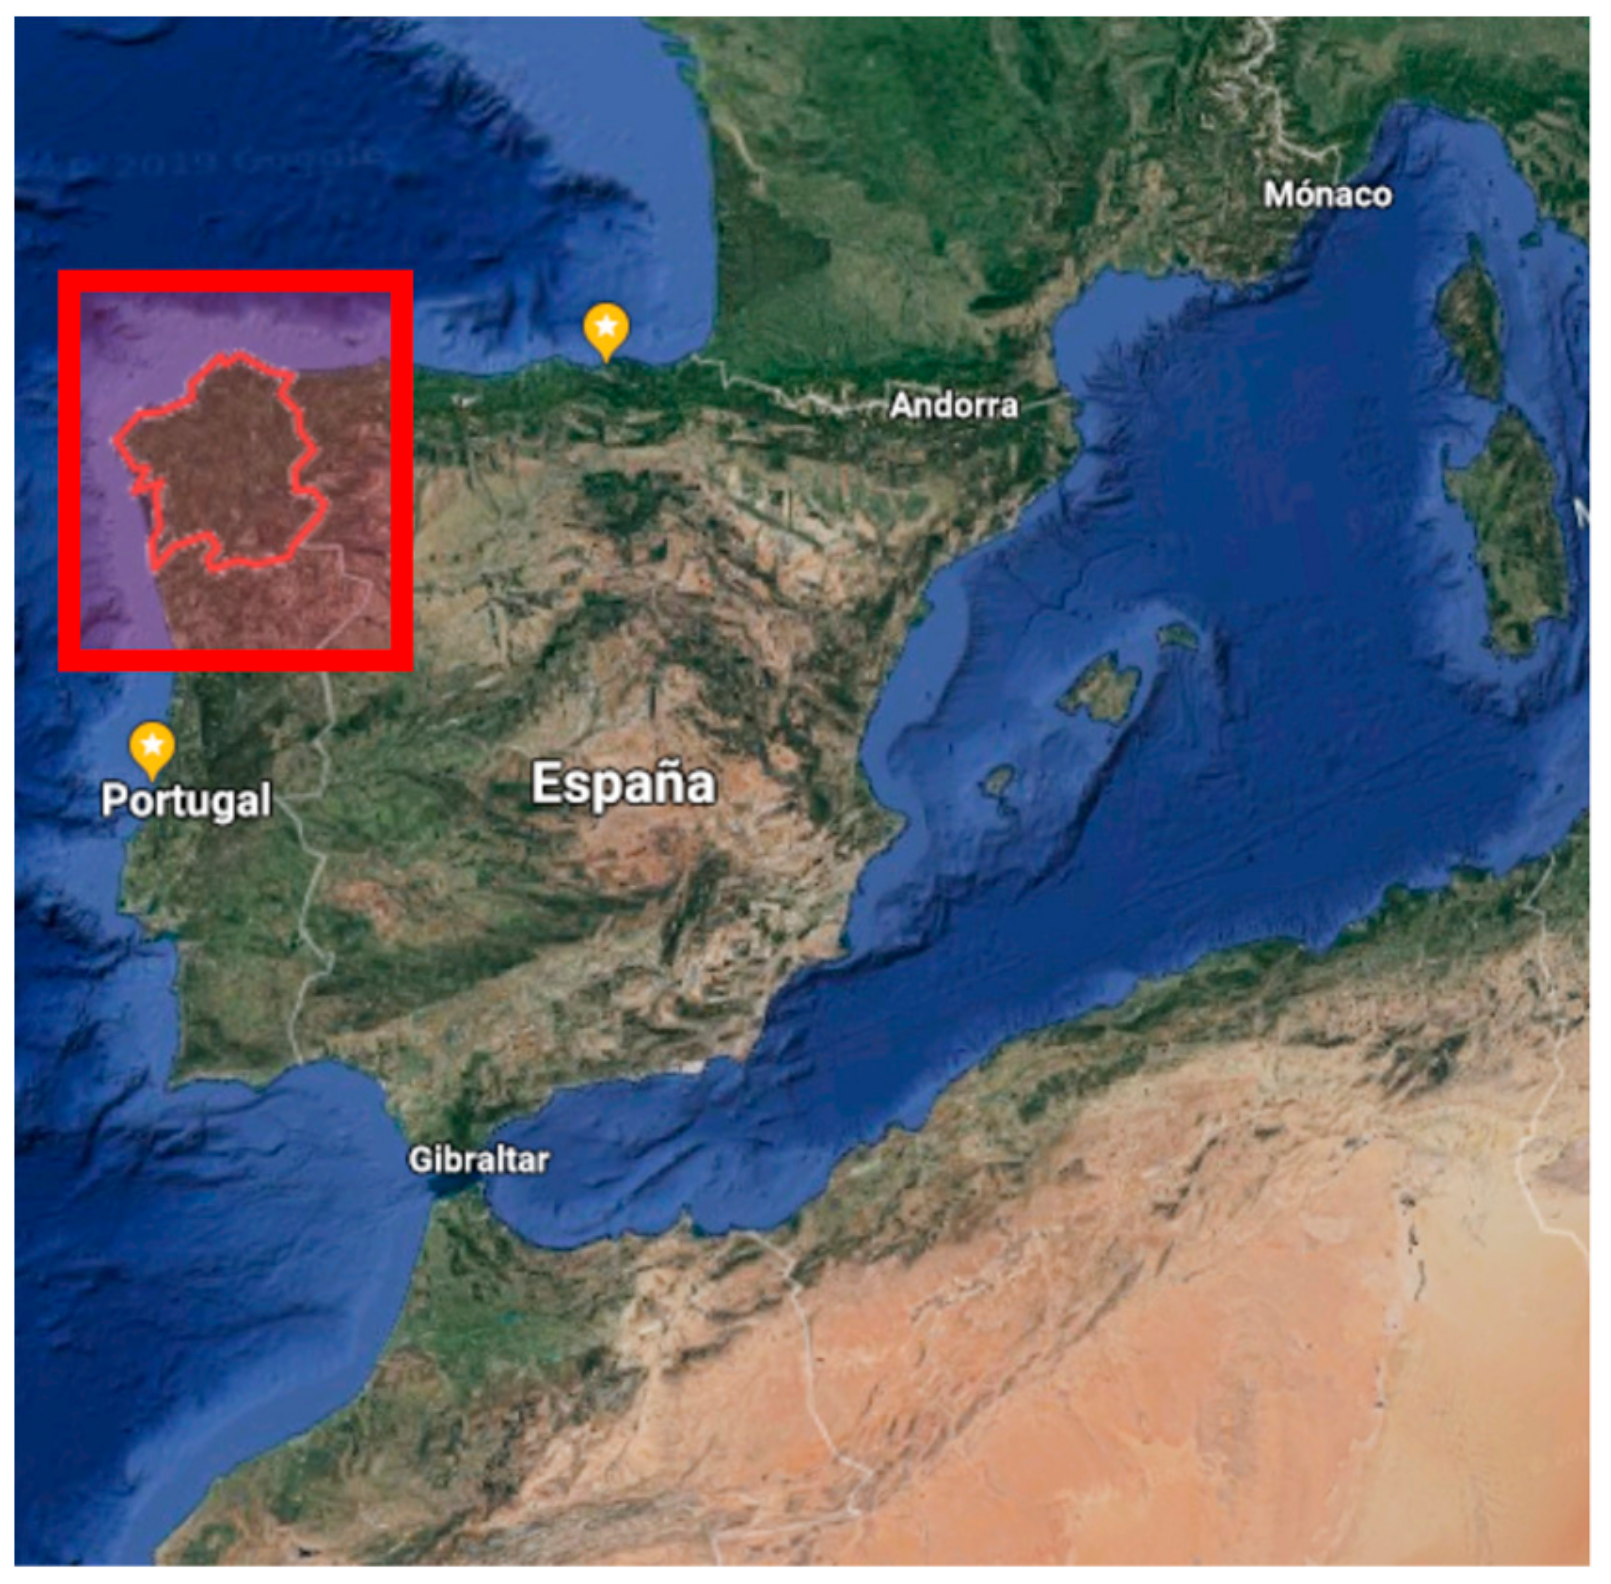
| Location | Galicia |
| Galicia and Cantabric region | |
| Portugal | |
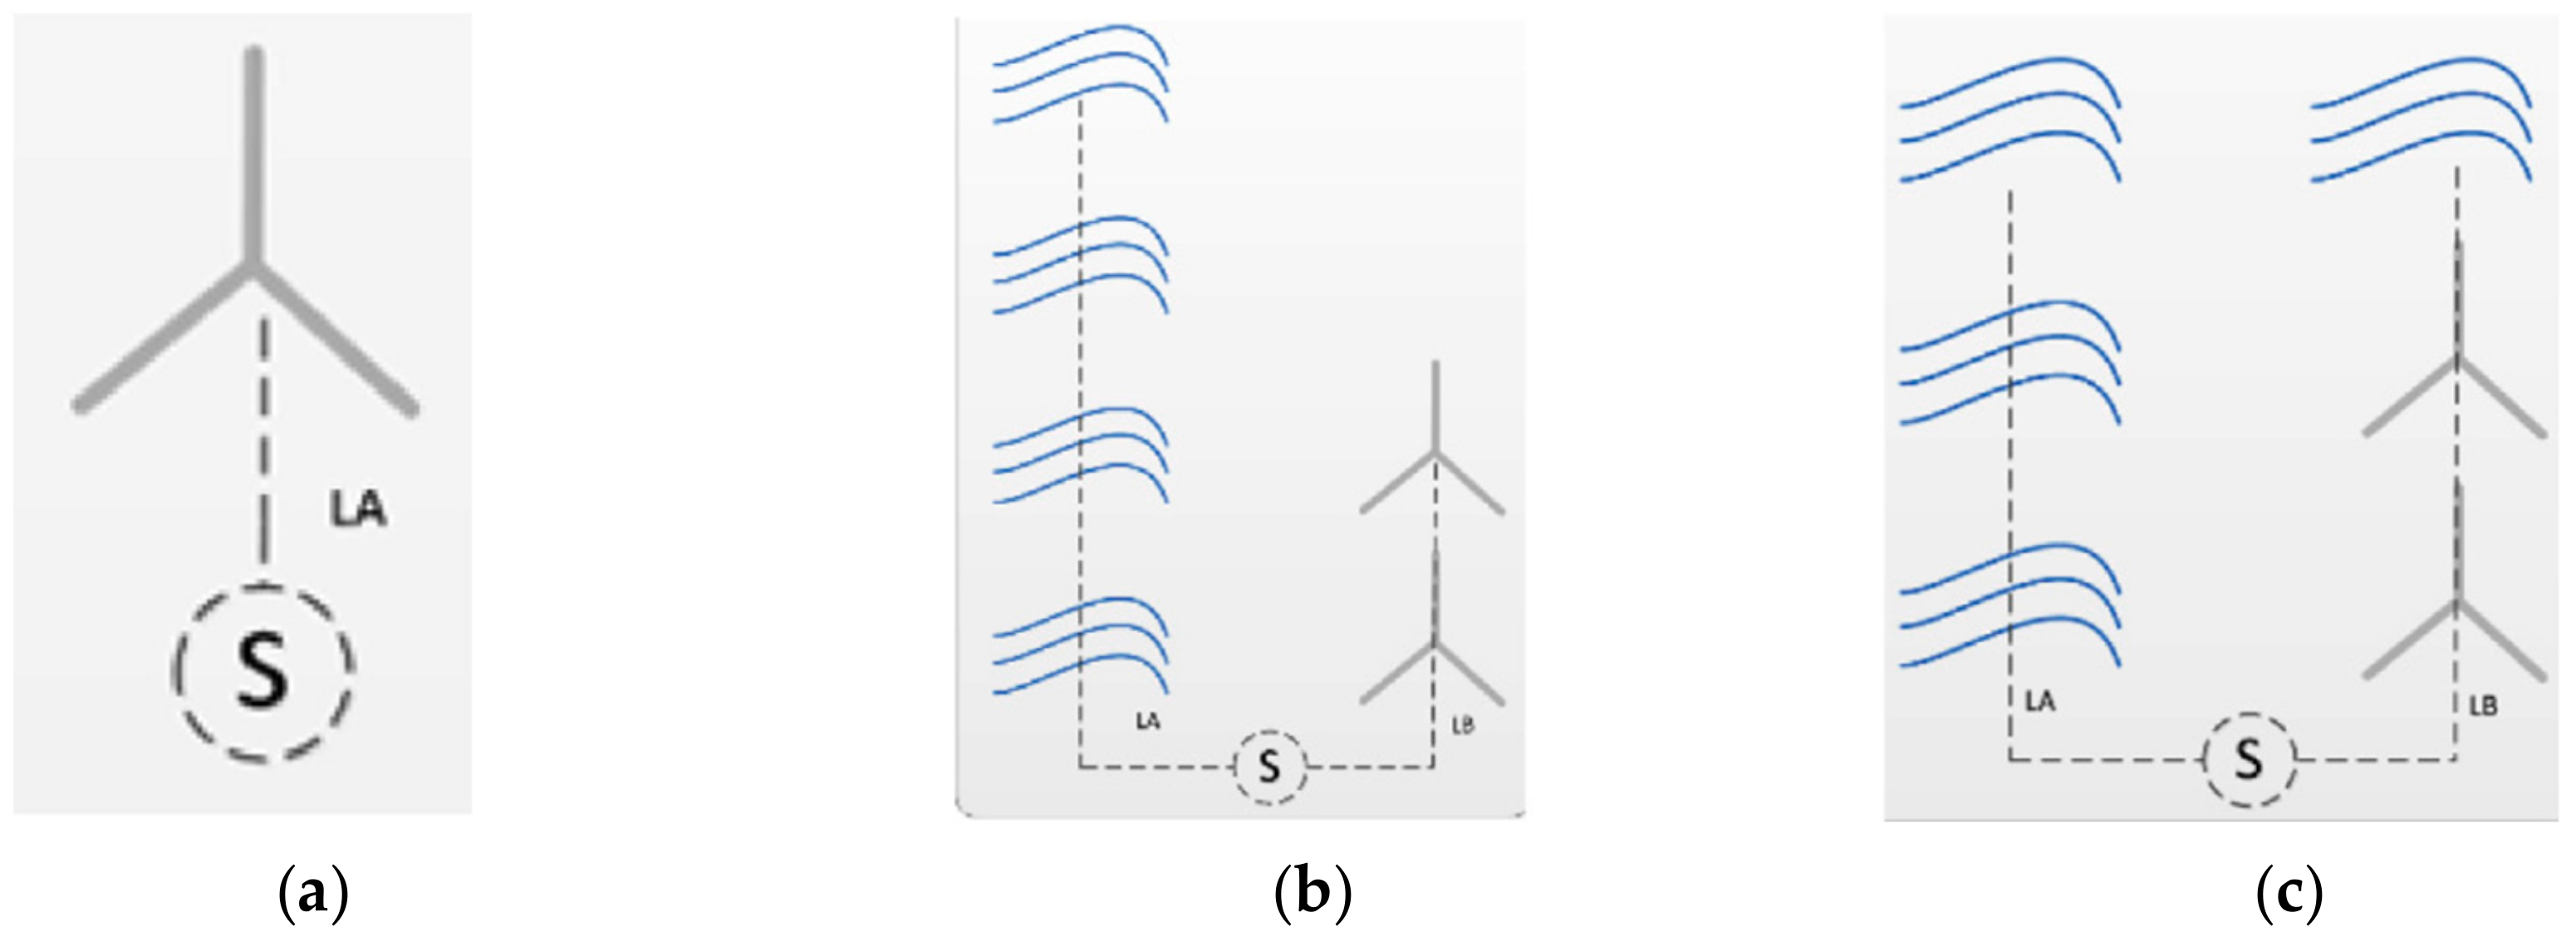
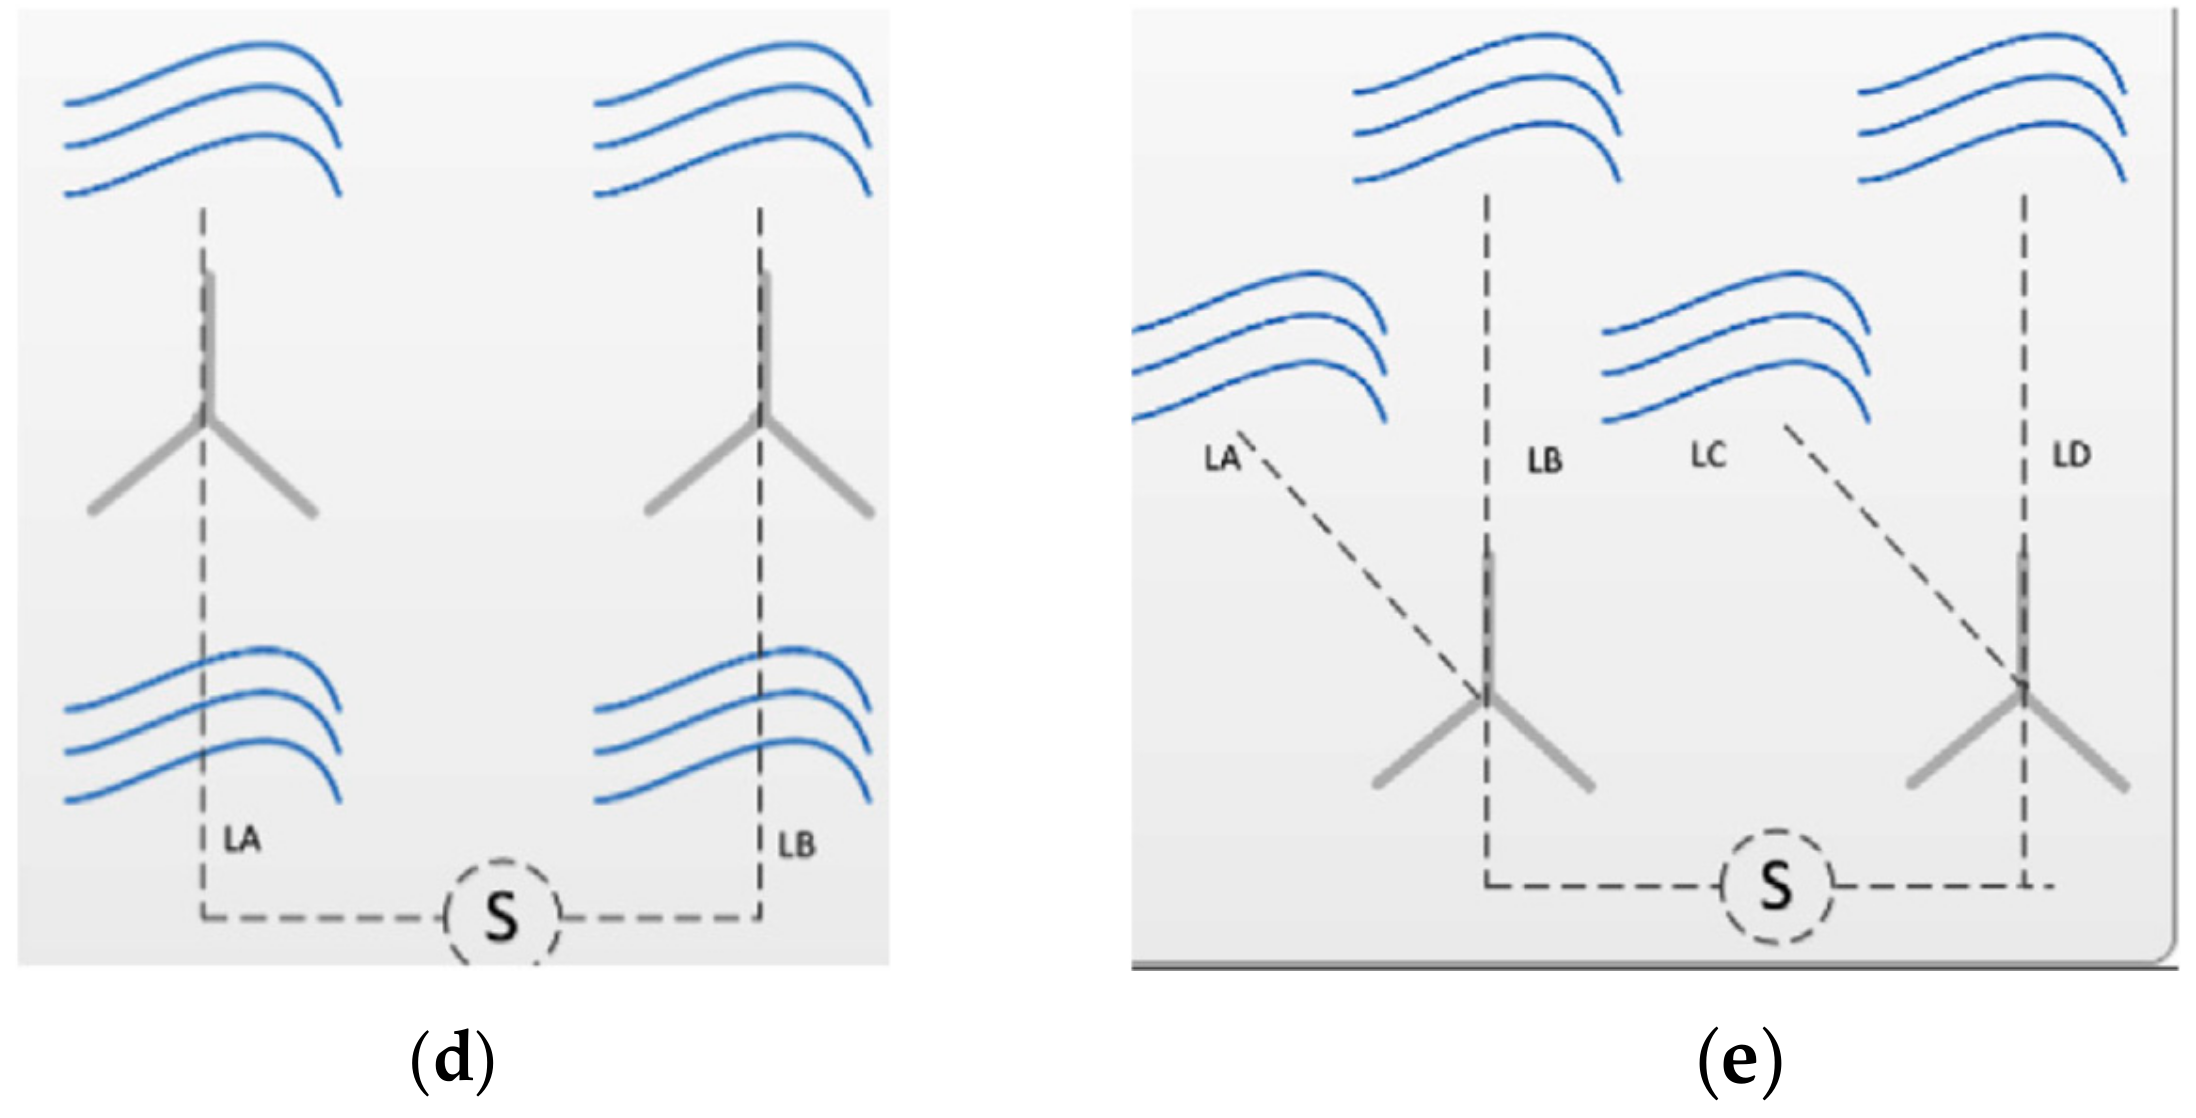
| Configuration of the farm | One renewable energy |
| Two renewable energies-independent arrays | |
| Two renewable energies-peripherally distributed array | |
| Two renewable energies-uniformly distributed array | |
| Two renewable energies-non-uniformly distributed array | |
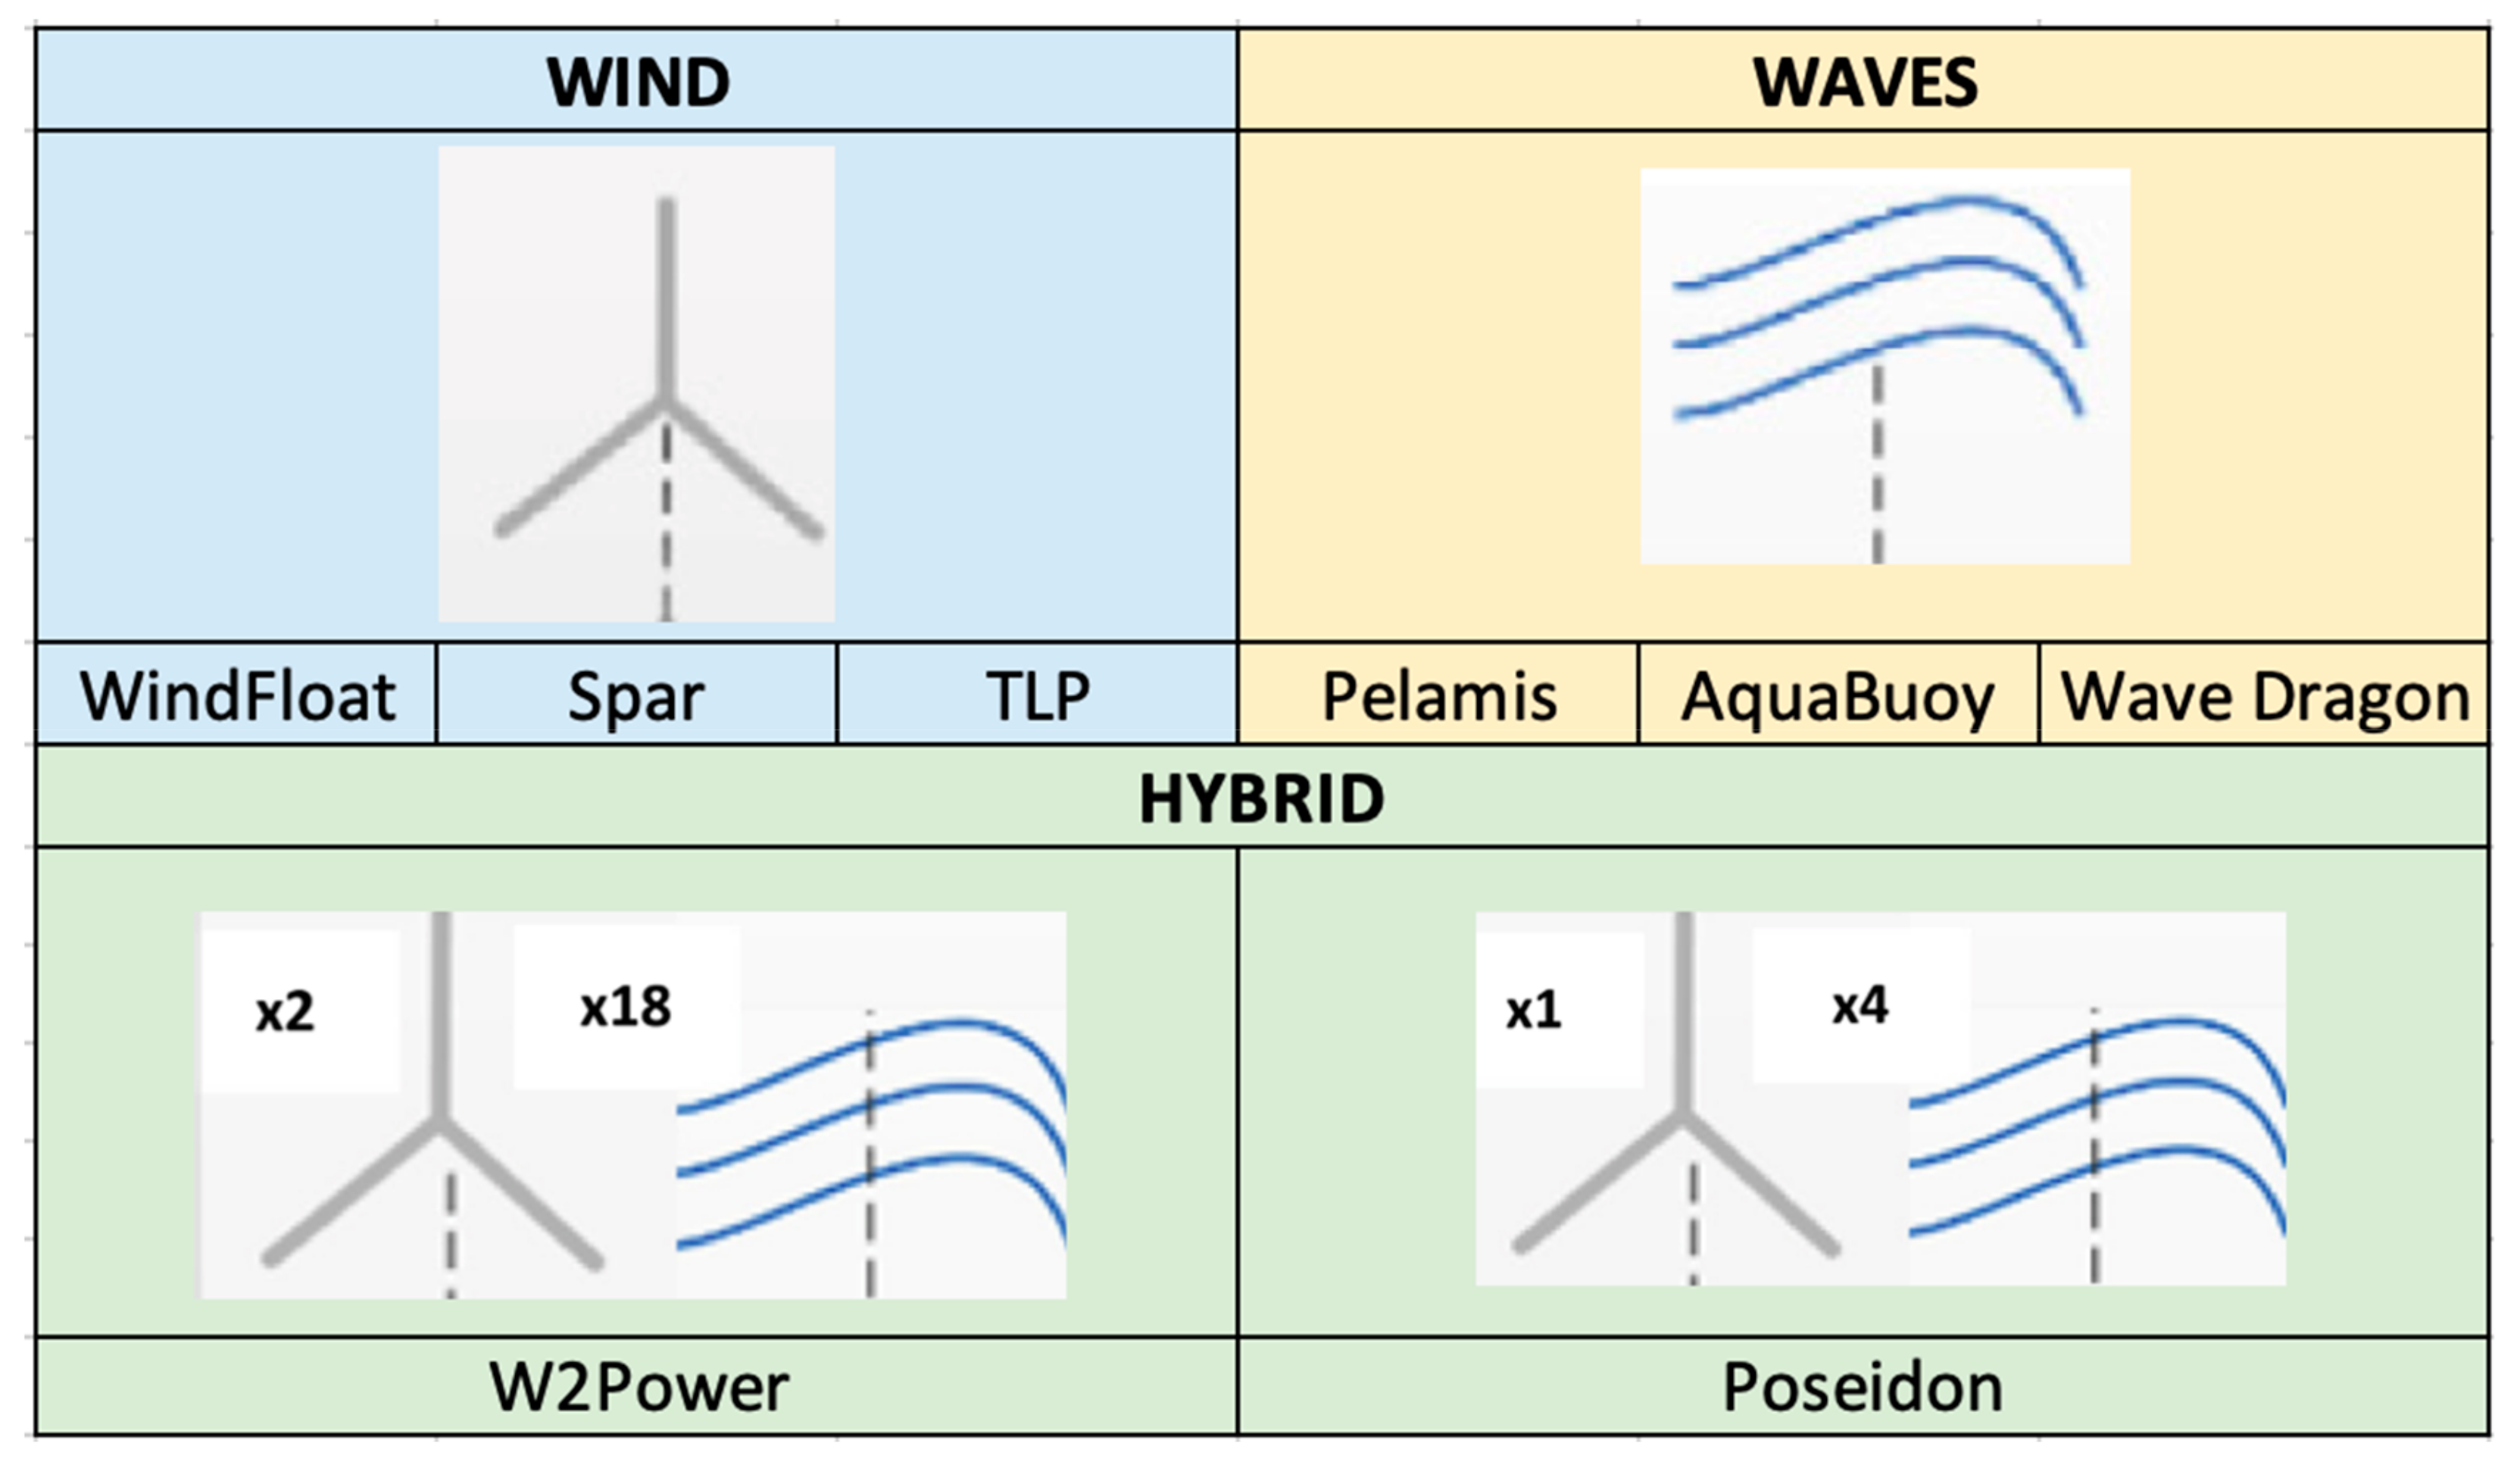
| Type of floating platform | WindFloat |
| Pelamis | |
| AquaBuoy | |
| Wave Dragon | |
| W2Power | |
| Poseidon | |
| TLP | |
| Spar | |
| Type of calculation of the wave’s energy | T and H |
| Matrix |
| Inputs |
|---|
| Power of the farm (MW) |
| Life-cycle of the farm (years) |
| Electric tariff (€/MWh) |
| Capital cost (%) |
| Corporate tax (%) |
| Steel cost (€/ton) |
| Percentage of Financing (%) |
| Interest (%) |
| Capacity of the shipyard (platform/year) |
| Te(s)Hs(m) | Power Matrix (in kW) | ||||||||||||||||
|---|---|---|---|---|---|---|---|---|---|---|---|---|---|---|---|---|---|
| 5 | 5.5 | 6 | 6.5 | 7 | 7.5 | 8 | 8.5 | 9 | 9.5 | 10 | 10.5 | 11 | 11.5 | 12 | 12.5 | 13 | |
| 0.5 | 0 | 0 | 0 | 0 | 0 | 0 | 0 | 0 | 0 | 0 | 0 | 0 | 0 | 0 | 0 | 0 | 0 |
| 1 | 0 | 22 | 29 | 34 | 37 | 38 | 38 | 37 | 35 | 32 | 29 | 26 | 23 | 21 | 0 | 0 | 0 |
| 1.5 | 32 | 50 | 65 | 76 | 83 | 86 | 86 | 83 | 78 | 72 | 65 | 59 | 53 | 47 | 42 | 37 | 33 |
| 2 | 57 | 88 | 115 | 136 | 148 | 153 | 152 | 147 | 138 | 127 | 116 | 104 | 93 | 83 | 74 | 66 | 59 |
| 2.5 | 89 | 138 | 180 | 212 | 231 | 238 | 238 | 230 | 216 | 199 | 181 | 163 | 146 | 130 | 116 | 103 | 92 |
| 3 | 129 | 198 | 260 | 305 | 332 | 240 | 332 | 315 | 292 | 266 | 240 | 219 | 210 | 188 | 167 | 149 | 132 |
| 3.5 | 0 | 270 | 345 | 415 | 438 | 440 | 424 | 404 | 377 | 362 | 326 | 292 | 260 | 230 | 215 | 202 | 180 |
| 4 | 0 | 0 | 462 | 502 | 540 | 546 | 530 | 499 | 475 | 429 | 384 | 366 | 339 | 301 | 267 | 237 | 213 |
| 4.5 | 0 | 0 | 544 | 635 | 642 | 648 | 628 | 590 | 562 | 528 | 473 | 432 | 382 | 356 | 338 | 300 | 266 |
| 5 | 0 | 0 | 0 | 739 | 726 | 726 | 707 | 687 | 670 | 607 | 557 | 521 | 472 | 417 | 369 | 348 | 328 |
| 5.5 | 0 | 0 | 0 | 750 | 750 | 750 | 750 | 750 | 737 | 667 | 658 | 586 | 530 | 496 | 446 | 395 | 355 |
| 6 | 0 | 0 | 0 | 0 | 750 | 750 | 750 | 750 | 750 | 750 | 711 | 633 | 619 | 558 | 512 | 470 | 415 |
| 6.5 | 0 | 0 | 0 | 0 | 750 | 750 | 750 | 750 | 750 | 750 | 750 | 743 | 658 | 621 | 579 | 512 | 481 |
| 7 | 0 | 0 | 0 | 0 | 0 | 750 | 750 | 750 | 750 | 750 | 750 | 750 | 750 | 676 | 613 | 584 | 525 |
| 7.5 | 0 | 0 | 0 | 0 | 0 | 0 | 750 | 750 | 750 | 750 | 750 | 750 | 750 | 750 | 686 | 622 | 593 |
| 8 | 0 | 0 | 0 | 0 | 0 | 0 | 0 | 750 | 750 | 750 | 750 | 750 | 750 | 750 | 750 | 690 | 625 |
| Output | Equation |
|---|---|
| Total cost | |
| Levelized cost of energy | |
| Net present value | |
| Internal rate of return |
| Input | Case of Study 1 | Case of Study 2 | Case of Study 3 | Case of Study 4 |
|---|---|---|---|---|
| Location | Galicia | Galicia | Galicia | Galicia |
| Configuration of the farm | One Renewable Energy | Two Renewable Energies–Independent Arrays (IA) | One Renewable Energy | One Renewable Energy |
| Floating platform | WindFloat | WindFloat and AquaBuoy | AquaBuoy | W2Power |
| Calculation energy waves | - | T and H | T and H | T and H |
| Input | Value | Units |
|---|---|---|
| Power of the farm | 200 | MW |
| Life-cycle of the farm | 20 | years |
| Electric tariff | 150 | €/MWh |
| Capital cost | 8% | - |
| Corporate tax | 25% | - |
| Steel cost | 524 | €/ton |
| Percentage of financing | 60% | - |
| Interest | 5.24% | - |
| Capacity of the shipyard | 5 | Platforms/year |
© 2019 by the authors. Licensee MDPI, Basel, Switzerland. This article is an open access article distributed under the terms and conditions of the Creative Commons Attribution (CC BY) license (http://creativecommons.org/licenses/by/4.0/).
Share and Cite
Castro-Santos, L.; Filgueira-Vizoso, A. A Software for Calculating the Economic Aspects of Floating Offshore Renewable Energies. Int. J. Environ. Res. Public Health 2020, 17, 218. https://doi.org/10.3390/ijerph17010218
Castro-Santos L, Filgueira-Vizoso A. A Software for Calculating the Economic Aspects of Floating Offshore Renewable Energies. International Journal of Environmental Research and Public Health. 2020; 17(1):218. https://doi.org/10.3390/ijerph17010218
Chicago/Turabian StyleCastro-Santos, Laura, and Almudena Filgueira-Vizoso. 2020. "A Software for Calculating the Economic Aspects of Floating Offshore Renewable Energies" International Journal of Environmental Research and Public Health 17, no. 1: 218. https://doi.org/10.3390/ijerph17010218