1. Introduction
Construction workers spend most of their working hours at the workplace. Their workplace environment is related directly to their health and well-being [
1]. Construction sites are generally known to be one of the workplaces with high risk of injuries and poor health [
2,
3,
4,
5,
6]. Construction workers, in particular, are prone to painful musculoskeletal strains and injuries because of their labourious and strenuous manual jobs [
7]. The pain severity is aggravated by their harsh working environment, which is associated with irregular working hours, unstructured mealtimes, tough and dusty work, and outdoor and indoor heat, etc. [
8].
Pain prevalence has been studied in the local community for decades and is useful in the evaluation of the extent of people’s pain suffering and its burden on the healthcare system. Even though construction workers have been found to suffer from musculoskeletal pain, local attention given to this group is comparatively little. Overseas studies showed different prevalence rates as a result of using different periods and case definitions, but musculoskeletal pain which was characterised by multiple pain sites was consistent in most construction trades [
9,
10,
11,
12]. In Saudi Arabi, for example, it was reported that all their subjects (
n = 165) had reported pain in the upper and lower limbs, backs, and knees [
9]. Though the study had a small sample size and provided unclear information on multiple pain sites per subject, it did highlight the significance of pain as a health challenge to the construction industry.
In a systematic review of musculoskeletal symptoms in the construction industry, it was reported that the range of one-year pain prevalence rate was from 15.1% for hip/thigh to 51.1% for low back [
13]. It is important to note the point prevalence as well because it refers to the pain which is the actual ongoing suffering of the workers concerned at the time of reporting. In the cited systematic review, the point prevalence, though heterogeneity was noted, for neck was 5.5–22.0%, shoulder 10.5 to 28.7%, elbow 12.0%, wrist/hand 21.0–28.4%, upper back 6.2–14.0%, lumbar 16.5–60.3%, hip/thigh 11.0%, knee 22.0%, and ankle/foot 13.4–19.0%. The various studies in the review were done in between 1996 and 2013. The team would argue that the changes in technology and facilities since then might have changed these figures. Furthermore, most of the studies just reported pain prevalence and very rarely took into account the severity of pain and its impact on living activities and pain relief methods [
14]. In two other studies, the risk factors that had caused pain were reported to be job-required repetitive lifting [
15] and fatigue [
16]. Furthermore, it was reported in another study that job-related stresses together with age, physical workload, effort-reward, job strain, and organizational injustices were all factors associated with musculoskeletal pain [
17]. These causes could also be applicable to the construction industry [
18].
Urban Asia, especially Hong Kong, is undergoing a construction boom today and yet we have limited understanding of the pain prevalence among our construction workers. In Hong Kong, there were about 480,998 registered construction workers in which the female to male ratio was 9.65 % to 90.35 % in 2019 [
19].
In the construction industry, it is common to find people still at work as long as they can tolerate the pain. It has been found in a 14-year prospective study that people with multiple pain sites on their body continued to report multiple pain sites at the end of the 14-year period [
20]. To avoid prolonged pain suffering in later life, it is advisable to identify pain even when it is less than intolerable and to intervene as soon as possible. In this connection, it is critical to study point prevalence that can inform the stakeholders the proportion of people who are in pain but still at work.
This study is part of a health-profiling initiative supported by the Construction Industry Council (CIC) of Hong Kong. The objectives of this initiative are to provide descriptive statistics of the demographic characteristics and comprehensive health profile of the local construction workers. After the health problems have been identified, measures can be designed and implemented for improving the physical and psychological health of the workers. This study aimed at determining the pain prevalence, reviewing the extent of the problem and workers’ pain relief behaviours, and identifying the associated risk factors for pain. The study attempted to answer the following research questions:
What was the point prevalence of pain?
What was the pain severity?
What was the pain interference?
What were their pain relief behaviours?
2. Materials and Methods
This was a case-control study held between December 2017 and December 2018 in a health-profiling initiative supported by the CIC (Grant Number: K-ZB93). Phase 1 of the initiative was held from July 2014 to August 2016. About 1200 workers’ health profiles have been recorded. The data of this study was from Phase 2 which was started at December 2017.
The research team had visited the construction sites all around Hong Kong. Research personnel stayed in the sites from 10:30 to 13:30 and recruited the construction workers by convenience sampling during their lunch breaks. All registered construction workers were invited to join the study. A total of 2021 construction workers in different construction trades were recruited. Considering the total number of registered construction worker in Hong Kong, with 5% margin of error and 95% confidence level, the estimated sample size required was 384 per group (
https://www.checkmarket.com/sample-size-calculator/).
After obtaining their written consent, their body height, body weight and peak expiratory flow rate (measured by peak flow meter) were measured; then an electronic form questionnaire (e-questionnaire) was administered to the workers by the trained student helpers and their answers were inputted into a tablet computer. All the data were sent to a well-secured server through mobile network immediately. The e-questionnaire covered the information on the workers’ demographics, job categories, work experience, dietary habit, warm-up and stretching exercises, sleep, recreation, and habits of drinking and smoking and health literacy (measured by the European Health Literacy Questionnaire (Q16)). Items in the e-questionnaire were basically extracted from the population health survey conducted by the local governmental health authority [
21].
The pain data is part of the health profiling initiative and they were collected by the Brief Pain Inventory (BPI) with established structural validity and internal consistency [
22,
23]. There were nine questions covering pain intensity, pain sites, pain relief methods, and pain interference. For the question on pain sites, the workers were asked to shade the area(s) where they felt pain in a human full body diagram with front and back views, and they also required to put an “X” on the area that hurt most. The BPI took about 5 min for a worker to complete.
As there were more than 20 construction trades, we have grouped them into three categories according to their intensity of activities for data analysis. The intensity of activities were expressed as the ratio of work metabolic rate to resting metabolic rate (METs) and the three work intensity categories are light (METs < 3.0 kcal/kg/h), moderate (METs 3.0–6.0 kcal/kg/h) and heavy (MET > 6.0 kcal/kg/h) [
24,
25].
The study was approved by The Education University of Hong Kong (EdUHK) and ethics approval was obtained prior to the commencement of the study (Human Research Ethics Committee Reference Number: 2017-2018-0259).
The demographic characteristics, trades distribution, behavioural characteristics, pain intensities and interference scores of the construction workers were reported using descriptive statistics. The comparisons between pain and non-pain groups were analyzed by chi-square (X2) for frequency counts. For pain scores, the comparisons between gender and age groups were done by independent sample t-test and analysis of variance (ANOVA). All results were considered as statistically significant when p-value was smaller than 0.05.
3. Results
Among the 2021 subjects, 356 (17.6%) were female and 1665 (82.4%) male. There were no significant differences in gender, age group, ethnicity, education level, and work intensity between the pain and non-pain groups (
Table 1).
A total of more than 20 construction trades were included in the sample (
Table 2). About 40% of them were general labourers.
Table 3 shows the behavioural characteristics of all workers by pain status. The trades were grouped according to work intensity (light, moderate, and heavy) for analysis [
24,
25]. A majority of them had moderate work intensity. About 60% of them were on daily wages, without job security or any long-term employment benefits.
There were significant differences in pain status for their years of service in current companies (df = 252.314, t = −2.122, p = 0.035) and average daily sleep hours (df = 256.343, t = 2.804, p = 0.005). Specifically, those with pain had stayed with the same company for a longer period of time and those slept less hours suffered more pain. After further statistical analysis, there was significant correlation between pain and average sleep hours (r = −0.066, p = 0.003). However, there were no associations of pain with gender, work intensity, age, or body mass index.
3.1. Characteristics of Pain and Pain Management
3.1.1. Pain Prevalence and Pain Intensity
The pain prevalence in the last 24 h was found to be 10.6 % (215/2021). As for pain intensity, it was measured on a 0–10 scale, with 0 as ‘no pain’ and 10 as ‘pain as bad as it could be’.
Table 4 shows the pain intensities (worst, least, average, and current) as reported by the workers and the level of pain was mild [
26].
3.1.2. Pain Location and Pain Sites
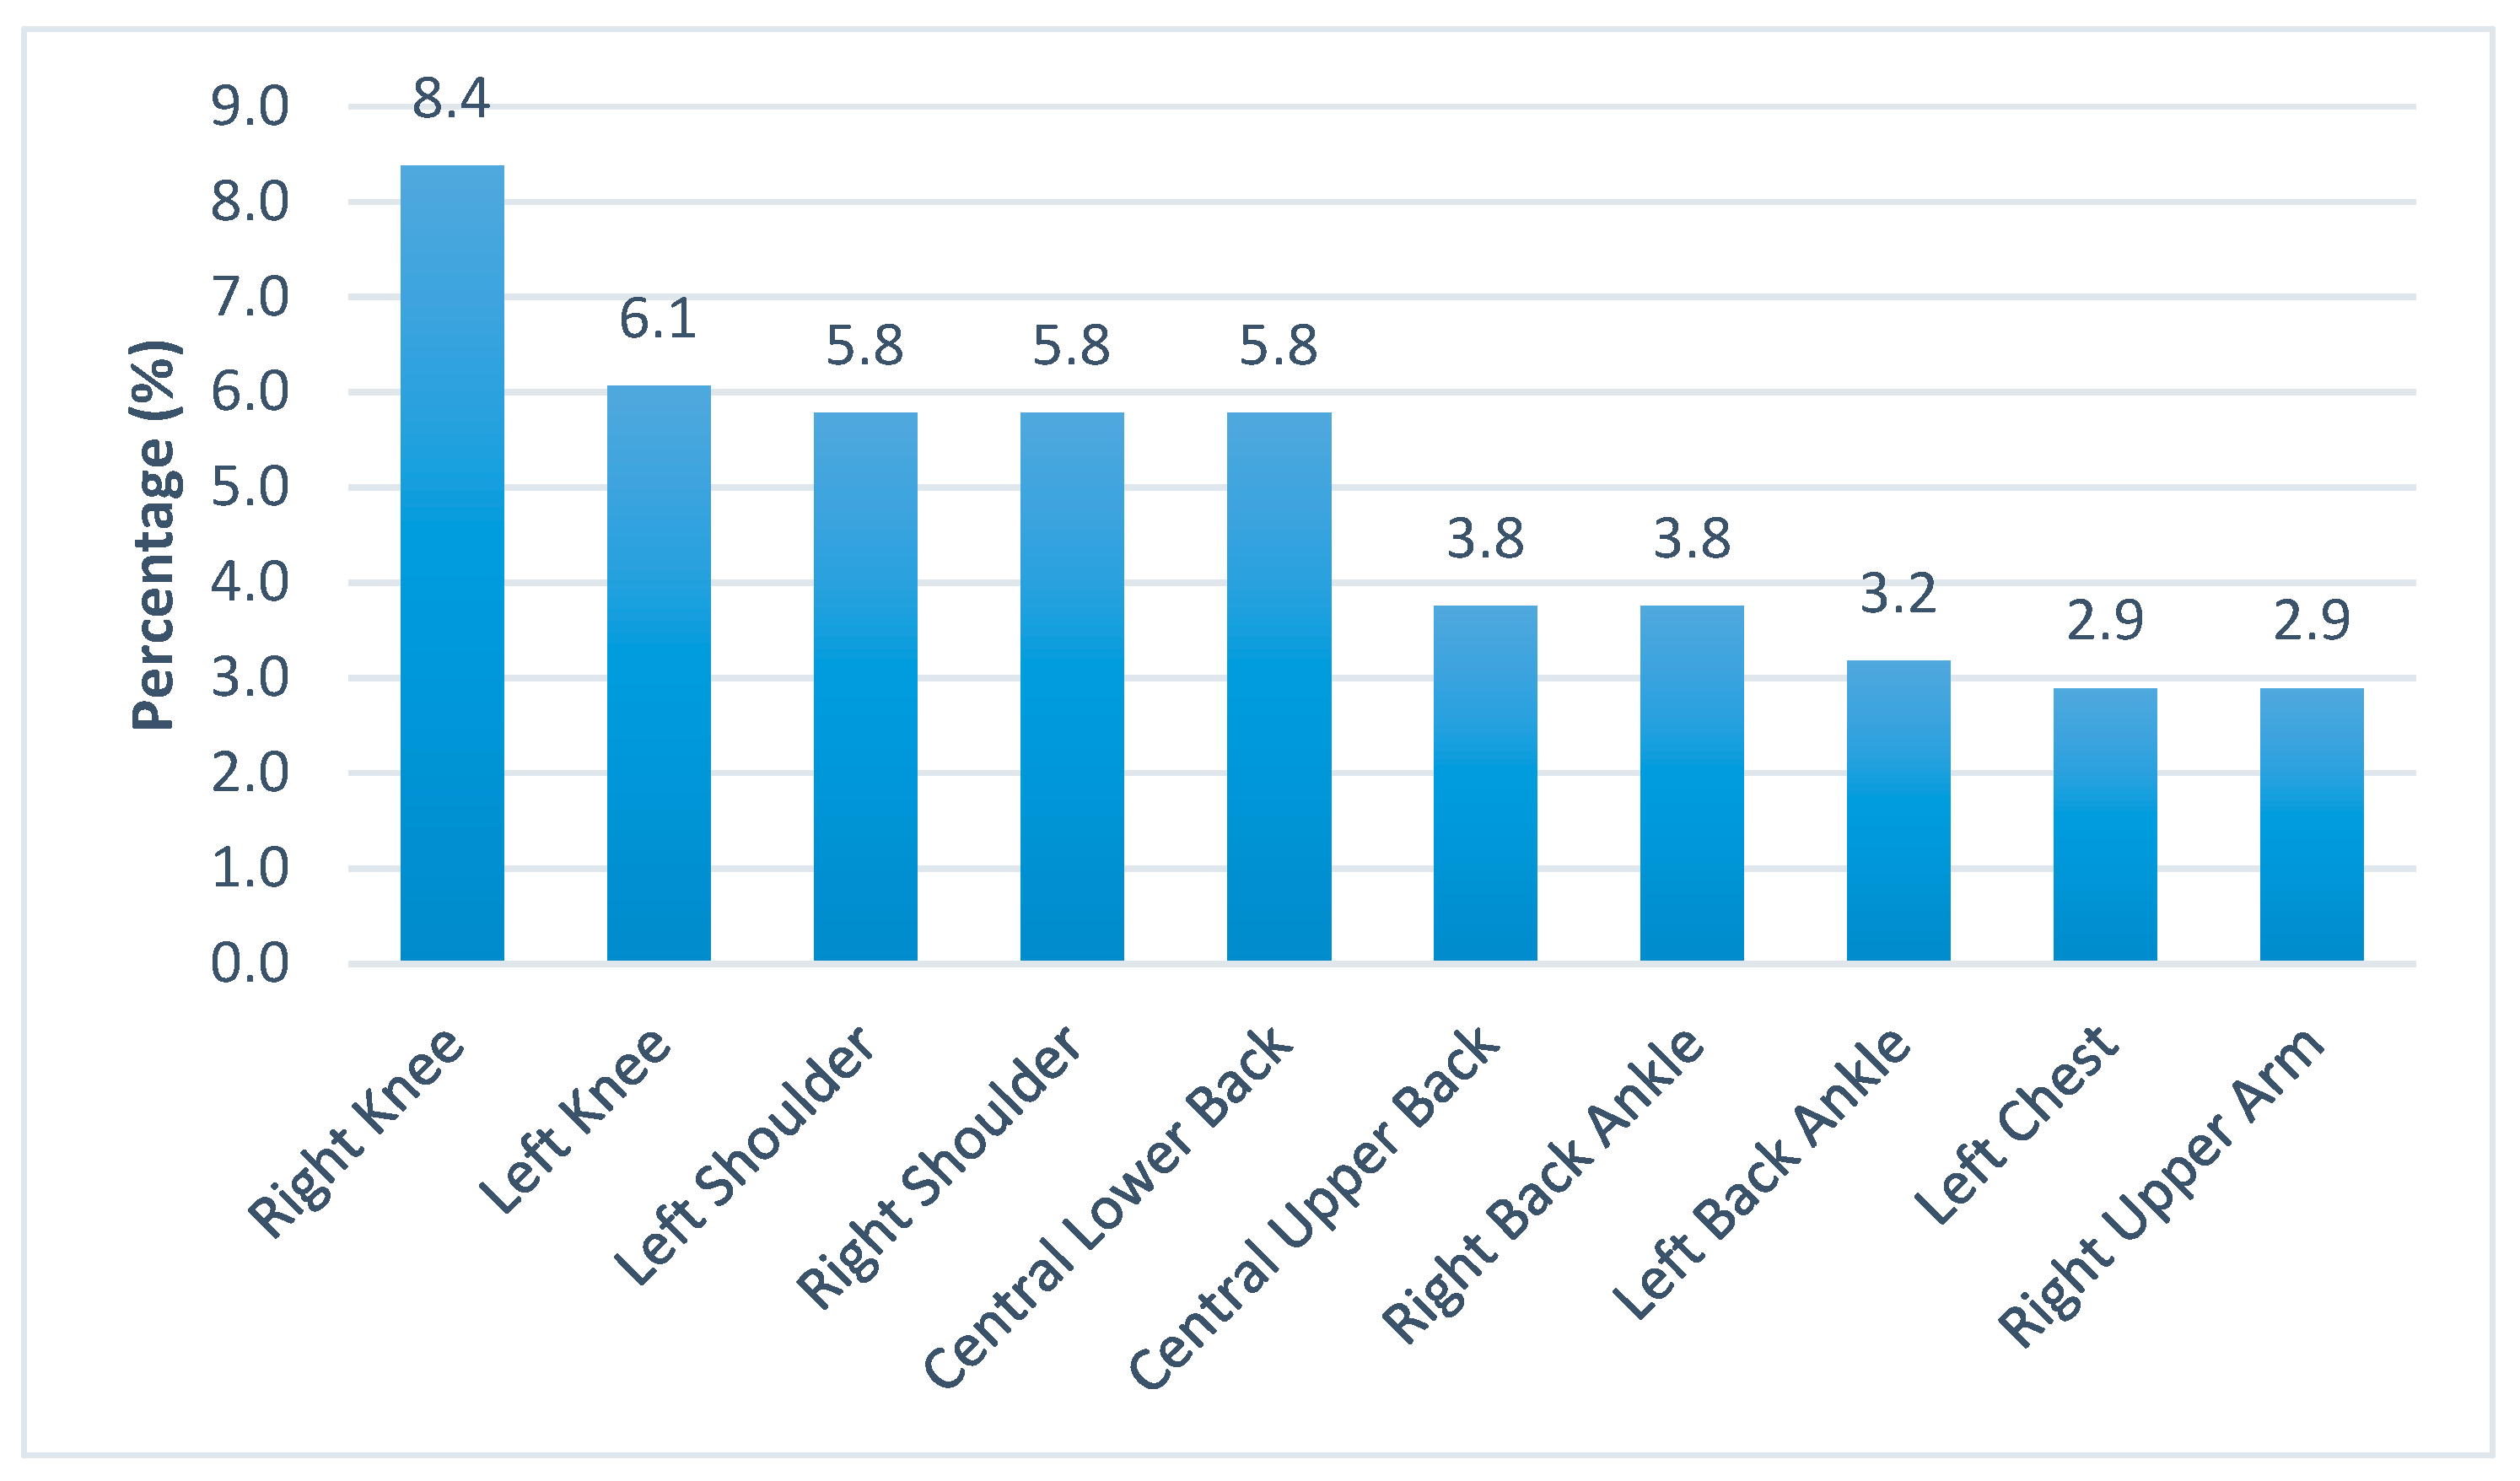
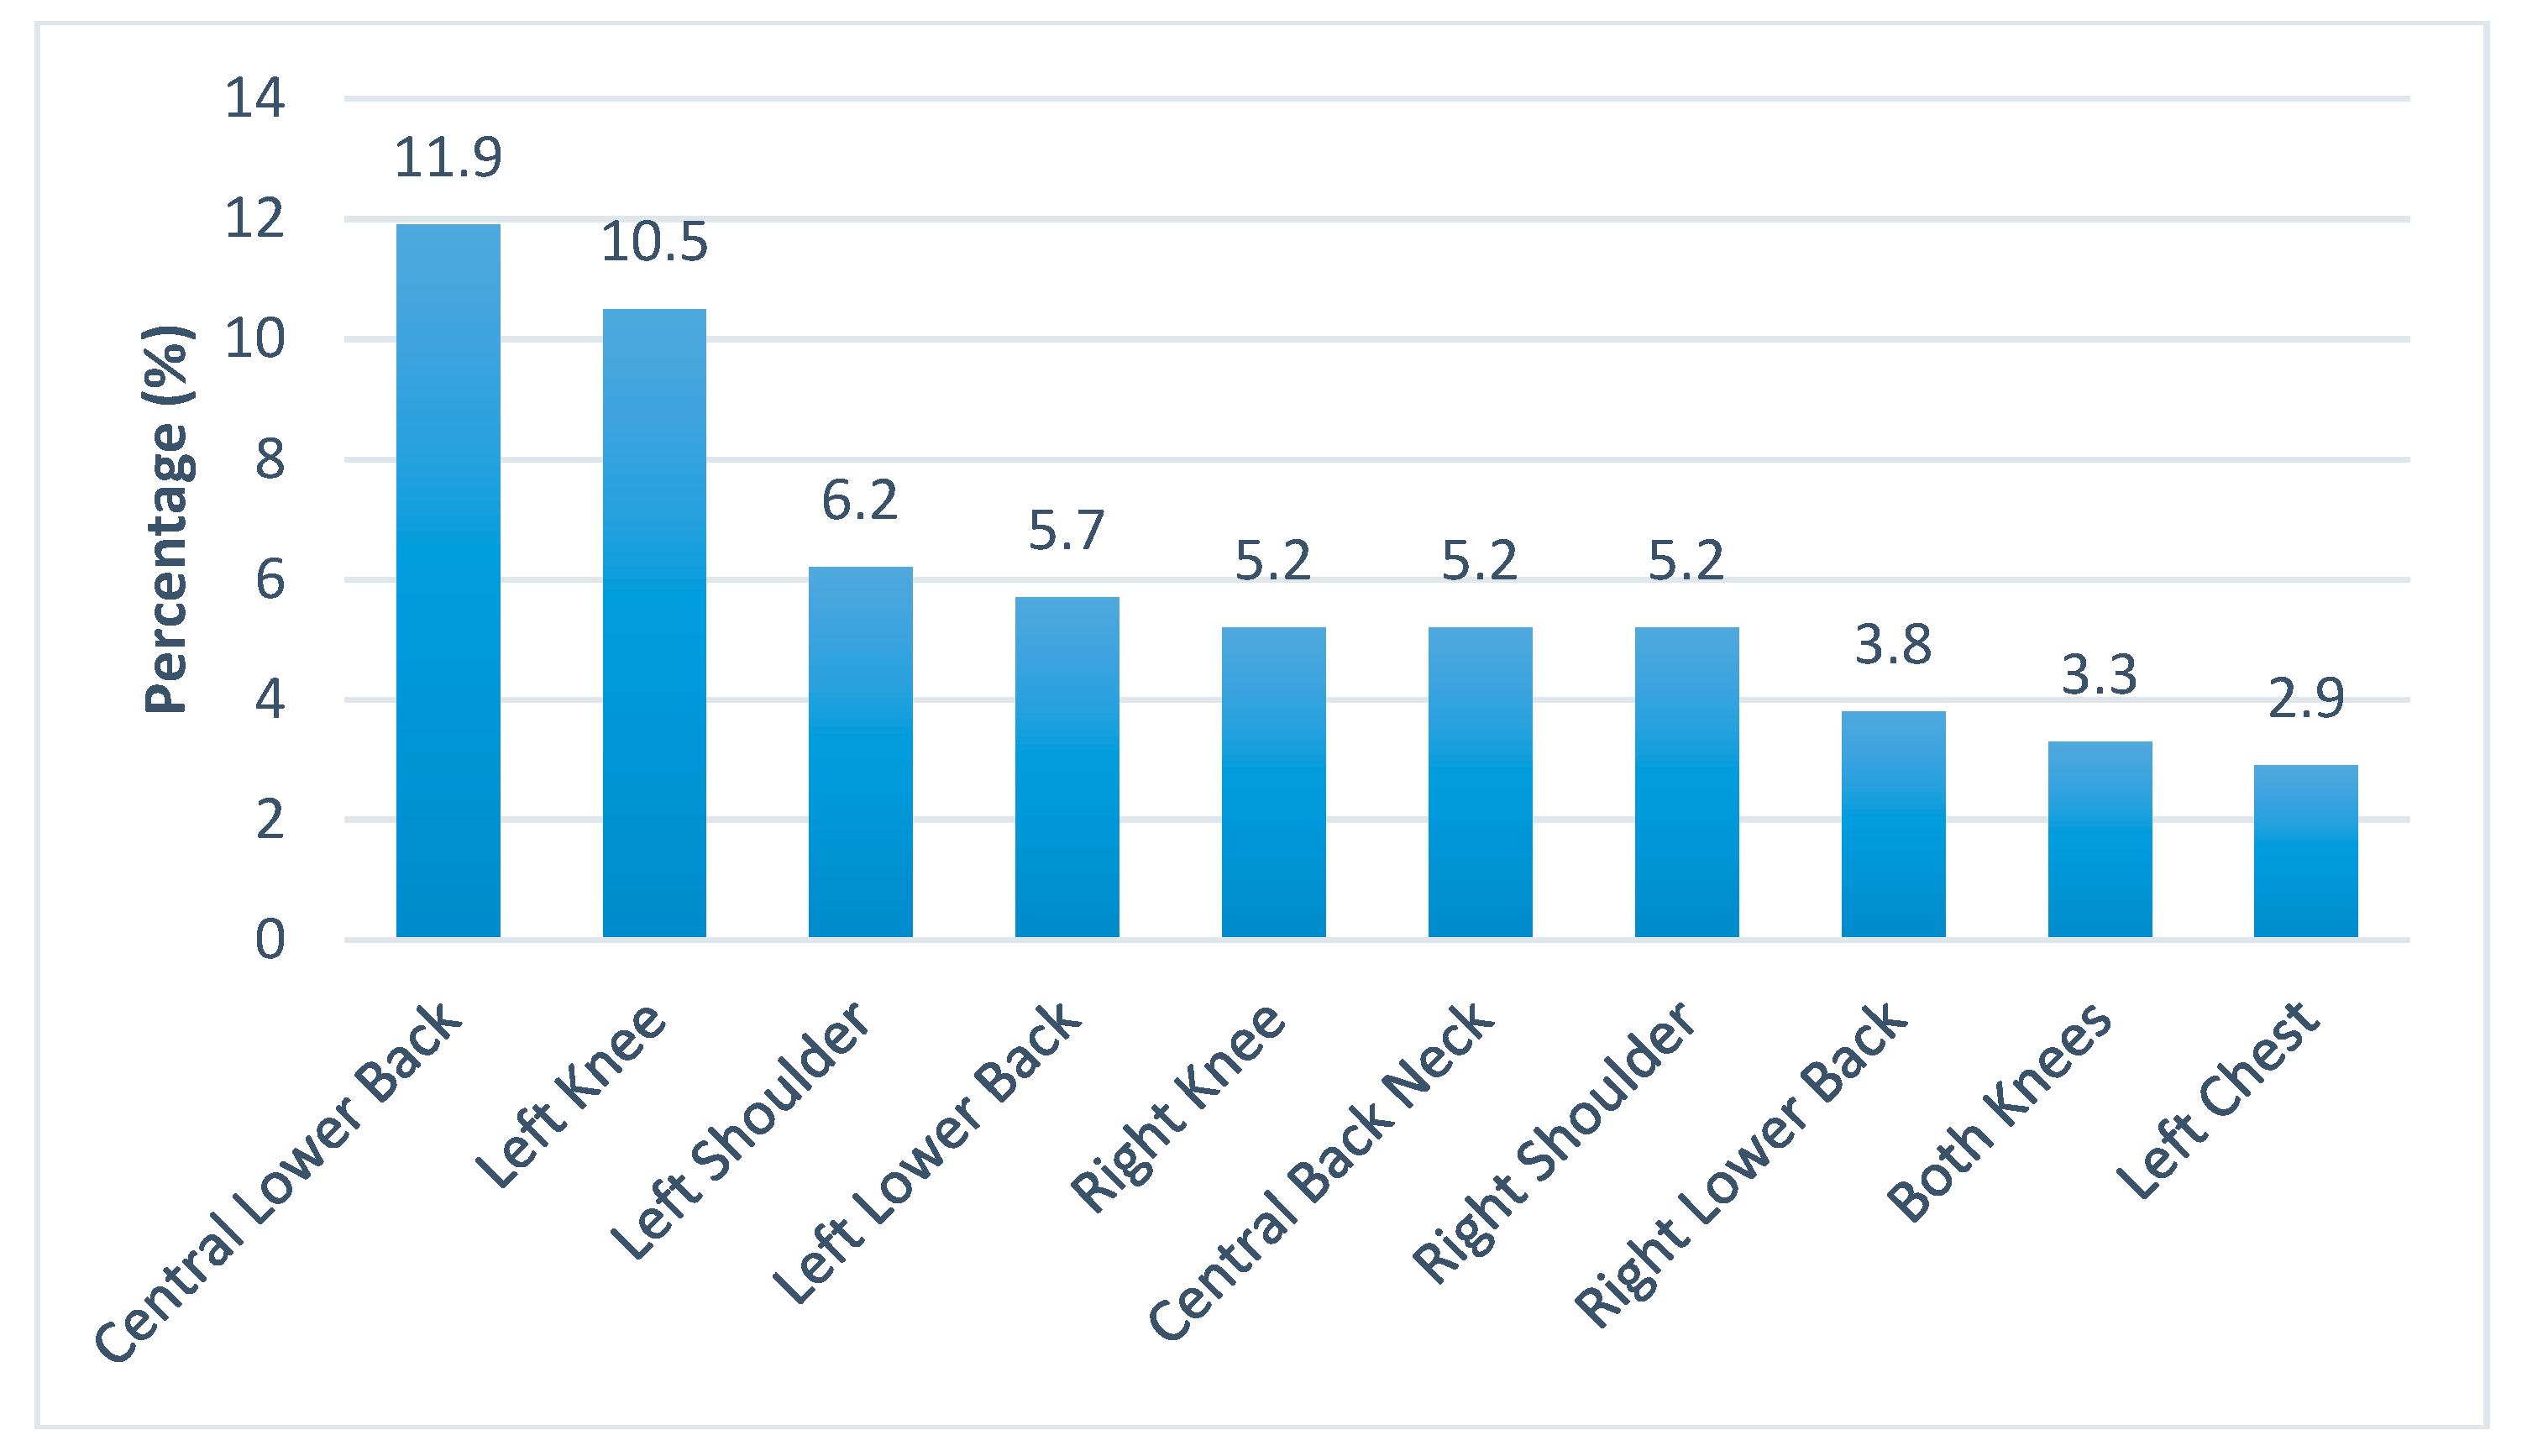
As indicated by the subjects, the average number of pain sites per subject was 2.58 (Standard Deviation, SD = 1.54). The first five common pain sites were right and left knees, left and right shoulders, and the central lower back (
Figure 1). The first two worst pain sites were central lower back and left knee, while the rest of the sites were mostly on the four limbs (
Figure 2).
3.1.3. Pain Interference
The most affected domains of living activities were work, daily life, and sleep (
Table 5). There was no significant gender difference in pain interference.
The BPI has two main scores which are the pain severity score (0–40) and the pain interference score (0–70). The total score ranges from 0 to 110. The workers’ pain intensity scores were calculated based on the BPI for subsequent analysis (
Table 6). There were no significant differences with respect to gender in their reported pain severity, pain interference score, and total pain score (
Table 7). It was noted that males reported less pain severity, pain interference, and total pain. Whilst there were also no statistically significant differences on all pain scores between age groups (
Table 8).
For subjects with multiple pain sites (i.e., the total number of pain site is >1), significant differences were found on the pain interference score (Mean difference = 4.50,
t = −2.188,
p = 0.030) and the total pain score (Mean difference = 5.34,
t = −2.119,
p = 0.035) between those with and without multiple pain sites (
Table 9).
As regards symmetrical pain sites (i.e., pain sites present in both the left and right side of the body, including anterior and posterior sides of torso, limbs, and soles, e.g., left and right shoulder), significant differences were also found on the pain interference score (Mean difference = 5.89,
t = −2.934,
p = 0.004) and the total pain score (Mean difference = 7.39,
t = −3.003,
p = 0.003) between the subjects with and without bilateral pain sites. However, there were no statistically significant differences on all the pain scores with respect to the subjects having or not having warm-up and cool-down exercises before and after work respectively (
Table 10).
3.1.4. Pain Relief Methods
With regard to the pain relief methods, the subjects indicated that about 21% of the time they chose to ignore the pain and this was the most frequent method used. Two other frequent methods used were taking pain killers (18.8%) and applying analgesic balm (14.0%). Other less frequent methods included massage, acupoint massage, Chinese medicine, and so on. Only 3.2% of the time they used exercises as a means for pain relief (
Figure 3). About 37.21% of them indicated that pain was relieved (80/215). There was no significant difference with respect to gender in choosing pain relief methods.
4. Discussion
The pain prevalence revealed in this study was consistent with that of those reported in a recent systematic review [
13]. Since this study was on point prevalence, i.e., pain in the last 24 h, it was reasonable to have workers reporting mild pain because those who had moderate or severe pain might probably not be at work. The study suggested that males had higher pain tolerance than females which was consistent with other research findings [
27]. This might have resulted in a lower reported pain intensity in male workers. However, one must take note that this does not necessarily mean the cell damages are lesser.
The first five common pain sites are the weight bearing areas of the body. The most common site was the right knee and most of the people are right-handed. For the right-handed subjects, they tended to shift their weight onto their left knees to reduce any discomfort or pain on the right (compensatory adjustments in postural control) [
28]. Thus, it was reasonable to find the second common pain site was the left knee. Shoulder pain was most likely to be due to imbalanced muscle strength caused by heavy lifting or manual work that required repetitive physical exertion of the upper limbs. Central lower back was the centre of the core trunk which was the pivot to provide an anchor for the four limbs. Again, any imbalance in muscle strength will cause back pain which further weakens the core stability of the workers [
29] and increases their risks of injuries and falls.
The first few worst pain sites as reported by the workers were the left weight bearing joints and the central lower back despite the right knee was the most common pain site. The team argued that this might be due to the pain in the right knee of the workers, being the most common pain site and as a compensatory mechanism, had to be replaced by the use of the left side of their body and core muscle to perform their jobs functionally. As a result, the central lower back and left knee would gradually become the two worst pain sites. Besides the compensatory mechanism, ageing was another contributing factor. In Hong Kong, the construction industry is experiencing an ageing workforce. The ageing process predisposes workers to lower back pain which caused some disability [
30]. If left unattended, the pain could become chronic and difficult to recover and turn into disability in their old age [
31,
32]. It is important to note that more than half of the construction workers in Hong Kong were employed on a daily basis which would make them more reluctant to forgo their daily wages to attend to their pain. They would continue working unless pain persisted to an intolerable level. The study showed that the daily activities of those workers with multiple pain sites and bilateral pain sites were interfered. The above observation brings forth the necessity of using health education or primary care to enhance early intervention.
Basically the relief methods used by the workers were self-help in nature, not relying on others and were comparatively cheap. The worrying fact was that only 37% of the time they found the pain relief methods effective, which implied that they often suffered from pains. Here, it is worthwhile to note that stretching exercises have been well documented in literature as a good method in the prevention and management of pain. Yet, exercising was one of the least pain relief methods used by the workers. Hence, it is advisable to conduct more health education at the workplace on self-help pain relief methods like stretching exercises, sleep enhancement, or mindfulness that are cost-effective.
5. Conclusions
Even though the point prevalence of the workers’ pain suffering was found to be mild at 10.6%, this study showed that the daily activities of those with multiple or bilateral pain sites had been interfered. Early intervention is the most cost effective way of handling pain. One way is to educate workers to take rest days to attend to their pain early. Another way is to organise health education and promotion on stretching exercises, sleep enhancement, or mindfulness to manage their pain. Pain when intervened early is reversible. Hopefully, these methods will save workers from pain deterioration and enhance their productivity.
Author Contributions
Conceptualization, J.W.Y.C., H.C.F.S. and A.P.C.C.; Data curation, V.C.M.Y., P.S.T.K., B.Y.M.W. and J.Y.Y.; Formal analysis, V.C.M.Y. and B.Y.M.W.; Funding acquisition, J.W.Y.C. and A.P.C.C.; Investigation, V.C.M.Y., P.S.T.K., B.Y.M.W. and J.Y.Y.; Methodology, J.W.Y.C. and A.P.C.C.; Project administration, V.C.M.Y. and J.Y.Y.; Resources, V.C.M.Y., P.S.T.K. and J.Y.Y.; Software, H.C.F.S.; Supervision, J.W.Y.C., V.C.M.Y. and A.P.C.C.; Validation, J.W.Y.C. and B.Y.M.W.; Visualization, V.C.M.Y.; Writing—original draft, J.W.Y.C. and V.C.M.Y.; Writing—review & editing, J.W.Y.C. and V.C.M.Y.
Funding
This research was funded by The Construction Industry Council of Hong Kong, grant number K-ZB93 and The APC was funded by The Department of Health and Physical Education, The Education University of Hong Kong.
Acknowledgments
This research was funded by the Construction Industry Council Hong Kong.
Conflicts of Interest
The authors declare no conflict of interest.
References
- Brown, L.W.; Quick, J.C. Workplace Health. In Encyclopedia of Mental Health, 2nd ed.; Academic Press: Riverside, CA, USA, 2016; pp. 387–394. [Google Scholar]
- Deacon, C.; Smallwood, J.; Haupt, T. The health and well−being of older construction workers. Int. Congr. Ser. 2005, 1280, 172–177. [Google Scholar] [CrossRef]
- Village, J.; Ostry, A. Assessing attitudes, beliefs and readiness for musculoskeletal injury prevention in the construction industry. Appl. Ergon. 2010, 41, 771–778. [Google Scholar] [CrossRef]
- Moradinazar, M.; Kurd, N.; Farhadi, R.; Amee, V.; Najafi, F. Epidemiology of work-related injuries among construction workers of Ilam (Western Iran) during 2006–2009. Iran. Red Crescent Med. J. 2013, 15. [Google Scholar] [CrossRef]
- Kong, L.; Li, H.; Yu, Y.; Luo, H.; Antwi-Afar, M. Quantifying the physical intensity of construction workers: A mechanical energy approach. Adv. Eng. Inform. 2018, 38, 404–419. [Google Scholar] [CrossRef]
- Tunji−Olay, P.; Afolabi, A.; Okpalamoka, O. Survey dataset on occupational hazards on construction sites. Data Brief 2018, 18, 1365–1371. [Google Scholar] [CrossRef] [PubMed]
- Akanmu, A.; Ojelade, A.; Bulbul, T. Reassigning construction laborers based on body motion analysis. In Proceedings of the 35th International Symposium on Automation and Robotics in Construction (ISARC), Berlin, Germany, 20–25 July 2018; Curran Associates, Inc.: Red Hook, NY, USA, 2018; Volume 35, pp. 1–7. [Google Scholar]
- Devereux, J.J.; Vlachonikolis, I.G.; Buckle, P.W. Epidemiological study to investigate potential interaction between physical and psychosocial factors at work that may increase the risk of symptoms of musculoskeletal disorder of the neck and upper limb. Occup. Environ. Med. 2002, 59, 269–277. [Google Scholar] [CrossRef] [Green Version]
- Alghadir, A.; Anwer, S. Prevalence of musculosketal pain in construction workers in Saudi Arabia. Sci. World J. 2015. [Google Scholar] [CrossRef]
- Eaves, S.; Gyi, D.; Gibb, A. Building healthy construction workers: Their views on health, wellbeing and better workplace design. Appl. Ergon. 2016, 54, 10–18. [Google Scholar] [CrossRef] [Green Version]
- Purani, R.; Sharma, S. Prevalence of musculoskeletal disorders in construction workers in Gujarat: A cross sectional survey. Int. J. Ther. Rehab. Res. 2017, 63, 52–57. [Google Scholar] [CrossRef]
- Lette, A.; Ambelu, A.; Getahun, T.; Mekonen, S. A survey of work−related injuries among building construction workers in southwestern Ethiopia. Int. J. Ind. Ergon. 2018, 68, 57–64. [Google Scholar] [CrossRef]
- Umer, W.; Antwi−Afari, M.; Li, H.; Szeto, G.; Wong, A. The prevalence of musculoskeletal symptoms in the construction industry: A systematic review and meta-analysis. Int. Arch. Occup. Environ. Health 2018, 91, 125–144. [Google Scholar] [CrossRef]
- Ueno, S.; Hisanaga, N.; Joani, H.; Shibata, E.; Kamijima, M. Association between musculoskeletal pain in Japanese construction workers and job, age, alcohol consumption, and smoking. Ind. Health 1999, 37, 449–456. [Google Scholar] [CrossRef]
- Antwi-Afari, M.; Li, H.; Edwards, D.; Parn, E.; Wong, A. Biomechanical analysis of risk factors for work-related musculoskeletal disorders during repetitive lifting task in construction workers. Autom. Constr. 2017, 83, 41–47. [Google Scholar] [CrossRef]
- Chang, F.; Sun, Y.; Chuang, K.; Hsu, D. Work fatigue and phsyciological symptoms in different occupations of high-elevation construction workers. Appl. Ergon. 2009, 40, 591–596. [Google Scholar] [CrossRef] [PubMed]
- Herr, R.; Bosh, J.; Loerbroks, A.; van Vianen, A.; Jarczok, M.; Fischer, J.; Schmidt, B. Three job stress models and their relationship with musculoskeletal pain in blue- and white-collar workers. J. Psychosom. Res. 2015, 79, 340–347. [Google Scholar] [CrossRef] [PubMed]
- Abbe, O.; Harvey, C.; Ikuma, L.; Aghazadeh, F. Modeling the relationship between occupational stressors, psychosocial/physical symptoms and injuries in the construction industry. Int. J. Ind. Ergon. 2011, 41, 106–117. [Google Scholar] [CrossRef]
- Construction Industry Council of Hong Kong. Corporate Profile. Retrieved from Construction Industry Council of Hong Kong. Available online: http://www.cic.hk/eng/main/aboutcic/corporate_profile/ (accessed on 1 March 2019).
- Kamaleri, Y.; Natvig, B.; Ihlebaek, C.; Benth, J.; Bruusgaard, D. Change in the number of musculoskeletal pain sites: A 14-year prospective study. Pain 2009, 141, 25–30. [Google Scholar] [CrossRef]
- Centre for Health Protection, Department of Health, The Government of the Hong Kong Special Administrative Region. Report of Population Health Survey 2014/15. Available online: https://www.chp.gov.hk/en/static/51256.html (accessed on 1 March 2019).
- Poquet, N.; Lin, C. The Brief Pain Inventory (BPI). J. Physiother. 2016, 62, 52. [Google Scholar] [CrossRef] [Green Version]
- Chiarotto, A.; Maxwell, L.; Ostelo, R.; Boers, M.; Tugwell, P.; Terwee, C. Measurement Properties of Visual Analogue Scale, Numeric Rating Scale, and Pain Severity Subscale of the Brief Pain Inventory in Patients With Low Back Pain: A Systematic Review. J. Pain 2019, 20, 245–263. [Google Scholar] [CrossRef]
- Ainsworth, B.; Haskell, W.; Leon, A.; Jacobs, D., Jr.; Montoye, H.; Sallis, J.; Paffenbarger, R., Jr. Compendium of physical activities: Classification of energy costs of human physical activities. Med. Sci. Sports Exerc. 1993, 25, 71–80. [Google Scholar] [CrossRef] [PubMed]
- Abdelhamid, T.; Everett, J. Physiological demands during construction work. J. Construct. Eng. Manag. 2002, 128, 427–437. [Google Scholar] [CrossRef]
- Boonstra, A.; Preuper, H.; Balk, G.; Stewar, R. Cut-off points for mild, moderate, and severe pain on the visual analogue scale for pain in patients with chronic musculoskeletal pain. Pain 2014, 155, 2545–2550. [Google Scholar] [CrossRef] [PubMed]
- Martin, R. Influence of biological sex, trait gender, and state gender on pain threshold, pain tolerance, and ratings of pain severity. Pers. Individ. Dif. 2019, 138, 183–187. [Google Scholar] [CrossRef]
- Buchbinder, R.; van Tulder, M.; Öberg, B.; Costa, L.; Lancet Low Back Pain Series Working Group. Low back pain: A call for action. Lancet 2018, 391, 2384–2388. [Google Scholar] [CrossRef]
- Crobie, J.; Flynn, W.; Rutter, L. Effect of side load carriage on the kinematics of gait. Gait Posture 1994, 2, 103–108. [Google Scholar] [CrossRef]
- Carpes, F.P.; Reinehr, F.B.; Mota, C.B. Effects of a program for trunk strength and stability on pain, low back and pelvis kinematics, and body balance: A pilot study. J. Bodyw. Mov. Ther. 2008, 12, 22–30. [Google Scholar] [CrossRef]
- Williams, J.S.; Ng, N.; Peltzer, K.; Yawson, A.; Biritwum, R.; Maximova, T.; Wu, F.; Arokiasamy, P.; Kowal, P.; Chatterji, S. Risk factors and disability associated with low back pain in older adults in low- and middle-income countries—Results from the WHO study on Global AGEing and Adult Health (SAGE). PLoS ONE 2015, 10, e0127880. [Google Scholar]
- Hartvigsen, J.; Hancock, M.; Kongsted, A.; Louw, Q.; Lancet Low Back Pain Series Working Group. What low back pain is and why we need to pay attention. Lancet 2018, 391, 2356–2367. [Google Scholar] [CrossRef]
© 2019 by the authors. Licensee MDPI, Basel, Switzerland. This article is an open access article distributed under the terms and conditions of the Creative Commons Attribution (CC BY) license (http://creativecommons.org/licenses/by/4.0/).

 ,
, 


