1. Introduction
In recent years, air pollution, represented by haze pollution, has affected a wide area of China. According to the Asian Development Bank, large cities in China with air quality that meets the criteria suggested by the WHO account for no more than 1% of the total [
1]. Consequently, environmental protests such as the “Jiangsu Qidong Incident,” the “Zhejiang Ningbo PX Incident,” and the “BP Oil Spill” occur frequently. As the largest developing country in the world, China has received extensive attention regarding its contribution to and influence on global environmental change [
2]. The control of environmental pollution has become a pressing policy issue facing the Chinese government [
3]. Accordingly, 2019 is the year of the “battle to win the blue sky.” In 2018, the Chinese government continued to improve air quality to retain more blue sky for the masses, and it deployed a three-year action plan for the Blue Sky Defense War to significantly enhance the people’s “blue sky happiness” (on 27 June 2018, the State Council issued the “Three-Year Action Plan to Win the Blue Sky Defense War.” The Blue Sky Defense Three-Year Action Plan is a pollution prevention action plan deployed by the Chinese government to continuously improve air quality and retain more blue sky for the masses). These situations have led China to focus on environmental regulation as an effective approach to controlling pollution [
4]. Constructing an authoritative supervisory and coordinating body is an important starting point for addressing the dilemma of environmental governance. Against this background, the environmental supervision system was developed.
The regional environmental management system has strong regional characteristics [
5]. Before the establishment of the regional environmental supervision centers, the central government was responsible for the supervision and coordination of the overall environmental management system, and specific regional issues were resolved by local governments. However, the regional characteristics of regional environmental problem management conflict with the characteristics of environmental issues. The environmental responsibility of local governments is limited to administrative areas, and the lack of authoritative responsibility for cross-regional environmental issues has led to increased conflicts between local governments. Local governments lack the institutional capacity to effectively formulate and implement policies as well as the rationality of environmental spillovers across jurisdictions [
6]. Therefore, the environmental spillover effects caused by local competition for economic resources provide legitimacy for the establishment of regional environmental agency. Establishing an authoritative supervisory and coordination mechanism helps to avoid the overall ecological problems caused by the deterioration of the transboundary environment [
6]. In addition, China has a vast territory with differences in environmental conditions, resource endowments, economic development levels and population. There are significant differences in eco-environment sustainability and influencing factors. Environmental management issues vary from region to region, and it is difficult to adapt to uniform policies and standards [
7]. Therefore, in the process of building a general environmental governance framework, the central government has become an important issue and challenge for the environmental governance of central and local governments. The system of regional environmental supervision centers is an administrative supervision system used by the state to strengthen the management of local environmental protection work, supervise outstanding problems, and break through the old administrative divisions to achieve cross-border solutions to environmental problems. However, since the establishment of the regional environmental supervision centers in 2002, it has failed to achieve its original goals, namely, to break local protectionism and mitigate environmental pollution. A strange phenomenon occurs in which the higher the demand for and expectations of a healthy environment, the worse the quality of the actual environment [
8].
The key to a solution begins with an in-depth explanation of the reasons for the recent deterioration of environmental pollution in China. From this reality, we can see the embarrassing position of the regional environmental supervision centers within the entire environmental management system. This is why it does not work effectively. As an institution of the Ministry of Ecology and Environment, it is a bureau-level system. Although its administrative level is the same as that of other departments of the Ministry of Ecology and Environment, it is required to report to the Environmental Supervision Bureau, and that Bureau determines how to handle cases of environmental pollution [
9]. The Ministry of Ecology and Environment also stipulates that the regional environmental supervision centers are forbidden from supervising the daily environmental protection work of the local government and from guiding the work of the local environmental protection department. the regional environmental supervision centers have functions with local governments and local environmental protection departments (Source: Former State Environmental Protection Administration, “General Administration Environmental Protection Supervision Center Formation Plan”, 8 July 2006. The State Environmental Protection Administration has now changed its name to the Ministry of Ecology and Environment.). It is difficult for the regional supervision center to accurately clarify the function of “not interfering with the work of local environmental protection agencies” and to fully perform the functions of regional supervision [
10]. As a result, the Ministry of Ecology and Environment, the provincial government and the regional supervision center does not agree with the existing relationship model. The Ministry of Ecology and Environment believes that the regional environmental supervision centers have not played a good role in regional supervision and is limited in solving regional environmental problems. The regional environmental supervision centers do not have “organizational identity.” It is not considered an integral part of the Ministry of Ecology and Environment, and the organization faces a series of incentive problems. The provincial government believes that the regional environmental supervision centers is only the “eyes and ears” of the country—not the “problem solver” but rather the “problem maker” [
6]. This unreasonable administrative-level setting has led to a very strange phenomenon: the organizational relationship that was originally parallel to the administrative structure has become the guidance for the organizational levels and supervision centers in practice. These restrictions have gradually made the regional environmental supervision centers a marginalized institution in the power chain and weakened their environmental governance effect.
Theoretically, the “growth machine” theory describes cities as machines for increasing wealth, with politicians as the key operators. During the decision-making process, local officials always consider the interests of the merchants who support them, which also benefits them [
11]. Chinese political and economic institutions are characterized as regionally decentralized authoritarian systems [
12] in which the central government supervises personnel control over subnational governments while local governments control the bulk of China’s economy [
13]. However, the appointment and promotion of local officials remain at the absolute discretion of higher-level government entities, which usually approve the political promotion of local officials based on an assessment in which economic performance plays a main role—the so-called “promotion tournament” [
14,
15]. This has led to strong incentives for local governments to promote economic development even at the expense of the natural environment, a situation called “pollution for promotion” [
16]. Thus, local governments have great freedom in deciding how to implement policy [
17]. These factors have led environmental problems to be the first to be eliminated from local government policy goals in every round of economic growth [
18].
Conventional environmental protection mechanisms are difficult to effectively resolve given the deep-seated contradictions that characterize China’s system of environmental governance. To correct the old malpractices of the country’s environmental management system and to address the problems of environmental pollution that have long plagued China, the central government launched a strategy of central environmental protection inspections (see
Appendix A ①) led by the Party Central Committee and the State Council.
In 2015, the Party Central Committee and the State Council successively issued a series of important documents on the reform of China’s ecological civilization system (see
Appendix A ②). Among these documents, the “Environmental Protection Inspection Program (Trial)” proposed the establishment of an environmental inspection mechanism to strictly address the responsibility for environmental protection. It is hoped that through the strong participation of the “central” authority, that is, in the name of the Party Central Committee and the State Council, local party committees and governments will examine their environmental protection duties and create strong pressure and behavioral obligations for leading cadres in political circles, forcing them to attach great importance to environmental protection and work to vigorously correct environmental violations. The Central Environmental Protection Inspector gives the environmental protection inspector a higher authority and “rigidity” in the name of the Party Central Committee and the State Council, emphasizing the “party and political responsibility” of environmental protection work, “double responsibility for one post,” and environmental protection of local party committees and governments.
According to the data in the 2016 National Haze City Rankings, seven of the top ten rankings are in Hebei. The air pollution control in Hebei has reached the point where environmental management cannot be delayed. At the end of 2015, the “first sword” of the environmental inspection team, headed by the central government, focused specifically on Hebei and conducted a pilot project of environmental protection inspections for one month. This team pursued strict investigation of and punishment for environmental pollution, chaos, dereliction of duty, misconduct, abuse of power, and other behaviors. Between 2016 and 2017, central environmental protection inspections fully investigated 31 provinces in China, with more than 17,000 officials held accountable.
The media evaluated the effectiveness of central environmental protection inspections against the notions of achieving “instant results” and dispensing the “miracle drug of environmental governance.” However, based on past experience regarding Chinese government’s repeated vows and growing investment in environmental protection, China’s environmental quality still appears to be continuously worsening, and the amounts of the main air pollutant and waste water emissions remain persistently high [
2]. These observations lead to several questions. Are the central environmental inspections in China effective, and if so, to what extent? Is this truly an effective approach to promoting local environmental governance? After the inspection team leaves, is the situation in the inspected area rectified? Is this type of campaign-style governance (see
Appendix A ③) a passing storm or a long-term mechanism?
To answer the above questions, it is necessary to scientifically and effectively evaluate the implementation effect of central environmental protection inspections. This paper focuses on AQI and uses regression discontinuity to evaluate the impact of the implementation of the central environmental protection inspections on AQI. This paper also analyzes differences in the governance capacities of the inspected provinces and the governance effects of the other six sub-contaminants in the evaluation system. Because central environmental protection has constituted a major innovation in China’s environmental regulatory system since the 18th National Congress, research on this innovation can enrich theoretical research on the supervision system; furthermore, it can provide empirical evidence to inform reforms of China’s environmental supervision system and to promote the development of central environmental protection inspections. Thus, this research has important theoretical and practical significance.
Our findings contribute to the literature in two ways. First, the present study adds new empirical evidence to the public management literature on the governance behavior of local government officials. The public management literature has long attempted to understand the effect of local government on implementing certain policies. Our results suggest that in the face of inspections, local governments choose campaign-style governance for their own interests to achieve relevant environmental goals. The target-based evaluation system can be effective in motivating bureaucrats to shift their efforts toward tasks that are more heavily weighted by the evaluators and seek to achieve the targeted policy output.
Second, the present study addresses an important yet relatively neglected topic in the environmental literature – the empirical relationship between central environmental inspections and environment governance. The empirical literature on the relationship between environmental inspections and environmental inspections is rather limited. Existing studies have usually focused on estimating the relationship between environmental and economic policies [
19]. The agency of the central environmental protection inspector is an emerging system, and its effectiveness has not yet been verified from an empirical perspective. Our findings contribute to the small but growing literature on how strongly central governments can affect the adoption of more stringent environmental inspections policies.
The remainder of the paper proceeds as follows:
Section 2 is a literature review of the central environmental protection inspections and regression discontinuity.
Section 3 outlines the methodology and data used in this paper.
Section 4 assesses the implementation of central environmental protection inspections on pollutants and provinces.
Section 5 discusses the empirical results.
Section 6 concludes the paper and provides some policy suggestions.
2. Related Literature
Although there has been a growing number of literature reports on the impact of economic development on the environment, very few studies have investigated the effectiveness of environmental inspections [
2]. Some researchers have focused on improving the environmental governance effect of the environmental protection inspection system, aiming to understand the effectiveness of China’s environmental governance and environmental reform by exploring the relationship between the two. Before the implementation of central environmental protection inspections, the regional environmental supervision centers were the main body that implemented daily supervision work, and the environmental supervision bureau was in charge of contact and business guidance [
20]. Mao and Luo [
6] believe that the contradictions and conflicts between nationalism and regionalism in the current regional supervision have made it difficult for the regional supervision centers to play their expected role of “supervising and checking” in a practical sense. Fang [
21] noted that the establishment of China’s regional environmental protection inspection center is a top-level attempt to address the problem of local environmental governance, but its status, financial support, work objects, operational efficiency, and internal construction all have corresponding loopholes. Fang thus called for legislation to resolve the ills of the regional environmental protection inspection system. Chen [
22] noted that based on the operational practices of the six regional environmental supervision centers, the system has failed to achieve the original intention of breaking up local protectionism and representing the state in order to supervise the local implementation of environmental responsibility. Instead, it has increasingly become the responsibility of the office of the Ministry of Ecology and Environment to handle temporary and local affairs.
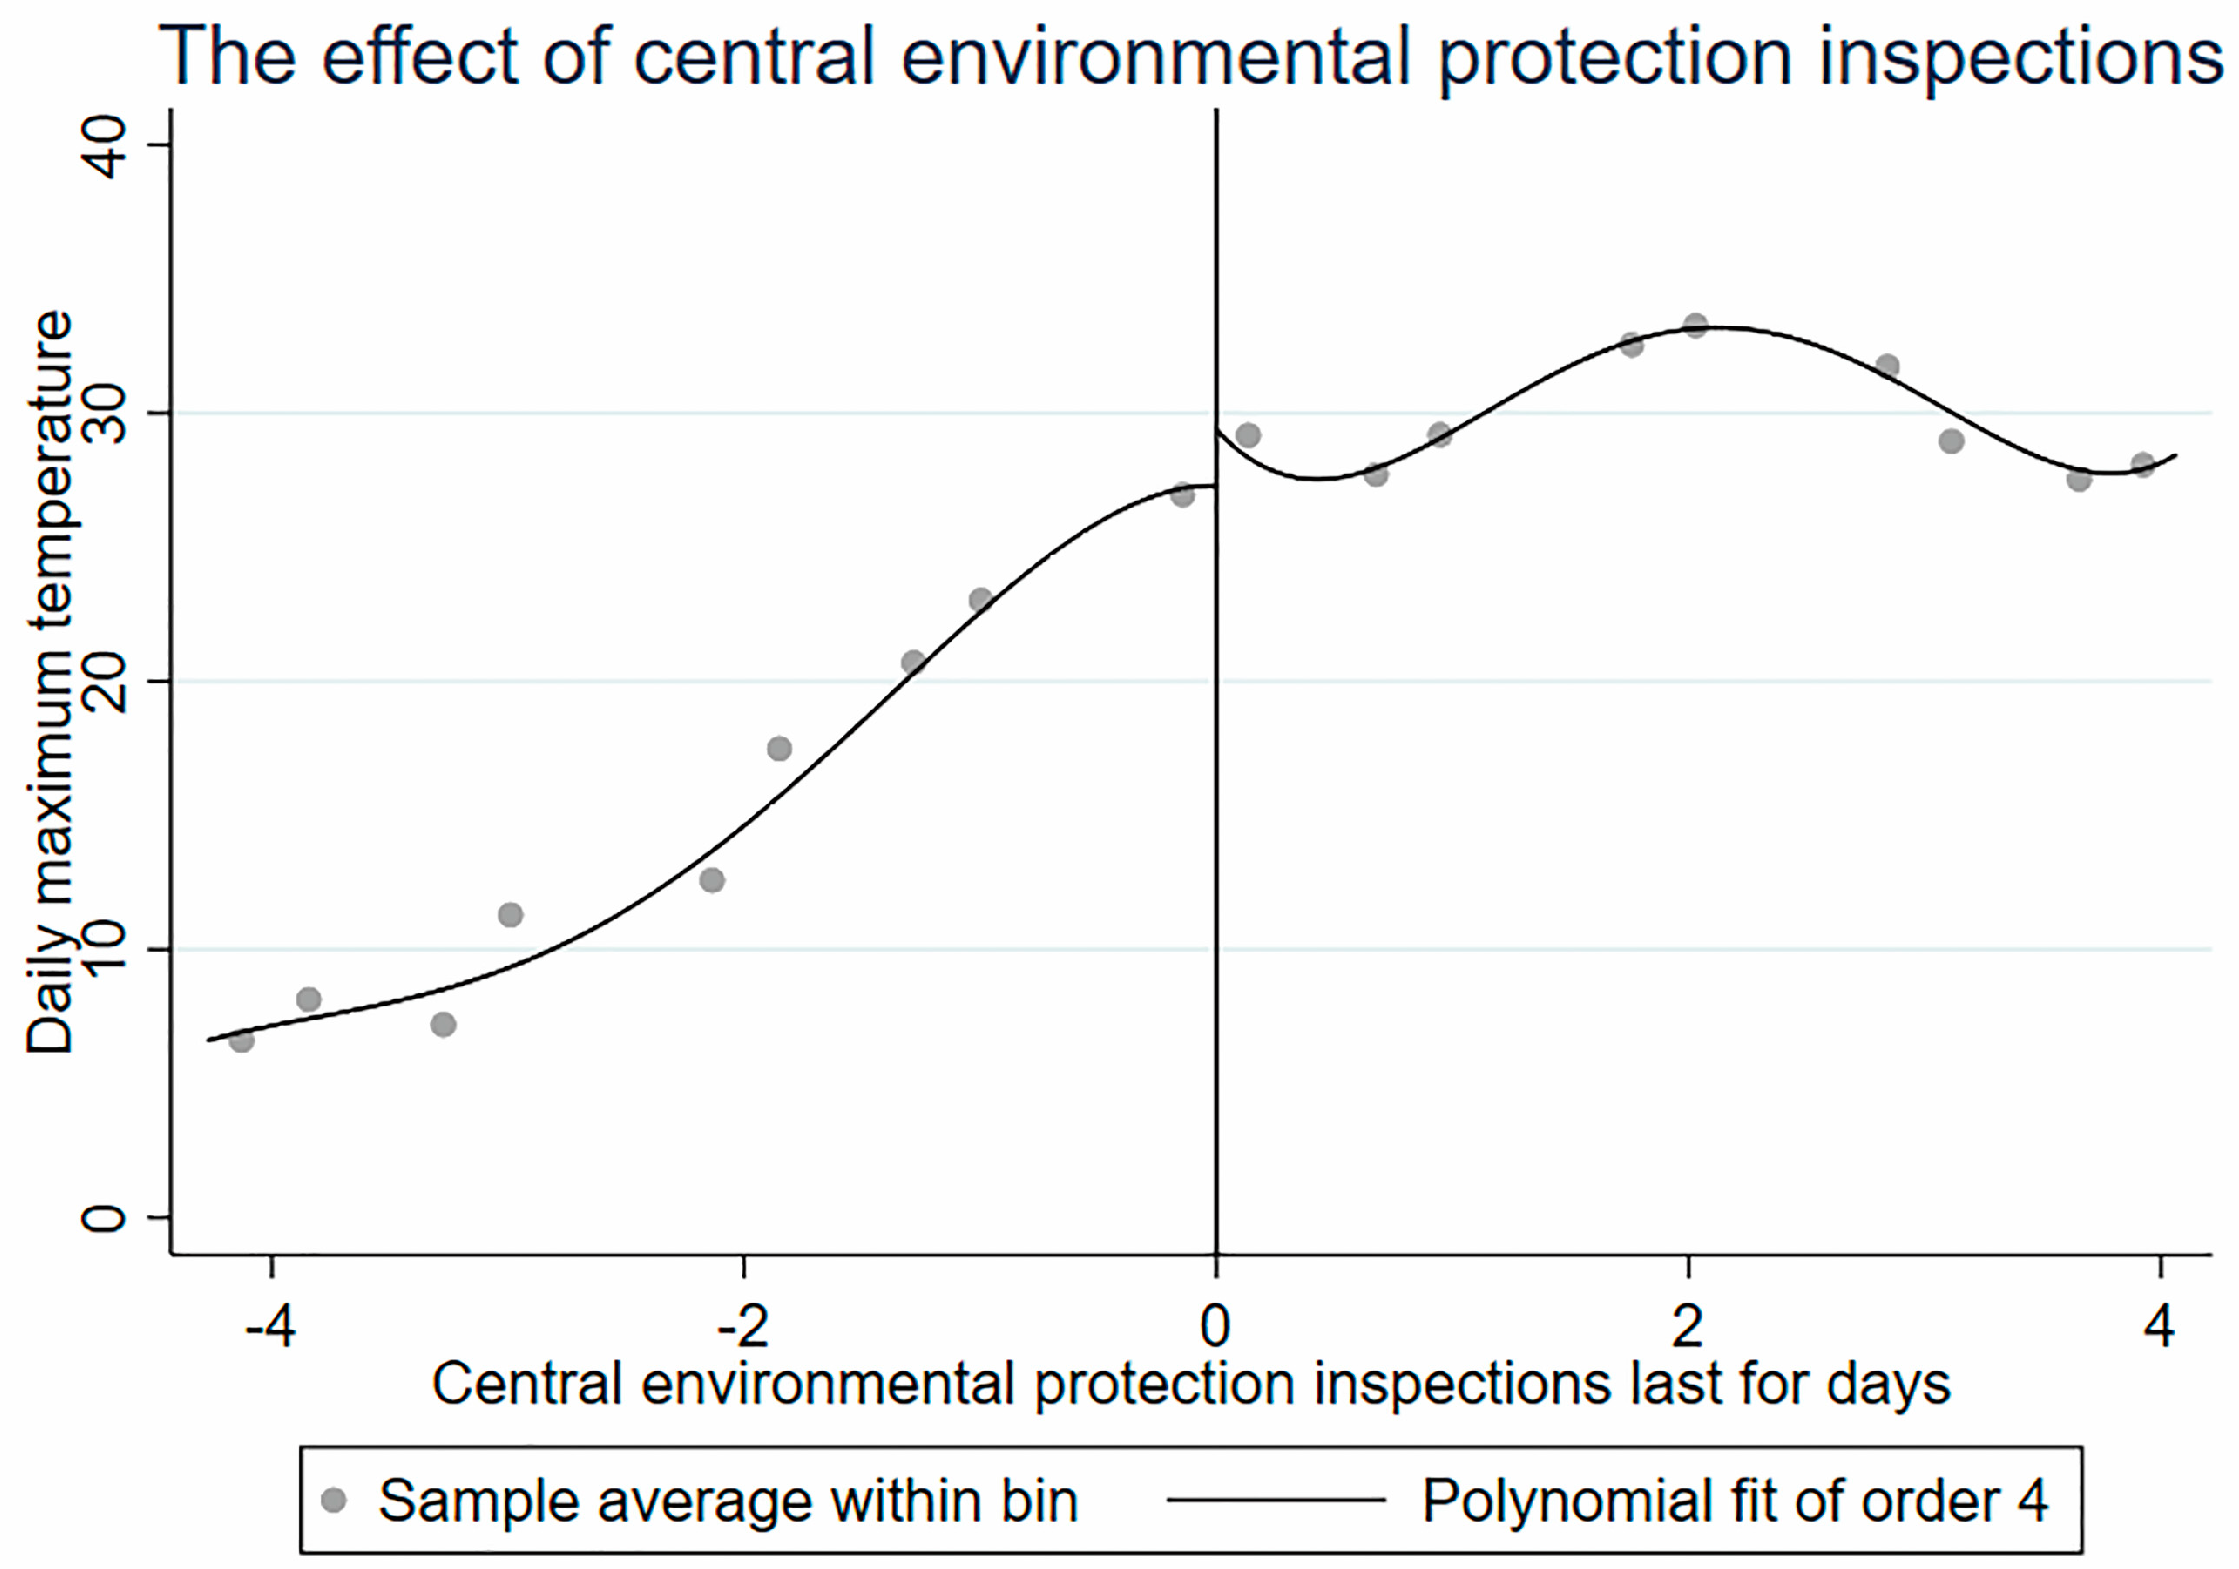
Before the implementation of the central environmental protection inspection system, most research focused on the regional environmental protection supervision system. Judging from the existing research, the actual implementation of the regional environmental supervision centers has not achieved significant results (
Figure 1). The subsequent central environmental protection inspections are a major reform of China’s environmental supervision system. Zhang [
23] found that under the party and government system, the effect of giving political incentives to the party secretary is more obvious than the effect of incentivizing the mayor, and the party committee secretary may play a stronger role in environmental governance. The new central environmental protection inspections are based on the same characteristics of the party and government, and the main features are different from the previous approach to supervision [
24]. Liu et al. [
25] noted that through central environmental protection inspections, local party committees and governments at all levels have further implemented the environmental protection responsibilities of both the party and government, documents on the long-term mechanism of environmental protection have been promulgated, and a large number of prominent environmental issues affecting the masses have been resolved. The intensity of the inspections is unprecedented, as is the level of problem solving. Feng [
26] noted that the central environmental protection inspection system is the embodiment of the central environmental protection inspector’s pollution control. It is also a warning to the local government, which can greatly enhance the red-line awareness of local environmental protection and accelerate the transformation and upgrading of local industries.
However, scholars have expressed doubts about the effectiveness of central environmental protection inspections. For example, Lo [
27] mentioned that the complexity of the governance structure and the differences among local governments pose serious challenges to the central government’s collection of information. It is difficult for the central government’s inspection assessment to cover all aspects of environmental protection, and some assessments can only be based on local government self-assessment reports. This situation gives local governments the opportunity to provide false reports. Chen [
22] puts China’s environmental protection supervision system in the context of historical development and analyzes the evolutionary path from “supervising enterprises” to “supervising government” to “party and government responsibilities,” noting that the current system belongs to the “campaign-style governance” model. Central environmental protection inspections cannot ensure the sustainability of governance and the sustainability of institutional operations. Chen further notes that the rule of law should be used to resolve the shortcomings of “campaign-style governance.” Chen [
28] uses case studies to demonstrate that the supervision mechanism cannot fully realize the integration of bureaucratic governance and campaign-style governance from the perspective of operational effectiveness. In all types of supervision and inspection, there is always information concealment, inspection fraud, data fabrication, and so on. The problem is that bureaucratic organizations cannot be completely penetrated by the will of the leadership. Shi et al. [
29] used the regression discontinuity method to evaluate the effect of this system on air pollution in 25 cities that made environmental protection inquiries. Studies have shown that local governments use “coping” behaviors to cover up the truth. Moreover, the arranged inquiries of the Ministry of Ecology and Environment, which is based on campaign-style governance, have only a very short-term effect on air pollution control.
In empirical research, regression discontinuity has been used to evaluate the effectiveness of environmental policy. Almond et al. [
30] used a regression discontinuity design to study the impact of China’s heating policy on local environmental pollution. During the 1950–1980 period of central planning, due to budgetary limitations, only the Huai River and the area north of the Qinling Mountains were able to receive free coal heating. Using a unique data file on the air pollution concentration in 76 Chinese cities, the heating policy led to dramatically higher levels of Total Suspended Particulates (TSP) in North China, and the TSP levels in North China are 5–8 times those of the United States. Tang and Liu [
31] used the method of regression discontinuity design to test whether the mandatory target system (MTS) has improved the environmental governance performance of local governments in China. The results of that research demonstrate that the MTS has had a positive effect on environmental performance; however, the regression discontinuity design illustrates that the reward and punishment measures in the MTS have had no significant effects on provincial environmental performance. Zhang et al. [
32] used fuzzy regression discontinuity to study whether China’s central supervision and local environmental decentralization management could be combined. The results suggested that central supervision significantly reduced industrial COD emissions by at least 26.8% and that the effect gradually increased with time, thus providing strong evidence supporting the central vertical regulatory reform.
The academic community has two different views on the effectiveness of central environmental protection inspections. One view is that central environmental protection inspections have achieved a breakthrough effect that has greatly improved the environment. Some scholars feel that central environmental protection inspection is the same as the previous system of campaign-style governance; it has a certain effect but not a long-term one. However, the controversial estimation results indicate that neither of the two views has been fully confirmed. How should we view these differences in the understanding of the effectiveness of central environmental protection inspections? In fact, theoretical disputes precisely reflect the multifaceted nature of reality. Central environmental protection inspections have only just begun. Determining their specific effects will require many demonstration tests. Based on the existing literature, the current discussion of central environmental protection inspections focuses on media reports and government departments of information disclosure. Most of the literature follows the three-stage theoretical thinking of “problems–causes–suggestions.” Research on central environmental protection inspections is only discussed in specific cases. Few documents have studied the implementation effect of central environmental protection inspections from a strictly empirical perspective. In the current context of China’s current environmental supervision failure, exploring the governance effect of the central environmental protection inspection system is conducive to identifying its defects and has important practical significance for reforming and improving the environmental management system and accumulating environmental supervision experience. Therefore, this paper is based on a regression discontinuity design and uses the central environmental protection inspection reports to examine air quality data to analyze the effect of central environmental protection inspections on the AQI and various sub-contaminants and to understand the differences in the governance capabilities of the provinces under central environmental protection inspections.
5. Discussion
Why do central environmental protection inspections only have short-term effects that are not sustainable? The answer mainly lies in the fact that central environmental protection inspectors belong to the category of campaign-style governance. The political blue sky not only emerges during international events but has also become a routine vanity project for environmental pollution control [
13]. Central environmental protection inspections are characterized by many different activities, such as manufacturing public opinion, comprehensive mobilization, layer-by-layer transmission pressure, mobilizing the resources of all parties, personal deployment of high-level political leaders of the central government, participation of senior officials at the provincial and ministerial levels, and media portrayal of party and state leaders. These activities all reflect the government operation mode of “campaign-style governance,” which enables the department to maximize cooperation in a short period of time based on various resources and functions [
41]. However, this “task-driven” model of multiple goals is likely to shape local government roles and create functional distortions [
42]. Furthermore, “campaign-style governance” is endogenous to the centralized system, and its processes, characteristics, and effects are similar to the “stimulant effect.” This situation stems from the fact that the authoritarians, through their persistent anxiety, generate excitement; the process usually starts suddenly, and then the action escalates and finally stops. The goal can be achieved to a certain extent, but it cannot eradicate the conventional crisis of governance. After the initial upheaval, the role of stimuli disappears, and everything remains the same [
43]. Because the root cause of the incident is difficult to address through “campaign-style governance,” after the emergency management phase is over, the reason for the initial incentive will rebound and the problem will become more serious. In the next emergency treatment, the government will have to pay more costs [
44]. These characteristics show that the central environmental protection inspection system, as a form of “campaign-style governance,” achieves short-term effects, but it cannot guarantee the sustainability of governance effects and the sustainability of institutional operations. Although air quality may improve substantially in a short period of time, it is not sustainable.
From the perspective of the treatment effect of sub-contaminants, central environmental protection inspections have a significant effect on PM
10, PM
2.5 and CO but no significant impact on other individual pollutants. This is because people are more sensitive to fog and haze than to other aspects of air pollution. The central government uses PM
2.5 and PM
10 as the main assessment basis for air pollution control (according to the Notice of the “Measures for the Implementation of the Air Pollution Prevention and Control Action Plan (Trial)” issued by the General Office of the State Council in April 2014, Beijing-Tianjin-Hebei and the surrounding areas, the Yangtze River Delta region, the Pearl River Delta region and Chongqing Municipality use PM
2.5 as an indicator. The proportion of the five-year average concentration decreased as an indicator, whereas in other regions the annual average concentration of PM
10 decreased as an indicator). Affected by the pressure of performance appraisal, local governments become enthusiastic about strengthening their governance. The assessment of the local government by the central government may be more obvious than the promotion effect of the central environmental protection inspection system with its punitive effects. The performance evaluation system caused a significant decrease in PM
10 and PM
2.5 emissions. In particular, our results suggest that a target-based evaluation system can be effective in motivating bureaucrats to shift their efforts toward tasks that are more heavily weighted by the evaluators and to seek to achieve the targeted policy output. However, although environmental protection is officially and practically incorporated into the cadre performance evaluation, different pollution types are treated differently. Liang and Lang [
45] revealed that when air pollution is more tangible, such as PM
10 and PM
2.5 particulates that are directly visible to the public, more effort is made to control it. Indices for less tangible pollution, such as water pollution and other contaminants that are not included in the performance assessment, are not properly addressed. This hypothesis is consistent with the conclusions reached in Tang and Liu [
31] and Liang and Lang [
45]. On the other hand, 40% of PM
2.5 comes from coal. At present, coal accounts for 64% of China’s energy structure. This dependence on coal makes PM
2.5 treatment extremely difficult, which is also an important reason why the inspector effect of PM
2.5 is smaller than that of PM
10.In addition, in conducting central environmental protection inspections, provinces are heterogeneous, and the way different provinces approach these inspections may depend on their opportunities to obtain benefits from environmental governance and their ability to control environmental pollution [
46]. The causes of atmospheric pollution are complex and closely related to the geographical natural factors, local industrial structure, and energy consumption habits, and they have obvious regional characteristics. Due to China’s vast territory and its serious imbalances in regional development, different regions have significant heterogeneity in terms of their economic base, industrial structure, technical conditions, and energy structure. The ability to prevent air pollution, as well as the technology and management capacity to do so, must coexist alongside large geographical differences [
47].
6. Conclusions
This article presents empirical research, conducted using regression discontinuity, on the central environmental protection inspections. Central environmental protection inspections were found to have a positive effect on the improvement of the air quality index to a certain extent. However, the empirical results in this paper indicate that, in general, the effectiveness of central environmental inspections is rather limited. Among the six pollutant emissions, only PM10, PM2.5 and CO emissions were effectively reduced by the environmental inspections, which is in line with the central government’s assessment of the main pollutants. For the remaining three pollutants (i.e., O3, NO2 and SO2) the environmental inspections did not significantly lead to lower emissions or discharge. In most cases, the current implementation of China’s environmental inspections did not meet the expected results of the effective containment of pollutant emissions, and the current central-to-local assessment system may be more powerful than the central environmental protection inspection agency’s governance of air quality.
At the same time, based on the regression results of the provinces in the third round of inspections, the air pollution control effect in Hunan Province is the most obvious. These findings show that there are certain differences in the governance capabilities of the provinces under central environmental protection inspections. In addition, the empirical research in this paper found that the effect of central environmental supervision on the treatment effect of air quality is unsustainable. A significant effect is only found in the short term; that is, the central environmental inspector engages in campaign-style governance, and the effect of such governance is rapid but not sustainable. Central environmental protection inspections promote the environmental governance of local governments by means of political mobilization and adopt top-down supervision to ensure the strict implementation of environmental policies. This may lead to problems such as “surface management,” “pretend governance,” and “perfume governance” to handle the central government (Source: the people’s daily of china,
http://politics.people.com.cn/n1/2018/0816/c1001-30231207.html).
In 2018, the Central Environmental Protection Inspector began the first round of “looking back.” (see
Appendix A ④) In the process of “looking back,” the issue of rectification was continuously exposed. Before “looking back,” the “rectified” report submitted by the local government created a loophole when it looked back again. Through “reformation on the surface,” “reformation on paper,” and “formalism,” the localities have responded to the inspection group in various ways, which also illustrates the deepening of environmental pollution and the difficulty of promoting local environmental pollution control work. Under these circumstances, increasing the governance effect of central environmental protection inspections has become a top priority.
Policy Suggestions
- (1)
It is recommended that the results of central environmental protection inspections be incorporated into the results of local government performance appraisals to give the former greater weight and link them with the official performance of officials.
- (2)
Due to the differences in governance capacity and different environmental conditions in each province, air pollution control needs to be adapted to local conditions; in other words, local governments are required to adopt different governance measures according to the industrial structure, energy consumption and economic development of each province [
47]. Local governments should formulate corresponding rules and regulations, refine relevant environmental laws and regulations, adapt to local conditions, and formulate reasonable discharge standards according to the specific conditions of the region, such as economic development status, pollutant discharge ratio, and treatment technology level. The central government should adopt different environmental control measures and special inspection methods according to the actual situation of each province instead of all provinces adopting a “one size fits all” approach to governance. Central environmental protection inspections are an effort of the central government to understand local environmental governance. Inspection is not only a form of punishment and accountability but also a form of governance. Therefore, after the inspection, the provinces with more governance challenges should be given greater financial and time support, and the provinces with weak governance should be given more technical assistance. Accountability and punishment are only a means to an end, and the genuine improvement of environmental governance is the real purpose of central environmental protection inspections.
- (3)
Environmental governance is a protracted war. It requires a large amount of investment in people and property. The districts that have completed the rectification tasks of environmental protection inspectors and achieved outstanding effects via rectification have actively helped to obtain the central government’s environmental protection funds and increased the subsidies for environmental protection funds.
- (4)
Because the pressure of central environmental protection inspections has a certain effect in the short term, the environmental governance effect will gradually weaken after the inspection team leaves, and the local government will conduct mobile governance based on the results of the inspection. To consolidate the results of central environmental protection inspections, a strict long-term mechanism for central environmental protection inspection should be established to put the “environmental storm” under the control of the system. In the broadest sense, discussions about climate change by ‘ecoelites’ in China take place almost exclusively within technocratic and regulatory discourses that make little or no mention of society [
48]. Therefore, we should unblock the channels of interest expression of multiple subjects, fully mobilizing the role of civil society and NGOs, and the mainstream media should be used to shape the power of public opinion [
49] to regulate and guide the environmental governance behavior of local governments. In addition, the environmental supervision of the National People’s Congress and the CPPCC should be strengthened, and the multiagent supervision and management system should be further improved to internalize environmental governance into the daily behavior of local governments.
Central environmental protection inspections cannot become merely gusts of wind. It is necessary to actively summarize and combine experience, explore more effective environmental monitoring functions, and promote environmental governance and protection to a new level.


