Heavy Metal Concentrations in the Groundwater of the Barcellona-Milazzo Plain (Italy): Contributions from Geogenic and Anthropogenic Sources

 , , ,
, , ,
Abstract
:1. Introduction
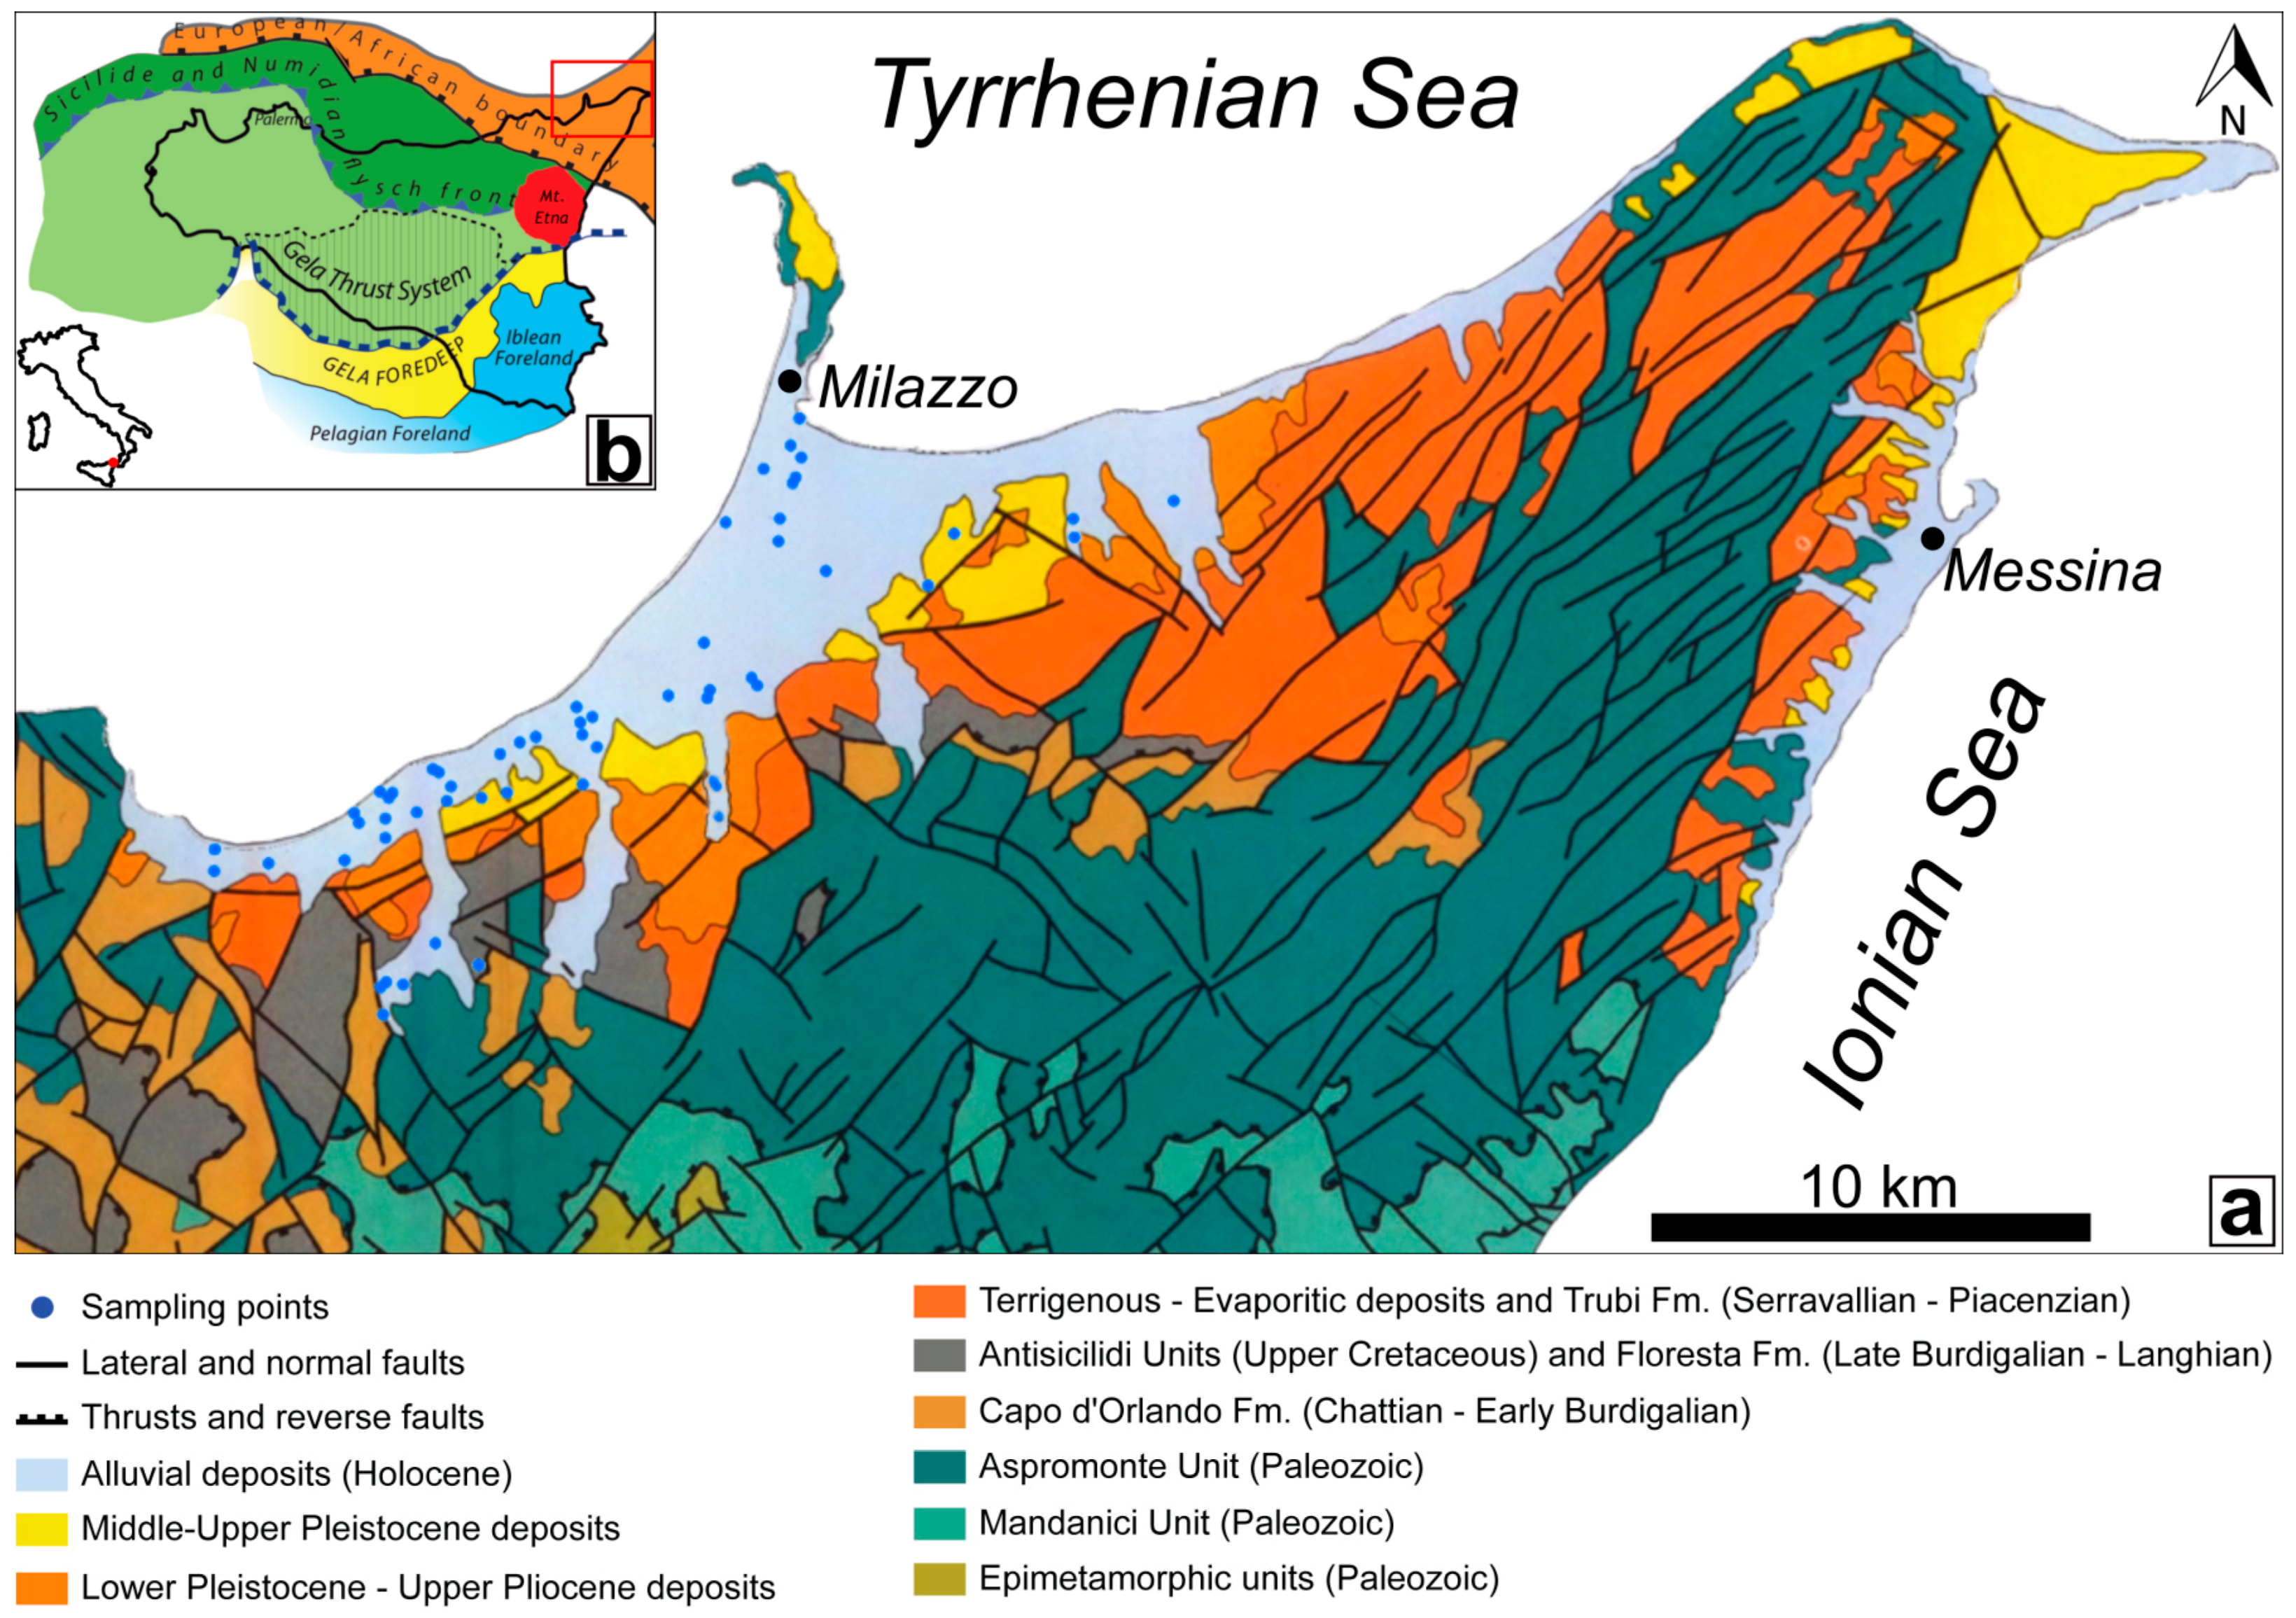
2. Study Area
- An extensive outcrop of the metamorphic rock succession belonging to the Aspromonte Mandanici, San Marco d’Alunzio, and Alì Units;
- A thick sin-orogenic deposits succession (conglomerates, turbiditic sandstones, and marly clays) belonging to the Capo d’Orlando Fm. (late Oligocene to early Miocene);
- The Antisicilide Unit (late Cretaceous to early Paleogene), composed of varicoloured clays with olistolithes of calcarenites and quartzarenites, that overthrusts the Capo d’Orlando Fm., is covered by the calcarenites of the Floresta Fm. (Burdigalian to Langhian);
- Post-orogenic units (middle Miocene to late Pleistocene deposits) that include terrigenous and evaporitic deposits.
3. Materials and Methods
4. Results
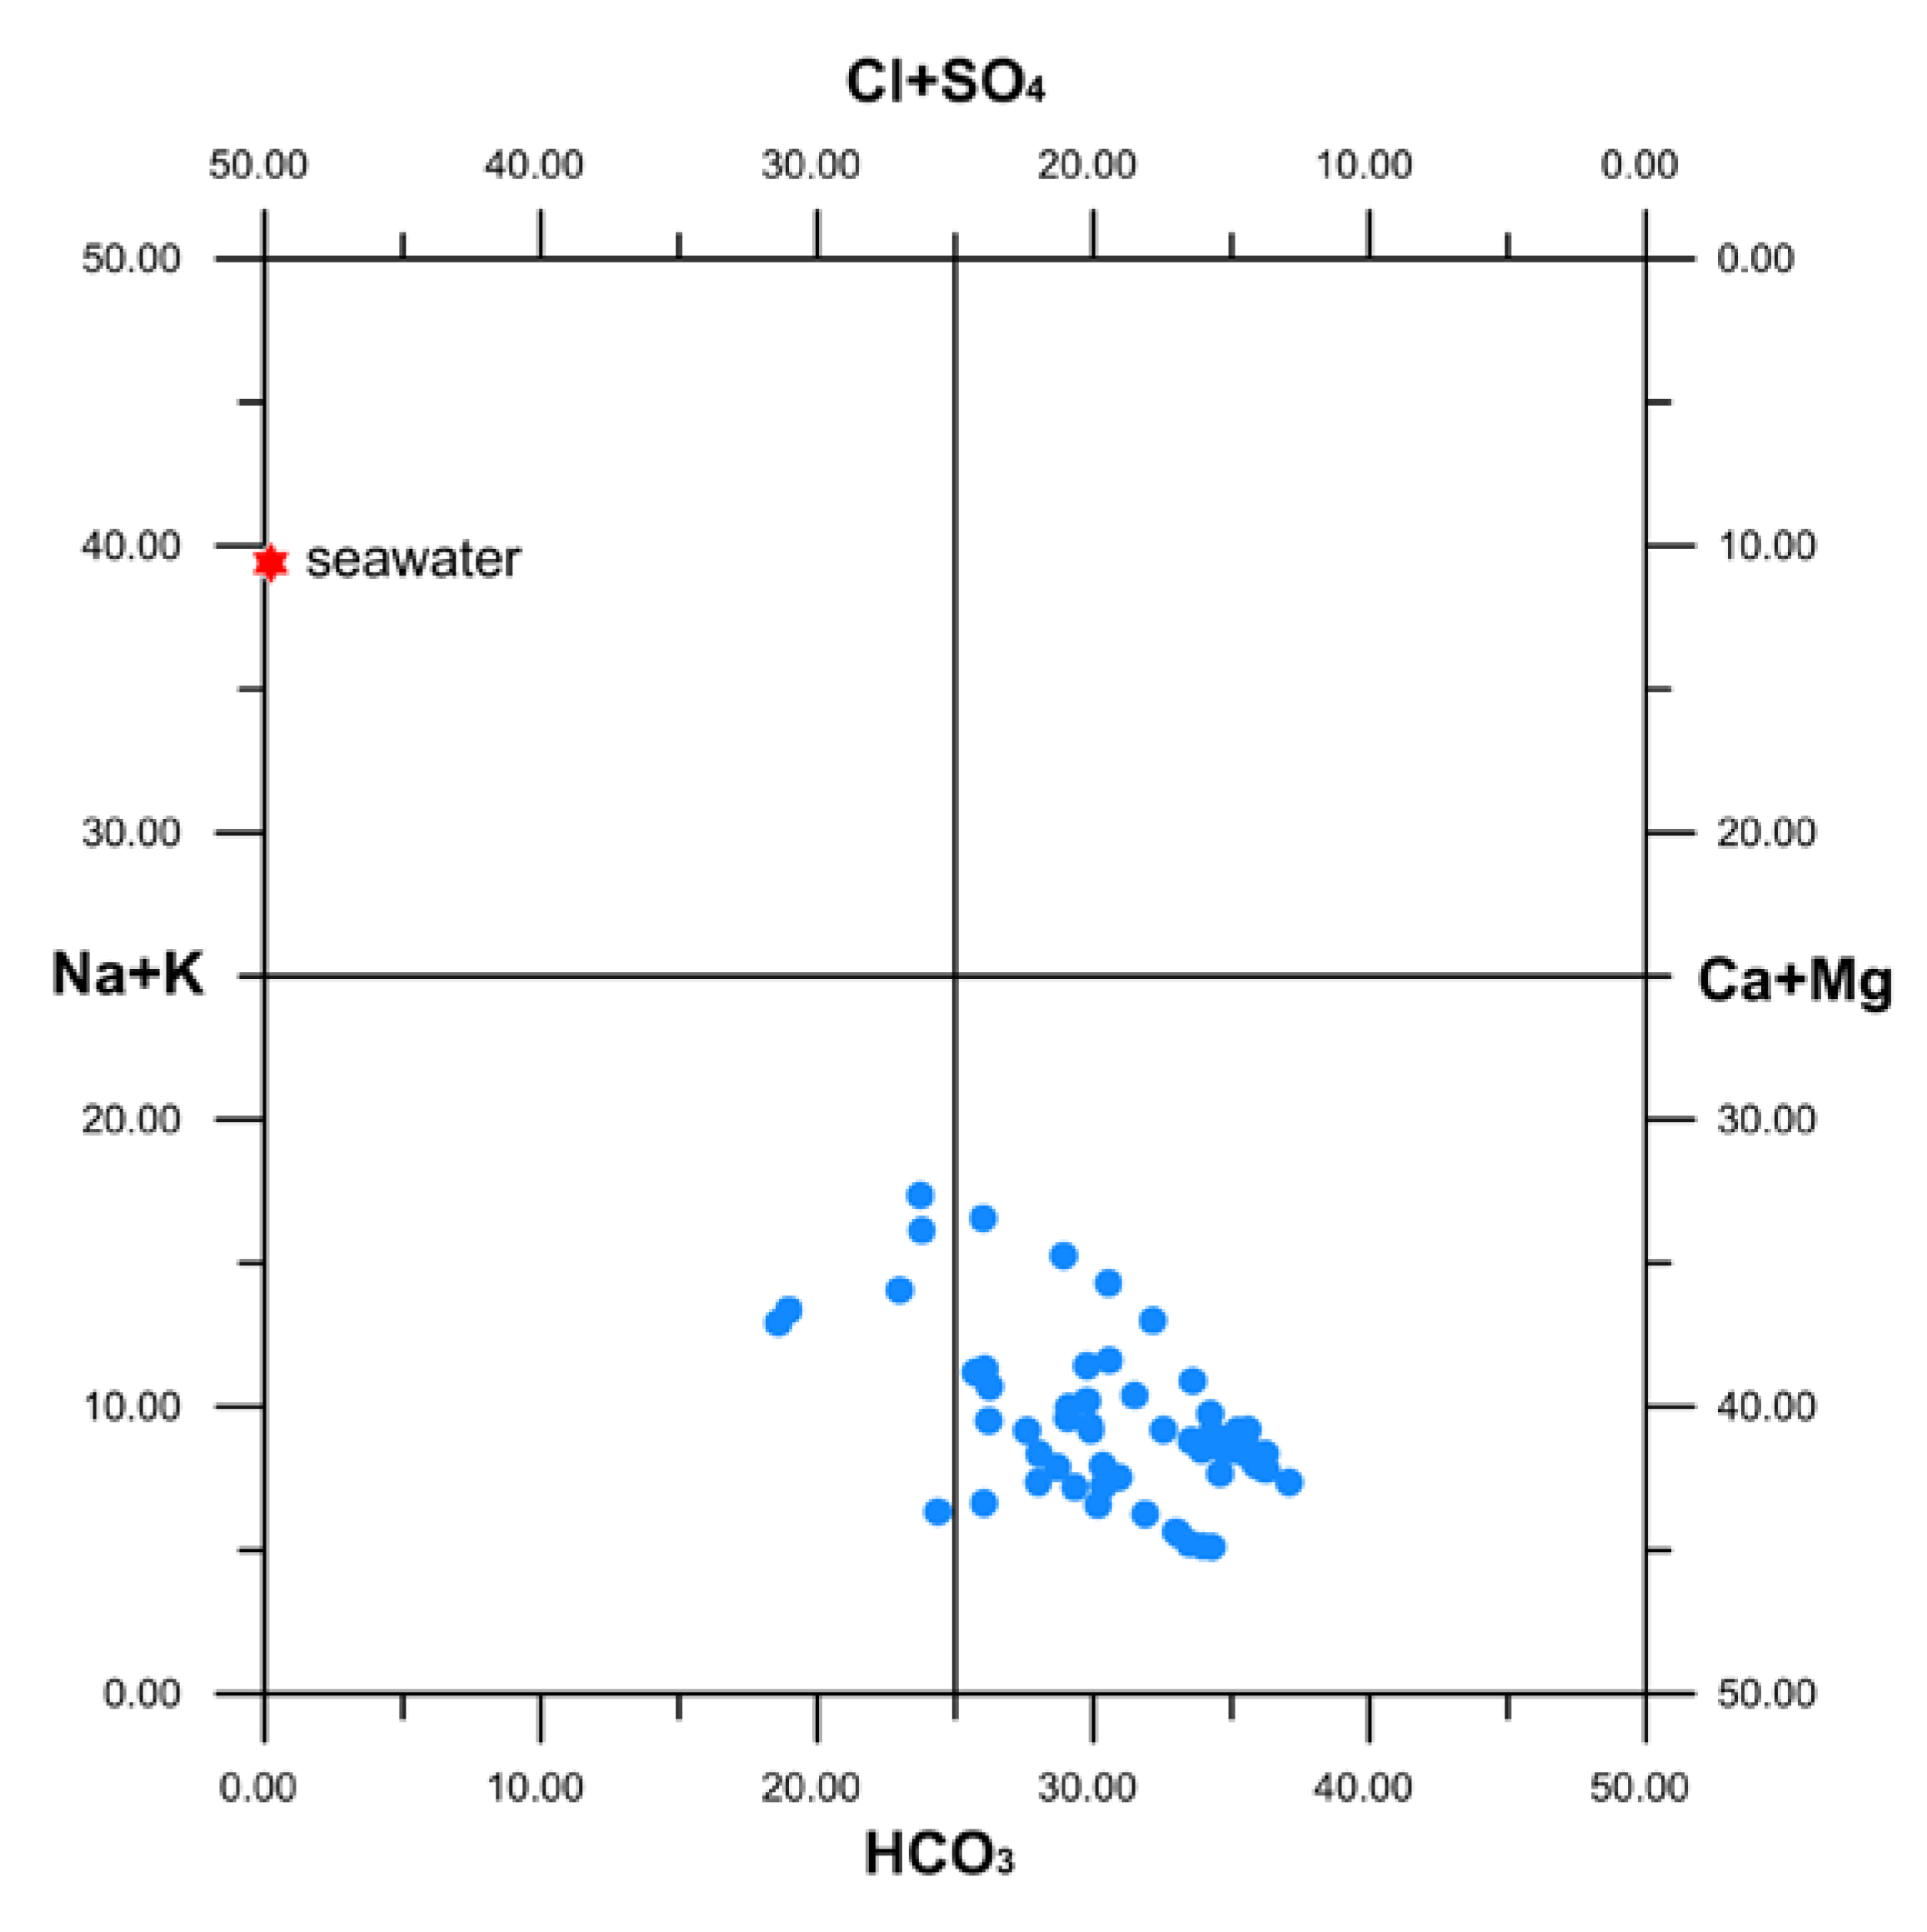
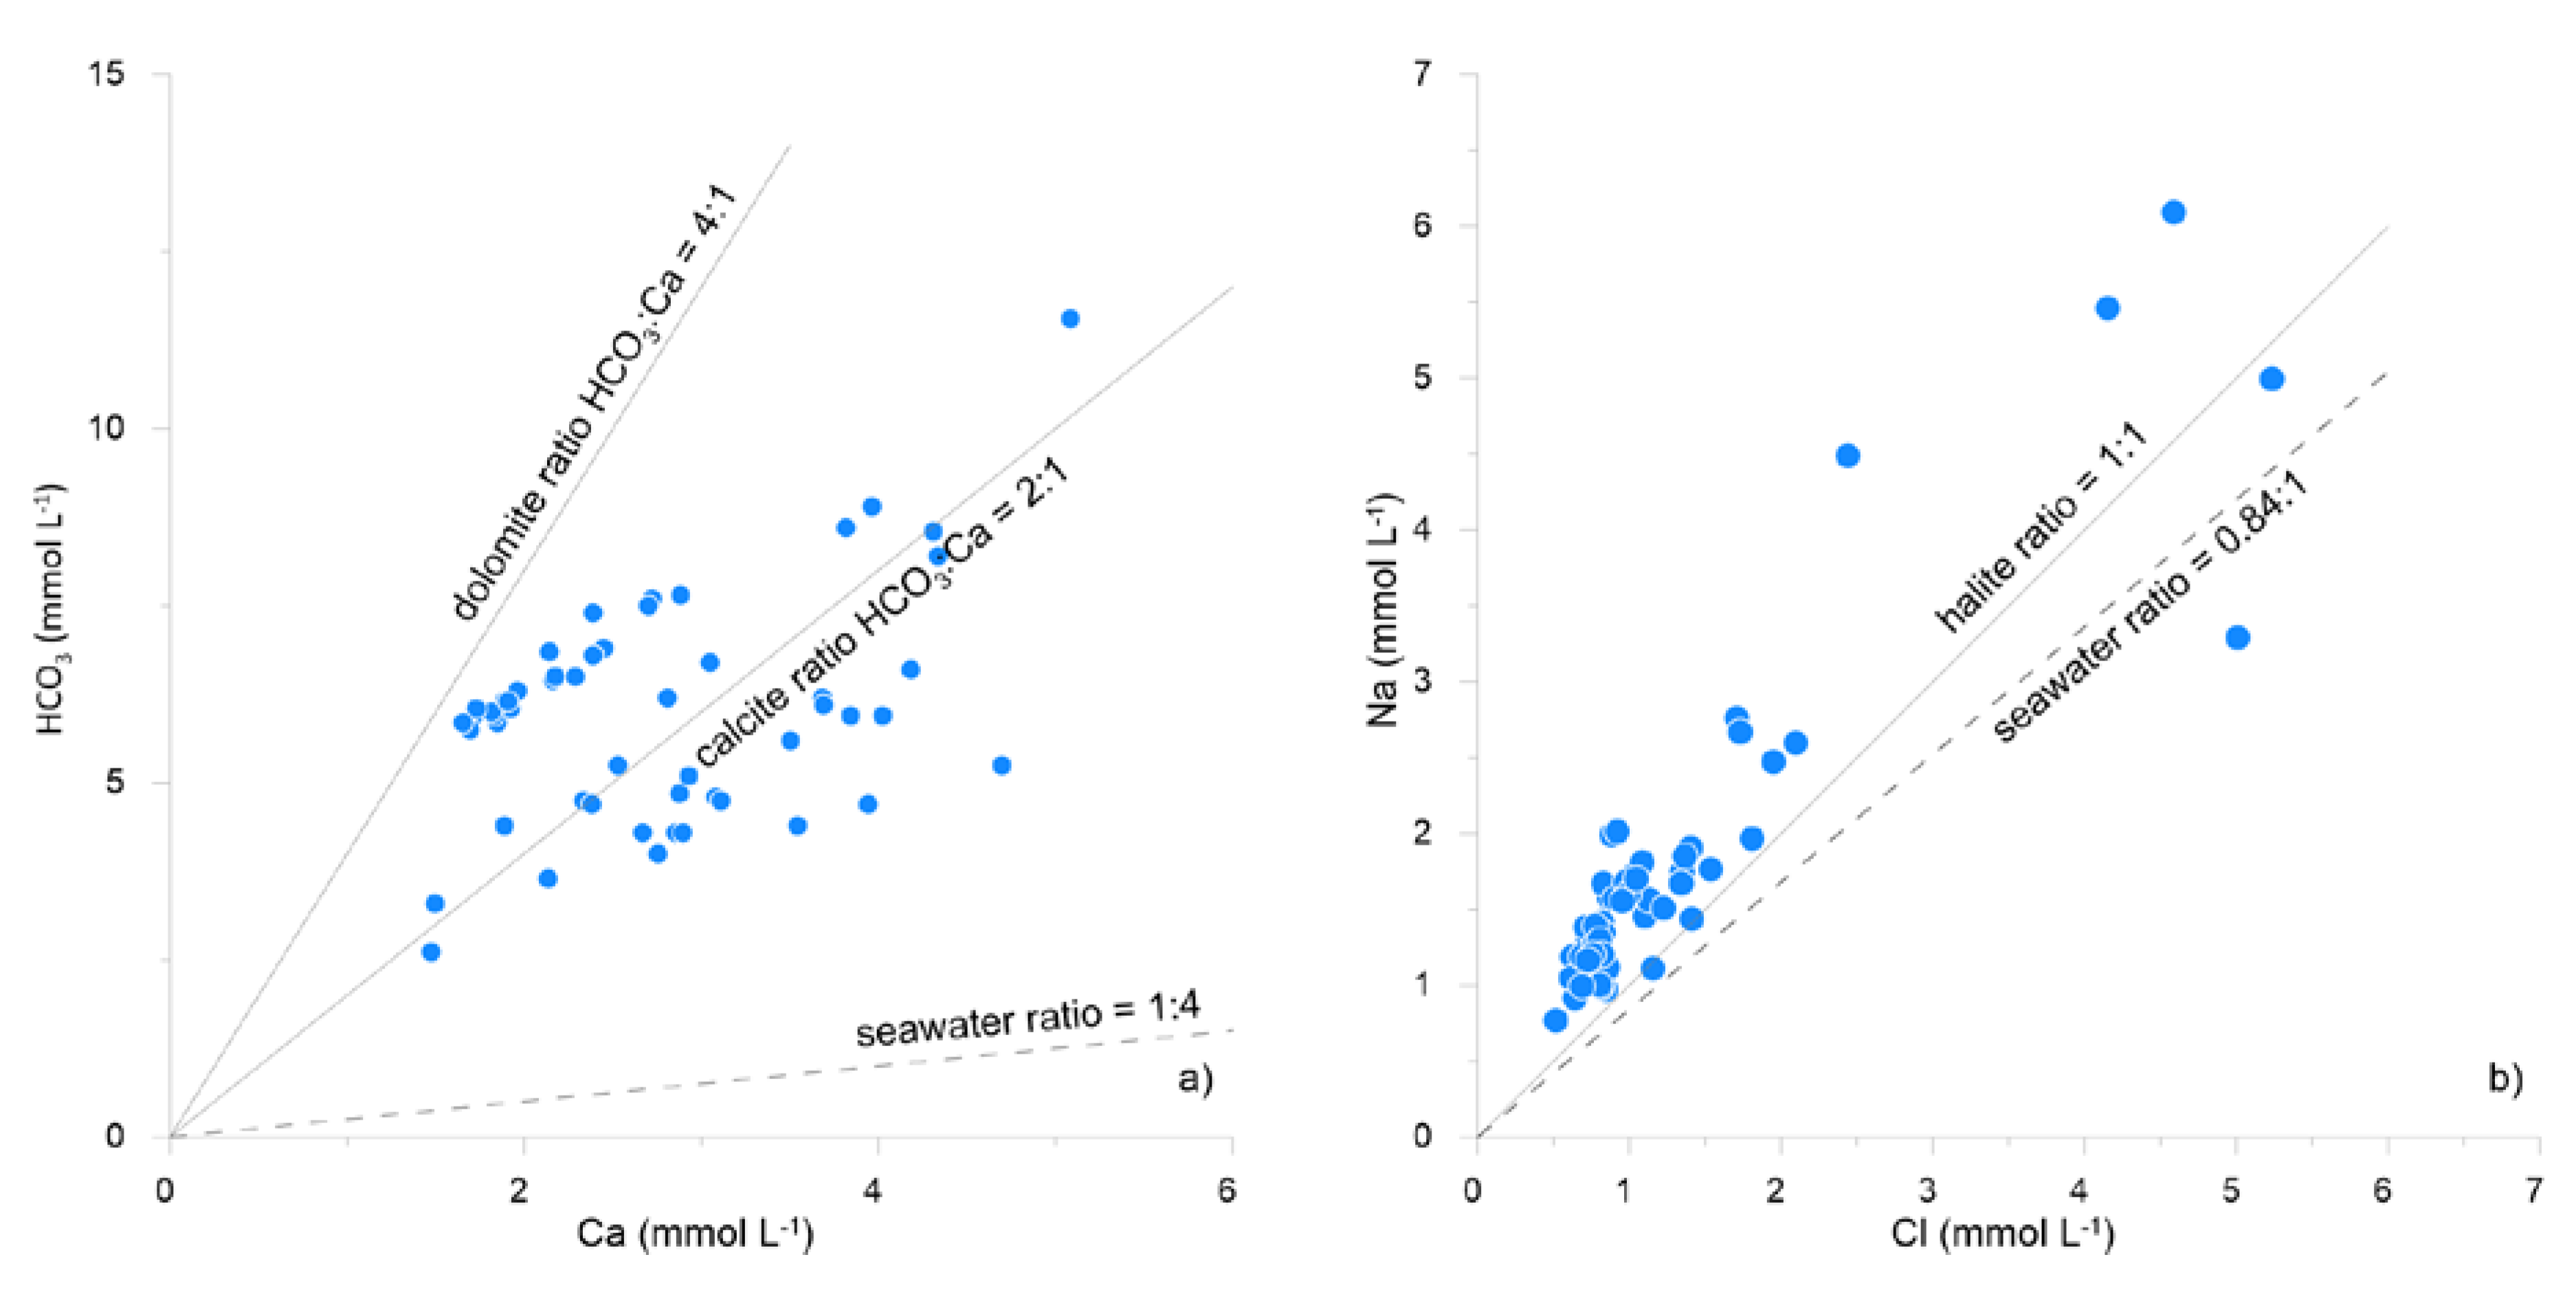
4.1. Chemico-Physical Parameters and Concentration of Major Elements
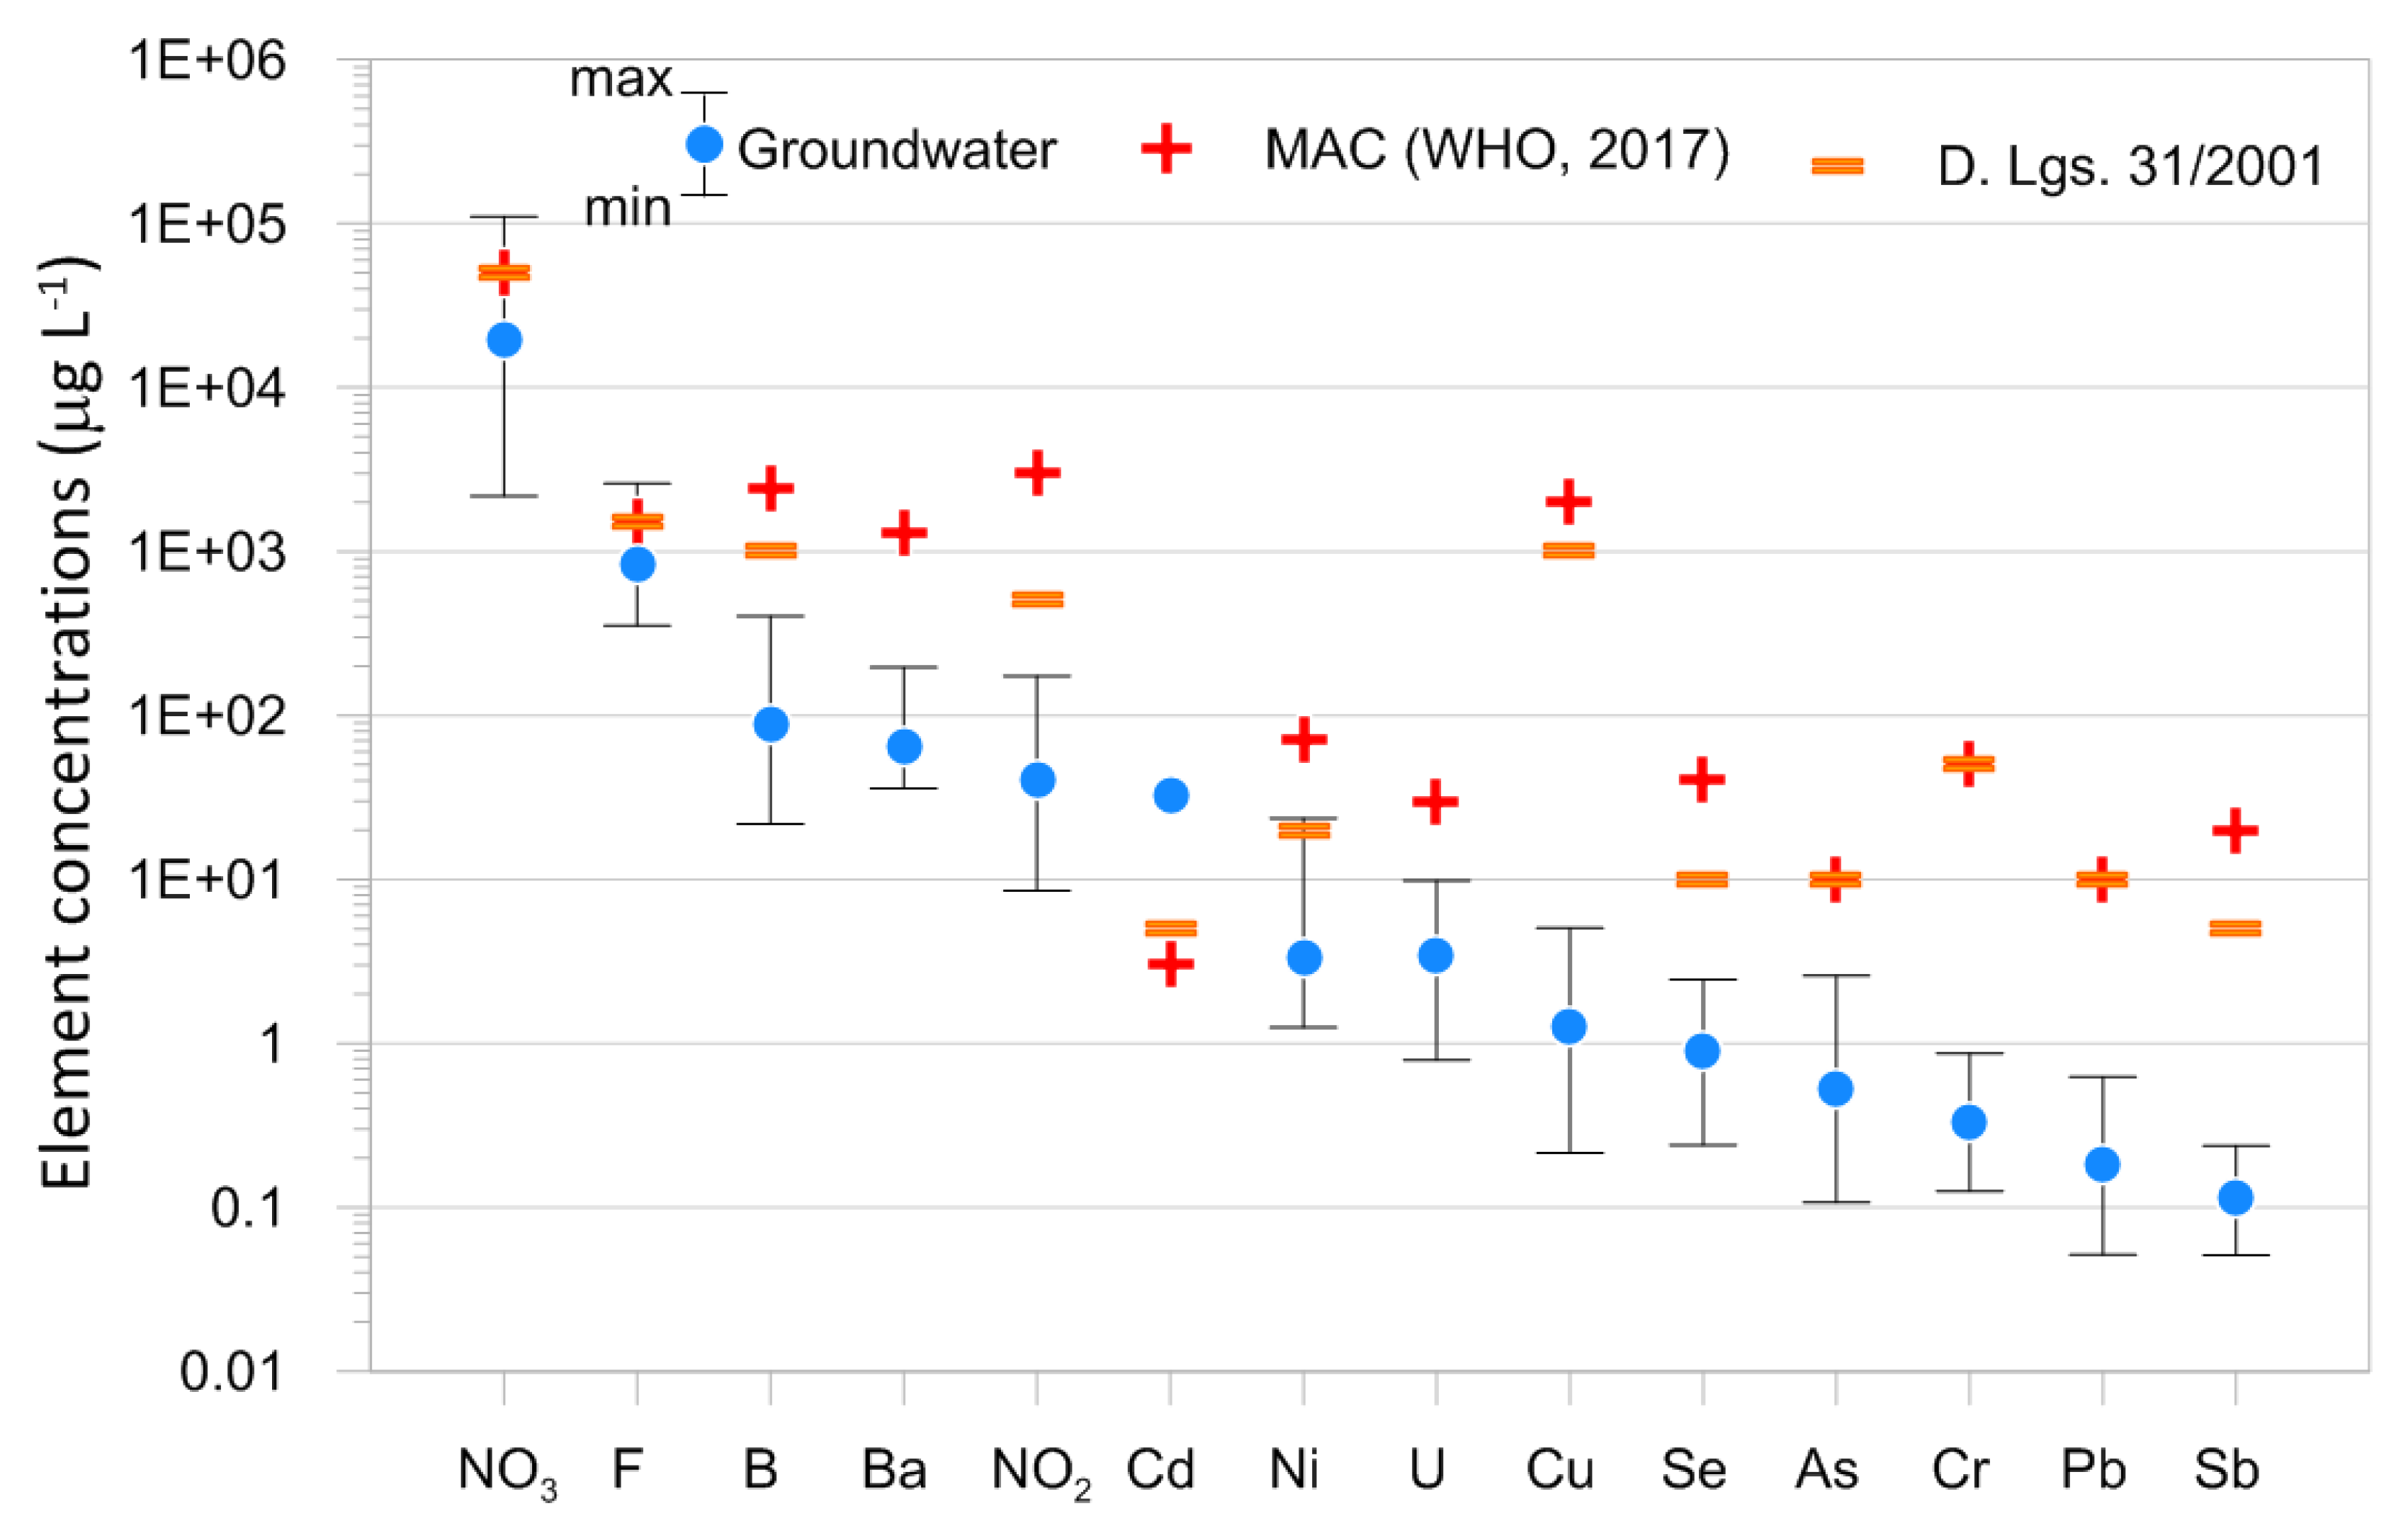
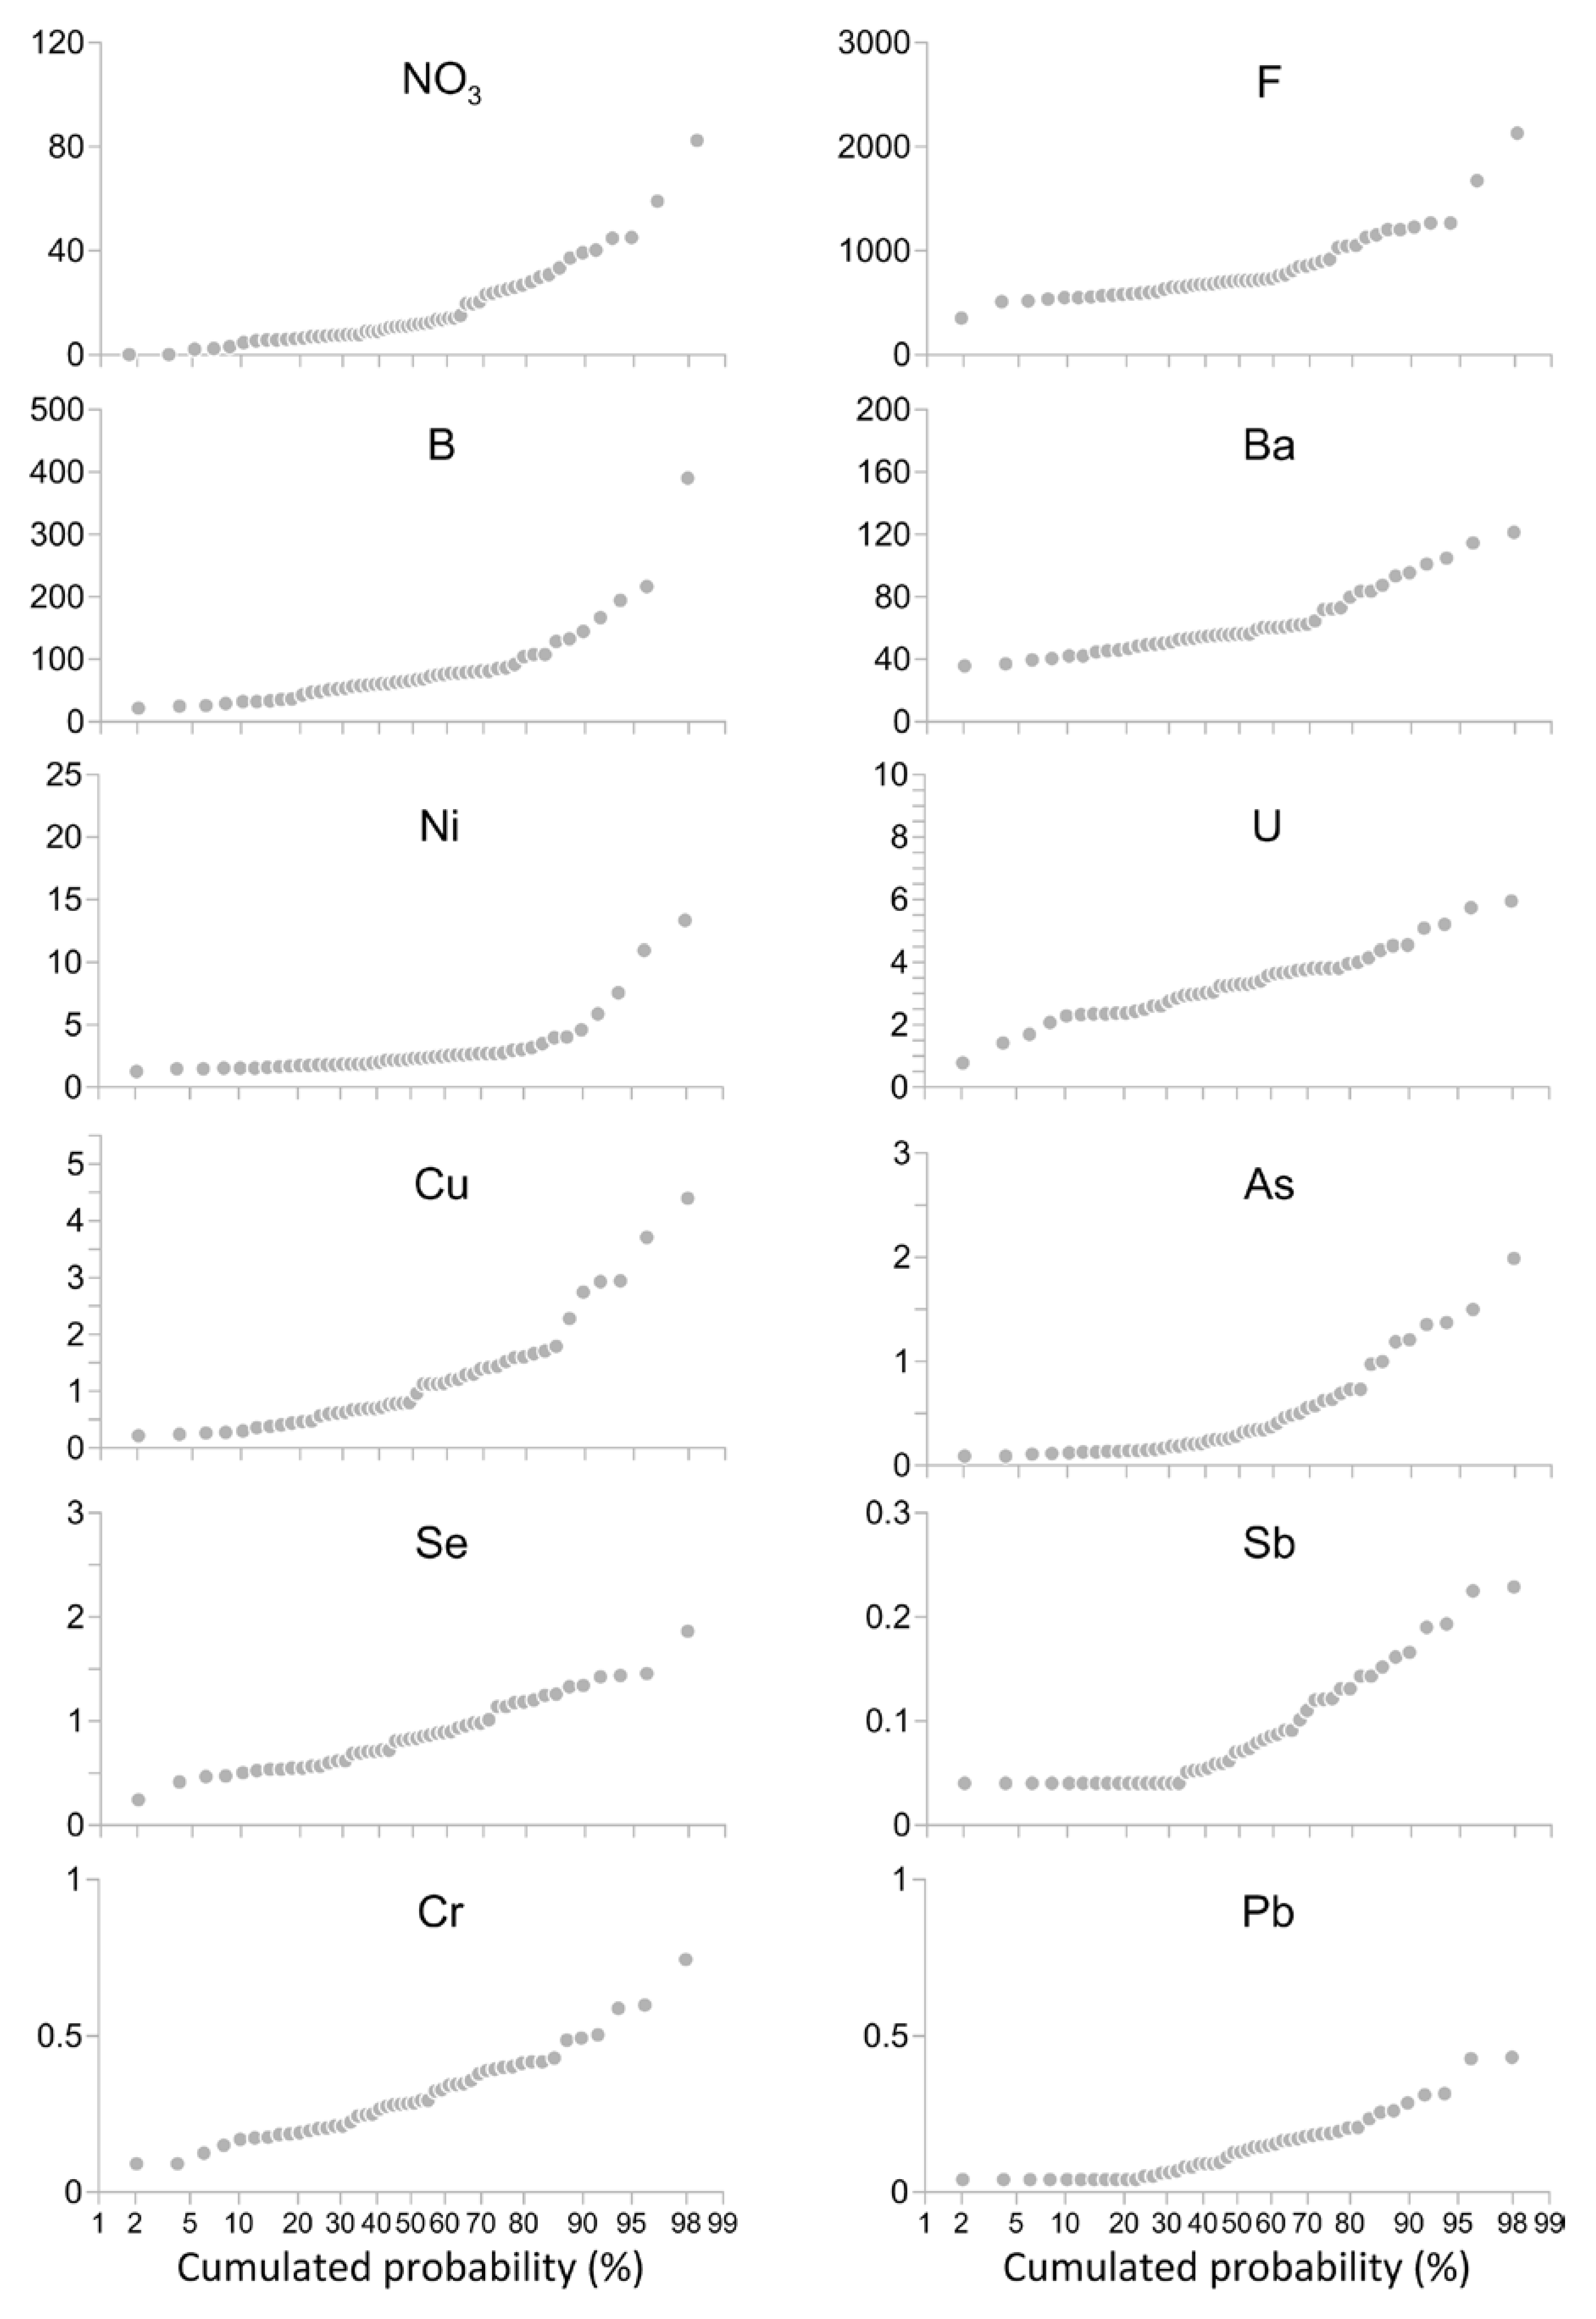
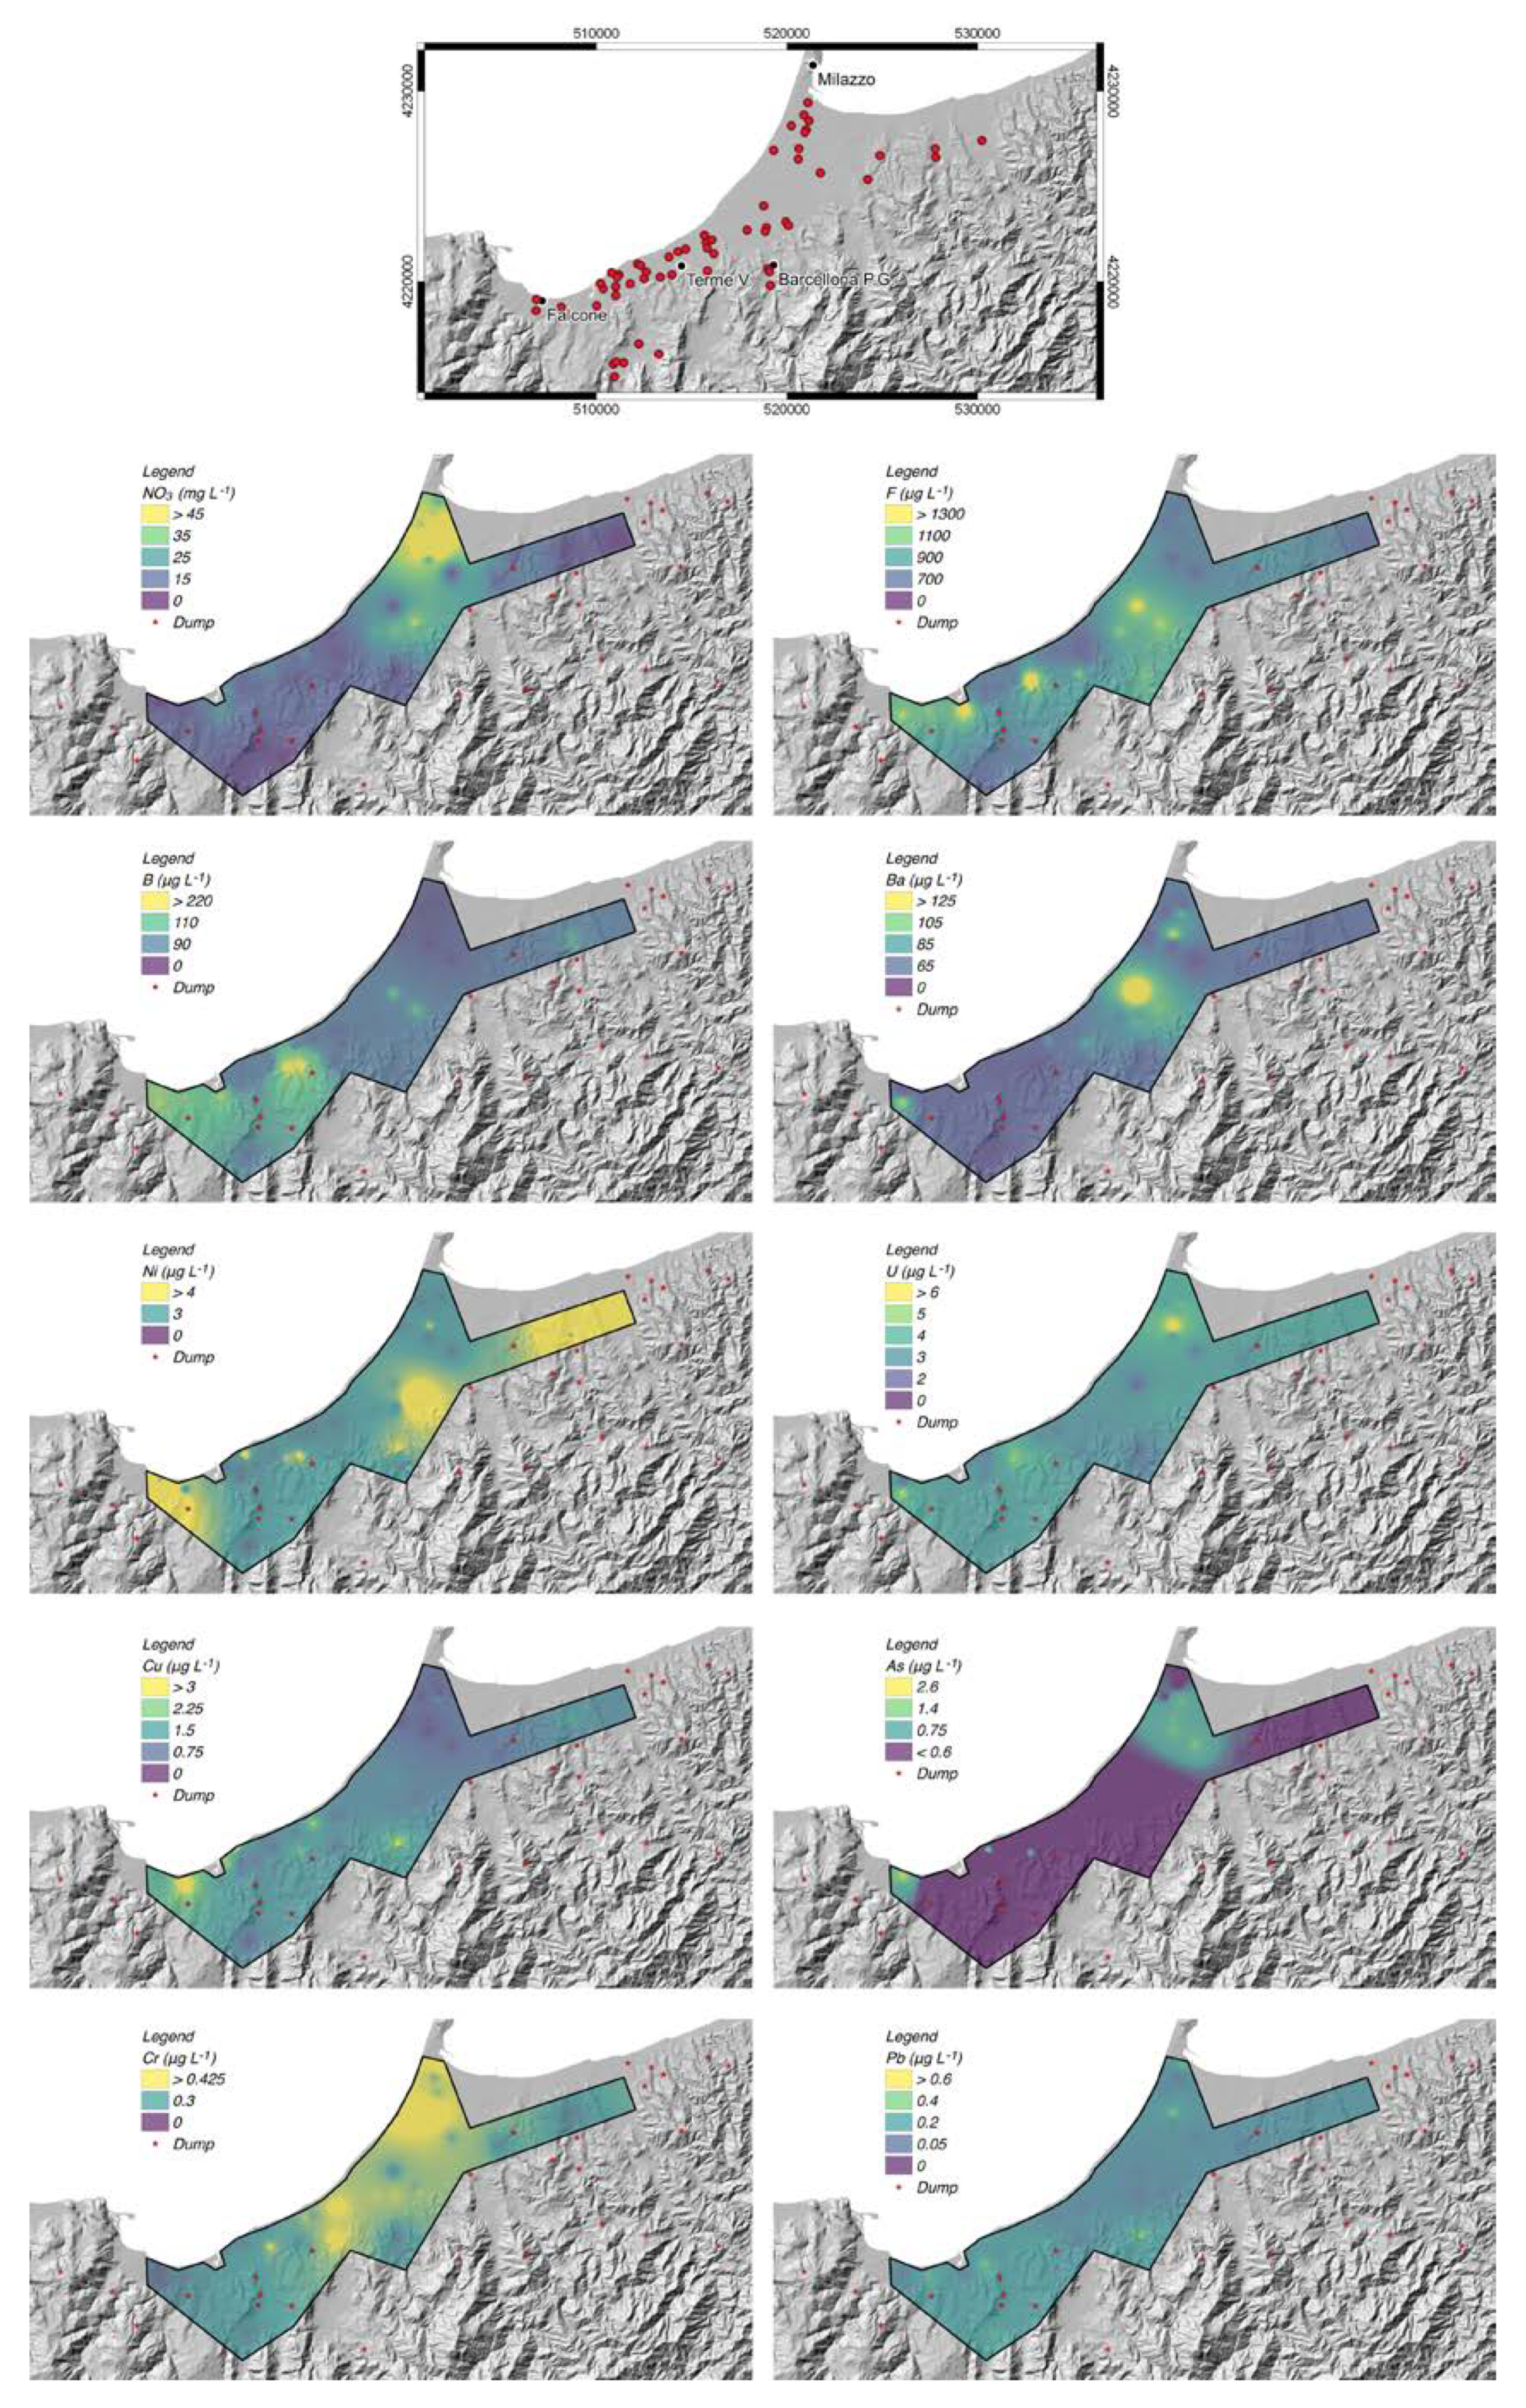
4.2. Minor and Trace Element Concentrations
5. Discussion
6. Conclusions
Author Contributions
Funding
Acknowledgments
Conflicts of Interest
References
- WHO (World Health Organization). Guidelines for Drinking-water Quality, 4th ed.; WHO Press: Geneva, Switzerland, 2011; p. 564. [Google Scholar]
- Wada, Y.; Flörke, M.; Hanasaki, N.; Eisner, S.; Fischer, G.; Tramberend, S.; Satoh, Y.; Van Vliet, M.T.H.; Yillia, P.; Ringler, C.; et al. Modelling global water use for the 21st century: The Water Futures and Solutions (WFaS) initiative and its approaches. Geosci. Model Dev. 2016, 9, 175–222. [Google Scholar] [CrossRef]
- WWAP (United Nations World Water Assessment Programme)/UN-Water. The United Nations World Water Development Report 2018: Nature-Based Solutions for Water; UNESCO: Paris, France, 2018. [Google Scholar]
- WWAP (United Nations World Water Assessment Programme). The United Nations World Water Development Report 2014: Water and Energy; UNESCO: Paris, France, 2014. [Google Scholar]
- Nicholls, R.J.; Small, C. Improved Estimates of Coastal Population and Exposure to Hazard Released. Eos Trans. Am. Geophys. Union 2002, 83, 301–305. [Google Scholar] [CrossRef]
- Catalano, R.; Valenti, V.; Albanese, C.; Accaino, F.; Sulli, A.; Tinivella, U.; Gasparo Morticelli, M.; Zanolla, C.; Giustiniani, M. Sicily’s fold/thrust belt and slab rollback: The SI.RI.PRO. seismic crustal transect. J. Geol. Soc. Lond. 2013, 170, 451–464. [Google Scholar] [CrossRef]
- Gasparo Morticelli, M.; Valenti, V.; Catalano, R.; Sulli, A.; Agate, M.; Avellone, G.; Albanese, C.; Basilone, L.; Gugliotta, C. Deep controls on foreland basin system evolution along the Sicilian fold and thrust belt. Bull. Soc. Géol. De Fr. 2015, 186, 273–290. [Google Scholar] [CrossRef]
- Basilone, L. Lithostratigraphy of Sicily, 1st ed.; Springer International Publishing: Berlin/Heidelberg, Germany, 2018; pp. 1–349. ISBN 978-3-319-73941-0. [Google Scholar]
- Aldega, L.; Corrado, S.; Di Paolo, L.; Somma, R.; Maniscalco, R.; Balestrieri, M.L. Shallow burial and exhumation of the Peloritani Mts. (NE Sicily, Italy): Insight from paleo-thermal and structural indicators. Geol. Soc. Am. Bull. 2011, 123, 132–149. [Google Scholar] [CrossRef]
- Lentini, F.; Carbone, S. Geologia della Sicilia—Geology of Sicily. Mem. Descr. Carta Geol. D’ital. 2014, XCV, 7–414. [Google Scholar]
- Bello, M.; Franchino, A.; Merlini, S. Structural model of Eastern Sicily. Mem. Soc. Geol. Ital. 2000, 55, 61–70. [Google Scholar]
- Giunta, G.; Nigro, F. Tectono-sedimentary constraints to the Oligocene-to-Miocene evolution of the Peloritani thrust belt (NE Sicily). Tectonophysics 1999, 315, 287–299. [Google Scholar] [CrossRef]
- Lentini, F.; Carbone, S.; Grasso, M.; Di Stefano, A.; Romeo, M.; Messina, A. Carta Geologica della Provincia di Messina 1:50,000; 3 fogli; S.EL.CA.: Firenze, Italy, 2000. [Google Scholar]
- Carbone, S.; Messina, A.; Lentini, F.; Macaione, E. Note Illustrative della Carta Geologica d’Italia alla Scala 1:50,000; Foglio 587 Milazzo e 600 Barcellona Pozzo di Gotto. ISPRA-Regione Siciliana, 1-262; S.EL.CA.: Firenze, Italy, 2011. [Google Scholar]
- Lentini, F.; Carbone, S.; Catalano, S.; Vinci, G.; Di Stefano, A. Schema geologico-strutturale della Sicilia Nord-Orientale; S.EL.CA.: Firenze, Italy, 1998. [Google Scholar]
- Arisco, G.; Arnone, G.; Favara, R.; Nigro, F.; Perticone, M.; Renda, P.; Mondello, C. Integrated neotectonic and morphometric analysis of Northern Sicily. Boll. Soc. Geol. Ital. 2006, 125, 221–244. [Google Scholar]
- Ferrara, V. Vulnerabilità all’inquinamento degli acquiferi dell’area Peloritana (Sicilia Nord-Orientale); Pitagora, GNDCI-CNR n. 1946; Pitagora Editore: Bologna, Italy, 1999; pp. 1–119. ISBN 88-371-0863-X. [Google Scholar]
- Ferla, P. Inquadramento geologico-petrografico delle mineralizzazioni metallifere nei Monti Peloritani (Sicilia). Soc. Ital. Min. Petr. 1982, 38, 1075–1091. [Google Scholar]
- Ferla, P.; Omenetto, P. Metallogenic evolution of Peloritani Mountains (NE Sicily): A summary. Mem. Soc. Geol. Ital. 2000, 55, 293–297. [Google Scholar]
- Baldanza, B. Primi risultati delle ricerche eseguite sulle mineralizzazioni dei Monti Peloritani (I minerali della contrada Tripi del comune di Alì, prov. di Messina). Rend. Soc. Min. Ital. 1949, Anno VI, 1–8. [Google Scholar]
- Ferla, P.; Meli, C. Petrogenesis of tourmaline rocks associated with Fe–carbonate–graphite metapelite, metabasite and strata-bound polymetallic sulphide mineralization, Peloritani Mountains, Sicily, Southern Italy. Lithos 2007, 99, 266–288. [Google Scholar] [CrossRef]
- De Vivo, B.; Lima, A.; Catalano, G.; Chersicla, A. Detailed geochemical survey in the Peloritani Arc (northeastern Sicily, Italy): Evidence of gold anomalies. J. Geochem. Explor. 1993, 46, 309–324. [Google Scholar] [CrossRef]
- Palano, M.; Schiavone, D.; Loddo, M.; Neri, M.; Presti, D.; Quarto, R.; Todaro, C.; Neri, G. Active upper crust deformation pattern along the southern edge of the Tyrrhenian subduction zone (NE Sicily): Insights from a multidisciplinary approach. Tectonophysics 2015, 657, 205–218. [Google Scholar] [CrossRef]
- Langelier, W.F.; Ludwig, F. Graphical methods for indicating the mineral character of natural waters. J. Am. Water Work. Assoc. 1942, 34, 335–352. [Google Scholar] [CrossRef]
- WHO (World Health Organization). Guidelines for Drinking-water Quality: Fourth Edition Incorporating the First Addendum; WHO Press: Geneva, Switzerland, 2017; p. 631. [Google Scholar]
- D.Lgs 02 febbraio 2001, n.31 “Attuazione della direttiva 98/83/CE relativa alla qualità delle acque destinate al consumo umano”. G.U. n. 52 del 3 marzo 2001, Supplemento Ordinario n 41. Available online: http://www.camera.it/parlam/leggi/deleghe/01031dl.htm (accessed on 1 October 2018).
- Sinclair, A.J. Selection of threshold values in geochemical data using probability graphs. J. Geochem. Explor. 1974, 3, 129–149. [Google Scholar] [CrossRef]
- Tarquini, S.; Isola, I.; Favalli, M.; Mazzarini, F.; Bisson, M.; Pareschi, M.T.; Boschi, E. TINITALY/01: A new Triangular Irregular Network of Italy. Ann. Geophys. 2007, 50, 407–425. [Google Scholar]
- Tarquini, S.; Vinci, S.; Favalli, M.; Doumaz, F.; Fornaciai, A.; Nannipieri, L. Release of a 10-m-resolution DEM for the Italian territory: Comparison with global-coverage DEMs and anaglyph-mode exploration via the web. Comput. Geosci. 2012, 38, 168–170. [Google Scholar] [CrossRef] [Green Version]
- Tarquini, S.; Nannipieri, L. The 10 m-resolution TINITALY DEM as a trans-disciplinary basis for the analysis of the Italian territory: Current trends and new perspectives. Geomorphology 2017. [Google Scholar] [CrossRef]
- Martin, J.B.; Kastner, M.; Henry, P.; Le Pichon, X.; Lallemant, S. Chemical and isotopic evidence for sources of fluids in a mud volcano field seaward of the Barbados accretionary wedge. J. Geophys. Res. 1996, 101, 20325–20345. [Google Scholar] [CrossRef]
- Giammanco, S.; Palano, M.; Scaltrito, A.; Scarfì, F.; Sortino, F. Possible role of fluid overpressure in the generation of earthquake swarms in active tectonic areas: The case of Peloritani Mts. (Sicily, Italy). J. Volcanol. Geotherm. Res. 2008, 178, 795–806. [Google Scholar] [CrossRef]
- Galvin, R.M. Occurence of metals in waters: An overview. Water Sa 1996, 22, 7–18. [Google Scholar]
- Stefansson, A.; Arnorsson, S. The Geochemistry of As, Mo, Sb, and W in Natural Geothermal Waters, Iceland. In Proceedings of the World Geothermal Congress, Antalya, Turkey, 24–29 April 2005; pp. 1–7. [Google Scholar]
- Weissberg, B.G. Gold-silver ore-grade precipitates from New Zealand thermal waters. Econ. Geol. 1969, 64, 95–108. [Google Scholar] [CrossRef]
- Duplay, J.; Semhi, K.; Mey, M.; Messina, A.; Quaranta, G.; Huber, F.; Aubert, A. Geogenic versus anthropogenic geochemical influence on trace elements contents in soils from the Milazzo Peninsula. Chem. Der Erde 2014, 74, 691–704. [Google Scholar] [CrossRef]
- Pecoraino, G.; Scalici, L.; Avellone, G.; Ceraulo, L.; Favara, R.; Gagliano Candela, E.; Provenzano, M.C.; Scaletta, C. Distribution of volatile organic compounds in Sicilian groundwaters analysed by head space-solid phase micro extraction coupled with gas chromatography mass spectrometry (SPME/GC/MS). Water Res. 2008, 42, 3563–3577. [Google Scholar] [CrossRef] [PubMed]
- WHO (World Health Organization). Fluorides. In Environmental Health Criteria 227; World Health Organization: Geneva, Switzerland, 2002; p. 268. [Google Scholar]


| Mean | Median | Minimum | Maximum | 1st Quartile | 3rd Quartile | σ | Detection Limits | WHO Limits | D. Lgs. 31/2001 Limits | |
|---|---|---|---|---|---|---|---|---|---|---|
| T (°C) | 17.5 | 17.1 | 15 | 24.7 | 16.4 | 18.3 | 1.6 | n.a. | n.a. | n.a. |
| Eh (mV) | 144 | 168.5 | -29 | 253 | 98.75 | 189 | 64.7 | n.a. | n.a. | n.a. |
| pH | 7.28 | 7.26 | 6.81 | 8.49 | 7.15 | 7.39 | 0.2 | n.a. | n.a. | n.a. |
| EC (20 °C, uS cm−1) | 922 | 876 | 502 | 1815 | 766 | 985 | 262 | n.a. | n.a. | n.a. |
| Na (mg L−1) | 42.6 | 35.2 | 17.6 | 140.0 | 27.2 | 42.3 | 27.3 | n.a. | n.a. | |
| K (mg L −1) | 5.99 | 5.67 | 2.96 | 13.6 | 4.77 | 6.46 | 2.1 | n.a. | n.a. | |
| Ca (mg L−1) | 111 | 105 | 55 | 217 | 77 | 136 | 38.5 | n.a. | n.a. | |
| Mg (mg L−1) | 33.5 | 35.9 | 10.7 | 68.3 | 18.0 | 44.7 | 16.6 | n.a. | n.a. | |
| Cl (mg L−1) | 49.0 | 32.4 | 18.3 | 236.8 | 27.4 | 48.1 | 44.4 | n.a. | n.a. | |
| SO4 (mg L−1) | 124 | 108 | 64.8 | 307 | 85.3 | 147 | 49.5 | n.a. | n.a. | |
| HCO3 (mg L−1) | 368 | 368 | 159 | 705 | 294 | 415 | 94.9 | n.a. | n.a. | |
| NO3 (mg L−1) (n=58) | 19.5 | 11.8 | 2.18 | 110 | 7.55 | 25.4 | 19.7 | <1 | n.a. | 50 |
| F (μg L−1) (n = 52) | 847 | 711 | 354 | 2596 | 604 | 943 | 401 | 1500 | 1500 | |
| Sb (μg L−1) (n = 49) | 0.115 | 0.101 | 0.051 | 0.238 | 0.072 | 0.143 | 0.1 | <0.05 | 20 | 5 |
| As (μg L−1) (n = 49) | 0.53 | 0.328 | 0.107 | 2.58 | 0.175 | 0.664 | 0.5 | <0.1 | 10 | 10 |
| Ba (μg L−1) (n = 49) | 65.4 | 56.2 | 36 | 196.4 | 49.6 | 72.4 | 27.8 | <1 | 1300 | n.a. |
| B (μg L−1) (n = 49) | 88.0 | 67.2 | 21.7 | 403.5 | 51.6 | 86.2 | 76.4 | <0.1 | 2400 | 1000 |
| Cr (μg L−1) (n = 49) | 0.332 | 0.294 | 0.1255 | 0.87 | 0.212 | 0.401 | 0.2 | <0.1 | 50 | 50 |
| Ni (μg L−1) (n = 49) | 3.31 | 2.32 | 1.25 | 23.6 | 1.79 | 2.75 | 3.7 | <0.1 | 70 | 20 |
| Pb (μg L−1) (n = 49) | 0.182 | 0.160 | 0.051 | 0.624 | 0.092 | 0.207 | 0.1 | <0.05 | 10 | 10 |
| Cu (μg L−1) (n = 49) | 1.25 | 0.965 | 0.215 | 5.04 | 0.604 | 1.52 | 1.06 | <0.1 | 2000 | 1000 |
| Se (μg L−1) (n = 49) | 0.902 | 0.835 | 0.24 | 2.44 | 0.596 | 1.14 | 0.4 | <0.1 | 40 | 10 |
| U (μg L−1) (n = 49) | 3.44 | 3.3 | 0.79 | 9.84 | 2.6 | 3.8 | 1.4 | <0.1 | 30 | n.a. |
© 2019 by the authors. Licensee MDPI, Basel, Switzerland. This article is an open access article distributed under the terms and conditions of the Creative Commons Attribution (CC BY) license (http://creativecommons.org/licenses/by/4.0/).
Share and Cite
Cangemi, M.; Madonia, P.; Albano, L.; Bonfardeci, A.; Di Figlia, M.G.; Di Martino, R.M.R.; Nicolosi, M.; Favara, R. Heavy Metal Concentrations in the Groundwater of the Barcellona-Milazzo Plain (Italy): Contributions from Geogenic and Anthropogenic Sources. Int. J. Environ. Res. Public Health 2019, 16, 285. https://doi.org/10.3390/ijerph16020285
Cangemi M, Madonia P, Albano L, Bonfardeci A, Di Figlia MG, Di Martino RMR, Nicolosi M, Favara R. Heavy Metal Concentrations in the Groundwater of the Barcellona-Milazzo Plain (Italy): Contributions from Geogenic and Anthropogenic Sources. International Journal of Environmental Research and Public Health. 2019; 16(2):285. https://doi.org/10.3390/ijerph16020285
Chicago/Turabian StyleCangemi, Marianna, Paolo Madonia, Ludovico Albano, Alessandro Bonfardeci, Maria Grazia Di Figlia, Roberto Maria Rosario Di Martino, Marco Nicolosi, and Rocco Favara. 2019. "Heavy Metal Concentrations in the Groundwater of the Barcellona-Milazzo Plain (Italy): Contributions from Geogenic and Anthropogenic Sources" International Journal of Environmental Research and Public Health 16, no. 2: 285. https://doi.org/10.3390/ijerph16020285