Article

Co-Exposure to SiO2 Nanoparticles and Arsenic Induced Augmentation of Oxidative Stress and Mitochondria-Dependent Apoptosis in Human Cells

by
Maqusood Ahamed
1,*,
Mohd Javed Akhtar
1 and
Hisham A. Alhadlaq
1,2
1
King Abdullah Institute for Nanotechnology, King Saud University, Riyadh 11142, Saudi Arabia
2
Department of Physics and Astronomy, College of Science, King Saud University, Riyadh 11142, Saudi Arabia
*
Author to whom correspondence should be addressed.
Int. J. Environ. Res. Public Health 2019, 16(17), 3199; https://doi.org/10.3390/ijerph16173199
Submission received: 31 July 2019 / Revised: 27 August 2019 / Accepted: 29 August 2019 / Published: 1 September 2019
(This article belongs to the Special Issue Toxicology and Public Health)

Abstract

:
Widespread application of silica nanoparticles (nSiO2) and ubiquitous metalloid arsenic (As) may increase their chances of co-exposure to human beings in daily life. Nonetheless, studies on combined effects of nSiO2 and As in human cells are lacking. We investigated the co-exposure effects of nSiO2 and As in human liver (HepG2) and human fibroblast (HT1080) cells. Results showed that nSiO2 did not cause cytotoxicity. However, exposure of As caused oxidative stress and apoptosis in both types of cells. Interesting results were that co-exposure of a non-cytotoxic concentration of nSiO2 significantly augmented the As induced toxicity in both cells. Intracellular level of As was higher in the co-exposure group (nSiO2 + As) than the As group alone, suggesting that nSiO2 facilitates the cellular uptake of As. Co-exposure of nSiO2 and As potentiated oxidative stress indicated by pro-oxidants generation (reactive oxygen species, hydrogen peroxide and lipid peroxidation) and antioxidants depletion (glutathione level, and glutathione reductase, superoxide dismutase and catalase activities). In addition, co-exposure of nSiO2 and As also potentiated mitochondria-mediated apoptosis suggested by increased expression of p53, bax, caspase-3 and caspase-9 genes (pro-apoptotic) and decreased expression of bcl-2 gene (anti-apoptotic) along with depleted mitochondrial membrane potential. To the best of our knowledge, this is the first study showing that co-exposure of nSiO2 and As induced augmentation of oxidative stress and mitochondria-mediated apoptosis in HepG2 and HT1080 cells. Hence, careful attention is required for human health assessment following combined exposure to nSiO2 and As.

1. Introduction

Nano-scale silica (nSiO2) is one of the most widely used nanoparticles due to its extraordinary properties such as monodispersity, drug loading capacity and potential to hybridize with other organic or inorganic materials [1,2]. These unique properties of nSiO2 offer great potential for various applications e.g., cosmetics, food industry, environmental remediation, drug delivery, biosensor and tissue imaging [3,4,5]. Due to high production and broad applications release of nSiO2 to the natural environment and potential risk of their toxicity is inevitable. Biodistribution and toxicity of nSiO2 have been extensively studied. In general, nSiO2 is not toxic at low exposure level but exerts toxicity at high exposure level [6,7,8]. Earlier reports demonstrate that nSiO2 induces inflammation, oxidative stress and cell death to different mammalian cells [9,10,11]. The nSiO2 is also able to translocate into the blood stream and cause toxicity to various vital organs including lung, liver, heart and brain [12,13].
Metalloid arsenic (As) is a ubiquitous environmental contaminant, whose risk of human poisoning is a global concern [14]. The Agency for Toxic Substances and Diseases Registry (ATSDR) ranks As first in the priority list of hazardous substances [15]. Recent statistics show that global production of As in 2018 was around 37,000 ton/year, hence, increased As disposal to the environment [16]. Inorganic As is more toxic than organic As. Among inorganic, As (III) is more toxic than As (V) [17]. However, toxicity of As might largely be affected by several environmental factors including organic matters, colloids and presence of nanoparticles [18,19]. Therefore, these factors should be taken account while evaluating the toxicity of As [20,21].
Current research is now focusing on interaction of nanoparticles with pre-existing environmental contaminants, which may further enhance the undesirable effects to human health. Hence, studies on interaction of nSiO2 with pre-existing contaminants have a practical importance in the field of toxicology [22]. Most of the toxicological studies on nSiO2 are focused on single exposure and research on combined effects of nSiO2 and pre-existing environmental pollutants are limited. Wu et al. [23] observed that co-exposure of nSiO2 and benzo(a)pyrene causes synergistic toxicity to human bronchial epithelial (BEAS-2B) cells. Co-exposure of nSiO2 and methylmercury (MeHg) or lead (Pb) induces synergistic cardiac toxicity [24,25]. The nSiO2 and Pb co-exposure induces joint toxicity to human lung epithelial cells (A549) [26,27].
Extensive applications of nSiO2 and ubiquitous As contamination may increase their chance of co-exposure to humans in daily life. For instance, As contaminated drinking water significantly contributes to total As intake by the general population of many countries [28]. These populations may also consume nSiO2 polluted water or food. Therefore, it is imperative to explore the co-exposure effects of nSiO2 and As in human cells. Studies on combined effects of nSiO2 and As in human cells are lacking. Hence, we investigated the co-exposure effects of nSiO2 and As in human liver HepG2 and human fibroblast HT1080 cells. Liver is one of the target organs for As and nSiO2 [29,30]. Xie et al. [30] also demonstrated that nSiO2 mainly accumulates in liver, lung and spleen after intravenous administration. We have also chosen the HT1080 cell line to evade cell type specific responses following co-exposure of nSiO2 and As. The HepG2 and HT1080 cell lines have been widely used in toxicity studies [31,32,33]. To achieve this goal, we examined the various biomarkers of cytotoxicity, oxidative stress and apoptosis in both HepG2 and HT1080 following exposure to nSiO2 and/or As. The underlying mechanisms of combined toxicity of nSiO2 and As were also discussed.

2. Materials and Methods

2.1. SiO2 Nanoparticles and Arsenic Preparation

Amorphous SiO2 nanopowder (size: 10–20 nm, purity: 99.5% trace metals basis) and sodium arsenate (Na2HAsO4·7H2O) (As (V)) were purchased from Sigma-Aldrich (St. Louis, MO, USA). A stock solution (1 mg/mL) of nSiO2 was prepared in distilled water. In order to avoid the agglomeration, the solution was sonicated using a sonicator at 40 W for 5 min before adding to culture medium. Sodium arsenate was used as a source of As (V) and dissolved in distilled water.
Amorphous nSiO2 was characterized in our laboratory before toxicity studies. The amorphous nature of nSiO2 was indicated by X-ray diffraction (XRD) (PANalytical X’Pert) assembled with Ni filter and Cu Kα(λ = 1.54056 Å) radiations as a source of X-ray. Field emission scanning electron microscopy (FESEM, JSM-7600F, JEOL, Inc., Japan) and field emission transmission electron microscopy (FETEM, JEM-2100F, JEOL, Inc.) were used to examine the morphology of nSiO2. ZetaSizerNano-HT (Malvern Instruments, UK) was applied to measure the hydrodynamic size and zeta potential of nSiO2 in distilled water and culture medium.

2.2. Cell Culture

The HepG2 and HT1080 cell lines were cultured in Dulbecco’s modified Eagle’s medium (DMEM) (Invitrogen, CA, USA) with 100 unit/mL of antibiotics (penicillin–streptomycin, Invitrogen) and 10% fetal bovine serum (FBS) (Invitrogen) at 37 °C with 5% CO2 supplementation. At appropriate confluence (80%–85%), cells were harvested using trypsin (Invitrogen) and sub-cultured for further experiments.

2.3. Selection of Appropriate Concentration of nSiO2 and As

Screening tests (3-(4, 5-dimethylthiazol-2-yl)-2, 5-diphenyltetrazoliumbromide (MTT) assay) were performed to define the appropriate concentrations of nSiO2 and As for the assessment of their combined effects in HepG2 and HT1080 cells. Both types of cells were exposed to various concentrations of nSiO2 (0.5, 1, 5, 10, 25, 50 and 100 μg/mL) and As (0.1, 0.2, 0.5, 1, 2, 5 and 10 μg/mL) for 24 h. Results demonstrated that nSiO2 did not induce cytotoxicity to both HepG2 and HT1080 cells in selected concentrations. On the other hand, heavy metal As induced concentration-dependent cytotoxicity in both HepG2 and HT1080 cells in the concentration range of 0.1–10 μg/mL. We further examined the co-exposure effects of nSiO2 and As with different combinations. Based on these results, we selected one concentration of each material; non-cytotoxic concentration of nSiO2 (10 μg/mL) and cytotoxic concentration of As (1 μg/mL) to explore their combined effects in HepG2 and HT1080 cells (screening data not given).

2.4. Cytotoxicity Parameters

Cells were seeded in 96-well plate and exposed for 24 h to either nSiO2 (10 μg/mL), or As (1 μg/mL) or a combination of both (SiO2 + As). Cell viability was examined by 3-(4, 5-dimethylthiazol-2-yl)-2, 5-diphenyltetrazoliumbromide (MTT) and neutral red uptake (NRU) assays with specific medications [34]. In an MTT assay, live cells have ability to reduce MTT into a blue formazan compound. Absorbance of this compound was recorded at 570 nm (Microplate reader, Synergy-HT, Biotek, Vinooski, VT, USA). The NRU assay is based on the ability of live cells to integrate and bind neutral red (NR) dye with lysosomes. The absorbance of NR probe was measured at 540 nm (Microplate reader (Synergy-HT, Biotek)).

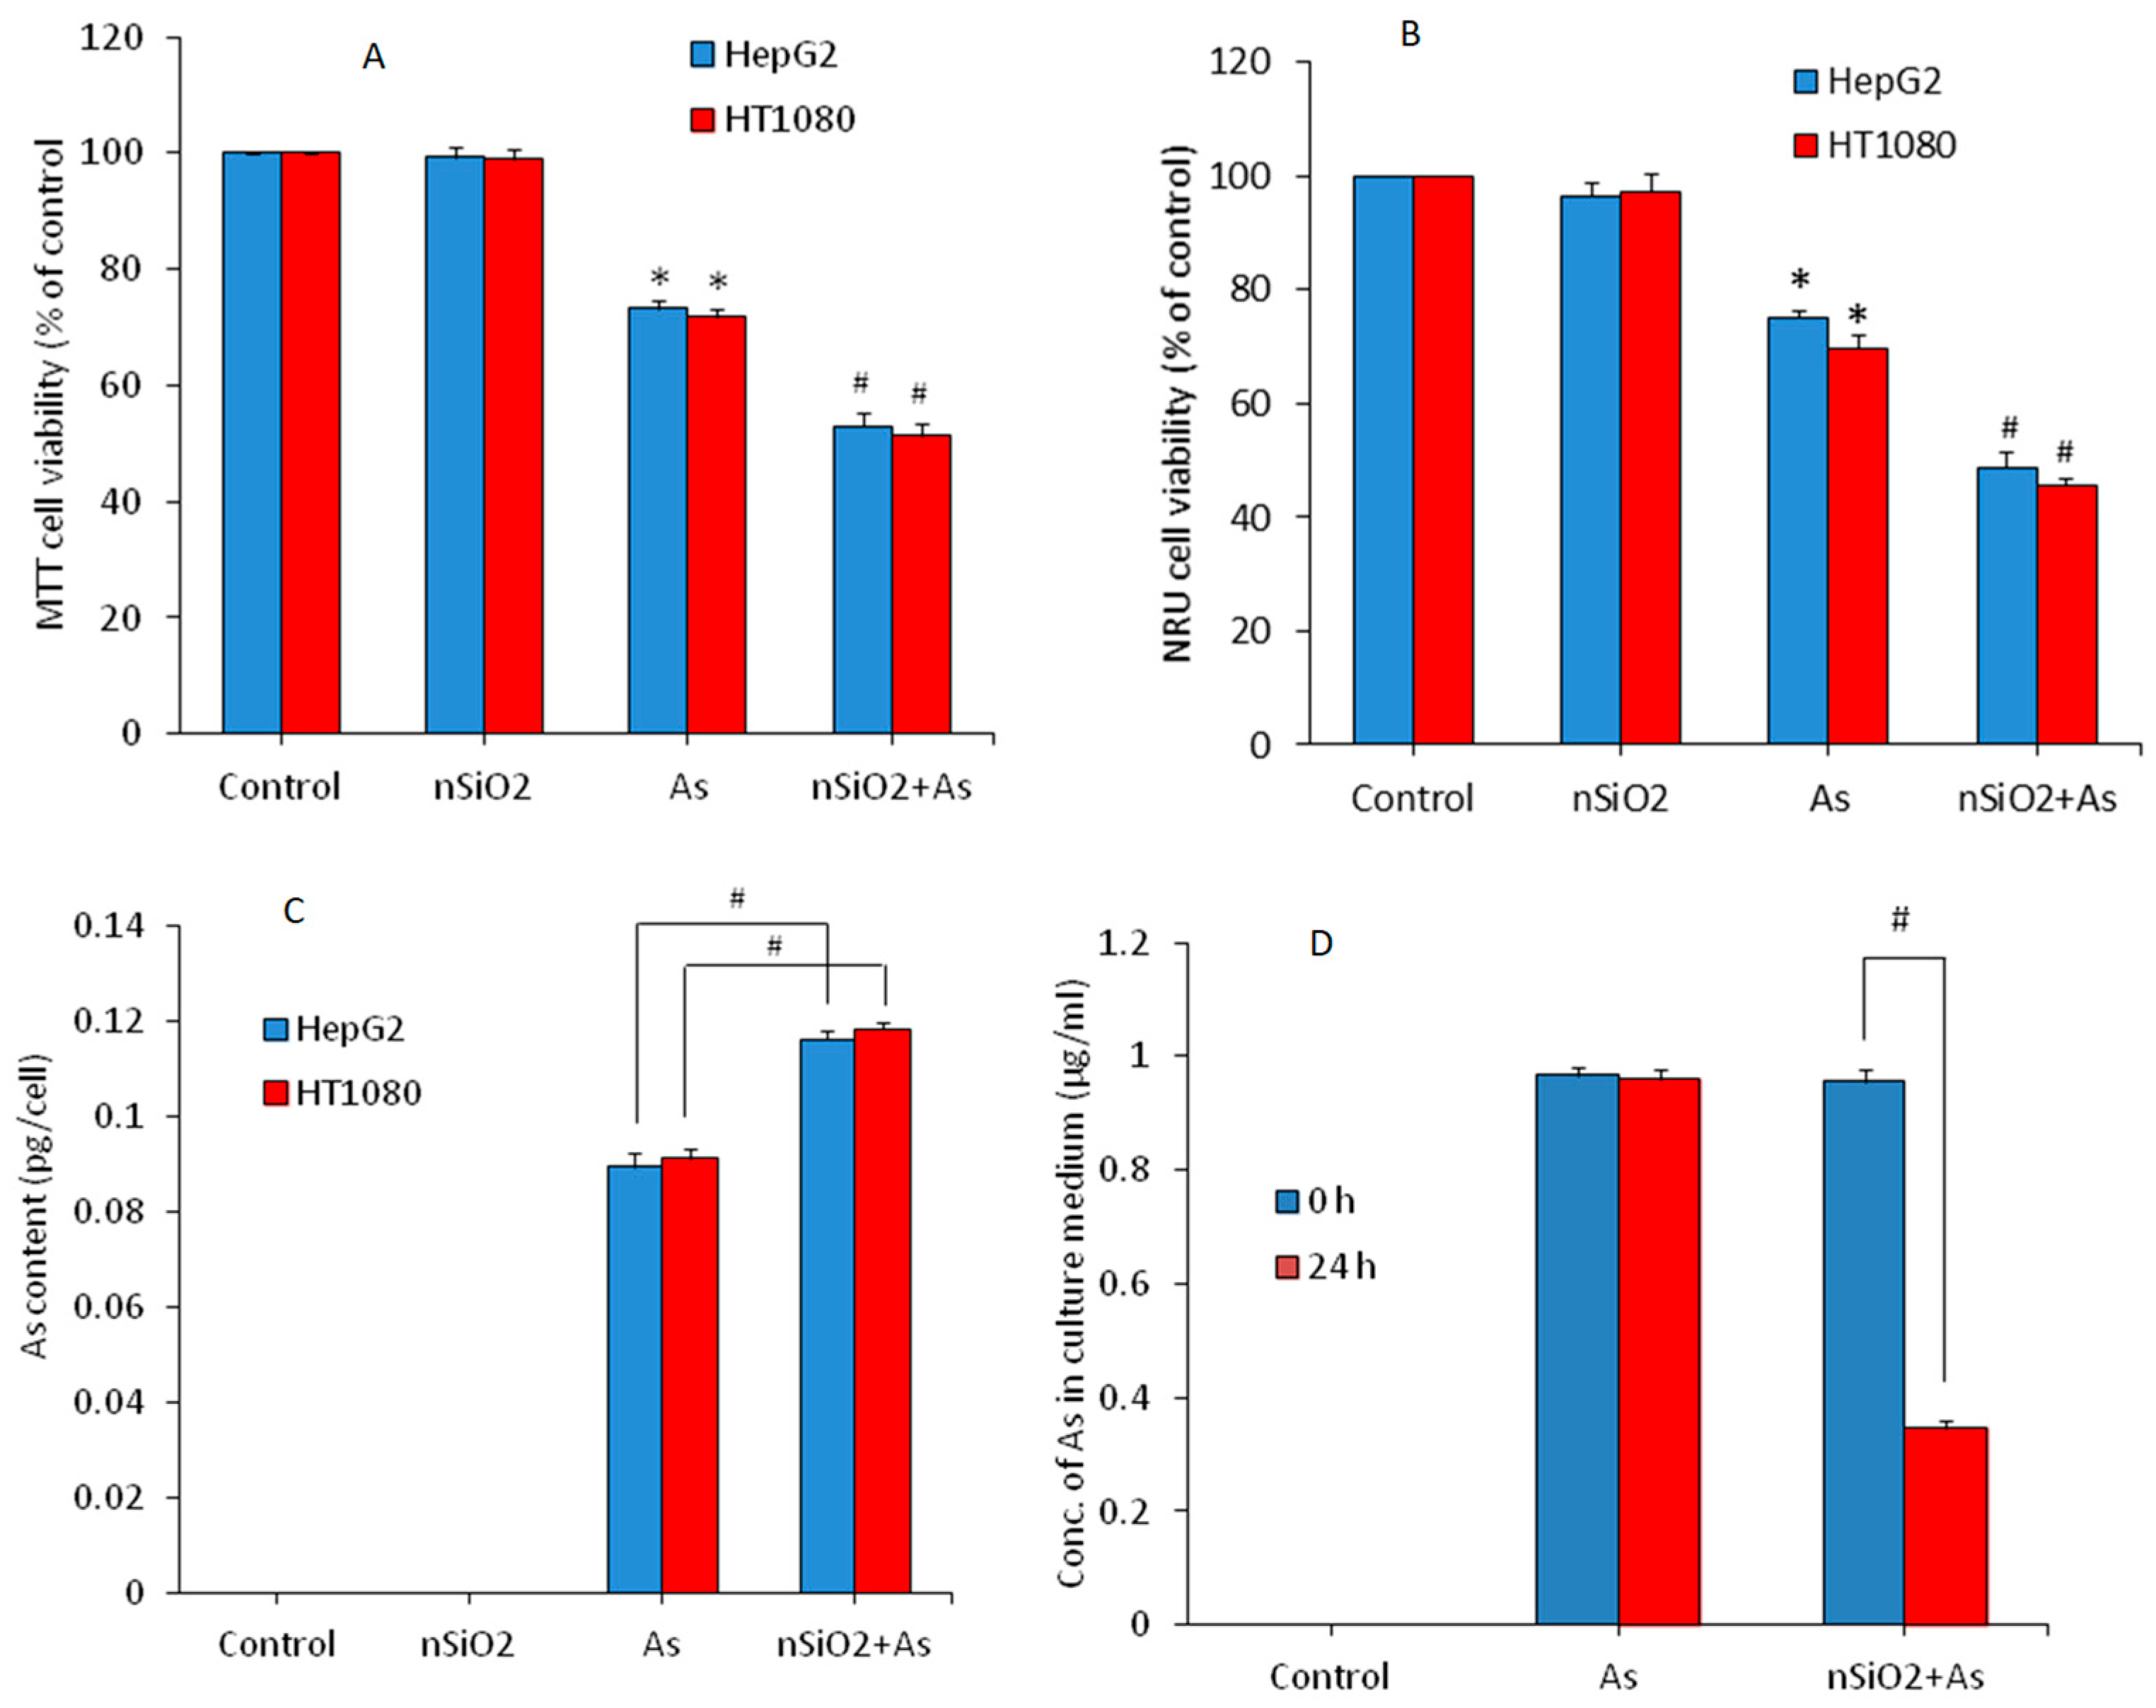
2.5. Measurement of Intracellular Level of As

Inductively coupled plasma mass spectrometry (ICP-MS) was used to determine the effect of nSiO2 on uptake of As in HepG2 and HT1080 cells. Briefly, both types of cells were exposed for 24 h to either nSiO2 (10 μg/mL), or As (1 μg/mL) or both (SiO2 + As). At the completion of exposure, cells were washed two times with phosphate buffer saline PBS and harvested. After centrifugation cell pellets were digested with nitric acid. Then, the digested solution was dissolved in 4% nitric acid for the measurement of As content using ICP-MS. The intracellular level of As was represented in picogram (pg)/cell.

2.6. Interaction of nSiO2 and As in Culture Media

Interaction of nSiO2 and As in culture medium (DMEM) was also assessed by ICP-MS. Briefly, three groups of samples were prepared; As group (1 μg/mL), co-exposure group (10 μg/mL of nSiO2 and 1 μg/mL of As) and control group (DMEM only). All the samples were incubated for 0 h and 24 h with mild shaking. High speed centrifugation was done to obtain clear supernatants. Supernatants were then digested with nitric acid (HNO3) and As content was determined by ICP-MS. Level of As adsorbed on the surface of nSiO2 was equal to decreased level of As in supernatant over 0 and 24 h.

2.7. Oxidative Stress Parameters

Several markers of oxidative stress were assessed in HepG2 and HT1080 cells exposed for 24 h to either nSiO2 (10 μg/mL), or As (1 μg/mL) or both (SiO2 + As). Dichlorofluorescin diacetate (DCFH-DA) probe was used to measure the reactive oxygen species (ROS) generation in cells as per the instruction of a previous report [31]. The DCFH-DA probe passively enters the cells and reacts with ROS to form a fluorescent compound named dichlorofluorescein (DCF). Fluorescent intensity of DCF was assessed by two distinct methods; qualitative analysis by fluorescent microscope (DMi8, Leica Microsystems, Germany) and quantitative measurement by a microplate reader (Synergy-HT, Biotek). The intracellular hydrogen peroxide (H2O2) level was assessed using a commercially available kit (Sigma-Aldrich). Malondialdehyde (MDA, a lipid peroxidation marker) was determined as per the protocol of Ohkawa et al. [35]. The intracellular level of glutathione (GSH) was determined by Ellman’s method [36] using 5, 5-dithio-bis-2-nitrobenzoic acid (DTNB). Glutathione reductase (GR) enzyme activity was assayed by recording the decrease in absorbance of nicotinamide adenine dinucleotide phosphate (NADPH) as reported by [37]. A commercial kit from Cayman Chemical Company (Michigan, OH, USA) was applied to assay the activity of superoxide dismutase (SOD) enzyme. Protocol from Sinha et al. [38] was used to assay the activity of catalase (CAT) enzyme.

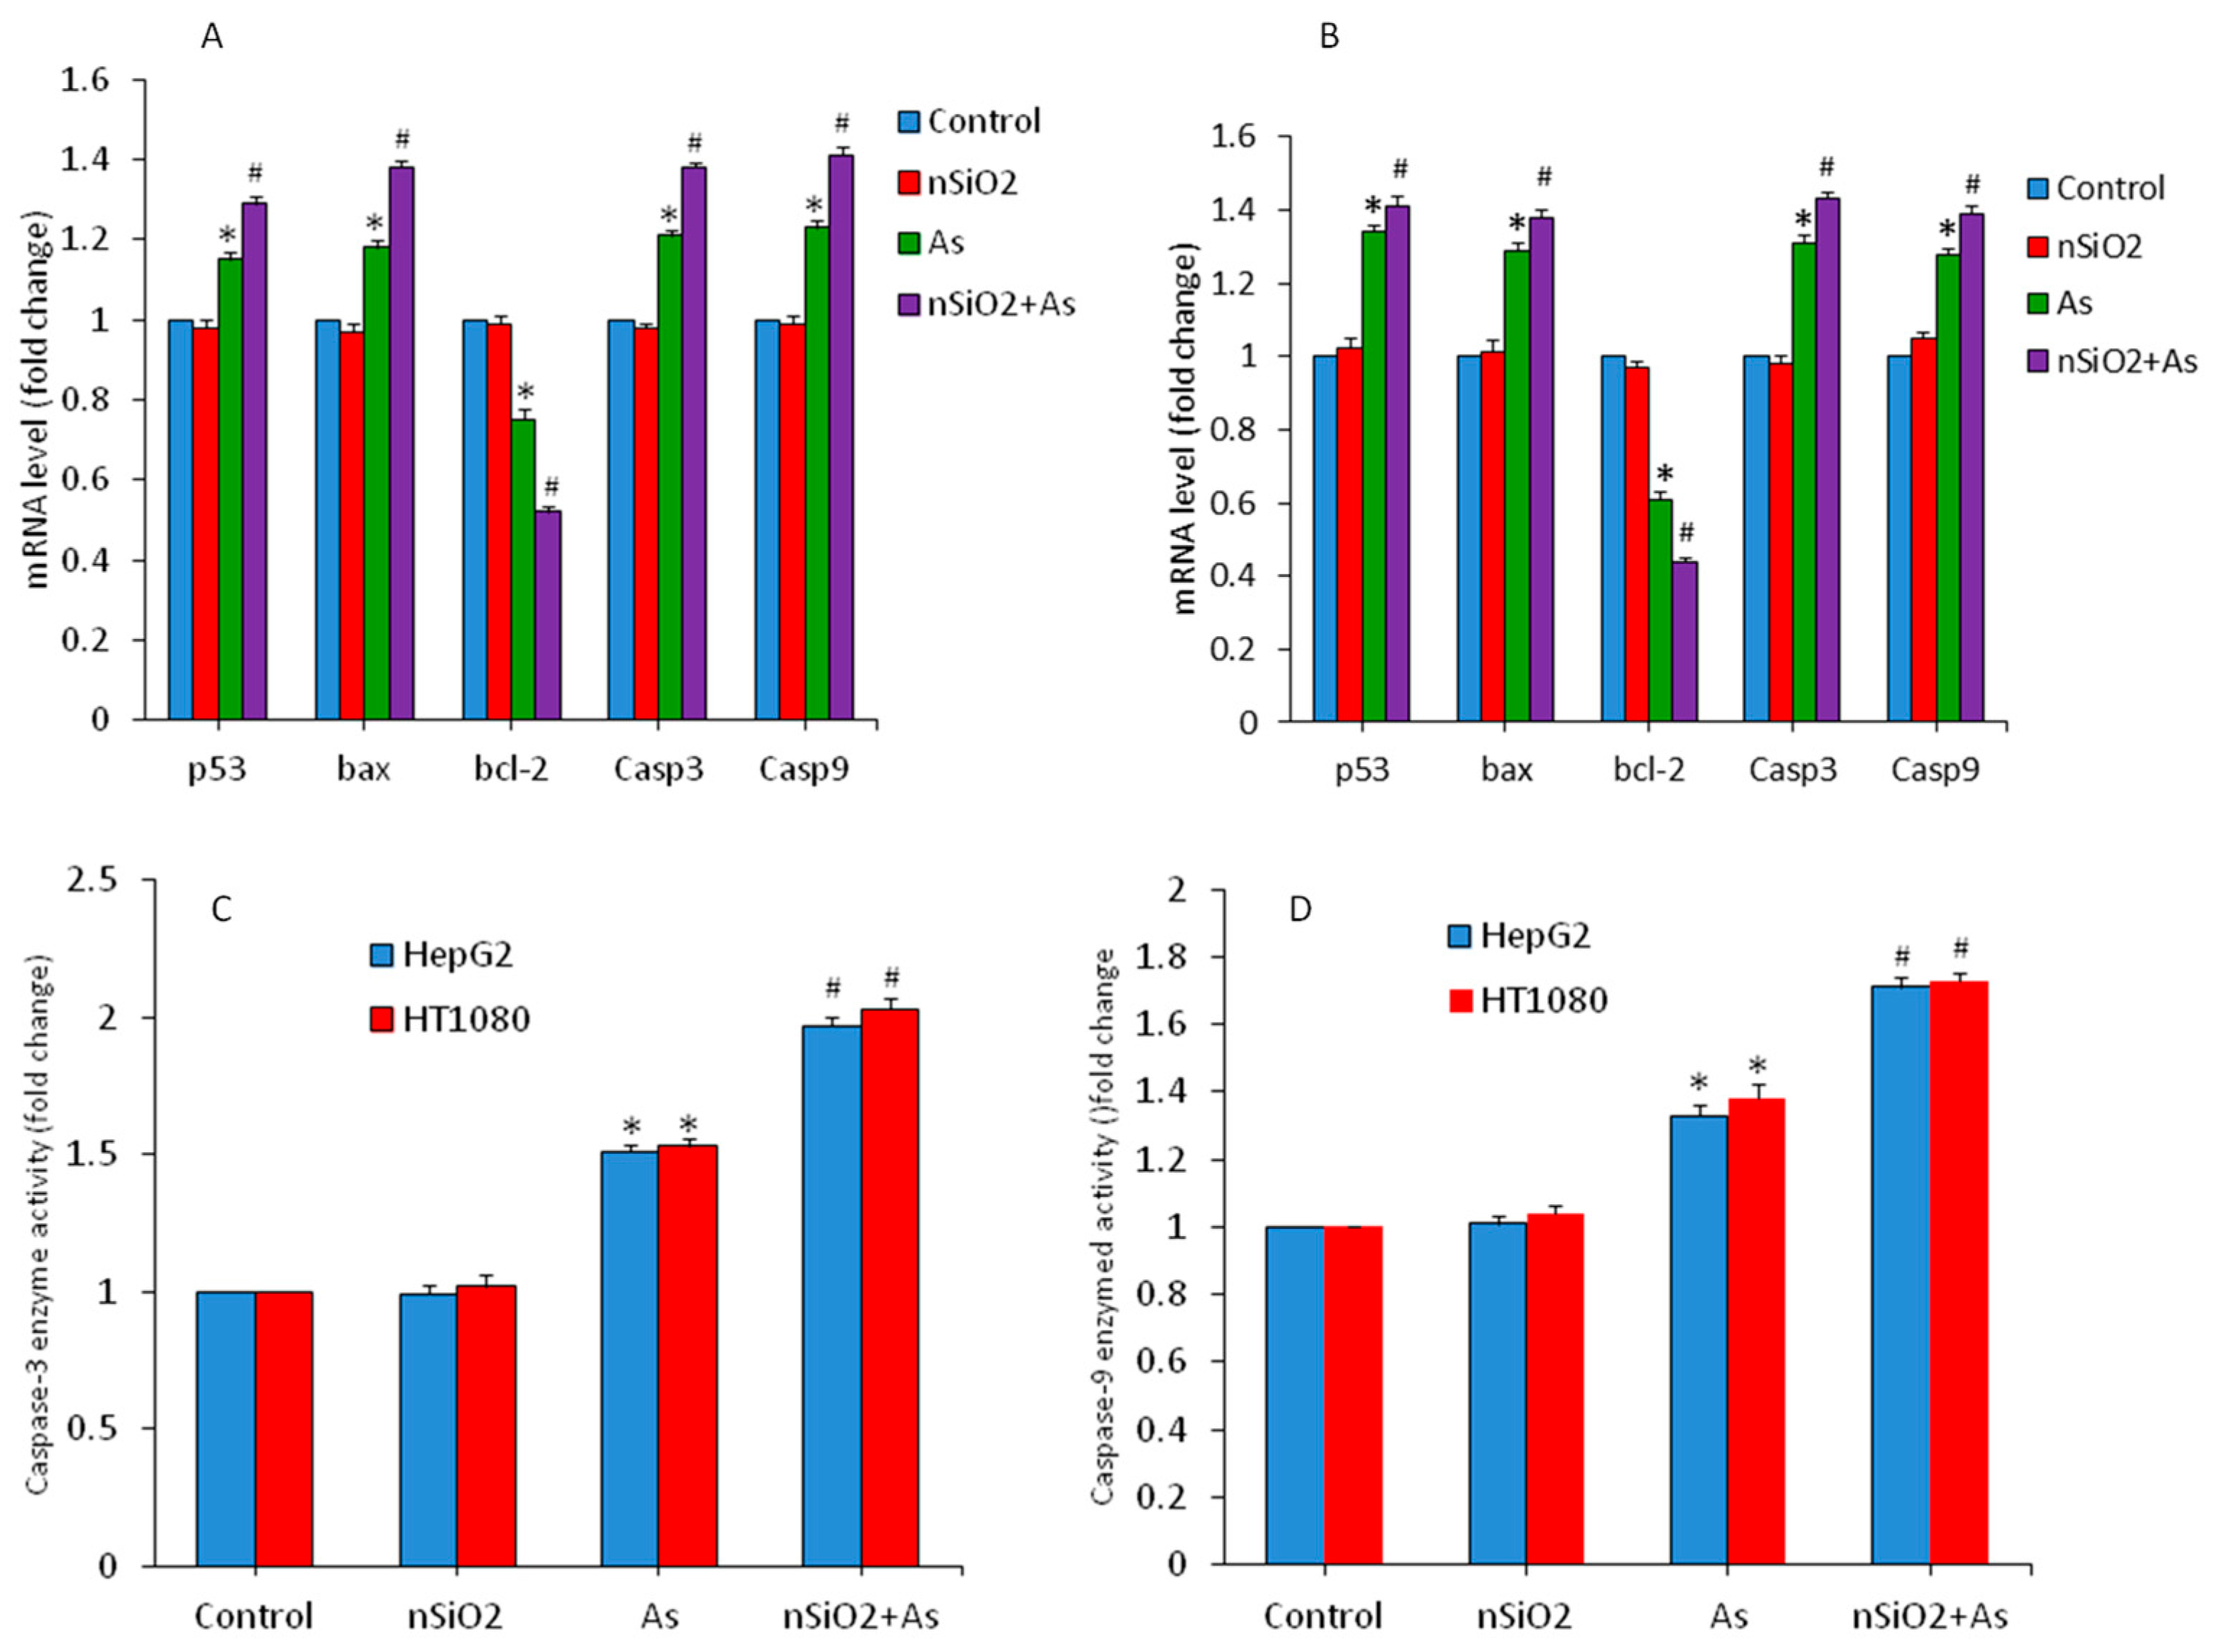
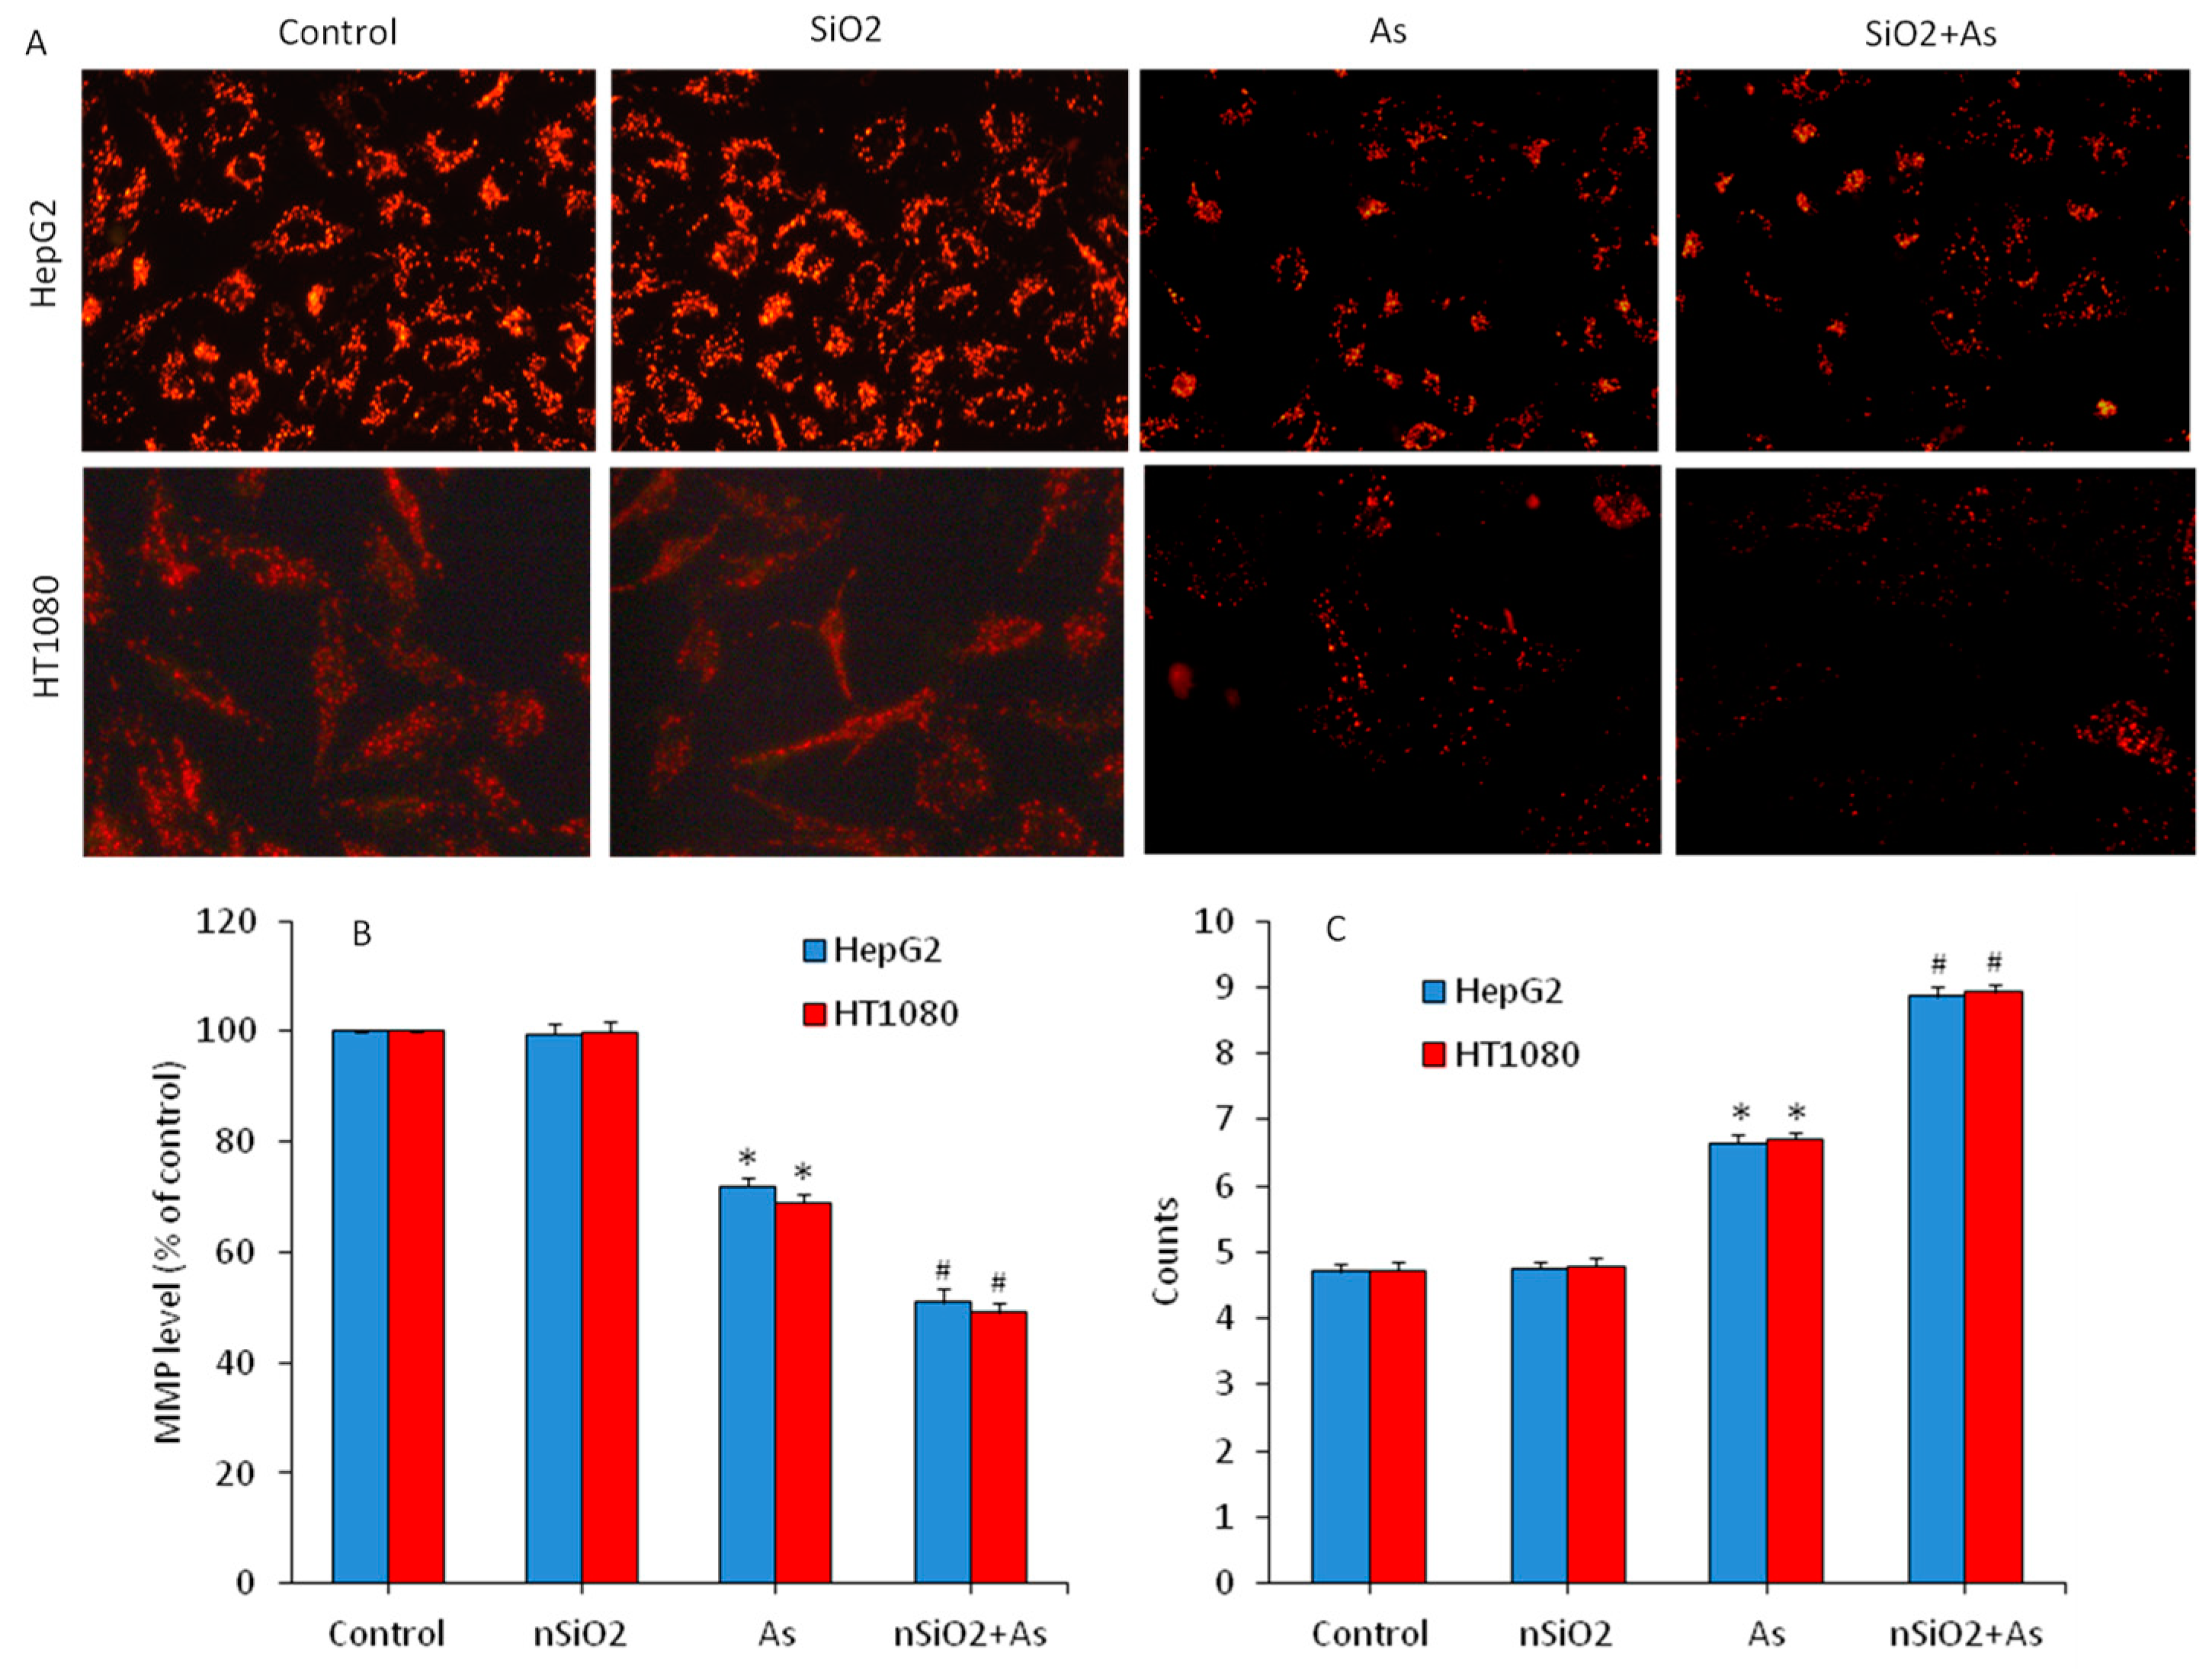
2.8. Apoptotic Markers

Combined effects of nSiO2 and As on apoptotic genes and enzymes, cell cycle and mitochondrial membrane potential (MMP) were assessed in HepG2 and HT1080 cells following 24 h treatment to either nSiO2 (10 μg/mL), or As (1 μg/mL) or both (SiO2 + As). Real-time PCR (ABI PRISM 7900HT Sequence Detection System, Applied Biosystems, Foster City, CA) was applied to examine the expression of mRNA level of apoptotic genes (p53, bax, bcl-2, casp3 and casp9) using SYBR green. Protocol and the specific set of primers sequence are reported in earlier work [34]. Activity of caspase-3 and caspase-9 enzymes was assessed using BioVision colorimetric kit (Milpitas, CA, USA). The cationic fluorochrome rhodamine-123 (Rh-123) probe was used to assess the MMP level [31]. The Rh-123 binds to the mitochondria of living cells in a membrane potential-dependent fashion. Fluorescent intensity of Rh-123 (MMP level) was determined by two distinct procedures; qualitative assessment using a fluorescent microscope (DMi8, Leica Microsystems, Germany) and quantitative analysis using a microplate reader (Synergy-HT, Biotek). A propidium iodide (PI) fluorescent probe was applied to analyze cell cycle phases using a flow cytometer (Coulter Epics XL/Xl-MCL) via F1-4 filter (585 nm) [31].

2.9. Protein Assay

Cellular protein content was assayed by Bradford’s protocol [39].

2.10. Statistics

One-way analysis of variance (ANOVA) followed by Dunnette’s multiple comparison tests were applied for the statistical analysis of results. The p < 0.05 was attributed as statistical significance. All the analyses were done utilizing the Prism software package (GraphPad Software, Version 5.0, GraphPad Software Inc., San Diego, CA, USA).

3. Results and Discussion

3.1. Characterization of nSiO2

Characterization of amorphous nSiO2 was done by XRD, SEM, TEM and energy dispersive X-ray spectroscopy (EDS) techniques. The amorphous nature of nSiO2 was confirmed by XRD (data not shown). SEM images suggested smooth surfaces of nSiO2 (Figure 1A,B). Figure 1C represents the TEM image of nSiO2. These images suggested that nSiO2 were almost spherical shaped. The mean particle size was calculated after measuring over 100 particles from the TEM image. The average particle size of nSiO2 was approximately 15 nm. Figure 1D presents the elemental composition of nSiO2 analyzed by EDS. The EDS spectra indicated that Si and O were main elemental composition in nSiO2. Elemental impurities were not detected. The presence of C and Cu peaks was due to the carbon coated Cu grid of TEM.
Zeta potential and hydrodynamic size of nSiO2 in distilled water and DMEM were determined at various time intervals (Table 1). Hydrodynamic sizes were 5–6 times higher than the size calculated from TEM. This might be due to agglomeration of particles in aqueous state [8]. Zeta potential data provide quantitative information on the dispersion and stability of particles in aqueous medium. It is reported that particles show good dispersion and stability when zeta potential values are higher than 30 mV [24,40]. In this study, nSiO2 exhibited excellent dispersion in both distilled water and culture medium as zeta potential values were more than 30 mV (Table 1).

3.2. Cytotoxicity Study

Combined cytotoxicity of nSiO2 and As was examined in HepG2 and HT1080 cells following exposure to either nSiO2 (10 μg/mL), or As (1 μg/mL) or a combination of nSiO2 + As (10 μg/mL + 1 μg/mL) for 24 h. Figure 2A shows that nSiO2 did not induce cytotoxicity, however, As significantly decreased the cell viability of both types of cells (73.2% for HepG2 and 71.8% for HT1080) in comparison to the control group (p < 0.05). Interestingly, in co-exposure group (nSiO2 + As) cytotoxicity was more pronounced (52.9% for HepG2 and 51.3% for HT1080) as compared to As group alone (p < 0.05). NRU data also showed that nSiO2 was not toxic, however, As significantly decreased the cell viability in comparison the control group (Figure 2B). Again, in the co-exposure group (nSiO2 + As), cell viability reduction was significantly higher than those of the As group alone (p < 0.05) (Figure 2B). These results suggested that non-cytotoxic dosage of nSiO2 potentiated the cytotoxic response of As in both HepG2 and HT1080 cells. Previous studies also report that non-cytotoxic concentrations of nSiO2 enhances cytotoxicity and apoptosis response of lead (Pb) in A549 cells [26,27]. Yang et al. [24] observe that exposure of nSiO2 significantly increases the cardiac toxicity of methylmercury (MeHg) in human cardiomyocytes and rat heart tissue. Besides, toxicity of As in Daphnia magna and fresh-water algae (Microcystis aeruginosa and Scenedesmus obliquus) was enhanced by TiO2 nanoparticles [20,21].
How a non-cytotoxic concentration of nSiO2 potentiated toxicity of As in HepG2 and HT1080 cells in this study was not clear at this point. Hence, we further examined the effect of nSiO2 on cellular uptake of As. An earlier report shows that nSiO2 internalizes into HepG2 cells through an endocytosis process [41]. Intracellular levels of As were measured by ICP-MS. Both the HepG2 and HT1080 cells were exposed to either nSiO2 (10 μg/mL) or As (1 μg/mL) or a combination of both (nSiO2 + As) for 24 h. Figure 2C demonstrated that the co-exposure group (nSiO2 + As) had higher intracellular As content as compared to the As group alone, suggesting that nSiO2 facilitated the cellular uptake of As in both types of cells. To confirm this, we further examined the adsorption efficiency of nSiO2 for As in culture medium without cells. Figure 2D demonstrated that most of the As present in culture media was adsorbed on the surface of nSiO2 in the co-exposure group (nSiO2 + As). This notion might explain the facilitated cellular uptake of toxic metals adsorbed on the surface of nSiO2. This could be the possible explanation behind the higher toxicity in the co-exposure group (nSiO2 + As) than those of the As group alone. Guo et al. [42] found that combined exposure of a low toxic dose of nSiO2 and Cd noticeably increases Cd accumulation in mice liver and augments the hepatotoxicity of Cd. Higher intracellular levels of MeHg in the co-exposure group (nSiO2 + MeHg) compared to cells exposed to MeHg alone is also observed [43]. Limbach et al. [44] suggest that nSiO2 act as a “Trojan horse” in cells co-exposed to manganese (Mn) or cobalt (Co).

3.3. Oxidative Stress Study

Oxidative stress is one of the potential mechanisms through which nanoparticles exert toxicity to human cells [45]. Heavy metals and metalloids also have potential to induce toxicity through the disturbance of redox homeostasis [46]. Hence, we further evaluated the combined effects of nSiO2 and As on several parameters of oxidative stress in HepG2 and HT1080 cells exposed to nSiO2 and/or As for 24 h. The ROS, H2O2 and MDA were assayed as pro-oxidant markers. Microscopic data have shown that ROS level (DCF fluorescence) in nSiO2 was not different from the control group (Figure 3A). However, DCF fluorescence intensity (ROS level) was increased in the As group compared to those of the control group. Interestingly, DCF fluorescence intensity in the co-exposure group (nSiO2 + As) was more pronounced than those of the As group alone (Figure 3A). In agreement with microscopy data, quantitative data have also shown that ROS level in the nSiO2 group was similar to the control group, but was significantly higher in As group in comparison to the control group (Figure 3B) (p < 0.05). Interestingly, ROS level was significantly increased in the co-exposure group (nSiO2 + As) in comparison to the As group alone (Figure 3B) (p < 0.05). Combined effects of nSiO2 and As were further examined through H2O2 and MDA levels. Figure 3C,D demonstrated that H2O2 and MDA levels in nSiO2 group were not different from the control group, but significantly higher in the As group. Again, H2O2 and MDA levels in the co-exposure group (nSiO2 + As) were significantly higher in comparison to the As group alone (p < 0.05). These data suggested that co-exposure of nSiO2 and As exacerbated the oxidative damage of HepG2 and HT1080 cells than those of the As exposure alone.
Equilibrium between pro-oxidants generation and their elimination by antioxidants is a very delicate phenomenon. Excessive generation of pro-oxidants or depletion of antioxidants may cause oxidative damage of cellular components [47]. Antioxidant molecules and enzymes play a crucial role in scavenging the free oxygen radicals [48]. SOD enzyme dismutates the highly reactive superoxide anion (O2) into comparatively less reactive H2O2. GSH, GR and CAT further reduce the H2O2 into water (H2O) and molecular oxygen (O2) by various mechanisms [49]. In the present study, we assessed the effects of nSiO2 and/or As on antioxidants in HepG2 and HT1080 cells. As we can see in Figure 4A–D antioxidant molecule GSH and antioxidant enzymes (GR, SOD and CAT) activity were lower in the As group in comparison to the control group (p < 0.05). Interestingly, cells co-exposed to nSiO2 and As showed significantly higher reduction in antioxidant levels than cells exposed to As alone (Figure 4) (p < 0.05). Overall, these results showed increased ROS, H2O2 and MDA along with decreased GSH, GR, SOD and CAT, suggesting higher oxidative stress after combined exposure of nSiO2 and As in comparison to As group alone.
There are increasing evidences that nSiO2 might enhance the oxidative stress mediated toxicity of other chemicals or environmental pollutants. Guo et al. [42] observed that nSiO2 significantly enhances Cd-induced oxidative damage in mice liver. Yu et al. [43] observe synergistic toxicity of nSiO2 and MeHg on oxidative stress markers (ROS generation, lipid peroxidation and depletion of antioxidants) in A549 cells. Co-exposure of 70 nm nSiO2 (SP70) to mice potentiate the oxidative stress mediated hepatotoxicity of acetaminophen and tetracycline [50]. Combined exposure of nSiO2 and benzo(a)pyrene enhance the MDA content and reduce the SOD and glutathione peroxidase in human BEAS-2B cells [23].

3.4. Apoptosis Study

Apoptosis (programmed cell death) is regulated by a number of genes [51]. Free oxygen radicals such as the superoxide anion (Ȯ) serves as signaling molecules in the apoptotic process [52]. Antioxidant GSH has been linked with a large panel of actions controlling gene expression and apoptotic pathways [53]. Studies have shown that nSiO2 is able to induce mitochondria mediated apoptosis [6,9,54]. As is also known for apoptosis induction through free oxygen radical generation [55,56]. Hence, we examined the effects of nSiO2 and/or As on the regulation of several apoptotic genes (p53, bax, bcl-2, casp3 and casp9) in HepG2 and HT1080 cells. We observed that that nSiO2 did not change the regulation of these apoptotic genes. However, As exposure increased the mRNA expression of p53 (tumor suppresser) and bax (pro-apoptotic) genes, while decreased the expression of the bcl-2 gene (anti-apoptotic) in comparison to the control group (Figure 5A,B) (p < 0.05). Moreover, apoptotic genes caspase-3 and caspase-9 were also up-regulated in As treated cells. Interestingly, apoptotic responses were more pronounced in the co-exposure group (SiO2 + As) than those of As group alone.
Activity of caspase-3 and caspase-9 enzymes was further examined to confirm the mRNA results. We found that activity of these apoptotic enzymes were significantly higher in the As group in comparison to the control group. Again, in co-exposure group activity of caspase-3 and caspase-9 enzymes were significantly higher than those in the As group alone. (Figure 5C,D). Hence, non-cytotoxic concentration of nSiO2 increased the severity of As on the altered regulation of apoptotic genes. Yang et al. [24] demonstrated that up-regulation of pro-apoptotic proteins e.g., bax, caspase-3 and caspase-9 and down-regulation of anti-apoptotic protein bcl-2 due to MeHg were aggravated by nSiO2 exposure in cardiac cells and tissues.
Decreased mitochondrial membrane potential (MMP) is also linked with apoptotic cell death [54,57]. We further evaluated the MMP level in HepG2 and HT1080 cells exposed for 24 to nSiO2 and/ or As. Figure 6A showed that fluorescent intensity of Rh-123 (indicator of MMP level) in the nSiO2 group was almost similar to the control group. However, the MMP level was significantly decreased due to As exposure (p < 0.05). Moreover, MMP depletion in the co-exposure group (nSiO2 + As) was more pronounced as compared to the As group alone (p < 0.05). Similar to microscopy data, quantitative analysis also demonstrated that MMP level in the nSiO2 group was not different from the control group (Figure 6B) but significantly decreased in the As group. Again, MMP loss in the co-exposure group (nSiO2 + As) was more pronounced than those of the As group alone (p < 0.05) (Figure 6B). A recent study shows that the non-cytotoxic concentration of nSiO2 significantly aggravates Pb-induced up-regulation of bax, caspase-3 and caspase-9 proteins, and down-regulation of bcl-2 protein along with MMP loss in human lung (A549) cells [27].
At the end we explored the effects of nSiO2 and/or As exposure on cell cycle phases of HepG2 and HT1080 cells. It is known that cells with damaged DNA accumulate in G1 (gap1), S (DNA synthesis), or G2/M (gap2/mitosis) phases. However, cells with irreversibly damaged DNA get eliminated through programmed cell death (apoptosis) by accumulating in the subG1 phase. Our flow cytometer analysis showed that cell cycle progression in the nSiO2 group was similar to the control group. However, As-induced apoptosis in both HepG2 and HT1080 cells (Figure 6C). In As group, cell gathering in SubG1 phase was significantly higher (6.65% of HepG2 and 6.71% of HT1080) in comparison the control group (4.71% of GepG2 and 4.73% of HT1080) (p < 0.05). Intriguingly, due to combined exposure of nSiO2 and As the gathering of cells in SubG1 phase was significantly higher (8.86% of HepG2 and 8.93% of HT1080) than those of the As group alone (Figure 6C) (p < 0.05). Altogether, these results demonstrated that non-cytotoxic concentration of nSiO2 exposure alone did not provoke apoptosis in both HepG2 and HT1080 cells, but effectively exacerbated mitochondrial mediated apoptosis when co-exposed with As.

4. Conclusions

We explored the combined effects of nSiO2 and As in human liver cells (HepG2) and human fibroblasts (HT1080). Results demonstrated that nSiO2 were not toxic, however, As significantly caused toxicity to both types of cells. Interestingly, non-cytotoxic concentration of nSiO2 significantly augmented the toxic effects of As. Co-exposure of nSiO2 and As caused cell viability reduction, generation of pro-oxidants (ROS, H2O2 and MDA) and depletion of antioxidants (GSH, GR, SOD and CAT). Combined exposure of nSiO2 and As induced apoptosis through changing the regulation of apoptotic genes and cell cycle phases along with MMP depletion. Augmentation of As-induced toxicity by nSiO2 may be due to specific properties of nSiO2 as a carrier, which facilitated cellular entry of As. This study warrants future work to explore the co-exposure effects of nSiO2 and As in a suitable animal model in order to provide more insights into molecular mechanisms involved in their combined toxicity.

Author Contributions

Conceptualization, M.A.; investigation and methodology, M.A., M.J.A. and H.A.A.; writing—original draft preparation, M.A.; writing—review and editing, M.A. and M.J.A.; funding acquisition, M.A.

Funding

The authors would like to extend their sincere appreciation to the Deanship of Scientific Research at King Saud University for funding this work through research group no. RG-1439-72.

Conflicts of Interest

The authors declare no conflict of interest.

References

  1. Napierska, D.; Thomassen, L.C.; Rabolli, V.; Lison, D.; Gonzalez, L.; Kirsch-Volders, M.; Martens, J.A.; Hoet, P.H. Size-dependent cytotoxicity of monodisperse silica nanoparticles in human endothelial cells. Small 2009, 5, 846–853. [Google Scholar] [CrossRef] [PubMed]
  2. Lee, S.; Yun, H.S.; Kim, S.H. The comparative effects of mesoporous silica nanoparticles and colloidal silica on inflammation and apoptosis. Biomaterials 2011, 32, 9434–9443. [Google Scholar] [CrossRef] [PubMed]
  3. Li, Z.; Barnes, J.C.; Bosoy, A.; Stoddart, J.F.; Zink, J.I. Mesoporous silica nanoparticles in biomedical applications. Chem. Soc. Rev. 2012, 41, 2590–2605. [Google Scholar] [CrossRef] [PubMed]
  4. Saxena, A.; Srivastava, A.K.; Singh, B.; Goyal, A. Removal of sulphur mustard, sarin and simulants on impregnated silica nanoparticles. J. Hazard. Mater. 2012, 211, 226–232. [Google Scholar] [CrossRef] [PubMed]
  5. Argyo, C.; Weiss, V.; Bräuchle, C.; Bein, T. Multifunctional mesoporous silica nanoparticles as a universal platform for drug delivery. Chem. Mater. 2013, 26, 435–451. [Google Scholar] [CrossRef]
  6. Ahmad, J.; Ahamed, M.; Akhtar, M.J.; Alrokayan, S.A.; Siddiqui, M.A.; Musarrat, J.; Al-Khedhairy, A.A. Apoptosis induction by silica nanoparticles mediated through reactive oxygen species in human liver cell line HepG2. Toxicol. Appl. Pharmacol. 2012, 259, 160–168. [Google Scholar] [CrossRef]
  7. Liu, T.; Li, L.; Fu, C.; Liu, H.; Chen, D.; Tang, F. Pathological mechanisms of liver injury caused by continuous intraperitoneal injection of silica nanoparticles. Biomaterials 2012, 33, 2399–2407. [Google Scholar] [CrossRef]
  8. Ahamed, M.; Khan, M.A.M.; Akhtar, M.J.; Alhadlaq, H.A.; Alshamsan, A. Role of Zn doping in oxidative stress mediated cytotoxicity of TiO2 nanoparticles in human breast cancer MCF-7 cells. Sci. Rep. 2016, 6, 30196. [Google Scholar] [CrossRef] [Green Version]
  9. Ahamed, M. Silica nanoparticles-induced cytotoxicity, oxidative stress and apoptosis in cultured A431 and A549 cells. Hum. Exp. Toxicol. 2013, 32, 186–195. [Google Scholar] [CrossRef]
  10. Gilardino, A.; Catalano, F.; Ruffinatti, F.A.; Alberto, G.; Nilius, B.; Antoniotti, S. Interaction of SiO2 nanoparticles with neuronal cells: Ionic mechanisms involved in the perturbation of calcium homeostasis. Int. J. Biochem. Cell Biol. 2015, 66, 101–111. [Google Scholar] [CrossRef]
  11. Guo, C.; Yang, M.; Jing, L.; Wang, J.; Yu, Y.; Li, Y. Amorphous silica nanoparticles trigger vascular endothelial cell injury through apoptosis and autophagy via reactive oxygen species-mediated MAPK/Bcl-2 and PI3K/Akt/mTOR signaling. Int. J. Nanomed. 2016, 11, 5257–5276. [Google Scholar] [CrossRef] [PubMed]
  12. Du, Z.; Zhao, D.; Jing, L.; Cui, G.; Jin, M.; Li, Y. Cardiovascular toxicity of different sizes amorphous silica nanoparticles in rats after intratracheal instillation. Cardiovasc. Toxicol. 2013, 13, 194–207. [Google Scholar] [CrossRef] [PubMed]
  13. Yang, M.; Jing, L.; Wang, J.; Yu, Y.; Cao, L.; Zhang, L. Macrophages participate in local and systemic inflammation induced by amorphous silica nanoparticles through intratracheal instillation. Int. J. Nanomedicine 2016, 11, 6217–6228. [Google Scholar] [CrossRef] [PubMed]
  14. Kumari, B.; Kumar, V.; Sinha, A.K.; Ahsan, J.; Ghosh, A.K.; Wang, H.P. Toxicology of arsenic in fish and aquatic systems. Environ. Chem. Lett. 2017, 15, 43–64. [Google Scholar] [CrossRef]
  15. Agency for Toxic Substances and Disease Registry (ATSDR). The ATSDR 2015 Priority List of Hazardous Substances. Atlanta, GA, USA. Available online: https://www.atsdr.cdc.gov/SPL/ (accessed on 31 July 2019).
  16. Ober, J.E.; US Geological Survey. Mineral Commodity Summaries; Reston, VA, USA, 2018. Available online: https://www.usgs.gov/centers/nmic/mineral-commodity-summaries (accessed on 31 July 2019).
  17. Flora, S.J. Arsenic-induced oxidative stress and its reversibility. Free Radic. Biol. Med. 2011, 51, 257–281. [Google Scholar] [CrossRef] [PubMed]
  18. Sharma, V.K.; Sohn, M. Aquatic arsenic: Toxicity, speciation, transformations, and remediation. Environ. Int. 2009, 35, 743–759. [Google Scholar] [CrossRef] [PubMed]
  19. Zhang, J.Y.; Ni, Y.Y.; Ding, T.D.; Zhang, C. The role of humic acid in the toxicity of arsenite to the diatom Navicula sp. Environ. Sci. Pollut. Res. Int. 2014, 21, 4365–4366. [Google Scholar] [CrossRef] [PubMed]
  20. Fan, W.; Liang, D.; Wang, X.; Ren, J.; Xiao, S.; Zhou, T. Two-generational effects and recovery of arsenic and arsenate on Daphnia magna in the presence of nano-TiO2. Ecotoxicol. Environ. Saf. 2019, 172, 136–143. [Google Scholar] [CrossRef]
  21. Luo, Z.; Wang, Z.; Yan, Y.; Li, J.; Yan, C.; Xing, B. Titanium dioxide nanoparticles enhance inorganic arsenic bioavailability and methylation in two freshwater algae species. Environ. Pollut. 2018, 238, 631–637. [Google Scholar] [CrossRef]
  22. Deng, R.; Lin, D.; Zhu, L.; Majumdar, S.; White, J.C.; Gardea-Torresdey, J.L.; Xing, B. Nanoparticle interactions with co-existing contaminants: Joint toxicity, bioaccumulation and risk. Nanotoxicology 2017, 11, 591–612. [Google Scholar] [CrossRef]
  23. Wu, J.; Shi, Y.; Asweto, C.O.; Feng, L.; Yang, X.; Zhang, Y.; Hu, H.; Duan, J.; Sun, Z. Co-exposure to amorphous silica nanoparticles and benzo[a]pyrene at low level in human bronchial epithelial BEAS-2B cells. Environ. Sci. Pollut. Res. 2016, 23, 23134–23144. [Google Scholar] [CrossRef] [PubMed]
  24. Yang, X.; Feng, L.; Zhang, Y.; Hu, H.; Shi, Y.; Liang, S.; Zhao, T.; Cao, L.; Duan, J.; Sun, Z. Co-exposure of silica nanoparticles and methylmercury induced cardiac toxicity in vitro and in vivo. Sci. Total Environ. 2018, 631–632, 811–821. [Google Scholar] [CrossRef] [PubMed]
  25. Feng, L.; Yang, X.; Shi, Y.; Liang, S.; Zhao, T.; Duan, J.; Sun, Z. Co-exposure subacute toxicity of silica nanoparticles and lead acetate on cardiovascular system. Int. J. Nanomedicine 2018, 13, 7819–7834. [Google Scholar] [CrossRef] [PubMed]
  26. Lu, C.F.; Yuan, X.Y.; Li, L.Z.; Zhou, W.; Zhao, J.; Wang, Y.M.; Peng, S.Q. Combined exposure to nano-silica and lead induced potentiation of oxidative stress and DNA damage in human lung epithelial cells. Ecotoxicol. Environ. Saf. 2017, 122, 537–544. [Google Scholar] [CrossRef] [PubMed]
  27. Lu, C.F.; Li, L.Z.; Zhou, W.; Zhao, J.; Wang, Y.M.; Peng, S.Q. Silica nanoparticles and lead acetate co-exposure triggered synergistic cytotoxicity in A549 cells through potentiation of mitochondria-dependent apoptosis induction. Environ. Toxicol. Pharmacol. 2017, 52, 114–120. [Google Scholar] [CrossRef]
  28. Smedley, P.L.; Kinniburgh, D.G. A review of the source, behaviour and distribution of arsenic in natural waters. Appl. Geochem. 2002, 17, 517–568. [Google Scholar] [CrossRef] [Green Version]
  29. Liu, J.; Waalkes, M.P. Liver is a Target of Arsenic Carcinogenesis. Toxicol. Sci. 2008, 105, 24–32. [Google Scholar] [CrossRef] [Green Version]
  30. Xie, G.; Sun, J.; Zhong, G.; Shi, L.; Zhang, D. Biodistribution and toxicity of intravenously administered silica nanoparticles in mice. Arch. Toxicol. 2010, 84, 183–190. [Google Scholar] [CrossRef]
  31. Siddiqui, M.A.; Alhadlaq, H.A.; Ahmad, J.; Al-Khedhairy, A.A.; Musarrat, J.; Ahamed, M. Copper oxide nanoparticles induced mitochondria mediated apoptosis in human hepatocarcinoma cells. PLoS ONE 2013, 8, e69534. [Google Scholar] [CrossRef]
  32. Akhtar, M.J.; Ahamed, M.; Alhadlaq, H.A.; Khan, M.A.M.; Alrokayan, S.A. Glutathione replenishing potential of CeO2 nanoparticles in human breast and fibrosarcoma cells. J. Colloid Interf. Sci. 2015, 453, 21–27. [Google Scholar] [CrossRef]
  33. Arakha, M.; Roy, J.; Nayak, P.S.; Mallick, B.; Jha, S. Zinc oxide nanoparticle energy band gap reduction triggers the oxidative stress resulting into autophagy-mediated apoptotic cell death. Free Radic. Biol. Med. 2017, 110, 42–53. [Google Scholar] [CrossRef] [PubMed]
  34. Ahamed, M.; Akhtar, M.J.; Siddiqui, M.A.; Ahmad, J.; Musarrat, J.; Al-Khedhairy, A.A.; AlSalhi, M.S.; Alrokayan, S.A. Oxidative stress mediated apoptosis induced by nickel ferrite nanoparticles in cultured A549 cells. Toxicology 2011, 283, 101–108. [Google Scholar] [CrossRef] [PubMed]
  35. Ohkawa, H.; Ohishi, N.; Yagi, K. Assay for lipid peroxides in animal tissues by thiobarbituric acid reaction. Anal. Biochem. 1979, 95, 351–358. [Google Scholar] [CrossRef]
  36. Ellman, G.I. Tissue sulfhydryl groups. Arch. Biochem. Biophys. 1959, 82, 70–77. [Google Scholar] [CrossRef]
  37. Carlberg, I.; Mannervik, B. Glutathione reductase. Methods Enzymol. 1985, 113, 484–490. [Google Scholar] [PubMed]
  38. Sinha, A.K. Colorimetric assay of catalase. Anal. Biochem. 1972, 47, 389–394. [Google Scholar] [CrossRef]
  39. Bradford, M.M. A rapid and sensitive method for the quantitation of microgram quantities of protein utilizing the principle of protein-dye binding. Anal. Biochem. 1976, 72, 248–254. [Google Scholar] [CrossRef]
  40. Jiang, J.; Oberdörster, G.; Biswas, P. Characterization of size, surface charge, and agglomeration state of nanoparticle dispersions for toxicological studies. J. Nanopart. Res. 2009, 11, 77–89. [Google Scholar] [CrossRef]
  41. Sun, L.; Li, Y.; Liu, X.; Jin, M.; Zhang, L.; Du, Z.; Guo, C.; Huang, P.; Sun, Z. Cytotoxicity and mitochondrial damage caused by silica nanoparticles. Toxicol. Vitr. 2011, 25, 1619–1629. [Google Scholar] [CrossRef] [PubMed]
  42. Guo, M.; Xu, X.; Yan, X.; Wang, S.; Gao, S.; Zhu, S. In vivo biodistribution and synergistic toxicity of silica nanoparticles and cadmium chloride in mice. J. Hazard. Mater. 2013, 260, 780–788. [Google Scholar] [CrossRef]
  43. Yu, Y.; Duan, J.; Li, Y.; Yu, Y.; Jin, M.; Li, C.; Wang, Y.; Sun, Z. Combined toxicity of amorphous silica nanoparticles and methylmercury to human lung epithelial cells. Ecotoxicol. Environ. Saf. 2015, 112, 144–152. [Google Scholar] [CrossRef]
  44. Limbach, L.K.; Wick, P.; Manser, P.; Robert, N.; Bruinink, A.; Stark, W.J. Exposure of engineered nanoparticles to human lung epithelial cells: Influence of chemical composition and catalytic activity on oxidative stress. Environ. Sci. Technol. 2007, 41, 158–4163. [Google Scholar] [CrossRef] [PubMed]
  45. Akhtar, M.J.; Ahamed, M.; Alhadlaq, H.A.; Alshamsan, A. Mechanism of ROS scavenging and antioxidant signalling by redox metallic and fullerene nanomaterials: Potential implications in ROS associated degenerative disorders. Biochim. Biophys. Acta Gen. Subj. 2017, 1861, 802–813. [Google Scholar] [CrossRef] [PubMed]
  46. Zhang, Z.; Kumar, P.P.; Son, Y.O.; Kim, D.; Shi, X. Role of reactive oxygen species in arsenic-induced transformation of human lung bronchial epithelial (BEAS-2B) cells. Biochem. Biophys. Re.s Commun. 2015, 456, 643–648. [Google Scholar] [CrossRef]
  47. Carocho, M.; Ferreira, I.R. A review on antioxidants, prooxidants and related controversy: Natural and synthetic compounds, screening and analysis methodologies and future perspectives. Food Chem. Toxicol. 2013, 51, 15–25. [Google Scholar] [CrossRef] [PubMed]
  48. McGarry, T.; Biniecka, M.; Veale, D.J.; Fearon, U. Hypoxia, oxidative stress and inflammation. Free Radic. Biol. Med. 2018, 125, 15–24. [Google Scholar] [CrossRef]
  49. Alhadlaq, H.A.; Akhtar, M.J.; Ahamed, M. Different cytotoxic and apoptotic responses of MCF-7 and HT1080 cells to MnO2 nanoparticles are based on similar mode of action. Toxicology 2019, 411, 71–80. [Google Scholar] [CrossRef]
  50. Li, X.; Kondoh, M.; Watari, A.; Hasezaki, T.; Isoda, K.; Tsutsumi, Y.; Yagi, K. Effect of 70-nm silica particles on the toxicity of acetaminophen, tetracycline, trazodone, and 5-aminosalicylic acid in mice. Pharmazie 2011, 66, 282–286. [Google Scholar] [PubMed]
  51. Ola, M.S.; Nawaz, M.; Ahsan, H. Role of Bcl-2 family proteins and caspases in the regulation of apoptosis. Mol. Cell. Biochem. 2011, 351, 41–58. [Google Scholar] [CrossRef]
  52. Franco, R.; Cidlowsk, J.A. Apoptosis and glutathione: Beyond an antioxidant. Cell Death Differ. 2009, 16, 1303–1314. [Google Scholar] [CrossRef]
  53. Circu, M.L.; Aw, T.Y. Reactive oxygen species, cellular redox systems, and apoptosis. Free Radic. Biol. Med. 2010, 48, 749–762. [Google Scholar] [CrossRef] [PubMed] [Green Version]
  54. Zuo, D.; Duan, Z.; Jia, Y.; Chu, T.; He, Q.; Yuan, J.; Dai, W.; Li, Z.; Xing, L.; Wu, Y. Amphipathic silica nanoparticles induce cytotoxicity through oxidative stress mediated and p53 dependent apoptosis pathway in human liver cell line HL-7702 and rat liver cell line BRL-3A. Colloids Surf. B Biointerfaces 2016, 145, 232–240. [Google Scholar] [CrossRef] [PubMed]
  55. Roy, S.; Narzary, B.; Ray, A.; Bordoloi, M. Arsenic-induced instrumental genes of apoptotic signal amplification in death-survival interplay. Cell Death Discov. 2016, 2, 16078. [Google Scholar] [CrossRef] [Green Version]
  56. Cordero, H.; Morcillo, P.; Martínez, S.; Meseguer, J.; Pérez-Sirvent, C.; Chaves-Pozo, E.; Martínez-Sanchez, M.J.; Cuesta, A.; Ángeles-Esteban, M. Inorganic arsenic causes apoptosis cell death and immunotoxicity on European sea bass (Dicentrarchus labrax). Mar. Pollut. Bull. 2018, 128, 324–332. [Google Scholar] [CrossRef] [PubMed]
  57. Sharma, V.; Anderson, D.; Dhawan, A. Zinc oxide nanoparticles induce oxidative DNA damage and ROS-triggered mitochondria mediated apoptosis in human liver cells (HepG2). Apoptosis 2012, 17, 852–870. [Google Scholar] [CrossRef] [PubMed]
Figure 1. Characterization of nSiO2. (A,B) SEM images of nSiO2. (C) TEM image of nSiO2. (D) Elemental composition of nSiO2 analyzed by energy dispersive X-ray spectroscopy (EDS).
Ijerph 16 03199 g001
Figure 2. Cytotoxicity of HepG2 and HT1080 cells exposed for 24 h to silica nanoparticles (nSiO2) (10 µg/mL), As (1 µg/mL) or SiO2 + As (10 µg/mL + 1 µg/mL). (A) 3-(4, 5-dimethylthiazol-2-yl)-2, 5-diphenyltetrazoliumbromide (MTT) assay. (B) Neutral red uptake (NRU) assay. (C) Intracellular level of As in HepG2 and HT1080 cells exposed to nSiO2 (10 µg/mL), As (1 µg/mL) or SiO2 + As (10 µg/mL + 1 µg/mL) for 24 h. (D) Adsorption of As on the surface of nSiO2 in culture medium. Data are presented as the mean ± SD of three independent experiments (n = 3). * indicates significant effect in comparison to the control group (p < 0.05). # indicates significant effect in comparison to nSiO2 group alone or As group alone (p < 0.05).
Ijerph 16 03199 g002
Figure 3. Pro-oxidant levels in HepG2 and HT1080 cells exposed for 24 h to nSiO2 (10 µg/mL), As (1 µg/mL) or SiO2 + As (10 µg/mL + 1 µg/mL) for 24 h. (A) Fluorescent microscopic images of intracellular reactive oxygen species (ROS) level. (B) Quantitative level of intracellular ROS level. (C) Intracellular H2O2 level. (D) Malondialdehyde (MDA) level. Data are presented as the mean ± SD of three independent experiments (n = 3). * indicates significant effect in comparison to the control group (p < 0.05). # indicates significant effect in comparison to the nSiO2 group alone or As group alone (p < 0.05).
Ijerph 16 03199 g003
Figure 4. Antioxidant levels in HepG2 and HT1080 cells after exposure to nSiO2 (10 µg/mL), As (1 µg/mL) or SiO2 + As (10 µg/mL + 1 µg/mL) for 24 h. (A) Intracellular glutathione (GSH) level. (B) Glutathione reductase (GR) enzyme activity. (C) Superoxide dismutase (SOD) enzyme activity. (D) Catalase (CAT) enzyme activity. Data are presented as the mean ± SD of three independent experiments (n = 3). * indicates significant effect in comparison to the control group (p < 0.05). # indicates significant effect in comparison to the nSiO2 group alone or As group alone (p < 0.05).
Ijerph 16 03199 g004
Figure 5. Expression of apoptotic genes and enzymes in HepG2 and HT1080 cells exposed for 24 h to nSiO2 (10 µg/mL), As (1 µg/mL) or SiO2 + As (10 µg/mL + 1 µg/mL). (A) mRNA level of apoptotic genes in HepG2 cells. (B) mRNA level of apoptotic genes in HT1080 cells. (C) Activity of caspase-3 enzymes. (D) Activity of caspase-9 enzymes. Data are presented as the mean ± SD of three independent experiments (n = 3). * indicates significant effect in comparison to the control group (p < 0.05). # indicates significant effect in comparison to the nSiO2 group alone or the As group alone (p < 0.05).
Ijerph 16 03199 g005
Figure 6. Mitochondrial membrane potential (MMP) level and cell cycle phases of HepG2 and HT1080 cells exposed for 24 h to nSiO2 (10 µg/mL), As (1 µg/mL) or SiO2 + As (10 µg/mL + 1 µg/mL). (A) Fluorescent microscopic images of MMP level (rhodamine-123 (Rh-123) probe). (B) Quantitative level of MMP. (C) SubG1 phases of cell cycle. Data are presented as the mean ± SD of three independent experiments (n = 3). * indicates significant effect in comparison to the control group (p < 0.05). # indicates significant effect in comparison to the nSiO2 group alone or the As group alone (p < 0.05).
Ijerph 16 03199 g006
Table 1. Hydrodynamic size and zeta potential measurement of nSiO2 in distilled water and culture medium.
TimeDistilled WaterDMEM
Hydrodynamic Size (nm)Zeta Potential (mV)Hydrodynamic Size (nm)Zeta Potential (mV)
0 h88.31 ± 2.22−32.56 ± 1.1293.25 ± 1.56−33.23 ± 0.95
4 h87.52 ± 1.87−31.88 ± 0.9892.34 ± 1.11−33.42 ± 0.83
8 h89.16 ± 2.17−32.36 ± 1.3291.78 ± 1.48−32.87 ± 0.86
24 h89.84 ± 2.56−31.11 ± 1.2593.59 ± 1.73−33.17 ± 0.75
DMEM: Dulbecco’s modified Eagle’s medium.

