Comparison of Short-Term Associations between PM2.5 Components and Mortality across Six Major Cities in South Korea

 and
and
Abstract
:1. Introduction
2. Methods
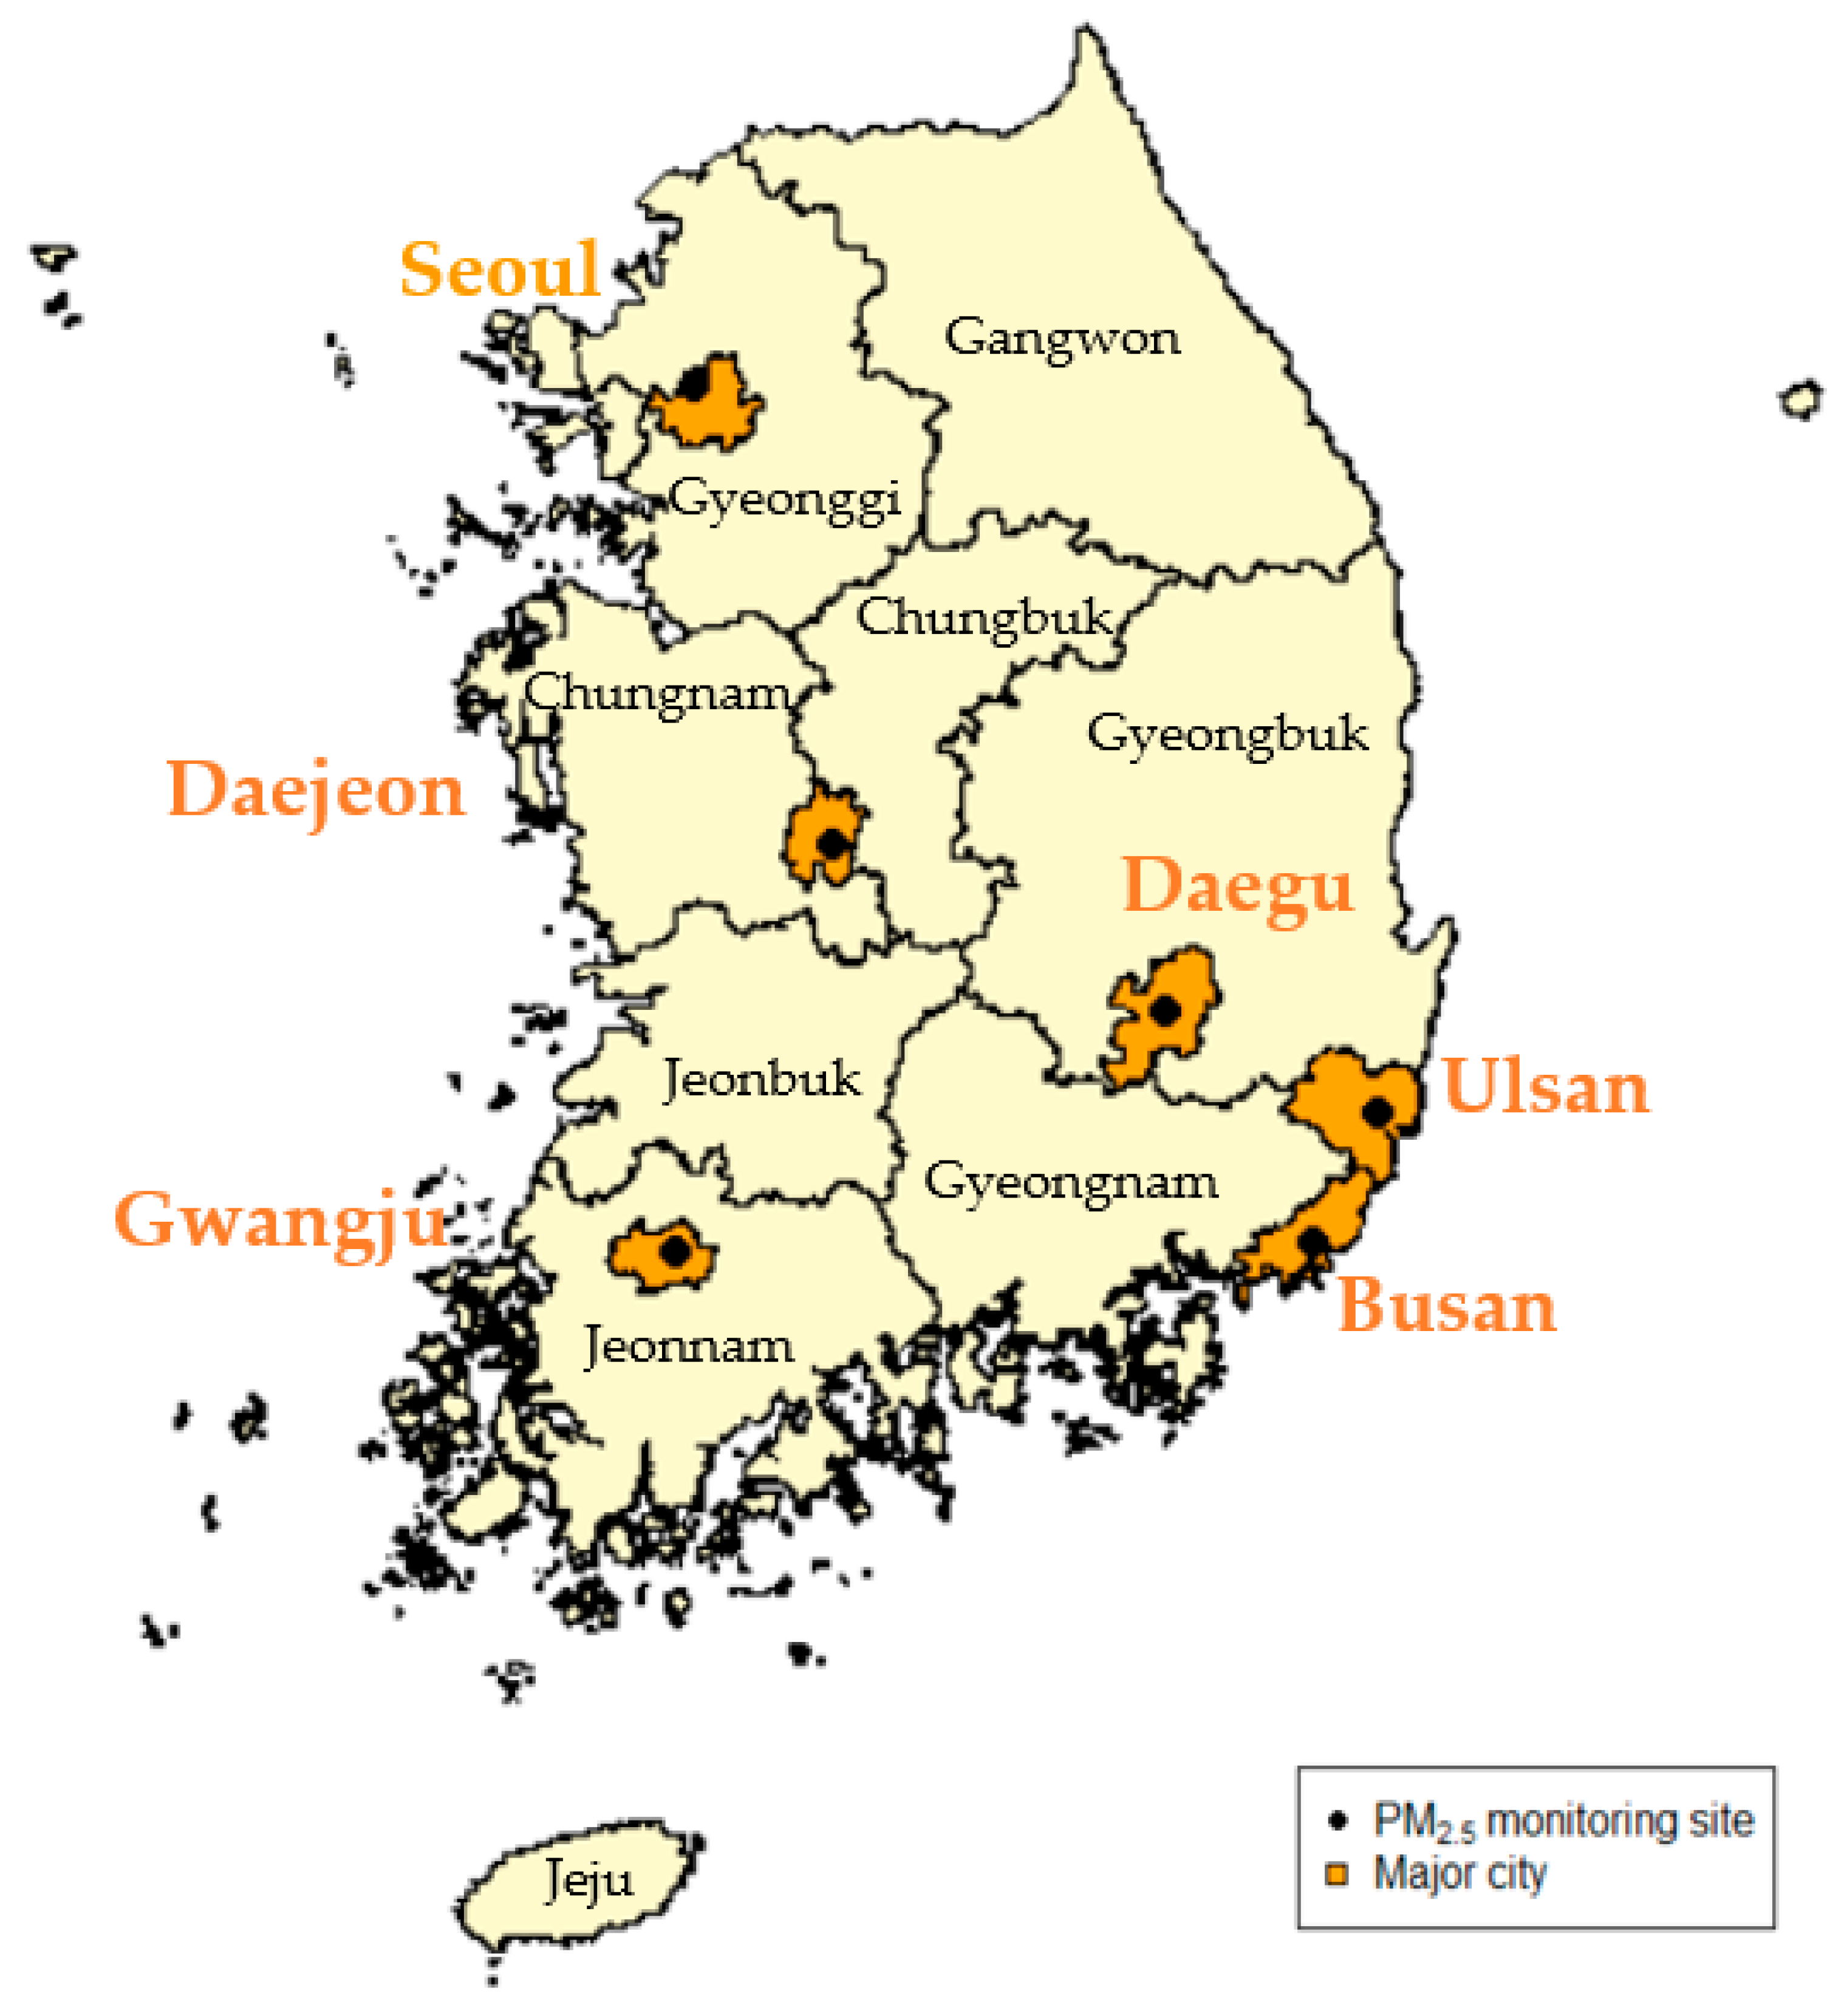
2.1. Study Area
2.2. PM2.5 and PM2.5 Components
2.3. Mortality
2.4. Meteorology
2.5. Statistical Analysis
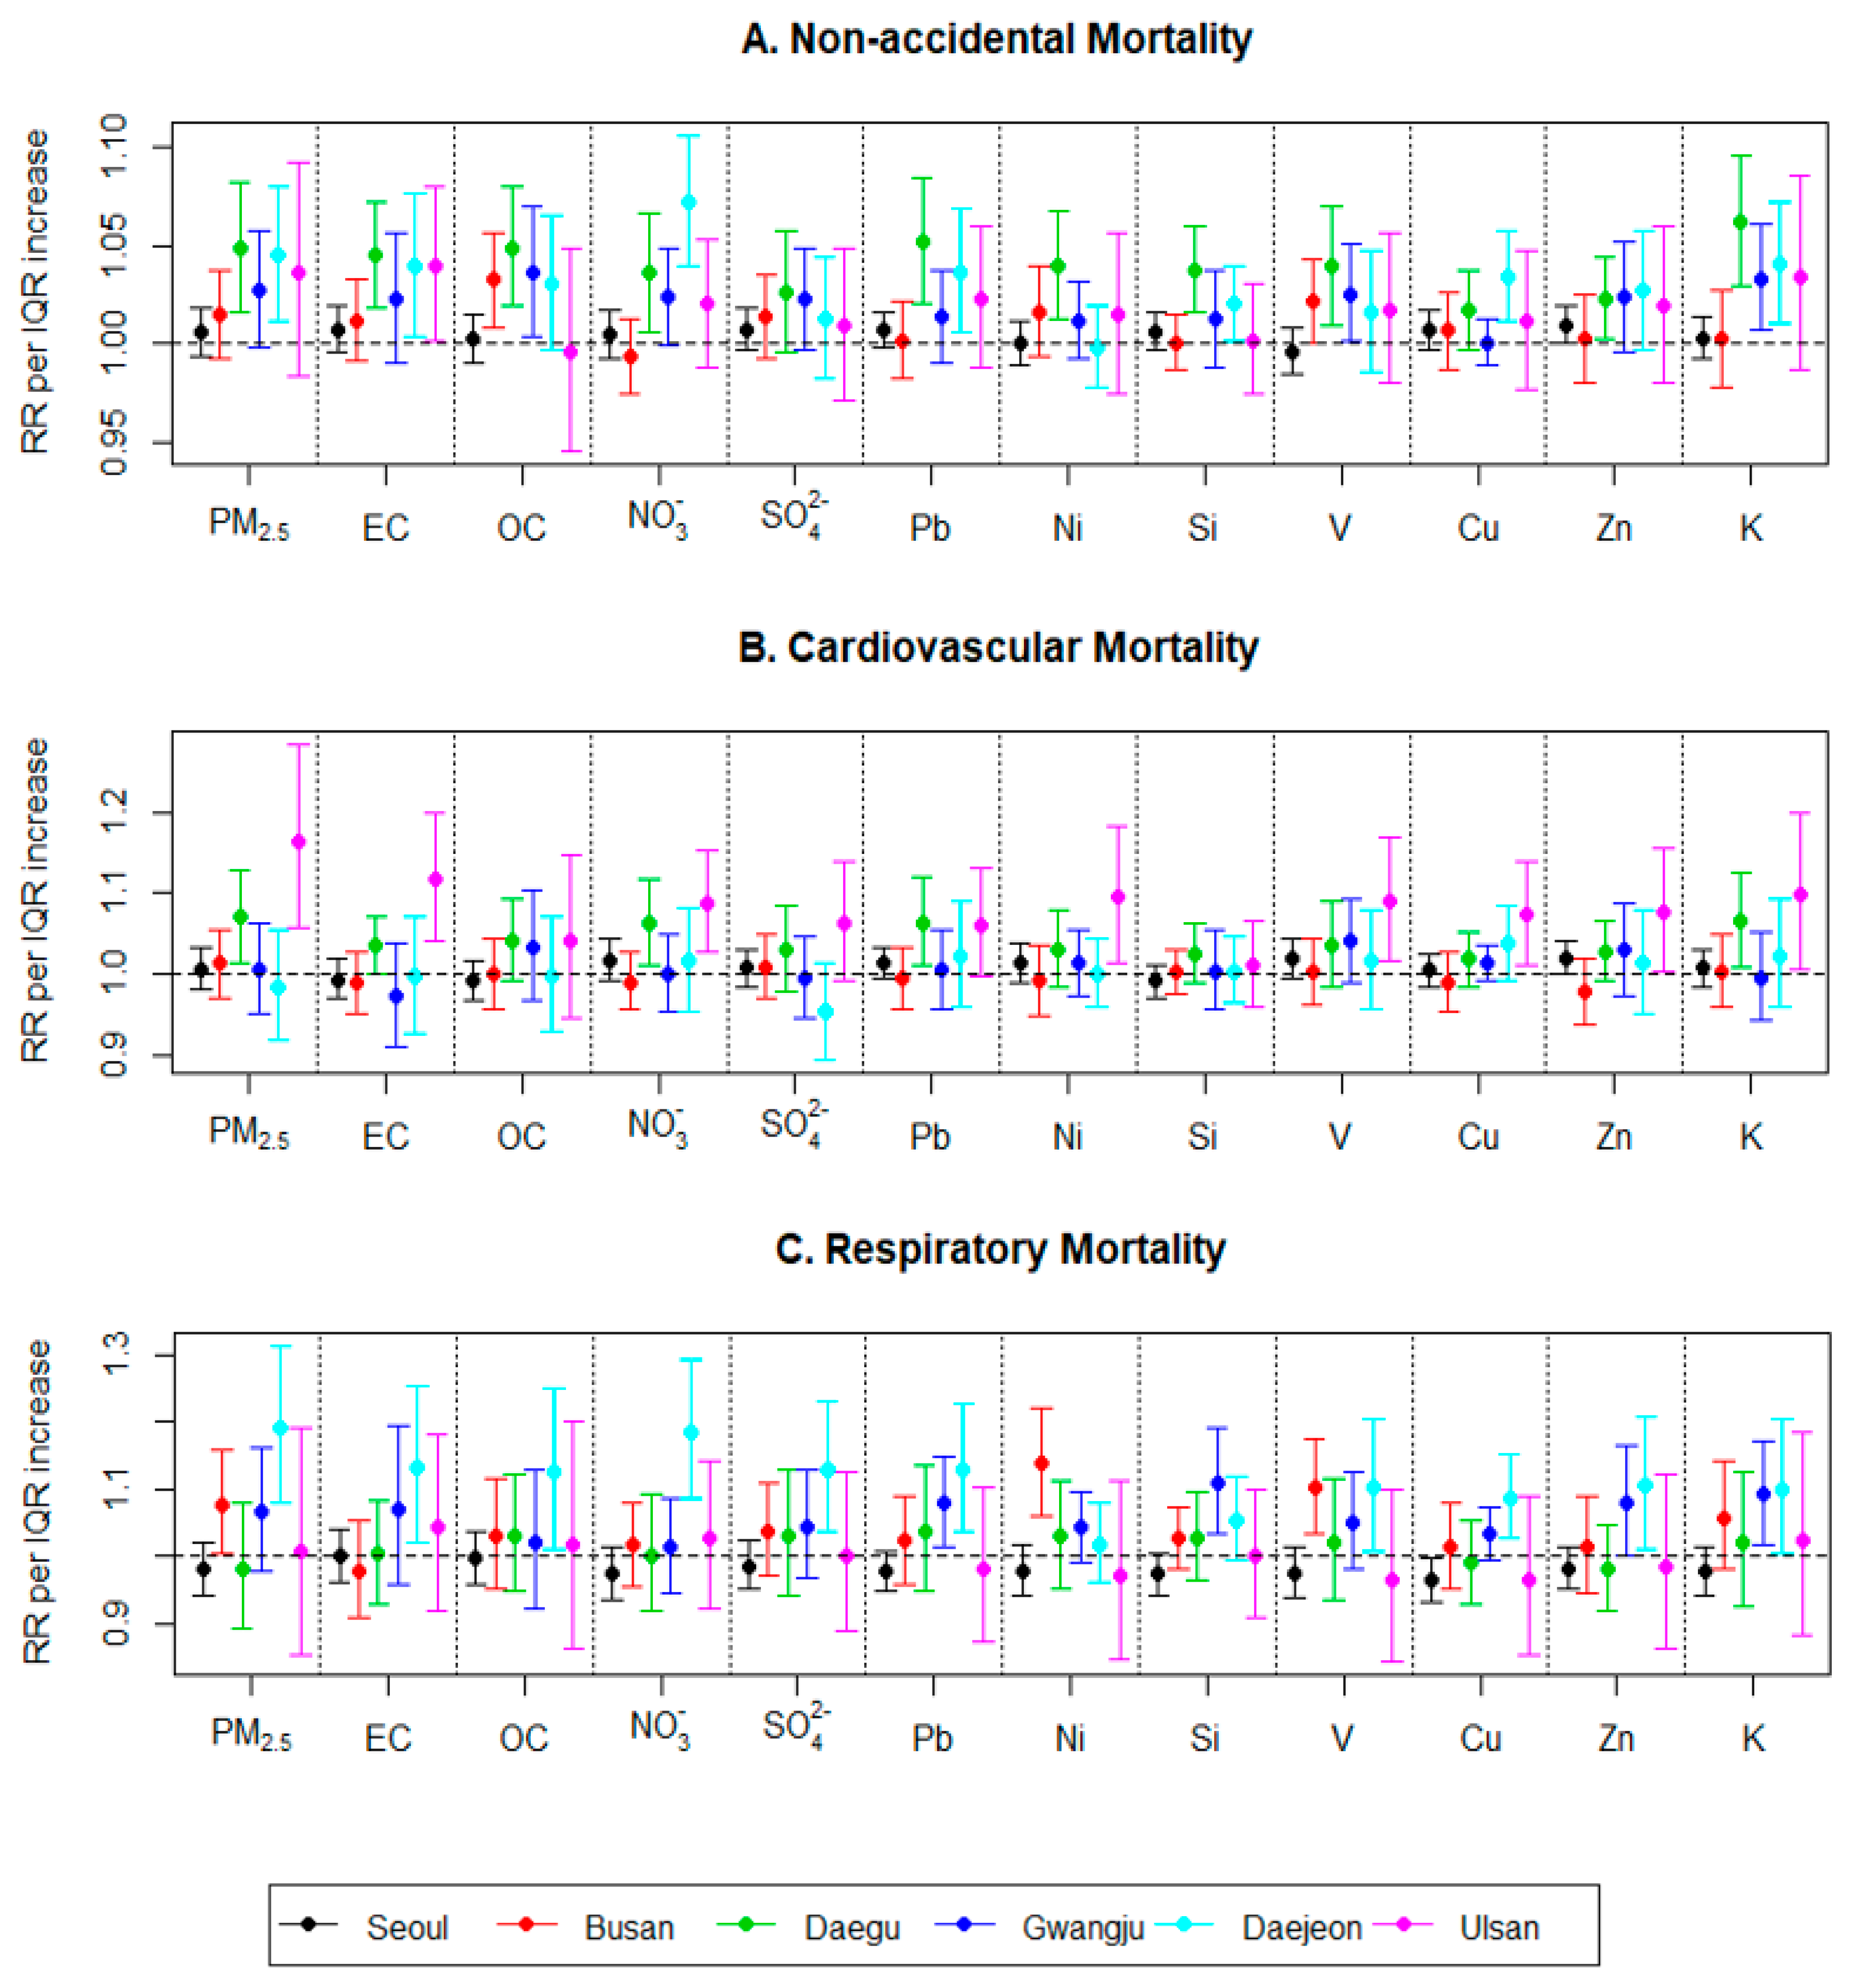
3. Results
4. Discussion
5. Conclusions
Supplementary Materials
Author Contributions
Funding
Conflicts of Interest
References
- Acilleos, S.; Kiomourtzoglu, M.A.; Wu, C.D.; Schwarts, J.D.; Koutrakis, P.; Papatheodorou, S.I. Acute effects of fine particulate matter constituents on mortality: A systemic review and meta-regression. Environ. Int. 2017, 109, 89–100. [Google Scholar] [CrossRef] [PubMed]
- Kim, S.Y.; Dutton, S.J.; Sheppard, L.; Hannigan, M.P.; Miller, S.L.; Milford, J.B.; Peel, J.L.; Vedal, S. The short-term association of selected components of fine particulate matter and mortality in the Denver Aerosol Sources and Health (DASH) study. Environ. Health 2015, 14, 49. [Google Scholar] [CrossRef] [PubMed]
- Dai, L.; Zanobetti, A.; Koutrakis, P.; Schwartz, J.D. Associations of fine particulate matter species with mortality in the United States: A multicity time-series analysis. Environ. Health Perspect. 2014, 122, 837–842. [Google Scholar] [CrossRef] [PubMed]
- Krall, J.R.; Andersin, G.B.; Dominici, F.; Bell, M.L.; Peng, R.D. Short-term exposure to particulate matter constituents and mortality in a national study of U.S., urban communities. Environ. Health Perspect. 2013, 121, 1148–1153. [Google Scholar] [CrossRef]
- Zhou, J.; Ito, K.; Lall, R.; Lippmann, M.; Thurston, G. Time-series analysis of mortality effects of fine particulate matter components in Detroit and Seattle. Environ. Health Perspect. 2011, 191, 461–466. [Google Scholar] [CrossRef] [PubMed]
- Kim, S.Y.; Peel, J.L.; Hannigan, M.P.; Dutton, S.J.; Sheppard, L.; Clark, M.L.; Vedal, S. The temporal lag structure of short-term associations of fine particulate matter chemical constituents and cardiovascular and respiratory hospitalizations. Environ. Health Perspect. 2012, 120, 1094–1099. [Google Scholar] [CrossRef] [PubMed]
- Bell, M.L. Assessment of the Health Impacts of Particulate Matter Characteristics; Health Effects Institute: Boston, MA, USA, 2012. [Google Scholar]
- HEI Panel on the Health Effects of Traffic-Related Air Pollution. Traffic-Related Air Pollution: A Critical Review of the Literature on Emissions, Exposure, and Health Effects; Health Effects Institute: Boston, MA, USA, 2010. [Google Scholar]
- Dominici, F. Does the effect of PM10 on mortality depend on PM Nickel and Vanadium content? A reanalysis of the NMMAPS data. Environ. Health Perspect. 2007, 115, 1701–1703. [Google Scholar] [CrossRef]
- Lippmann, M.; Chen, L.C.; Gordon, T.; Ito, K.; Thurston, G.D. National Particle Component Toxicity (NPACT) Initiative: Integrated epidemiologic and toxicologic studies of the health effects of particulate matter components. Res. Rep. Health Eff. Inst. 2013, 177, 5–13. [Google Scholar]
- Cao, J.; Xu, H.; Chen, B.; Kan, H. Fine particulate matter constituents and cardiopulmonary mortality in a heavily polluted Chinese city. Environ. Health Perspect. 2012, 120, 373–378. [Google Scholar] [CrossRef]
- Tao, J.; Zhang, L.; Cao, J.; Zhang, R. A review of current knowledge concerning PM2.5 chemical composition, aerosol optical properties and their relationships across China. Atmos. Chem. Phys. 2017, 17, 9485–9518. [Google Scholar] [CrossRef]
- Son, J.Y.; Lee, J.T.; Kim, K.H.; Jung, K.; Bell, M.L. Characterization of fine particulate matter and associations between particulate chemical constituents and mortality in Seoul, Korea. Environ. Health Perspect. 2012, 120, 872–878. [Google Scholar] [CrossRef]
- Heo, J.; Schauer, J.J.; Yi, O.; Paek, D.; Kim, H.; Yi, S.M. Fine particle air pollution and mortality: Importance of specific sources and chemical species. Epidemiology 2014, 25, 379–388. [Google Scholar] [CrossRef]
- Huang, W.; Cao, J.; Tao, Y.; Dai, L.; Lu, S.E.; Wang, Z.; Zhu, T. Seasonal variation of chemical associated with short-term mortality effects of PM2.5 in Xi’an, a central city in China. Am. J. Epidemiol. 2012, 175, 556–566. [Google Scholar] [CrossRef]
- Ueda, K.; Yamagami, M.; Lkemori, F.; Hisatsune, K.; Nitta, H. Associations between fine particulate matter components and daily mortality in Nagoya, Japan. J. Epidemiol. 2016, 26, 249–257. [Google Scholar] [CrossRef]
- Qiao, L.; Cai, J.; Wang, H.; Zhou, M.; Lou, S.; Chen, R.; Dai, H.; Chen, C.; Kan, H. PM2.5 constituents and hospital emergency-room visits in Shanghai, China. Environ. Sci. Technol. 2014, 48, 10409–10414. [Google Scholar] [CrossRef]
- National Institute of Environmental Research. Installation and Operating Guidelines of Air Pollution Measuring Network; National Institute of Environmental Research: Incheon, Korea, 2017. (In Korea)
- National Institute of Environmental Research. Atmospheric Environment Annual Report; National Institute of Environmental Research: Incheon, Korea, 2015. (In Korea)
- National Institute of Environmental Research. Standard Methods for the Examination of Air Pollution; National Institute of Environmental Research: Incheon, Korea, 2017. (In Korea)
- Chen, L.C.; Lippmann, M. Effects of metals within ambient air particulate matter (PM) on human health. Inhal. Toxicol. 2009, 21, 1–31. [Google Scholar] [CrossRef]
- Wood, S.N.; Some GAM theory. Generalized Additive Models: An Introduction with R; Chapman and Hall/CRC: Boca Raton, FL, USA; Taylor and Francis Group: Milton Park, Didcot, UK, 2006. [Google Scholar]
- National Population Statistics. Available online: http://27.101.213.4/etcStatAvgAge.do (accessed on 20 February 2019).
- Ryou, H.G.; Heo, J.; Kim, S.Y. Source apportionment of PM10 and PM2.5 air pollution, and possible impacts of study characteristics in South Korea. Environ. Pollut. 2018, 240, 963–972. [Google Scholar] [CrossRef]
- Lippmann, M. Toxicological and epidemiological studies of cardiovascular effects of ambient air fine particulate matter (PM2.5) and its chemical components: Coherence and public health implications. Crit. Rev. Toxi. 2014, 44, 299–347. [Google Scholar] [CrossRef]
- Hoek, G.; Krishnan, R.M.; Beelen, R.; Peters, A.; Ostro, B.; Brunekreef, B.; Kaufman, J.D. Long-term air pollution exposure and cardio-respiratory mortality: A review. Environ. Int. 2013, 28, 43. [Google Scholar] [CrossRef]
- Kelly, F.J.; Fussell, J.C. Size, source and chemical composition as determinants of toxicity attributable to ambient particulate matter. Atmos. Environ. 2012, 60, 504–526. [Google Scholar] [CrossRef]
- WHO Europe. Health Risks of Particulate Matter from Long-Range Transboundary Air Pollution; WHO Europe: Copenhagen, Denmark, 2006. [Google Scholar]
- WHO Europe. Air Quality Guideline Global Update; WHO Europe: Copenhagen, Denmark, 2005. [Google Scholar]
- WHO Europe. Air Quality Guidelines for Particulate Matter Ozone, Nitrogen and Sulfur Dioxide; WHO Europe: Copenhagen, Denmark, 2006. [Google Scholar]
- Lippmann, M.; Ito, K.; Hwang, J.S.; Maciejczyk, P.; Chen, L.C. Cardiovascular effects of nickel in ambient air. Environ Health Perspect. 2006, 114, 1662–1669. [Google Scholar] [CrossRef]
- Basabana, X.; Jacquemin, B.; Karanasiou, A.; Ostro, B.; Querol, X.; Agis, D.; Alessandini, E.; Alguacil, J.; Artinano, B.; Catrambone, M.; et al. Short-term effects of particulate matter constituents on daily hospitalizations and mortality in five South-European cities: Results from the MED-PARTOCLES project. Environ. Int. 2015, 75, 151–158. [Google Scholar] [CrossRef]
- Atkinson, R.W.; Kang, S.; Anderson, H.R.; Mills, I.C.; Walton, H.A. Epidemiological time series studies of PM2.5 and daily mortality and hospital admissions: A systemic review and meta-analysis. Thorax 2014, 26, 660–665. [Google Scholar] [CrossRef]
- Peel, J.L.; Tolbert, P.E.; Klein, M.; Metzger, K.B.; Flanders, W.D.; Todd, K.; Mulholland, J.A.; Ryan, P.B.; Frumkin, H. Ambient air pollution and respiratory emergency department visit. Epidemiology 2005, 16, 164–174. [Google Scholar] [CrossRef]
- Baxer, L.K.; Crooks, J.L.; Sacks, J.D. Influence of exposure difference on city-to-city heterogeneity in PM2.5 mortality association in US cities. Environ. Int. 2017, 16, 1. [Google Scholar]


| City | N | PM2.5 (µg/m3) | PM2.5 Components | Mortality | Meteorology | |||||||||||||
|---|---|---|---|---|---|---|---|---|---|---|---|---|---|---|---|---|---|---|
| EC (µg/m) | OC (µg/m3) | NO3− (µg/m3) | SO42− (µg/m3) | Pb (ng/m3) | Ni (ng/m3) | Si (ng/m3) | V (ng/m3) | Cu (ng/m3) | Zn (ng/m3) | K (ng/m3) | Non- Accidental | CVD | RD | Temp (°C) | RH (%) | |||
| Seoul | 517 | 27.1 (18.5) | 1.9 (0.9) | 4.8 (2.3) | 4.7 (5.8) | 6.9 (5.7) | 28.8 (29.1) | 2.2 (2.1) | 768.3 (629.4) | 5.7 (5.8) | 7.9 (7.1) | 67.9 (54.1) | 349.8 (264.7) | 104.2 | 21.9 | 9.2 | 13.2 | 60.9 |
| Busan | 283 | 23.7 (13.1) | 0.8 (0.6) | 4.7 (2.3) | 2.4 (3.3) | 6.1 (4.8) | 24.0 (17.3) | 3.9 (3.0) | 565.1 (532.5) | 8.5 (8.9) | 7.5 (5.5) | 78.4 (49.0) | 255.8 (171.6) | 50.3 | 14.0 | 5.0 | 15.3 | 63.5 |
| Daegu | 286 | 23.4 (14.0) | 0.8 (0.9) | 5.0 (3.1) | 2.6 (3.7) | 4.8 (3.4) | 22.7 (17.5) | 2.0 (1.4) | 564.1 (488.4) | 2.6 (2.4) | 7.1 (7.1) | 134.9 (138.1) | 261.3 (182.5) | 31.4 | 8.7 | 3.4 | 15.0 | 59.3 |
| Gwangju | 486 | 26.0 (16.5) | 1.8 (1.1) | 4.5 (1.8) | 3.4 (4.9) | 6.7 (5.6) | 28.9 (24.8) | 1.9 (2.0) | 801.7 (682.0) | 4.1 (3.9) | 6.1 (8.1) | 69.2 (45.0) | 352.3 (268.5) | 17.3 | 4.1 | 2.2 | 14.4 | 66.7 |
| Daejeon | 437 | 27.9 (17.0) | 2.2 (1.0) | 4.7 (1.8) | 4.5 (5.9) | 6.7 (5.1) | 27.5 (24.5) | 2.1 (2.3) | 744.8 (766.2) | 3.6 (3.1) | 6.1 (5.1) | 64.4 (44.2) | 328.8 (251.1) | 16.2 | 3.6 | 2.0 | 13.5 | 71.7 |
| Ulsan | 247 | 22.3 (12.9) | 0.7 (0.6) | 3.8 (2.1) | 1.8 (2.7) | 5.6 (4.5) | 21.9 (21.2) | 2.8 (2.7) | 646.2 (676.3) | 6.3 (8.0) | 5.7 (5.5) | 65.1 (50.6) | 224.7 (163.5) | 11.6 | 3.3 | 1.7 | 14.9 | 63.1 |
| EC | OC | NO3− | SO42− | Pb | Ni | Si | V | Cu | Zn | K | |
|---|---|---|---|---|---|---|---|---|---|---|---|
| PM2.5 | 0.58 (0.41–0.78) | 0.72 (0.48–0.83) | 0.76 (0.49–0.85) | 0.68 (0.57–0.74) | 0.72 (0.61–0.81) | 0.50 (0.34–0.61) | 0.52 (0.41–0.62) | 0.39 (0.33–0.48) | 0.57 (0.33–0.62) | 0.68 (0.56–0.76) | 0.76 (0.63–0.81) |
| EC | 0.62 (0.08–0.77) | 0.46 (0.25–0.70) | 0.34 (0.27–0.40) | 0.46 (0.27–0.61) | 0.23 (0.10–0.31) | 0.19 (0.04–0.42) | 0.15 (0.01–0.19) | 0.36 (0.21–0.49) | 0.42 (0.29–0.58) | 0.49 (0.25–0.67) | |
| OC | 0.60 (0.39–0.69) | 0.37 (0.29–0.53) | 0.55 (0.31–0.68) | 0.35 (0.22–0.49) | 0.38 (0.34–0.45) | 0.25 (0.13–0.34) | 0.45 (0.28–0.53) | 0.54 (0.46–0.65) | 0.63 (0.39–0.71) | ||
| NO3− | 0.32 (0.20–0.42) | 0.59 (0.41–0.72) | 0.24 (0.08–0.42) | 0.27 (0.13–0.34) | 0.07 (−0.14–0.28) | 0.52 (0.26–0.56) | 0.50 (0.35–0.59) | 0.62 (0.52–0.67) | |||
| SO42− | 0.50 (0.42–0.57) | 0.46 (0.24–0.52) | 0.37 (0.32–0.44) | 0.48 (0.36–0.53) | 0.32 (0.15–0.44) | 0.48 (0.27–0.55) | 0.46 (0.44–0.49) | ||||
| Pb | 0.46 (0.30–0.62) | 0.47 (0.36–0.51) | 0.35 (0.11–0.54) | 0.70 (0.46–0.85) | 0.72 (0.58–0.87) | 0.72 (0.57–0.81) | |||||
| Ni | 0.36 (0.20–0.45) | 0.75 (0.46–0.91) | 0.58 (0.40–0.72) | 0.61 (0.41–0.70) | 0.38 (0.24–0.48) | ||||||
| Si | 0.44 (0.23–0.50) | 0.39 (0.25–0.47) | 0.48 (0.34–0.58) | 0.67 (0.62–0.74) | |||||||
| V | 0.43 (−0.02–0.57) | 0.49 (0.11–0.59) | 0.32 (−0.01–0.45) | ||||||||
| Cu | 0.76 (0.46–0.88) | 0.56 (0.42–0.66) | |||||||||
| Zn | 0.65 (0.52–0.74) |
© 2019 by the authors. Licensee MDPI, Basel, Switzerland. This article is an open access article distributed under the terms and conditions of the Creative Commons Attribution (CC BY) license (http://creativecommons.org/licenses/by/4.0/).
Share and Cite
Yoo, S.-E.; Park, J.-S.; Lee, S.H.; Park, C.-H.; Lee, C.-W.; Lee, S.-B.; Yu, S.D.; Kim, S.-Y.; Kim, H. Comparison of Short-Term Associations between PM2.5 Components and Mortality across Six Major Cities in South Korea. Int. J. Environ. Res. Public Health 2019, 16, 2872. https://doi.org/10.3390/ijerph16162872
Yoo S-E, Park J-S, Lee SH, Park C-H, Lee C-W, Lee S-B, Yu SD, Kim S-Y, Kim H. Comparison of Short-Term Associations between PM2.5 Components and Mortality across Six Major Cities in South Korea. International Journal of Environmental Research and Public Health. 2019; 16(16):2872. https://doi.org/10.3390/ijerph16162872
Chicago/Turabian StyleYoo, Si-Eun, Jin-Soo Park, Soo Hyun Lee, Choong-Hee Park, Chul-Woo Lee, Sang-Bo Lee, Seung Do Yu, Sun-Young Kim, and Ho Kim. 2019. "Comparison of Short-Term Associations between PM2.5 Components and Mortality across Six Major Cities in South Korea" International Journal of Environmental Research and Public Health 16, no. 16: 2872. https://doi.org/10.3390/ijerph16162872