Do Temporary Workers More Often Decide to Work While Sick? Evidence for the Link between Employment Contract and Presenteeism in Europe

 , , , ,
Abstract
:1. Introduction
1.1. Background
1.2. Temporary Employment and Presenteeism
1.3. Aims and Hypothesis
2. Materials and Methods
2.1. Data
2.2. Study Sample
2.3. Variables
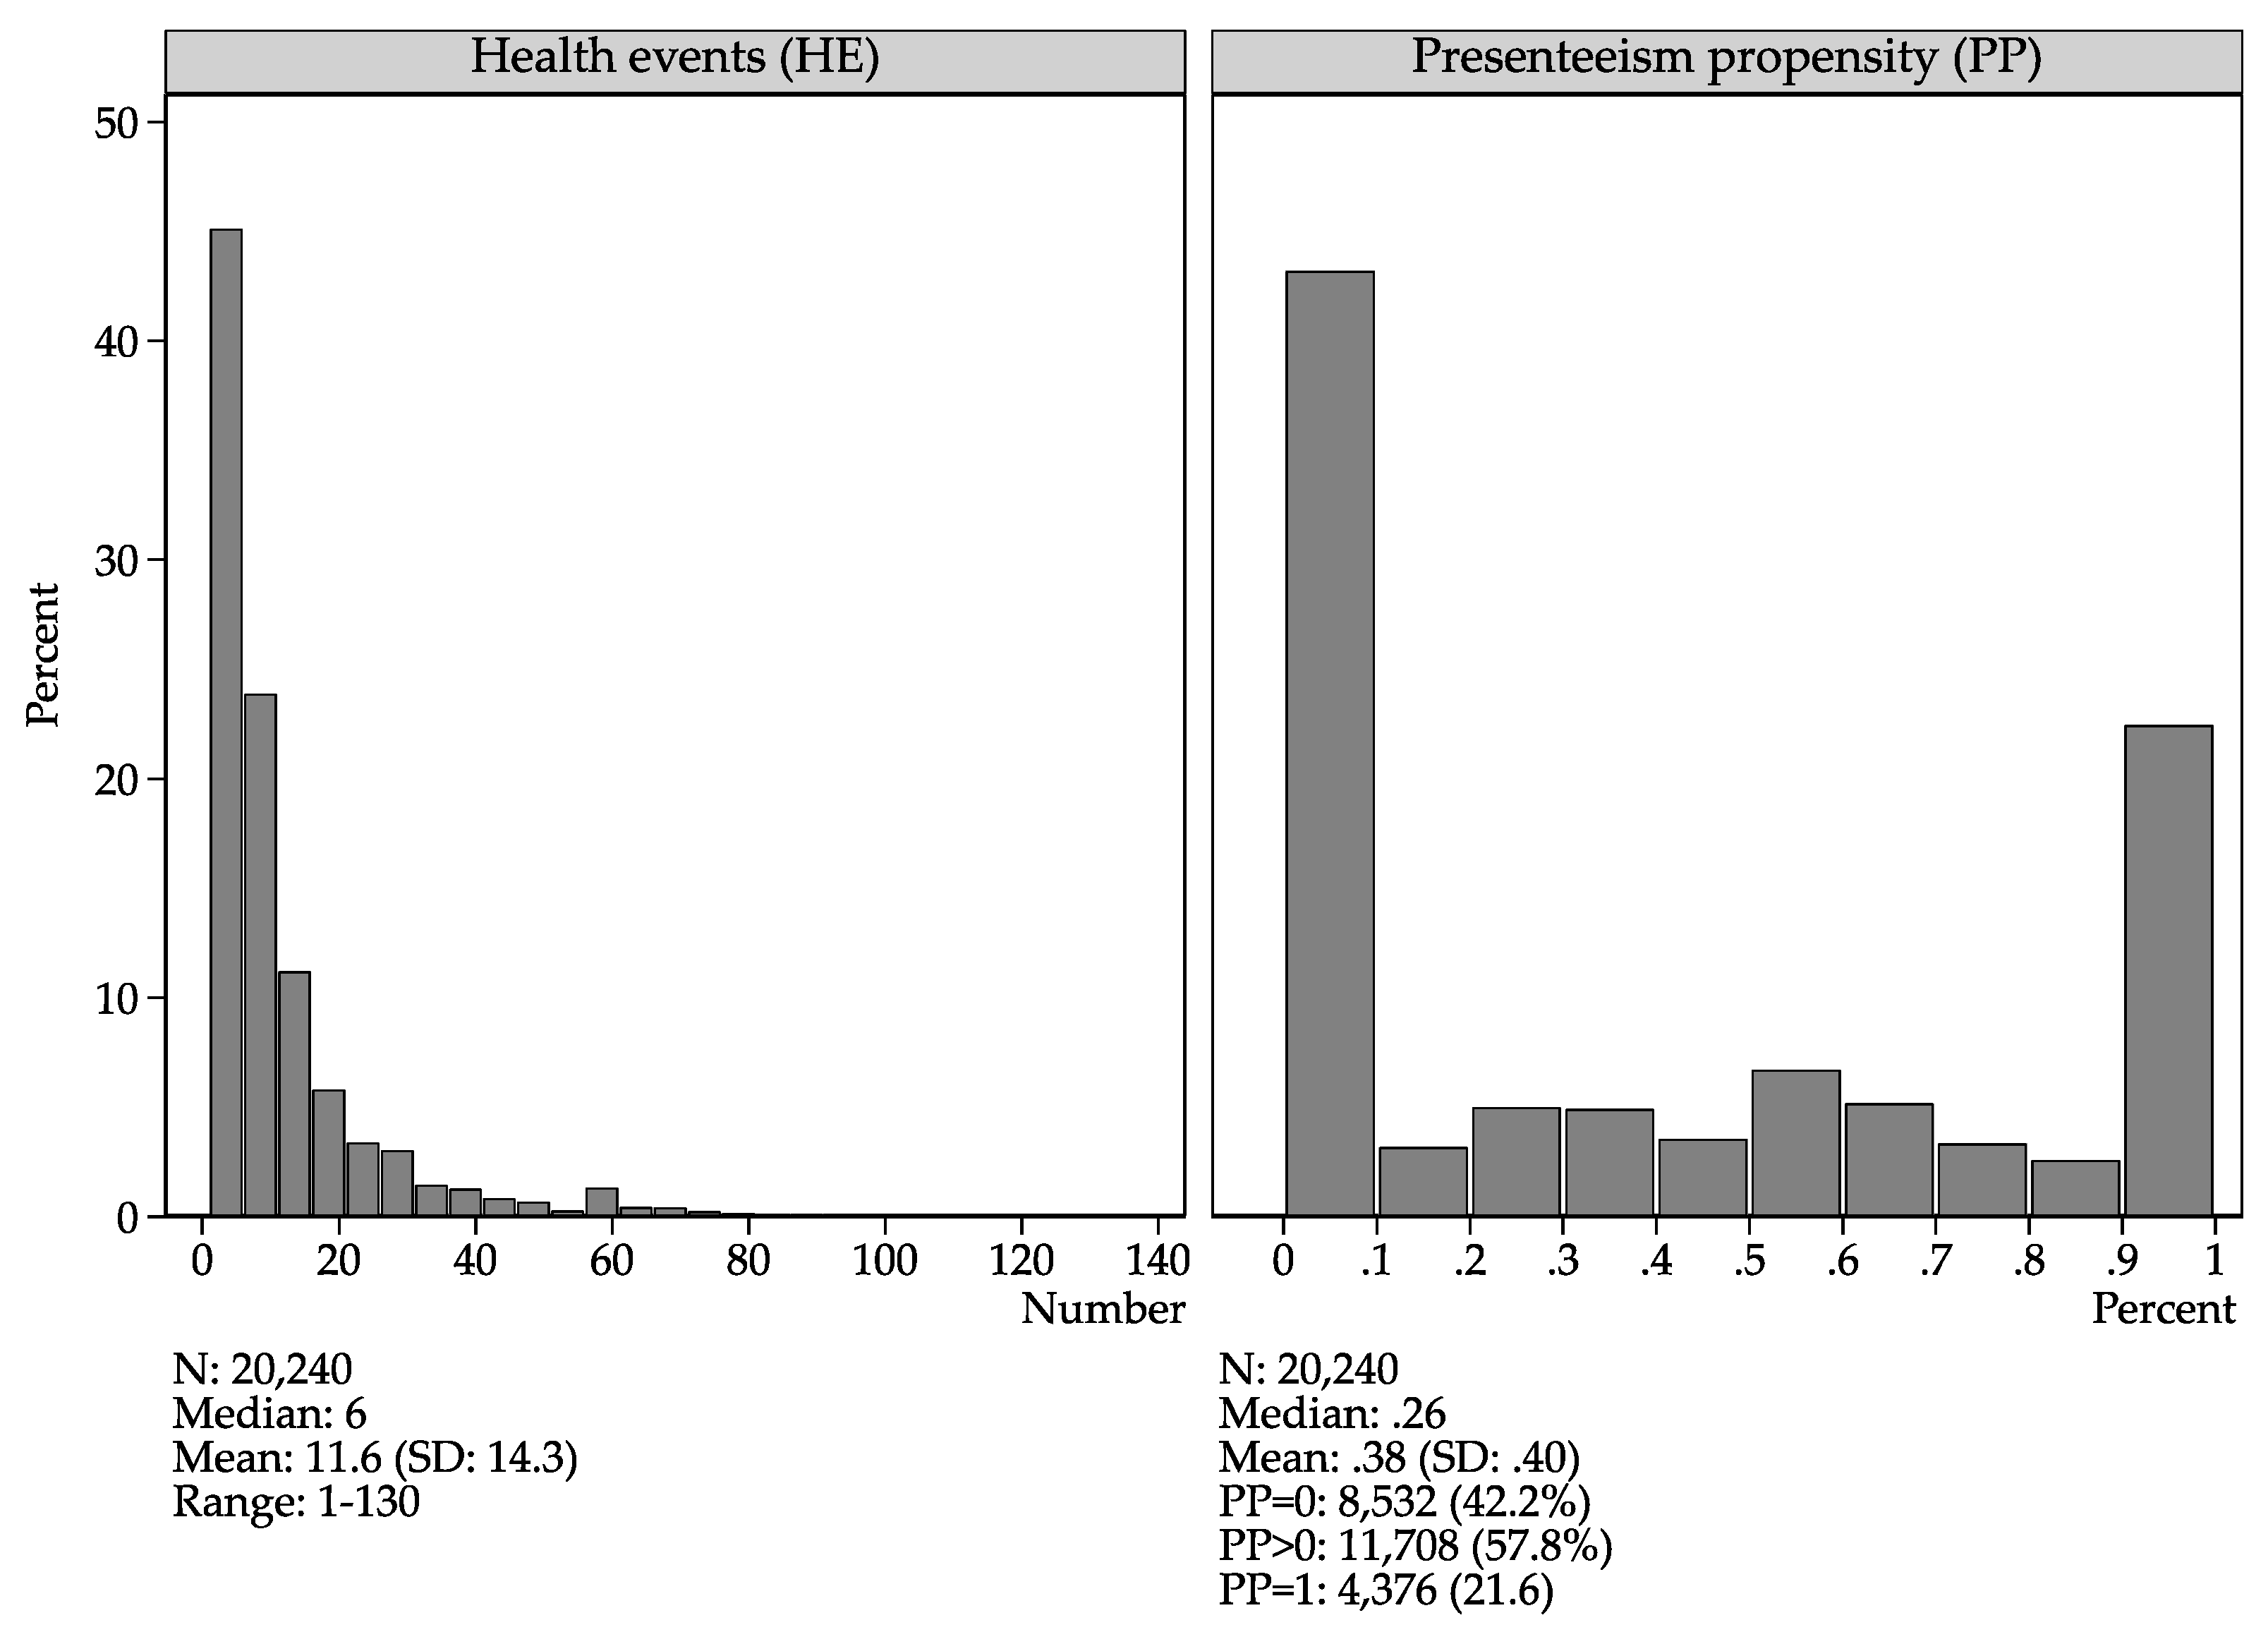
2.3.1. Sickness Absenteeism, Sickness Presenteeism, Health Events and Presenteeism Propensity
2.3.2. Employment Contract and Job Insecurity
2.3.3. Socio-Demography and Occupational Factors
2.3.4. Handling of Missing Values
2.4. Statistical Analyses
3. Results
3.1. Sample Description
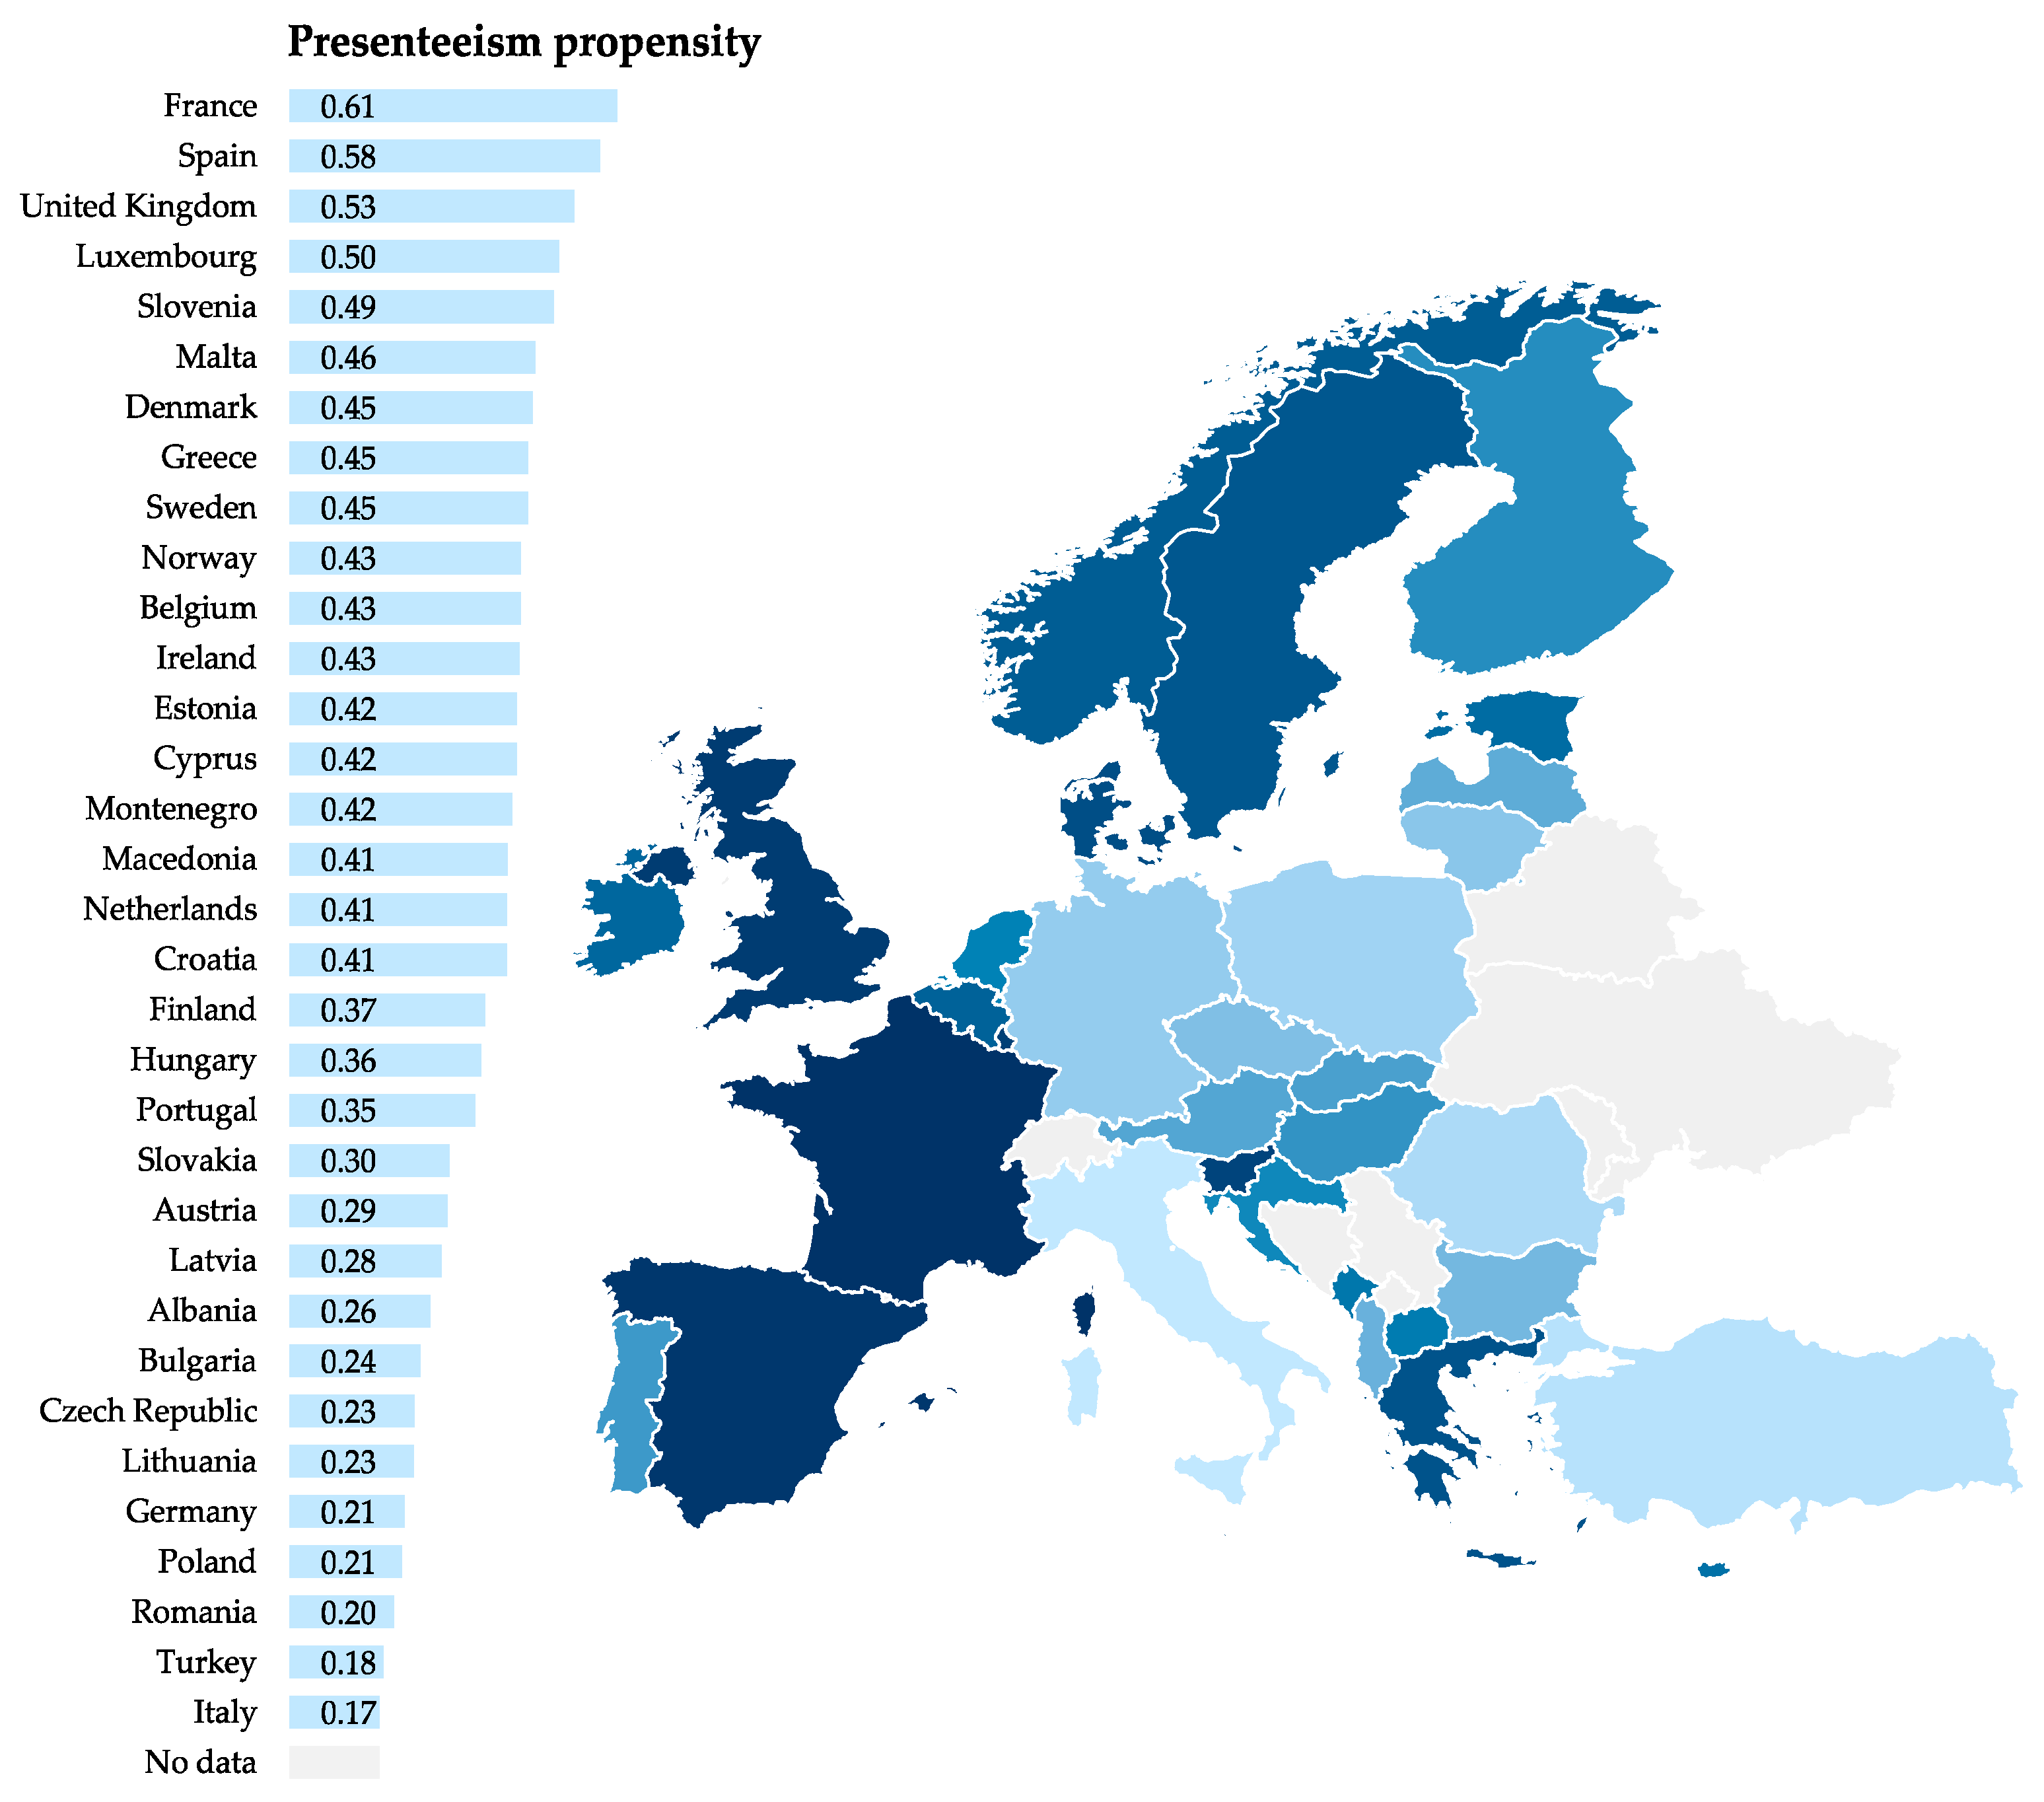
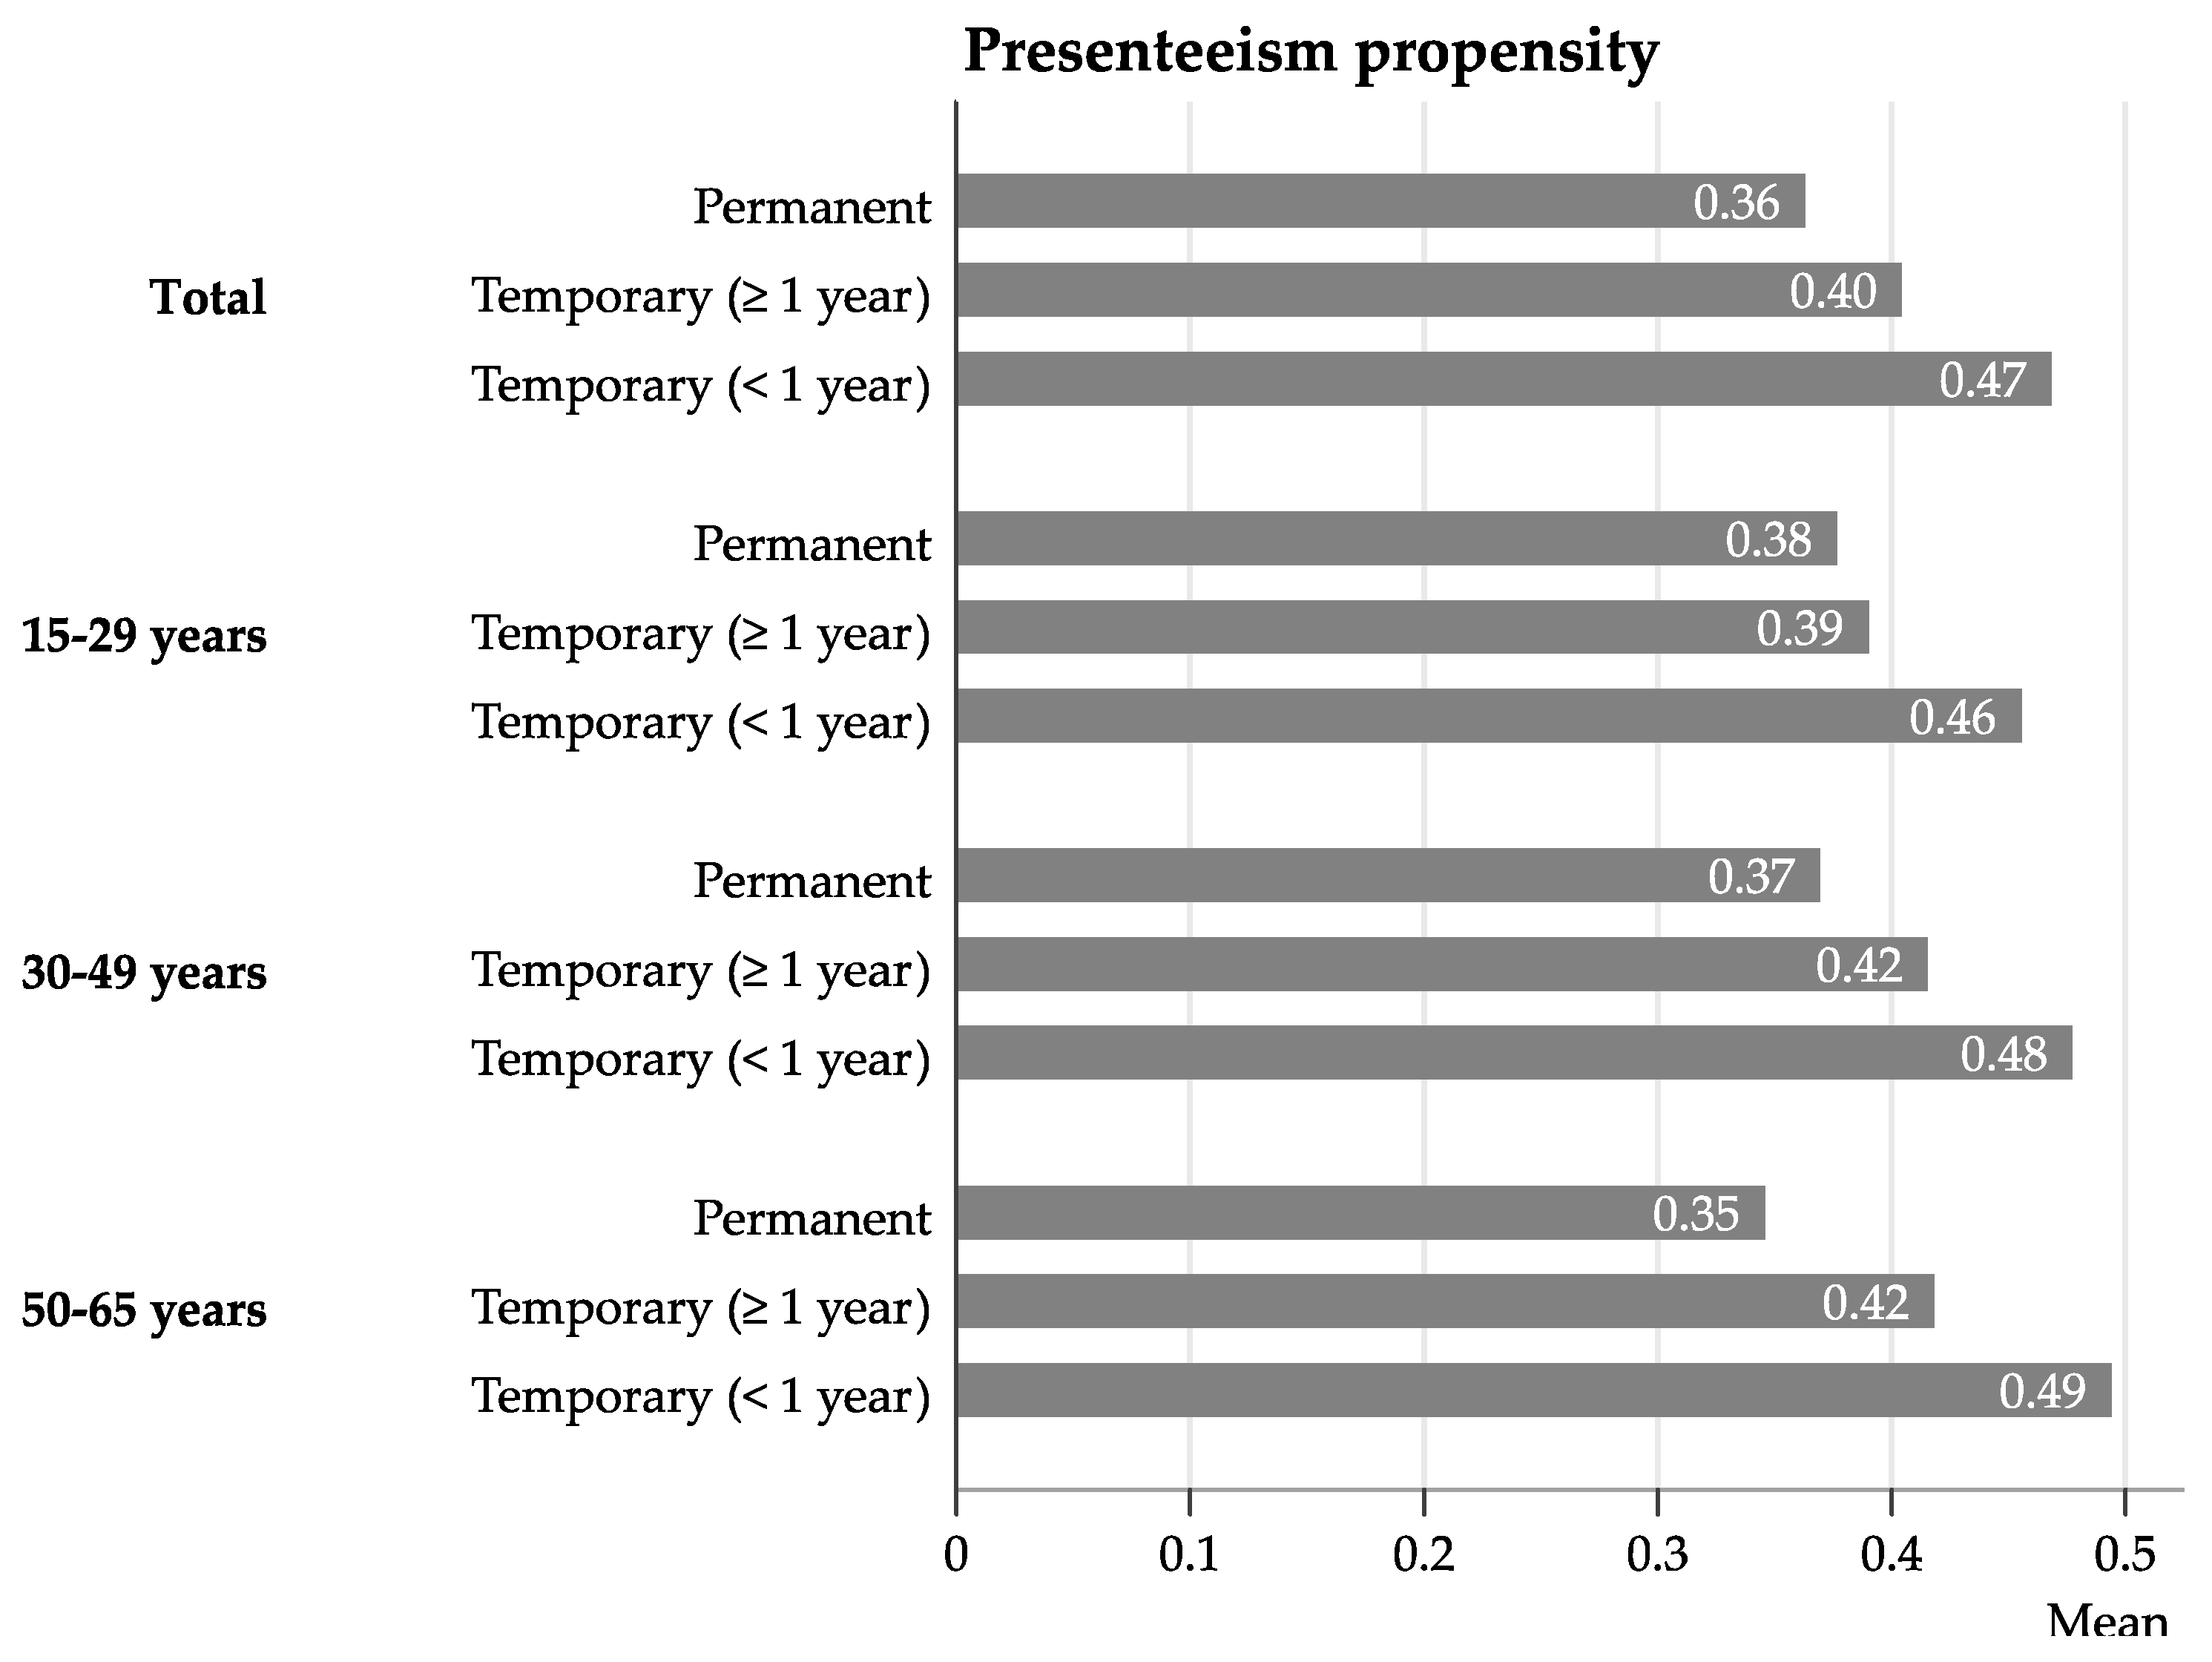
3.2. Patterns of Presenteeism
3.3. Employment Contract and Likelihood for Presenteeism
3.4. Sensitivity Analysis
4. Discussion
4.1. General Patterns of Presenteeism
4.2. The Relationship between Employment Contract and Presenteeism
4.3. Strengths and Limitations
5. Conclusions
Author Contributions
Funding
Conflicts of Interest
Appendix A


| No | Variable | Name | Missing (N) | Total (N) | Missing (%) |
|---|---|---|---|---|---|
| (1) | female | Female | 6 | 32,392 | 0.02 |
| (2) | age | Age | 112 | 32,392 | 0.35 |
| (3) | jobten2 | Job tenure | 419 | 32,392 | 1.29 |
| (4) | wrkhours | Weekly working hours | 562 | 32,392 | 1.73 |
| (5) | nace_long | Working sector (NACE) | 155 | 32,392 | 0.48 |
| (6) | esec4 | Occupational position (ESeC) | 136 | 32,392 | 0.42 |
| (7) | estm | Company size | 678 | 32,392 | 2.09 |
| (8) | contract2 | Employment contract | 77 | 32,392 | 0.24 |
| (9) | jobinsec2 | Perceived job insecurity | 2607 | 32,392 | 8.05 |
| (10) | jobinc | Income (% of country median) | 4101 | 32,392 | 12.66 |
| (11) | sickab | Days of sickness absenteeism | 3334 | 32,392 | 10.29 |
| (12) | sickpr | Days of sickness presenteeism | 1339 | 32,392 | 4.13 |
| Variable | Unadjusted | M1 | M2 | M3 | ||||
|---|---|---|---|---|---|---|---|---|
| RR | 95% CI | RR | 95% CI | RR | 95% CI | RR | 95% CI | |
| Type of working contract | ||||||||
| Permanent | Reference | Reference | Reference | Reference | ||||
| Temporary (≥1 year) | 1.11 ** | [1.03–1.18] | 1.11 *** | [1.05–1.18] | 1.09 ** | [1.03–1.16] | 1.02 | [0.92–1.12] |
| Temporary (<1 year) | 1.28 *** | [1.15–1.41] | 1.29 *** | [1.17–1.42] | 1.24 *** | [1.13–1.37] | 1.16 * | [1.01–1.34] |
| No contract/other | 1.09 | [0.98–1.21] | 1.07 | [0.97–1.19] | 1.07 | [0.97–1.18] | 1.01 | [0.86–1.20] |
| Sex | ||||||||
| Women | 1.08 *** | [1.04–1.12] | 1.08 *** | [1.05–1.12] | 1.08 *** | [1.05–1.12] | ||
| Age | ||||||||
| 15–29 years | Reference | Reference | Reference | |||||
| 30–9 years | 1.01 | [0.96–1.05] | 1.00 | [0.96–1.05] | 0.98 | [0.93–1.03] | ||
| 50–65 years | 0.95 | [0.90–1.02] | 0.95 | [0.89–1.01] | 0.91 ** | [0.85–0.98] | ||
| Job tenure | 1.03 * | [1.00–1.06] | 1.04 * | [1.01–1.06] | 1.04 ** | [1.01–1.07] | ||
| Job tenure 2 | 1.00 | [0.99–1.01] | 1.00 | [0.99–1.01] | 1.00 | [0.99–1.01] | ||
| Weekly working hours | 1.07 *** | [1.04–1.09] | 1.07 *** | [1.04–1.09] | 1.07 *** | [1.04–1.09] | ||
| Weekly working hours 2 | 1.03 *** | [1.03–1.04] | 1.03 *** | [1.03–1.04] | 1.03 *** | [1.03–1.04] | ||
| Income | 0.97 | [0.94–1.01] | 0.97 | [0.94–1.01] | 0.97 | [0.94–1.01] | ||
| Income 2 | 1.00 | [1.00–1.00] | 1.00 | [1.00–1.00] | 1.00 | [1.00–1.00] | ||
| Occupational position | ||||||||
| Blue-collar workers | Reference | Reference | Reference | |||||
| White-collar workers | 1.04 | [0.97–1.11] | 1.04 | [0.97–1.11] | 1.04 | [0.97–1.11] | ||
| Intermediates, low. supervisory | 1.04 | [0.97–1.12] | 1.04 | [0.97–1.12] | 1.04 | [0.97–1.12] | ||
| Managers and professionals | 1.15 *** | [1.07–1.24] | 1.15 *** | [1.07–1.24] | 1.15 *** | [1.07–1.24] | ||
| Working sector (NACE) | ||||||||
| Agriculture | 0.93 | [0.79–1.10] | 0.93 | [0.80–1.10] | 0.93 | [0.79–1.10] | ||
| Industry | 1.01 | [0.95–1.08] | 1.01 | [0.95–1.07] | 1.01 | [0.95–1.07] | ||
| Construction | 1.01 | [0.93–1.09] | 1.01 | [0.93–1.09] | 1.01 | [0.93–1.09] | ||
| Transport | 0.99 | [0.90–1.08] | 0.99 | [0.90–1.08] | 0.99 | [0.90–1.08] | ||
| Commerce and hospitality | 1.02 | [0.97–1.08] | 1.02 | [0.97–1.08] | 1.02 | [0.97–1.08] | ||
| Financial services | 1.02 | [0.95–1.09] | 1.02 | [0.95–1.09] | 1.02 | [0.95–1.09] | ||
| Other services | Reference | Reference | Reference | |||||
| Public administration | 1.01 | [0.95–1.07] | 1.01 | [0.95–1.07] | 1.01 | [0.95–1.07] | ||
| Education | 1.05 * | [1.00–1.11] | 1.06 * | [1.01–1.11] | 1.06 * | [1.01–1.11] | ||
| Health | 0.97 | [0.92–1.03] | 0.98 | [0.93–1.03] | 0.98 | [0.93–1.03] | ||
| Company size | ||||||||
| <10 employees | Reference | Reference | Reference | |||||
| 10–249 employees | 0.97 | [0.92–1.01] | 0.96 | [0.92–1.01] | 0.97 | [0.92–1.01] | ||
| 250+ employees | 0.98 | [0.92–1.04] | 0.98 | [0.92–1.04] | 0.98 | [0.92–1.04] | ||
| Number of health events | ||||||||
| 10+ | 0.91 * | [0.85–0.98] | 0.91 * | [0.85–0.98] | 0.91 * | [0.85–0.98] | ||
| Perceived job insecurity | ||||||||
| Yes | 1.09 ** | [1.03–1.15] | 1.09 ** | [1.03–1.15] | ||||
| Interaction contract x age | ||||||||
| Temporary (≥1 year) x 30–49 years | 1.09 | [0.98–1.21] | ||||||
| Temporary (≥1 year) x 50–65 years | 1.17 * | [1.03–1.33] | ||||||
| Temporary (<1 year) x 30–49 years | 1.08 | [0.95–1.23] | ||||||
| Temporary (<1 year) x 50–65 years | 1.18 | [0.95–1.47] | ||||||
| No contract/other x 30–49 years | 1.04 | [0.92–1.18] | ||||||
| No contract/other x 50–65 years | 1.11 | [0.96–1.30] | ||||||
| (Intercept) | 0.34 *** | [0.30–0.39] | 0.31 *** | [0.26–0.38] | 0.31 *** | [0.26–0.38] | 0.32 *** | [0.26–0.39] |
| Median Rate Ratio (MRR) | 1.38 | 1.38 | 1.39 | 1.39 | ||||
| Model information | ||||||||
| −2logpseudolikelihood | 28325.3 | 28180.5 | 28173.5 | 28170.7 | ||||
| Deviance to Nullmodel (%) | −0.07 | −0.59 | −0.61 | −0.62 | ||||
| Wald test | p < 0.001 | p < 0.001 | p = 0.002 | p = 0.129 | ||||
| Individuals | 20,240 | 20,240 | 20,240 | 20,240 | ||||
| Countries | 33 | 33 | 33 | 33 | ||||
| Variable | PP > 0 a | PP > 0 a | PP = 1 a | PP = 1 a | ||||
|---|---|---|---|---|---|---|---|---|
| PR | 95% CI | PR | 95% CI | PR | 95% CI | PR | 95% CI | |
| Type of working contract | ||||||||
| Permanent | Reference | Reference | Reference | Reference | ||||
| Temporary (≥1 year) | 1.07 * | [1.00–1.15] | 1.05 | [0.93–1.19] | 1.14 * | [1.02–1.27] | 0.99 | [0.81–1.21] |
| Temporary (<1 year) | 1.18 ** | [1.06–1.33] | 1.12 | [0.92–1.37] | 1.41 *** | [1.21–1.65] | 1.29 | [0.97–1.71] |
| No contract/other | 1.05 | [0.97–1.14] | 1.01 | [0.87–1.18] | 1.02 | [0.90–1.17] | 0.87 | [0.67–1.12] |
| Sex | ||||||||
| Women | 1.09 *** | [1.04–1.13] | 1.09 *** | [1.04–1.13] | 1.06 | [0.99–1.14] | 1.06 | [0.99–1.14] |
| Age | ||||||||
| 15–29 years | Reference | Reference | Reference | Reference | ||||
| 30–49 years | 1 | [0.93–1.04] | 1 | [0.91–1.04] | 1.04 | [0.95–1.14] | 0.97 | [0.87–1.09] |
| 50–65 years | 0.93 * | [0.87–1.00] | 0.91 * | [0.84–0.98] | 1.04 | [0.93–1.16] | 0.97 | [0.85–1.10] |
| Job tenure | 1.01 | [0.98–1.04] | 1.01 | [0.98–1.04] | 1.09 ** | [1.03–1.14] | 1.09 *** | [1.04–1.15] |
| Job tenure 2 | 1.00 | [0.98–1.01] | 1.00 | [0.98–1.01] | 1.00 | [0.97–1.03] | 1.00 | [0.97–1.03] |
| Weekly working hours | 1.05 *** | [1.03–1.07] | 1.05 *** | [1.03–1.07] | 1.08 *** | [1.05–1.11] | 1.08 *** | [1.05–1.12] |
| Weekly working hours 2 | 1.02 *** | [1.01–1.03] | 1.02 *** | [1.01–1.03] | 1.05 *** | [1.04–1.06] | 1.05 *** | [1.04–1.06] |
| Income | 0.98 | [0.95–1.01] | 0.98 | [0.95–1.01] | 0.93 ** | [0.89–0.98] | 0.93 ** | [0.89–0.98] |
| Income 2 | 1.00 | [1.00–1.00] | 1.00 | [1.00–1.00] | 1.00 ** | [1.00–1.00] | 1.00 ** | [1.00–1.00] |
| Occupational position | ||||||||
| Blue collar workers | Reference | Reference | Reference | Reference | ||||
| White collar workers | 1.04 | [0.97–1.10] | 1.04 | [0.97–1.10] | 0.97 | [0.88–1.08] | 0.97 | [0.88–1.08] |
| Intermediates and lower supervisory | 1.05 | [0.98–1.12] | 1.05 | [0.98–1.12] | 0.98 | [0.88–1.09] | 0.98 | [0.89–1.09] |
| Managers and professionals | 1.13 *** | [1.07–1.20] | 1.13 *** | [1.07–1.20] | 1.05 | [0.96–1.15] | 1.05 | [0.96–1.16] |
| Company size | ||||||||
| <10 | Reference | Reference | Reference | Reference | ||||
| 10–249 | 1.01 | [0.97–1.06] | 1.01 | [0.97–1.06] | 0.92 * | [0.85–0.99] | 0.92 * | [0.86–0.99] |
| 250+ | 1.05 | [0.99–1.11] | 1.05 | [0.99–1.11] | 0.90 | [0.82–1.00] | 0.90 | [0.82–1.00] |
| Number of health events | ||||||||
| 10+ | 1.30 *** | [1.25–1.35] | 1.30 *** | [1.25–1.35] | 0.41 *** | [0.38–0.44] | 0.41 *** | [0.38–0.44] |
| Interaction contract x age | ||||||||
| Temporary (≥1 year) x 30–49 years | 1.00 | [0.86–1.16] | 1.17 | [0.92–1.50] | ||||
| Temporary (≥1 year) x 50–65 years | 1.11 | [0.92–1.34] | 1.27 | [0.94–1.72] | ||||
| Temporary (<1 year) x 30–49 years | 1.06 | [0.83–1.36] | 1.08 | [0.76–1.52] | ||||
| Temporary (<1 year) x 50–65 years | 1.14 | [0.81–1.60] | 1.31 | [0.83–2.07] | ||||
| No contract/other x 30–49 years | 1.02 | [0.85–1.22] | 1.25 | [0.93–1.69] | ||||
| No contract/other x 50–65 years | 1.11 | [0.90–1.35] | 1.24 | [0.88–1.74] | ||||
| (Intercept) | 0.42 *** | [0.37–0.49] | 0.43 *** | [0.37–0.49] | 0.24 *** | [0.19–0.29] | 0.25 *** | [0.20–0.31] |
| Model information | ||||||||
| −2loglikelihood | 35123.3 | 35435.5 | 20577.8 | 21375.6 | ||||
| Deviance (%) | −0.88 | 0.89 | −3.73 | −3.76 | ||||
| Likelihood-ratio test | p < 0.001 | p = 0.823 | p < 0.001 | p = 0.509 | ||||
| Individuals | 20,240 | 20,240 | 20,240 | 20,240 | ||||
| Countries | 33 | 33 | 33 | 33 | ||||
References
- Miraglia, M.; Johns, G. Going to Work Ill: A Meta-Analysis of the Correlates of Presenteeism and a Dual-Path Model. J. Occup. Health Psychol. 2016, 21, 261–283. [Google Scholar] [CrossRef] [PubMed]
- Johns, G. Presenteeism in the workplace: A review and research agenda. J. Organ. Behav. 2010, 31, 519–542. [Google Scholar] [CrossRef]
- Collins, J.J.; Baase, C.M.; Sharda, C.E.; Ozminkowski, R.J.; Nicholson, S.; Billotti, G.M.; Turpin, R.S.; Olson, M.; Berger, M.L. The assessment of chronic health conditions on work performance, absence, and total economic impact for employers. J. Occup. Environ. Med. 2005, 47, 547–557. [Google Scholar] [CrossRef] [PubMed]
- Johns, G. Attendance Dynamics at Work: The Antecedents and Correlates of Presenteeism, Absenteeism, and Productivity Loss. J. Occup. Health Psychol. 2011, 16, 483–500. [Google Scholar] [CrossRef]
- Skagen, K.; Collins, A.M. The consequences of sickness presenteeism on health and wellbeing over time: A systematic review. Soc. Sci. Med. 2016, 161, 169–177. [Google Scholar] [CrossRef] [PubMed] [Green Version]
- Gustafsson, K.; Marklund, S. Consequences of sickness presence and sickness absence on health and work ability: A Swedish prospective cohort study. Int. J. Occup. Med. Environ. Health 2011, 24, 145–150. [Google Scholar] [CrossRef] [PubMed]
- Gustafsson, K.; Marklund, S. Associations between health and combinations of sickness presence and absence. Occup. Med. (Chic. Ill). 2014, 64, 49–55. [Google Scholar] [CrossRef]
- Kivimäki, M.; Head, J.; Ferrie, J.E.; Hemingway, H.; Shipley, M.J.; Vahtera, J.; Marmot, M.G. Working while III as a risk factor for serious coronary events: The whitehall II study. Am. J. Public Health 2005, 95, 98–102. [Google Scholar] [CrossRef]
- Widera, E.; Chang, A.; Chen, H.L. Presenteeism: A Public Health Hazard. J. Gen. Intern. Med. 2010, 25, 1244–1247. [Google Scholar] [CrossRef] [Green Version]
- Leineweber, C.; Westerlund, H.; Hagberg, J.; Svedberg, P.; Luokkala, M.; Alexanderson, K. Sickness presenteeism among Swedish police officers. J. Occup. Rehabil. 2011, 21, 17–22. [Google Scholar] [CrossRef] [PubMed]
- Hansen, C.D.; Andersen, J.H. Going ill to work—What personal circumstances, attitudes and work-related factors are associated with sickness presenteeism? Soc. Sci. Med. 2008, 67, 956–964. [Google Scholar] [CrossRef] [PubMed]
- Aronsson, G.; Gustafsson, K.; Dallner, M. Sick but yet at work. An empirical study of sickness presenteeism. J. Epidemiol. Community Health 2000, 54, 502–509. [Google Scholar] [CrossRef] [PubMed] [Green Version]
- Aronsson, G.; Gustafsson, K. Sickness presenteeism: Prevalence, attendance-pressure factors, and an outline of a model for research. J. Occup. Environ. Med. 2005, 47, 958–966. [Google Scholar] [CrossRef]
- Eurofound. Health and Well-being at Work: A Report Based on the Fifth European Working Conditions Survey; Eurofound: Dublin, Ireland, 2012. [Google Scholar]
- Chartered Institute of Personnel and Development. Survey Report. Health & Wellbeing at Work; Chartered Institute of Personnel and Development: London, UK, 2018. [Google Scholar]
- Kinman, G. Sickness presenteeism at work: Prevalence, costs and management. Br. Med. Bull. 2019, 129, 69–78. [Google Scholar] [CrossRef] [PubMed]
- Vahtera, J.; Kivimäki, M.; Pentti, J.; Linna, A.; Virtanen, M.; Virtanen, P.; Ferrie, J.E. Organisational downsizing, sickness absence, and mortality: 10-Town prospective cohort study. BMJ 2004, 328, 1–5. [Google Scholar] [CrossRef] [PubMed]
- Caverley, N.; Barton Cunningham, J.; MacGregor, J.N. Sickness presenteeism, sickness absenteeism, and health following restructuring in a public service organization. J. Manag. Stud. 2007, 44, 304–319. [Google Scholar] [CrossRef]
- Heponiemi, T.; Elovainio, M.; Pentti, J.; Virtanen, M.; Westerlund, H.; Virtanen, P.; Oksanen, T.; Kivimäki, M.; Vahtera, J. Association of contractual and subjective job insecurity with sickness presenteeism among public sector employees. J. Occup. Environ. Med. 2010, 52, 830–835. [Google Scholar] [CrossRef]
- Janssens, H.; Braeckman, L.; De Clercq, B.; De Bacquer, D.; Clays, E. The relation between indicators of low employment quality and attendance behavior in countries of the European Union. J. Public Health (Bangkok). 2016, 39, e127–e133. [Google Scholar] [CrossRef]
- Kim, J.Y.; Lee, J.; Muntaner, C.; Kim, S.-S. Who is working while sick? Nonstandard employment and its association with absenteeism and presenteeism in South Korea. Int. Arch. Occup. Environ. Health 2016, 89, 1095–1101. [Google Scholar] [CrossRef]
- Gerich, J. Sick at work: Methodological problems with research on workplace presenteeism. Heal. Serv. Outcomes Res. Methodol. 2015, 15, 37–53. [Google Scholar] [CrossRef]
- Taloyan, M.; Aronsson, G.; Leineweber, C.; Magnusson Hanson, L.; Alexanderson, K.; Westerlund, H. Sickness Presenteeism Predicts Suboptimal Self-Rated Health and Sickness Absence: A Nationally Representative Study of the Swedish Working Population. PLoS ONE 2012, 7, e44721. [Google Scholar] [CrossRef] [PubMed]
- Virtanen, M.; Kivimäki, M.; Elovainio, M.; Vahtera, J.; Ferrie, J.E. From insecure to secure employment: Changes in work, health, health related behaviours, and sickness absence. Occup. Environ. Med. 2003, 60, 948–953. [Google Scholar] [CrossRef] [PubMed]
- McMichael, A.J. Standardized mortality ratios and the “healthy worker effect”: Scratching beneath the surface. J. Occup. Med. 1976, 18, 165–168. [Google Scholar] [CrossRef]
- Gerich, J. Determinants of presenteeism prevalence and propensity: Two sides of the same coin? Arch. Environ. Occup. Health 2016, 71, 189–198. [Google Scholar] [CrossRef] [PubMed]
- Gerich, J. Sickness presence, sick leave and adjustment latitude. Int. J. Occup. Med. Environ. Health 2014, 27, 736–746. [Google Scholar] [CrossRef] [Green Version]
- European Foundation for the Improvement of Living and Working Conditions. Young People and Temporary Employment in Europe; Eurofound: Dublin, Ireland, 2013. [Google Scholar]
- Blossfeld, H.P.; Klijzing, E.; Mills, M.; Kurz, K. Globalization, uncertainty and the early life course. A theoretical framework. In Globalization, Uncertainty and Youth in Society; Blossfeld, H.P., Klijzing, E., Mills, M., Eds.; Routledge: Abington, Thames, UK, 2005; pp. 2–24. ISBN 0203003209. [Google Scholar]
- Dragano, N.; Barbaranelli, C.; Reuter, M.; Wahrendorf, M.; Wright, B.; Ronchetti, M.; Buresti, G.; Di Tecco, C.; Iavicoli, S. Young workers’ access to and awareness of occupational safety and health services: Age-differences and possible drivers in a large survey of employees in Italy. Int. J. Environ. Res. Public Health 2018, 15, 1511. [Google Scholar] [CrossRef]
- European Foundation for the Improvement of Living and Working Conditions. European Working Conditions Survey, 2015. [Data Collection], 4th ed.; Eurofound: Dublin, Ireland, 2017. [Google Scholar]
- Eurofound. 6th European Working Conditions Survey—Technical Report; Eurofound: Dublin, Ireland, 2015. [Google Scholar]
- Garrow, V. Presenteeism: A Review of Current Thinking; Institute for Employment Studies: Brighton, UK, 2016. [Google Scholar]
- Little, R.J.A. A Test of Missing Completely at Random for Multivariate Data with Missing Values. J. Am. Stat. Assoc. 1988, 83, 1198–1202. [Google Scholar] [CrossRef]
- Rubin, D.B. Multiple Imputation for Nonresponse in Surveys; John Wiley & Sons: New York, NY, USA, 1987; ISBN 9780470316696. [Google Scholar]
- Papke, L.E.; Wooldridge, J.M. Econometric methods for fractional response variables with an application to 401 (k) plan participation rates. J. Appl. Econom. 1996, 11, 619–632. [Google Scholar] [CrossRef]
- Zou, G. A Modified Poisson Regression Approach to Prospective Studies with Binary Data. Am. J. Epidemiol. 2004, 159, 702–706. [Google Scholar] [CrossRef]
- Austin, P.C.; Stryhn, H.; Leckie, G.; Merlo, J. Measures of clustering and heterogeneity in multilevel Poisson regression analyses of rates/count data. Stat. Med. 2018, 37, 572–589. [Google Scholar] [CrossRef] [PubMed]
- Korn, E.L.; Graubard, B.I. Simultaneous Testing of Regression Coefficients with Complex Survey Data: Use of Bonferroni t Statistics. Am. Stat. 1990, 44, 270. [Google Scholar] [CrossRef]
- Biron, C.; Brun, J.; Ivers, H.; Cooper, C. At work but ill: Psychosocial work environment and well-being determinants of presenteeism propensity. J. Public Ment. Health 2006, 5, 26–37. [Google Scholar] [CrossRef]
- Johns, G. Reflections on the 2016 Decade Award: Incorporating Context in Organizational Research. Acad. Manag. Rev. 2017, 42, 577–595. [Google Scholar] [CrossRef]
- Spasova, S.; Bouget, D.; Vanhercke, B. Sick Pay and Sickness Benefit Schemes in the European Union. Background Report for the Social Protection Committee’s In-depth Review on Sickness Benefits; European Commission: Brussels, Belgium, 2016. [Google Scholar]


| Variable | Categories or Range | In Study (≥1 Health Event) | Not in Study (No Health Event) | ||
|---|---|---|---|---|---|
| N/(Mean) | %/(±SD) | N/(Mean) | %/(±SD) | ||
| Type of working contract | Permanent | 16,529 | 81.7 | 7978 | 74.5 |
| Temporary (≥1 year) | 1808 | 8.9 | 1189 | 11.1 | |
| Temporary (<1 year) | 480 | 2.4 | 576 | 5.4 | |
| No contract/other | 1423 | 7.0 | 960 | 9.0 | |
| Perceived job insecurity | No | 16,985 | 83.9 | 8935 | 83.5 |
| Yes | 3255 | 16.1 | 1768 | 16.5 | |
| Sex | Men | 9439 | 46.6 | 5596 | 52.3 |
| Women | 10,801 | 53.4 | 5107 | 47.7 | |
| Age | 15–29 years | 3267 | 16.1 | 2126 | 19.9 |
| 30–49 years | 10,802 | 53.4 | 5394 | 50.4 | |
| 50–65 years | 6171 | 30.5 | 3183 | 29.7 | |
| Job tenure (years) | 0–50 | (10.0) | (±9.4) | (8.9) | (±9.6) |
| Weekly working hours | 10–105 | (38.8) | (±9.7) | (38.5) | (±10.1) |
| Income (% of country median) | 1–2750 | (121.6) | (±75.1) | (119.8) | (±75.0) |
| Occupational position (ESeC) | Blue-collar workers | 5311 | 26.2 | 3308 | 30.9 |
| White-collar workers | 4236 | 20.9 | 2576 | 24.1 | |
| Intermediates, low. supervisory | 2818 | 13.9 | 1367 | 12.8 | |
| Managers and professionals | 7875 | 38.9 | 3452 | 32.3 | |
| Working sector (NACE) | Agriculture | 309 | 1.5 | 251 | 2.3 |
| Industry | 3428 | 16.9 | 1910 | 17.8 | |
| Construction | 1204 | 5.9 | 736 | 6.9 | |
| Transport | 1212 | 6.0 | 687 | 6.4 | |
| Commerce and hospitality | 3748 | 18.5 | 2353 | 22.0 | |
| Financial services | 812 | 4.0 | 292 | 2.7 | |
| Other services | 3458 | 17.1 | 1812 | 16.9 | |
| Public administration | 1439 | 7.1 | 698 | 6.5 | |
| Education | 2180 | 10.8 | 963 | 9.0 | |
| Health | 2450 | 12.1 | 1001 | 9.4 | |
| Company size | <10 employees | 5505 | 27.2 | 3658 | 34.2 |
| 10–249 employees | 11,263 | 55.6 | 5690 | 53.2 | |
| 250+ employees | 3472 | 17.2 | 1355 | 12.7 | |
| Sickness absenteeism (SA) | 0–70 days | (7.4) | (±11.2) | (0.0) | (±0.0) |
| Sickness presenteeism (SP) | 0–70 days | (4.2) | (±7.5) | (0.0) | (±0.0) |
| Health events (HE = SA + SP) | 1–130 days | (11.6) | (±14.3) | (0.0) | (±0.0) |
| Presenteeism propensity (PP = SP/HE) | 0-1 | (0.39) | (±0.41) | ||
| PP = 0 | 8532 | 42.2 | |||
| PP > 0 | 11,708 | 57.8 | |||
| PP > 0.50 | 7167 | 35.4 | |||
| PP = 1 | 4376 | 21.6 | |||
| Sample size | 20,240 | 100.0 | 10,703 | 100.0 | |
| Variable | 15–29 Years N = 3267 | 30–49 Years N = 10,802 | 50–65 Years N = 6171 | ||||||
|---|---|---|---|---|---|---|---|---|---|
| % | Mean | SD | % | Mean | SD | % | Mean | SD | |
| Type of working contract | |||||||||
| Permanent | 65.1 | 0.37 | ±0.40 | 83.3 | 0.39 | ±0.40 | 87.7 | 0.37 | ±0.40 |
| Temporary (≥1 year) | 17.7 | 0.40 | ±0.40 | 8.4 | 0.42 | ±0.42 | 5.3 | 0.39 | ±0.42 |
| Temporary (<1 year) | 4.6 | 0.54 | ±0.43 | 2.4 | 0.58 | ±0.43 | 1.2 | 0.55 | ±0.44 |
| No contract/other | 12.7 | 0.36 | ±0.40 | 6.0 | 0.37 | ±0.41 | 5.8 | 0.39 | ±.040 |
| Perceived job insecurity | |||||||||
| No | 81.5 | 0.37 | ±0.40 | 84.4 | 0.39 | ±0.40 | 84.5 | 0.37 | ±0.41 |
| Yes | 18.5 | 0.44 | ±0.40 | 15.7 | 0.43 | ±0.41 | 15.5 | 0.38 | ±0.41 |
| Sex | |||||||||
| Men | 49.3 | 0.37 | ±0.40 | 46.6 | 0.38 | ±0.41 | 45.3 | 0.35 | ±0.41 |
| Women | 50.7 | 0.40 | ±0.40 | 53.4 | 0.41 | ±0.40 | 54.7 | 0.39 | ±0.41 |
| Job tenure | |||||||||
| <1 year | 23.7 | 0.39 | ±0.42 | 7.5 | 0.45 | ±0.44 | 3.4 | 0.38 | ±0.43 |
| 1–10 years | 75.5 | 0.39 | ±0.40 | 61.3 | 0.38 | ±0.40 | 35.4 | 0.36 | ±0.40 |
| >10 years | 0.9 | 0.32 | ±0.42 | 31.2 | 0.42 | ±0.41 | 61.2 | 0.38 | ±0.41 |
| Weekly working hours | |||||||||
| 10–24 h | 11.0 | 0.47 | ±0.43 | 8.4 | 0.46 | ±0.42 | 10.4 | 0.41 | ±0.42 |
| 25–39 h | 27.1 | 0.39 | ±0.40 | 28.7 | 0.40 | ±0.39 | 31.7 | 0.36 | ±0.39 |
| 40–54 h | 54.9 | 0.36 | ±0.39 | 57.3 | 0.38 | ±0.41 | 54.1 | 0.36 | ±0.41 |
| 55+ hours | 7.0 | 0.42 | ±0.43 | 5.6 | 0.49 | ±0.42 | 3.8 | 0.52 | ±0.43 |
| Income (% of country median) | |||||||||
| <60% | 14.2 | 0.44 | ±0.42 | 7.1 | 0.47 | ±0.43 | 8.1 | 0.43 | ±0.43 |
| 60–99% | 41.2 | 0.38 | ±0.40 | 28.8 | 0.39 | ±0.41 | 29.0 | 0.36 | ±0.40 |
| 100–150% | 32.4 | 0.39 | ±0.40 | 41.4 | 0.39 | ±0.40 | 39.7 | 0.35 | ±0.40 |
| >150% | 12.2 | 0.35 | ±0.40 | 22.7 | 0.40 | ±0.41 | 23.3 | 0.40 | ±0.42 |
| Occupational position (ESeC) | |||||||||
| Blue-collar workers | 23.9 | 0.35 | ±0.40 | 25.5 | 0.36 | ±0.41 | 28.7 | 0.31 | ±0.40 |
| White-collar workers | 30.3 | 0.38 | ±0.41 | 19.5 | 0.37 | ±0.41 | 18.5 | 0.38 | ±0.40 |
| Intermediates and lower supervisory | 14.0 | 0.39 | ±0.41 | 14.1 | 0.38 | ±0.41 | 13.6 | 0.35 | ±0.40 |
| Managers and professionals | 31.8 | 0.42 | ±0.40 | 40.9 | 0.43 | ±0.40 | 39.2 | 0.42 | ±0.41 |
| Working sector (NACE) | |||||||||
| Agriculture | 1.5 | 0.40 | ±0.41 | 1.4 | 0.34 | ±0.40 | 1.8 | 0.32 | ±0.40 |
| Industry | 15.1 | 0.35 | ±0.40 | 17.3 | 0.37 | ±0.41 | 17.3 | 0.34 | ±0.40 |
| Construction | 6.2 | 0.33 | ±0.39 | 5.8 | 0.36 | ±0.40 | 6.1 | 0.34 | ±0.41 |
| Transport | 4.6 | 0.37 | ±0.40 | 6.1 | 0.39 | ±0.41 | 6.6 | 0.32 | ±0.40 |
| Commerce and hospitality | 28.5 | 0.40 | ±0.42 | 18.4 | 0.39 | ±0.42 | 13.5 | 0.36 | ±0.41 |
| Financial services | 3.2 | 0.48 | ±0.38 | 4.4 | 0.39 | ±0.40 | 3.8 | 0.43 | ±0.43 |
| Other services | 20.7 | 0.38 | ±0.40 | 17.3 | 0.41 | ±0.41 | 14.8 | 0.38 | ±0.40 |
| Public administration | 4.4 | 0.30 | ±0.36 | 7.1 | 0.41 | ±0.39 | 8.5 | 0.40 | ±0.42 |
| Education | 6.8 | 0.43 | ±0.39 | 10.5 | 0.45 | ±0.40 | 13.3 | 0.41 | ±0.41 |
| Health | 9.1 | 0.44 | ±0.39 | 11.8 | 0.41 | ±0.40 | 14.3 | 0.39 | ±0.39 |
| Company size | |||||||||
| <10 employees | 35.2 | 0.37 | ±0.42 | 26.6 | 0.39 | ±0.42 | 24.1 | 0.36 | ±0.42 |
| 10–249 employees | 51.1 | 0.39 | ±0.40 | 55.7 | 0.39 | ±0.40 | 57.9 | 0.37 | ±0.40 |
| 250+ employees | 13.7 | 0.40 | ±0.39 | 17.7 | 0.42 | ±0.39 | 18.0 | 0.40 | ±0.40 |
| Number of health events | |||||||||
| 1–9 | 69.5 | 0.39 | ±0.43 | 62.3 | 0.41 | ±0.43 | 56.4 | 0.40 | ±0.44 |
| 10+ | 30.6 | 0.37 | ±0.35 | 37.7 | 0.38 | ±0.35 | 43.6 | 0.34 | ±0.36 |
| Total | 100.0 | 0.39 | ±0.40 | 100.0 | 0.40 | ±0.41 | 100.0 | 0.37 | ±0.41 |
| Variable | 15–29 Years | 30–49 Years | 50–65 Years | |||
|---|---|---|---|---|---|---|
| RR | 95% CI | RR | 95% CI | RR | 95% CI | |
| Type of working contract | ||||||
| Permanent | Reference | Reference | Reference | |||
| Temporary (≥1 year) | 1.04 | [0.94–1.15] | 1.12 ** | [1.03–1.21] | 1.18 ** | [1.05–1.33] |
| Temporary (<1 year) | 1.27 ** | [1.07–1.51] | 1.29 *** | [1.16–1.42] | 1.41 ** | [1.14–1.74] |
| No contract/other | 1.00 | [0.83–1.19] | 1.06 | [0.96–1.16] | 1.12 | [1.00–1.26] |
| Individuals | 3267 | 10,802 | 6171 | |||
| Countries | 33 | 33 | 33 | |||
| Variable | Unadjusted | M1 | M2 | M3 | ||||
|---|---|---|---|---|---|---|---|---|
| RR | 95% CI | RR | 95% CI | RR | 95% CI | RR | 95% CI | |
| Type of working contract | ||||||||
| Permanent | Reference | Reference | Reference | Reference | ||||
| Temporary (≥1 year) | 1.11 ** | [1.03–1.18] | 1.11 *** | [1.05–1.18] | 1.09 ** | [1.03–1.16] | 1.02 | [0.92–1.12] |
| Temporary (<1 year) | 1.28 *** | [1.15–1.41] | 1.29 *** | [1.17–1.42] | 1.24 *** | [1.13–1.37] | 1.16 * | [1.01–1.34] |
| No contract/other | 1.09 | [0.98–1.21] | 1.07 | [0.97–1.19] | 1.07 | [0.97–1.18] | 1.01 | [0.86–1.20] |
| Age | ||||||||
| 15–29 years | Reference | Reference | Reference | |||||
| 30–49 years | 1.01 | [0.96–1.05] | 1.00 | [0.96–1.05] | 0.98 | [0.93–1.03] | ||
| 50–65 years | 0.95 | [0.90–1.02] | 0.95 | [0.89–1.01] | 0.91 ** | [0.85–0.98] | ||
| Perceived job insecurity | ||||||||
| Yes | 1.09 ** | [1.03–1.15] | 1.09 ** | [1.03–1.15] | ||||
| Interaction contract x age | ||||||||
| Temporary (≥1 year) x 30–49 years | 1.09 | [0.98–1.21] | ||||||
| Temporary (≥1 year) x 50–65 years | 1.17 * | [1.03–1.33] | ||||||
| Temporary (<1 year) x 30–49 years | 1.08 | [0.95–1.23] | ||||||
| Temporary (<1 year) x 50–65 years | 1.18 | [0.95–1.47] | ||||||
| No contract/other x 30–49 years | 1.04 | [0.92–1.18] | ||||||
| No contract/other x 50–65 years | 1.11 | [0.96–1.30] | ||||||
| (Intercept) | 0.34 *** | [0.30–0.39] | 0.31 *** | [0.26–0.38] | 0.31 *** | [0.26–0.38] | 0.32 *** | [0.26–0.39] |
| Median Rate Ratio (MRR) | 1.38 | 1.38 | 1.39 | 1.39 | ||||
| Model information | ||||||||
| −2logpseudolikelihood | 28,325.3 | 28,180.5 | 28,173.5 | 28,170.7 | ||||
| Deviance (%) | −0.07 | −0.59 | −0.61 | −0.62 | ||||
| Wald test | p < 0.001 | p < 0.001 | p = 0.002 | p = 0.129 | ||||
| Individuals | 20,240 | 20,240 | 20,240 | 20,240 | ||||
| Countries | 33 | 33 | 33 | 33 | ||||
© 2019 by the authors. Licensee MDPI, Basel, Switzerland. This article is an open access article distributed under the terms and conditions of the Creative Commons Attribution (CC BY) license (http://creativecommons.org/licenses/by/4.0/).
Share and Cite
Reuter, M.; Wahrendorf, M.; Di Tecco, C.; Probst, T.M.; Ruhle, S.; Ghezzi, V.; Barbaranelli, C.; Iavicoli, S.; Dragano, N. Do Temporary Workers More Often Decide to Work While Sick? Evidence for the Link between Employment Contract and Presenteeism in Europe. Int. J. Environ. Res. Public Health 2019, 16, 1868. https://doi.org/10.3390/ijerph16101868
Reuter M, Wahrendorf M, Di Tecco C, Probst TM, Ruhle S, Ghezzi V, Barbaranelli C, Iavicoli S, Dragano N. Do Temporary Workers More Often Decide to Work While Sick? Evidence for the Link between Employment Contract and Presenteeism in Europe. International Journal of Environmental Research and Public Health. 2019; 16(10):1868. https://doi.org/10.3390/ijerph16101868
Chicago/Turabian StyleReuter, Marvin, Morten Wahrendorf, Cristina Di Tecco, Tahira M. Probst, Sascha Ruhle, Valerio Ghezzi, Claudio Barbaranelli, Sergio Iavicoli, and Nico Dragano. 2019. "Do Temporary Workers More Often Decide to Work While Sick? Evidence for the Link between Employment Contract and Presenteeism in Europe" International Journal of Environmental Research and Public Health 16, no. 10: 1868. https://doi.org/10.3390/ijerph16101868