Article

Heavy Metals in Suspended Particulate Matter of the Zhujiang River, Southwest China: Contents, Sources, and Health Risks

1
Institute of Earth Sciences, China University of Geosciences (Beijing), Beijing 100083, China
2
Key Laboratory of Karst Environment and Geohazard, Ministry of Land and Resources, Guizhou University, Guiyang 550025, China
3
State Key Laboratory of Environmental Geochemistry, Institute of Geochemistry, Chinese Academy of Sciences, Guiyang 550081, China
*
Author to whom correspondence should be addressed.
Int. J. Environ. Res. Public Health 2019, 16(10), 1843; https://doi.org/10.3390/ijerph16101843
Submission received: 20 April 2019 / Revised: 14 May 2019 / Accepted: 22 May 2019 / Published: 24 May 2019

Abstract

:
To investigate the abundance, water/particle interaction behavior, sources, and potential risk of heavy metals in suspended particulate matter (SPM), a total of 22 SPM samples were collected from the Zhujiang River, Southwest China, in July 2014 (wet season). Nine heavy metal(loid)s (V, Cr, Mn, Ni, Cu, Zn, As, Cd and Pb) in SPM were detected. The results show that the selected heavy metal(loid)s in SPM appear in the following order: Mn (982.4 mg kg−1) > Zn (186.8 mg kg−1) > V (143.6 mg kg−1) > Cr (129.1 mg kg−1) > As (116.8 mg kg−1) > Cu (44.1 mg kg−1) > Ni (39.9 mg kg−1) > Pb (38.1 mg kg−1) > Cd (3.8 mg kg−1). Furthermore, both the enrichment factor (EF) and geo-accumulation index (Igeo) indicate that SPM is extremely enriched in metal(loid)s of Cd and As, while SPM is slightly enriched, or not enriched, in other heavy metals. According to the toxic risk index (TRI) and hazard index (HI), arsenic accounts for the majority of the SPM toxicity (TRI = 8, 48.3 ± 10.4%) and causes the primary health risk (HI > 1), and the potential risks of V and Cr are also not negligible. By applying a correlation matrix and principal component analysis (PCA), three principal components (PC) were identified and accounted for 79.19% of the total variance. PC 1 (V, Cr, Mn, Ni, Cu, and Pb) is controlled by natural origins. PC 2 (As and Cd) is mainly contributed by anthropogenic origins in the basin. PC 3 (Zn) can be attributed to mixed sources of natural and anthropogenic origins. Moreover, all the partition coefficients (lgKd) exceeded 2.9 (arithmetical mean value order: Mn > Pb > Cd > V ≈ Cu > Cr ≈ Ni), indicating the powerful adsorptive ability of SPM for these heavy metal(loid)s during water/particle interaction.

1. Introduction

Heavy metals are one of the most significant pollutants in the environment, particularly in the aquatic environment, that may cause severe deterioration of water quality and do harm to living organisms due to their toxicity, persistence, non-biodegradability, and bio-accumulation [1,2,3]. Generally, heavy metals in the aquatic system can be divided into three phases: dissolved load, suspended particulate matter (SPM), and sedimentary [4,5,6,7,8]. Although the dissolved phase is believed to be more toxic to aquatic organisms and humans, its content is usually lower than the suspended particle phase [9]. Because of the high surface area and reactivity of suspended particulate matter, the dissolved heavy metals are also easily absorbed by SPM [8,10]. Therefore, more attention has been paid to heavy metals of the suspended particle phase than those of the dissolved phase. Furthermore, as the major carrier and pre-sink of heavy metals in the fluvial environment [11], SPM in the aquatic system is not a threat for humans as a rule, but the main carrier of land materials export to the ocean [11,12]. Previous studies suggested that the bed load at estuaries accounts for less than 10% of a river’s total solids transported to the ocean and is often less than 1%, while more than 90% of solids are transported in suspension [13,14]. In addition, heavy metals in river water tend to accumulate in SPM because of its direct interface with the water, and the deposition of metal-adsorbed SPM is the primary process for the accumulation of heavy metals in bed sediments [10]. Accordingly, the contaminated surface bed sediment or deposited SPM might become re-suspended because of water flow disturbance [8,10]. This is a crucial process for the ecological risks of heavy metals across the sediment–water interface. Therefore, numerous studies regarding heavy metals in SPM, their effects on the fluvial environment, and the fluxes to the ocean have been published in various countries [4,6,11,12,15,16,17,18,19,20], including China [8,10,14,21,22,23]. A case study in the multi-anthropogenic polluted river in the Gulf of Tunis revealed that heavy metal (Pb, Cu, Zn, and Fe) pollution was mainly localized to commercial activities and fishing [4]. The study on the Tigris River showed that the dissolved phase dominated the physical speciation of many metals (low partition coefficients), but the Al, Fe, Pb, Th, and Ti exhibited high particulate fractions due to the high SPM concentration [6]. Viers et al. [11] presented a new database on the chemical composition (including heavy metals) of suspended matter in global rivers, together with the associated heavy metal fluxes, and they also give a “snap-shot” of heavy metal fluxes for each continent in order to assess the influence of human activities on natural geochemical cycles of heavy metals in different environments. A two-year monitoring data of particulate metals (Cd, Cu, Ni, Zn, Fe, Pb, Cr, and Mn) in an estuarine environment displayed no seasonal variation or any relationship with the tide, and the large input of particulate metals was attributed as probably being due to the intensive agriculture within the drainage basin [15]. Matsunaga et al. [19] explored the temporal variations in metal enrichment in SPM during rainfall events in a rural stream. In the Lerma River, particulate Fe and Mn originated predominantly from natural sources, whereas Cu, Zn, Cr, and Pb in SPM originated mainly from anthropogenic sources [16].
In terms of catchment management, identifying the contaminated level and ecological risk of heavy metals is a prerequisite for pollution remediation. Many methods (such as enrichment factor, anthropogenic metal flux, bioavailable metal index and toxic risk index) have been widely developed to evaluate the contaminated levels, anthropogenic inputs, bioavailability and toxicity of heavy metals in SPM or sediment [24]. The Zhujiang River is the largest river flowing into the South China Sea [25]; it is the major water source for a local population of about 30 million and provides important supports for the socio-economic development of southern China [26]. Since the intense anthropogenic disturbance on the Zhujiang River, several studies have been performed to investigate the heavy metal composition of the water [21,27], sediment [24,28,29,30], and SPM [8,21] in different reaches. These studies distinguished the heavy metal temporal transport of SPM in the upper reaches of the Zhujiang River and explored the partition coefficients of heavy metals between water and SPM in the tributaries of the lower reaches of the Zhujiang River. However, these studies were insufficient for obtaining a clear idea of the general status of the abundance and sources of heavy metals in SPM, and the water/particle interaction behavior of heavy metals in the Zhujiang River from a whole basin perspective. In addition, the risk assessment mainly focused on the bioavailability and toxicity of heavy metals in SPM (the major carrier and pre-sink of heavy metals) [5,8,24,28,29,31], while the health risk of human exposure has rarely been systematically reported up to now.
A previous study investigated the dissolved heavy metals in river water of the entire riverine system of the Zhujiang River [32]. However, it was impossible to get adequate SPM in all of the sites, particularly during the dry season. In the present study, an investigation on nine heavy metal(loid)s (V, Cr, Mn, Ni, Cu, Zn, As, Cd, and Pb) in 22 SPM samples in the Zhujiang River was conducted. The aims of this study were: (i) to analyze the enrichment of heavy metal(loid)s in SPM; (ii) to explore the behaviors of heavy metal(loid)s during water/particle interaction of the entire basin; (iii) to identify the sources of heavy metal(loid)s in SPM; and (iv) to assess the potential risk of heavy metal(loid)s in SPM, particularly to evaluate the health risk of human exposure firstly by referring to the U.S. EPA (Environmental Protection Agency) method. The results can be applied to increase prevention–control efficiency of heavy metal(loid) pollution as well as to prevent hazardous heavy metal(loid) pollution affecting the local people in the whole basin.

2. Materials and Methods
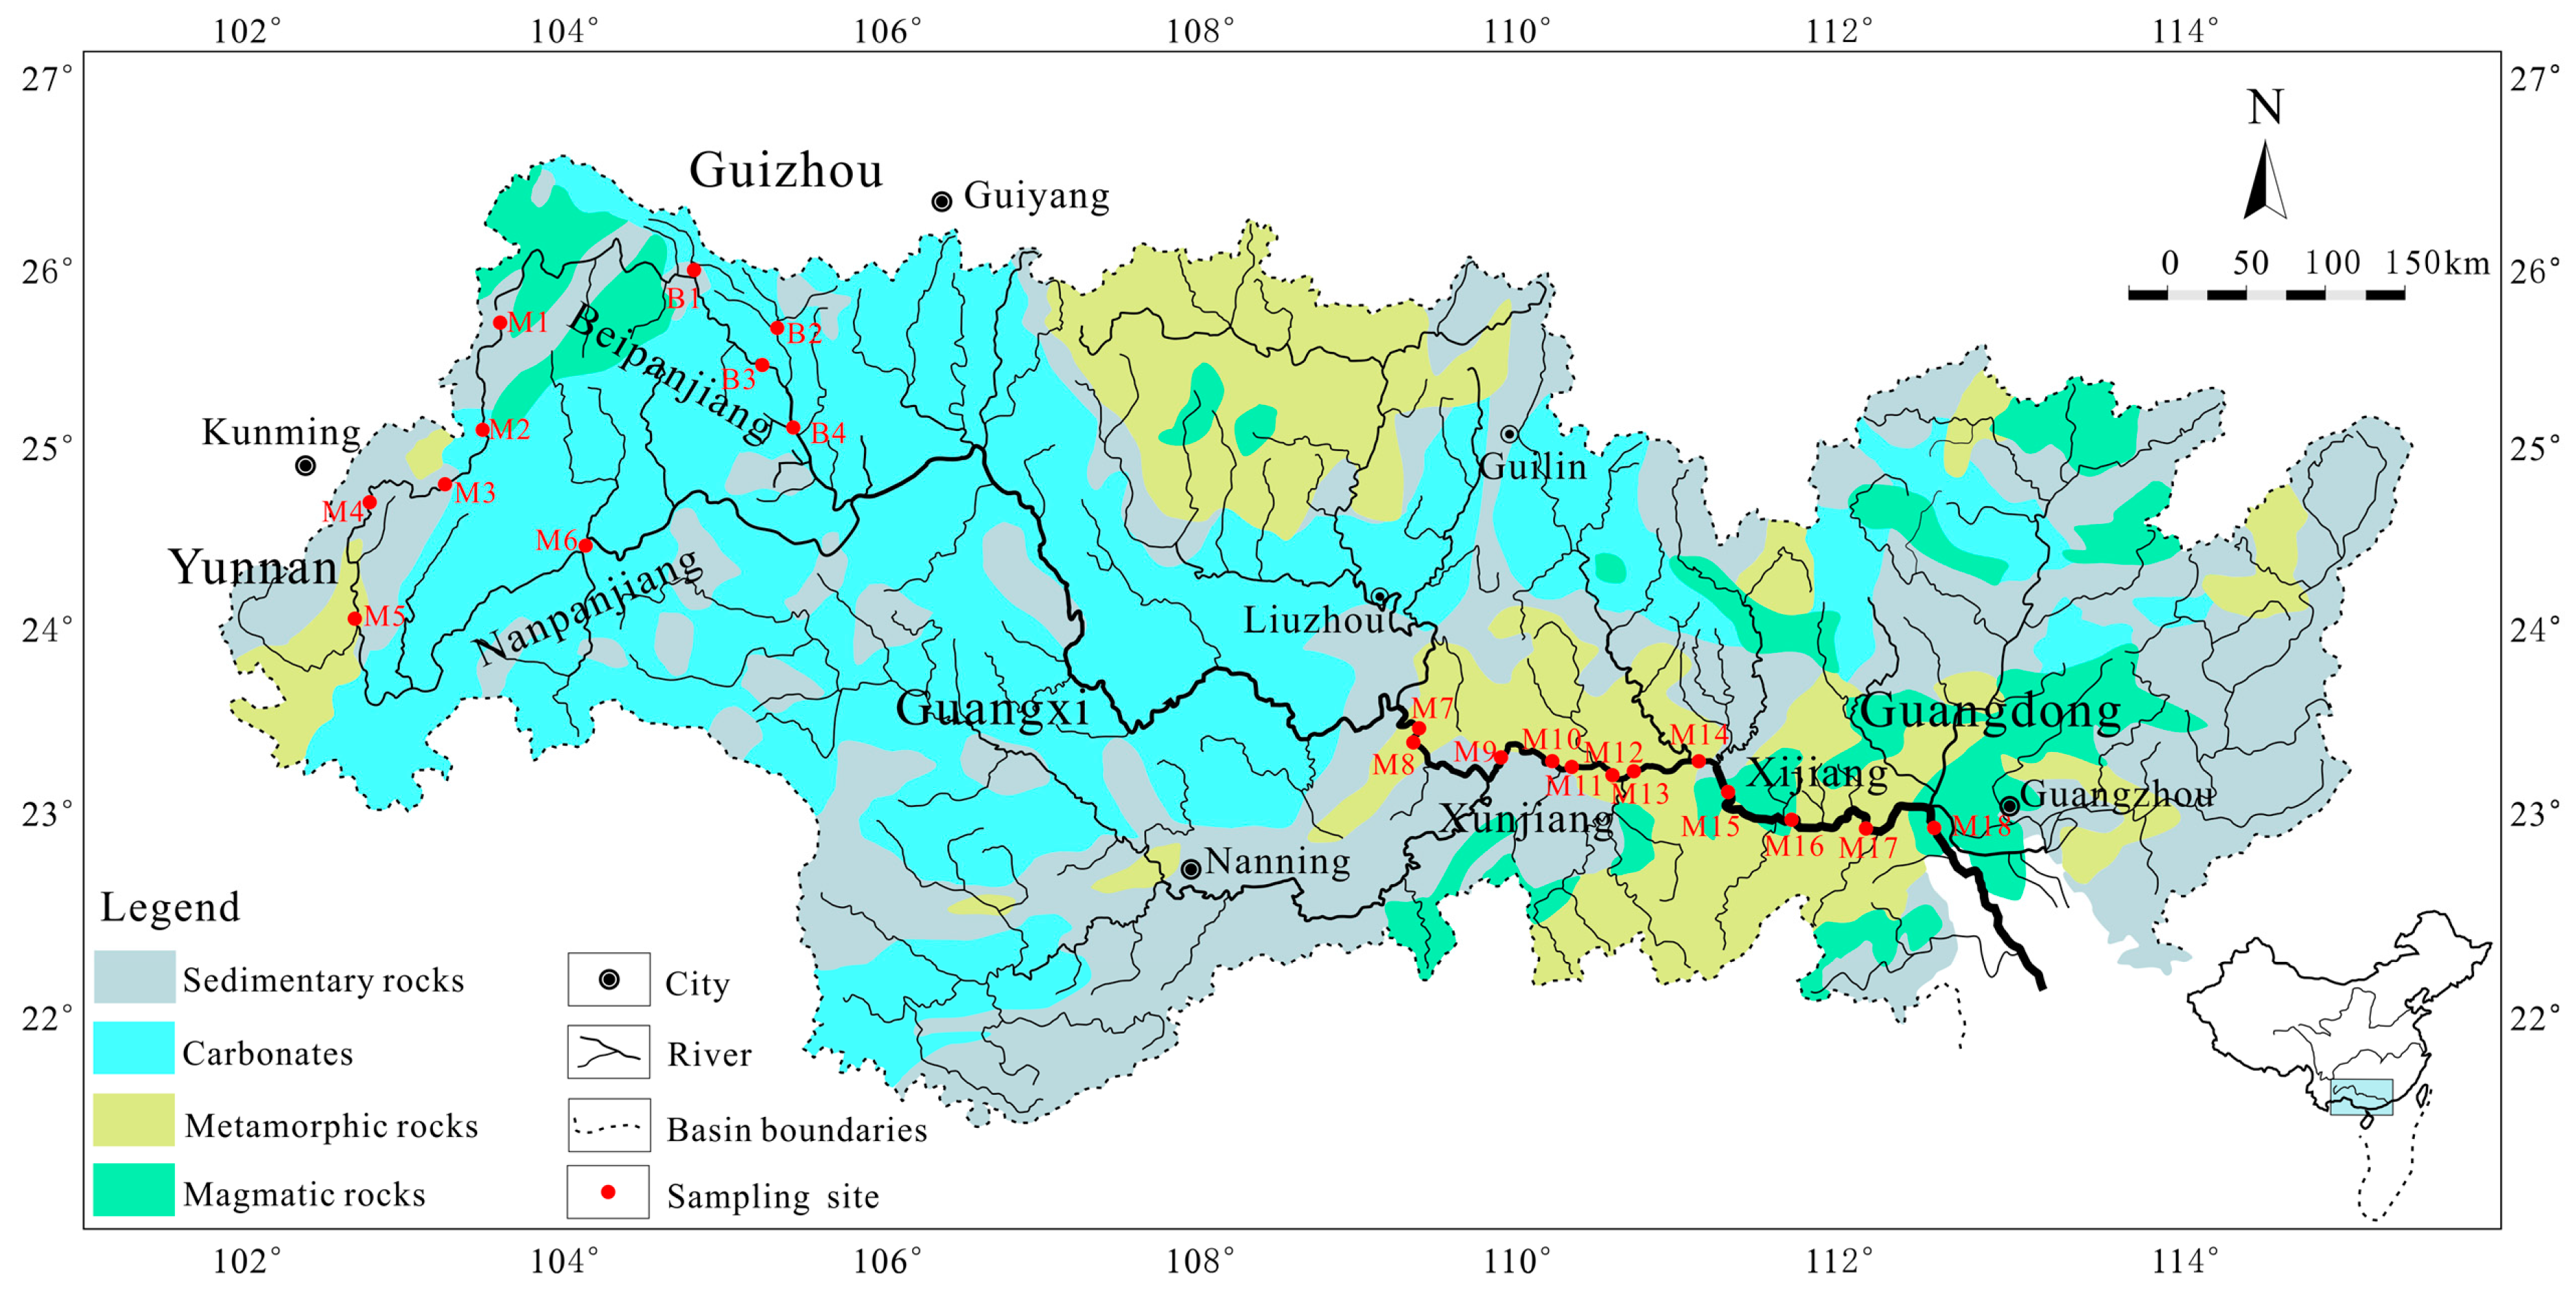
2.1. Study Area

The Zhujiang River (21°31′–26°49′ N, 102°14′–115°53′ E) is the largest river flowing into the South China Sea and is the major water source for the population of more than 30 million in southern China [26,27]. As the elevation decreases from northwest to southeast, the Zhujiang River flows through Yunnan, Guizhou, Guangxi and Guangdong provinces with a coverage area of 4.5 × 10⁵ km2 (Figure 1). The Zhujiang River basin is characterized by a tropical to subtropical monsoon climate, where the annual temperature and annual precipitation range from 14 to 22 °C and 1200 to 2200 mm [25]. Various rocks, including carbonate rocks, metamorphic rocks, detrital sedimentary rocks, and magmatic rocks, are widely distributed in the Zhujiang River basin [25,26] (Figure 1). There are 24 large dams and 212 medium reservoirs located in the mid-lower reaches of the Zhujiang River [25].

2.2. Sample Collection and Analysis

Based on the lithology distribution, population distribution and reservoir/dam distribution of the Zhujiang River basin, 22 sampling sites were selected (Figure 1). Ten sites were located at the Nanpanjiang River (NPR, M1 to M6) and Beipanjiang River (BPR, B1 to B4) in the upper reaches of the Zhujiang River with widely distributed carbonates and a small population. Twelve sites were located at Xunjiang (XUR, M7 to M13) and Xijiang (XJR, M14 to M18) in the mid-lower reaches of the Zhujiang River, where there are large populations and many reservoirs/dams with metamorphic rock and magmatic rock development. Accordingly, a total of 22 river SPM samples were collected from the selected sites during July 2014 (wet season). The SPM samples in river water were firstly filtered through millipore nitrocellulose membrane filters, and the SPMs on the filter membranes were then removed by milli-Q water and dried at 55 °C in the laboratory. The digestion method of SPMs was modified from previous studies [21,33]. Briefly, 100 mg of SPM sample powder was digested with 1 mL pure HF and 3 ml pure HNO3 in a pre-cleaned PFA (Perfluoroalkoxy) sample jar (Savillex, Eden Prairie, MN, USA) at 140 °C. After the samples were completely digested, 2 mL pure HNO3 was added twice to break up residual fluorine compounds until evaporation to dryness. Finally, the remaining digest was re-dissolved using 100 mL 3% HNO3 for the heavy metal(loid) analyses. The heavy metal(loid)s (V, Cr, Mn, Ni, Cu, Zn, As, Cd, and Pb) of the digested solutions were determined by ICP-MS (Elan DRC-e, Perkin Elmer, Waltham, Massachusetts, USA), and the aluminum for the enrichment factor calculation was also detected by ICP-OES (Optima 5300DV, Perkin Elmer, Waltham, Massachusetts, USA). All the samples and standards were analyzed in batches with a procedural blank. Relative standard deviations (RSD) for heavy metal(loid)s were ±5%.

2.3. Assessment Method and Statistical Analysis

2.3.1. Enrichment Factor (EF)

The EF normalizes the content of a heavy metal(loid)s to a conservative element, and has been extensively used to assess the enrichment of heavy metal(loid)s quantitatively [20,24,33,34]. Here, Al was approved as a reference element due to its extensive distribution in continental rocks and scarcity in various pollution sources [35], and can be used to calculate the EF as follows [20,24]:
EF = [ ( C i / C ref ) SPM ] / [ ( C i / C ref ) background ]
where Ci is the concentration of the heavy metal(loid)s (mg kg−1), and Cref is the concentration of the reference heavy metal(loid)s (mg kg−1). The (Ci/Cref) ratio is calculated based on the local soil background values. The soil background values of the Yunnan and Guizhou provinces were used for NPR (M1 to M6), and BPR (B1 to B4) river reach samples, and the mean soil background values of Guangdong and Guangxi provinces were used for the downstream samples (M7 to M18) [36]. The corresponding enrichment level categorizations of the EF value [24] are listed in Table 1.

2.3.2. Geo-Accumulation Index (Igeo)

The geo-accumulation index (Igeo) is also applied to assess the heavy metal(loid) contamination in SPM. This approach has been widely used in previous studies [8,20,37]. The Igeo is calculated as follows [38,39]:
Igeo = log 2[Ci/(1.5 × Bi)]
where Ci is the concentration of heavy metal i in the SPM (mg kg−1), Bi is the local soil background concentration of metal i (mg kg−1), and the coefficient 1.5 in the equation is used to minimize the effect of possible variations in the background values. The Igeo for each metal is classified using seven (0–6 grades) enrichment classes [38] (Table 1).

2.3.3. Risk Assessment

The toxic risk index (TRI) is applied to assess the integrated toxic risk (mainly the potential ecological risk to aquatic organisms) based on both the threshold effect level (TEL) and the probable effect level (PEL) of heavy metal(loid)s. Here, we selected consensus-based TEL and PEL values [40], which have been successfully used to assess the potential ecological risks of aquatic system trace metal(loid)s in previous studies [5,24]. The TRI of the SPM is calculated by the following equation [5]:
TRI = Σ i = 1 n TRI i = { [ ( C S i / C TEL i ) 2 + ( C S i / C PEL i ) 2 ] / 2 } 1 / 2
where C S i is the concentration of metal i (mg kg−1) in the SPM, C TEL i and C PEL i are the TEL and PEL of metal i (mg kg−1), respectively. The toxic risks are classified into five categories (Table 1) based on the TRI calculation [5].
The health risk of human exposure to SPM of the Zhujiang River was evaluated by referring to the U.S. EPA method [41], which considers the amount of metal(loid)s entering the body and the relationship between the undesirable health effects and reference dose. The non-carcinogenic risk is calculated and assessed by the hazard quotient (HQ) and hazard index (HI, the potential hazard to the human health). In general, direct ingestion and dermal absorption are the two main exposure pathways to heavy metal(loid)s in the aquatic system for human beings [42,43]. Since humans rarely drink water with SPM directly (direct ingestion), here we considered that dermal absorption is the only exposure pathway for heavy metal(loid)s in the SPM. The HQ is the ratio between exposure via each pathway and the reference dose (RfD). HI is the sum of the HQs for each heavy metal from all the pathways (in this study, HI is equal to HQ because there is only one pathway). If the HQ or HI exceeds 1, non-carcinogenic risk effects on human health are a concern, and further study is necessary. In contrast, there are no deleterious effects when HQ or HI is less than 1 [37,43]. The HQ and HI are calculated as follows [37,44]:
ADDdermal = (C × EF × ED × SA × AF × ABS × 10−6)/(BW × AT)
HQ = ADD/RfD
HI = ΣHQs
where ADDdermal is the average daily doses by dermal absorption (mg kg−1 day−1); RfD is the reference dose (mg kg−1 day−1) [37,45], and the other parameters and values in these Equations (4)–(6) are shown in Table 2.

2.3.4. Multivariate Analysis

Statistical approaches, including a correlation matrix and principal component analysis (PCA), were applied to analyze the dataset to obtain descriptive statistics and to explore the possible sources of the heavy metal(loid)s. PCA is the most common multivariate statistical method used to explore the associations and origins of heavy metal(loid)s [46], which could reduce the dimensionality of the dataset to several influencing factors while trying to preserve the relationships presented in the original data [43,47]. The factor contribution or variables with minor significance attained from PCA are further reduced by the varimax rotation method [43]. The results of PCA, including the factor loadings, eigenvalues, variance, and communalities, constitute the component matrix. The result of PCA is acceptable if the communalities value is close to 1. The factor loadings (the correlation coefficients between each principal component and initial variable) are classified as “strong”, “moderate”, and “weak” according to the absolute loading values of >0.75, 0.75–0.50, and 0.50–0.30, respectively [48]. In this study, PCA is performed for heavy metal(loid)s of SPM in the Zhujiang River to distinguish their possible origins. The suitability of the dataset for PCA was checked using the Kaiser-Meyer-Olkin (KMO) test and Bartlett’s sphericity test (p < 0.001) [47]. To avoid the numerical ranges of the original variables, the dataset was first standardized by a z-scale transformation.

2.4. Data Processing Method

For the statistical analyses of obtained data, Pearson’s correlation coefficient and principal component analysis (PCA) were performed using SPSS 21.0 (IBM, Armonk, NY, USA). The data were graphed with Origin 8.1 (EA, Redwood City, CA, USA) and Microsoft Office 2010 (Microsoft, Redmond, WA, USA) for Windows.

3. Results and Discussion

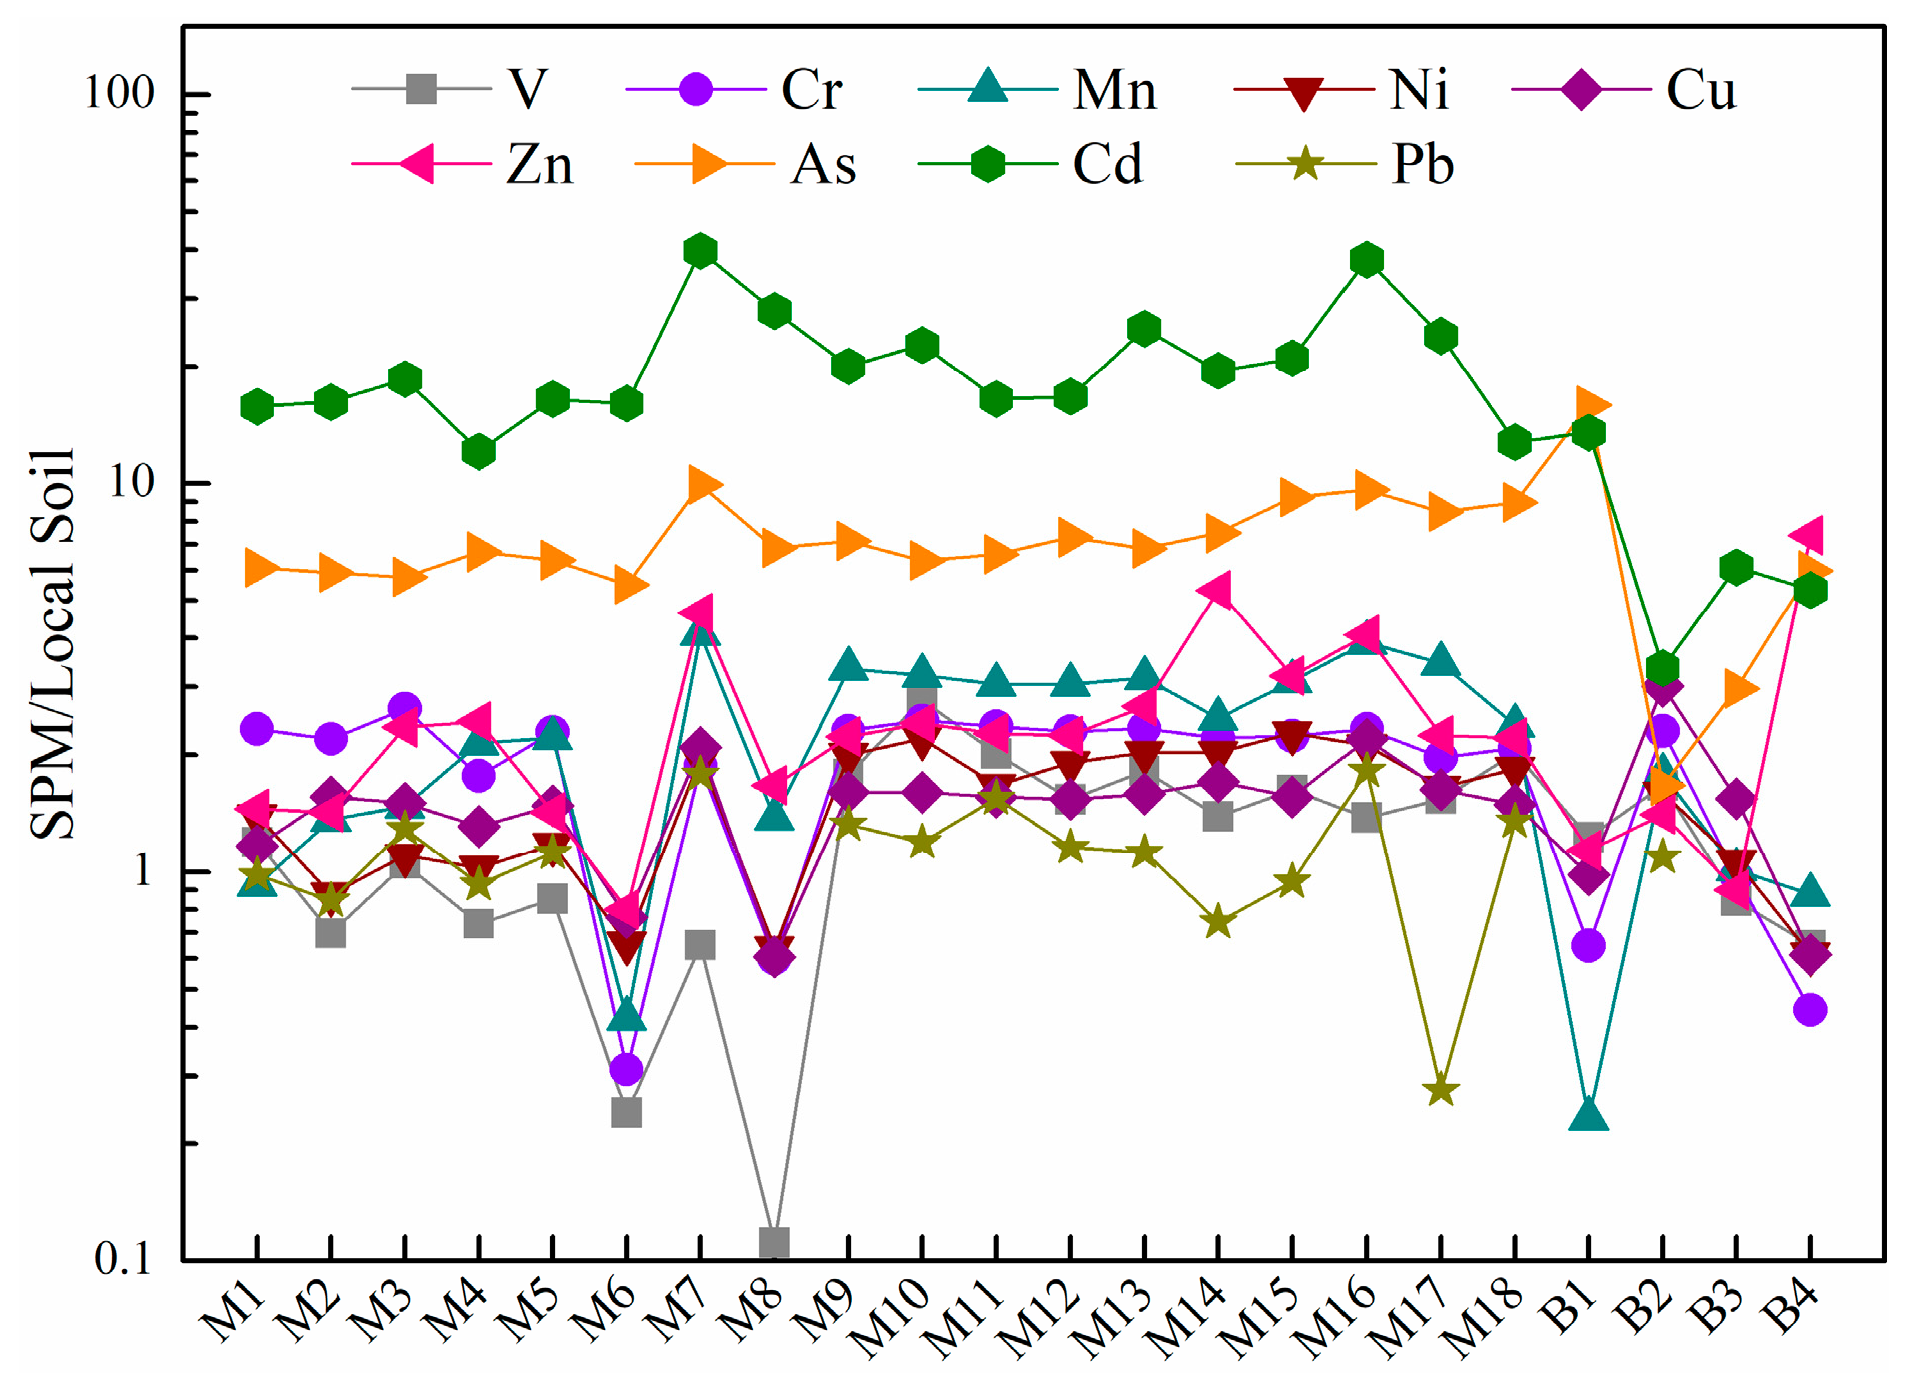
3.1. Abundance of Heavy Metal(loid)s in SPM

The concentrations of heavy metal(loid)s in SPM of the Zhujiang River are shown in Table 3. The Kolmogorov–Smirnov (K–S) test, which is a non-parametric test, was used to test the normal distribution of our data. The test results show that all parameters are normally distributed in the Zhujiang River (K–S test significance >0.1), and the arithmetical mean values of all parameters are suitable for comparison [43]. Therefore, the nine selected heavy metal(loid)s in this study can be ranked by abundance as follows: Mn (982.4 mg kg−1) > Zn (186.8 mg kg−1) > V (143.6 mg kg−1) > Cr (129.1 mg kg−1) > As (116.8 mg kg−1) > Cu (44.1 mg kg−1) > Ni (39.9 mg kg−1) > Pb (38.1 mg kg−1) > Cd (3.8 mg kg−1). Mn and Zn are the most abundant metals, with maximums of 1487.1 and 732.8 mg kg−1, respectively, compared to the soil background values of the Zhujiang River basin [36]. The concentrations of five metal(loid)s, including Cr, Mn, Zn, As, and Cd, in SPM are much higher than all soil background values, while the contents of the remaining metals are between the soil background values of several provinces. Cd concentration is 5.8–23.7 times higher than the soil background concentration values of the whole basin which can be considered the strongest enriched metal in SPM relative to the soil. Cr, Mn, Zn, and As concentrations are elevated 1.2–7.9 times the soil background concentration values.
On a global scale (Table 4), V, Cr, and Zn are generally close to the world average, Mn, Ni, Cu, and Pb are lower than the world average, while As and Cd are much higher than the world average [11]. Compared with the rivers in Asia (China), the contents of V, Cr, and Mn in SPM of the Zhujiang River are similar, Ni, Cu, and Pb are slightly lower, while Zn is slightly higher. Additionally, the metals (Cr, Ni, Cu, Zn, and Pb) easily affected by human activities in SPM of the Zhujiang River are much lower than those in Europe (with many developed countries), which partly reflects the impact of economic development on heavy metal pollution in the fluvial environment.

3.2. Water/Particle Interaction and Contamination Assessment

3.2.1. Water/Particle Interaction

The partition coefficient (Kd) is the ratio of the element content in solid form (SPM in this study) to dissolved content in water (ppm/ppm) [21], which provides empirical information about the water/particle interaction for trace metals [8,49] and is usually expressed as lgKd. A high lgKd value signifies a powerful affinity of the metals with SPM [15]. In combination with the dissolved heavy metal concentration in the same water samples of Zhujiang River reported in our early work [32], the lgKd values of the seven metals are calculated and summarized in Table 5. The lgKd values of V, Cr, Mn, Ni, Cu, Cd, and Pb ranged from 3.6 to 5.0, 3.3 to 4.5, 4.7 to 7.0, 3.7 to 4.5, 2.9 to 5.3, 4.6 to 5.5, and 5.4 to 6.2, respectively. All the lgKd values exceeded 2.9, indicating the powerful adsorptive ability of heavy metals for the SPM. The mean partition coefficients of seven metals decreased in the order of Mn > Pb > Cd > V ≈ Cu > Cr ≈ Ni (Table 5); mainly controlled by the ionic radius and particle reactivity of these metals and the particle size of the SPM [8,23,49]. Compared to some rivers in the world, the lgKd values of seven metals are within the range of world river values [6,8,50,51,52,53] (Table 5). The partition coefficients of Cr, Cu, and Cd are comparable to some rivers in China [52], particularly the Beijiang River [8], a significant tributary of the lower reaches of the Zhujiang River. However, the lgKd values of Mn, Ni, and Pb are relatively higher than those of rivers in China [8,52]. It is noteworthy that all the mean lgKd values (except Pb) in the present study are lower than the monthly mean values of the upper Zhujiang River [21], which indicates the possible seasonal variations in water/particle interaction.

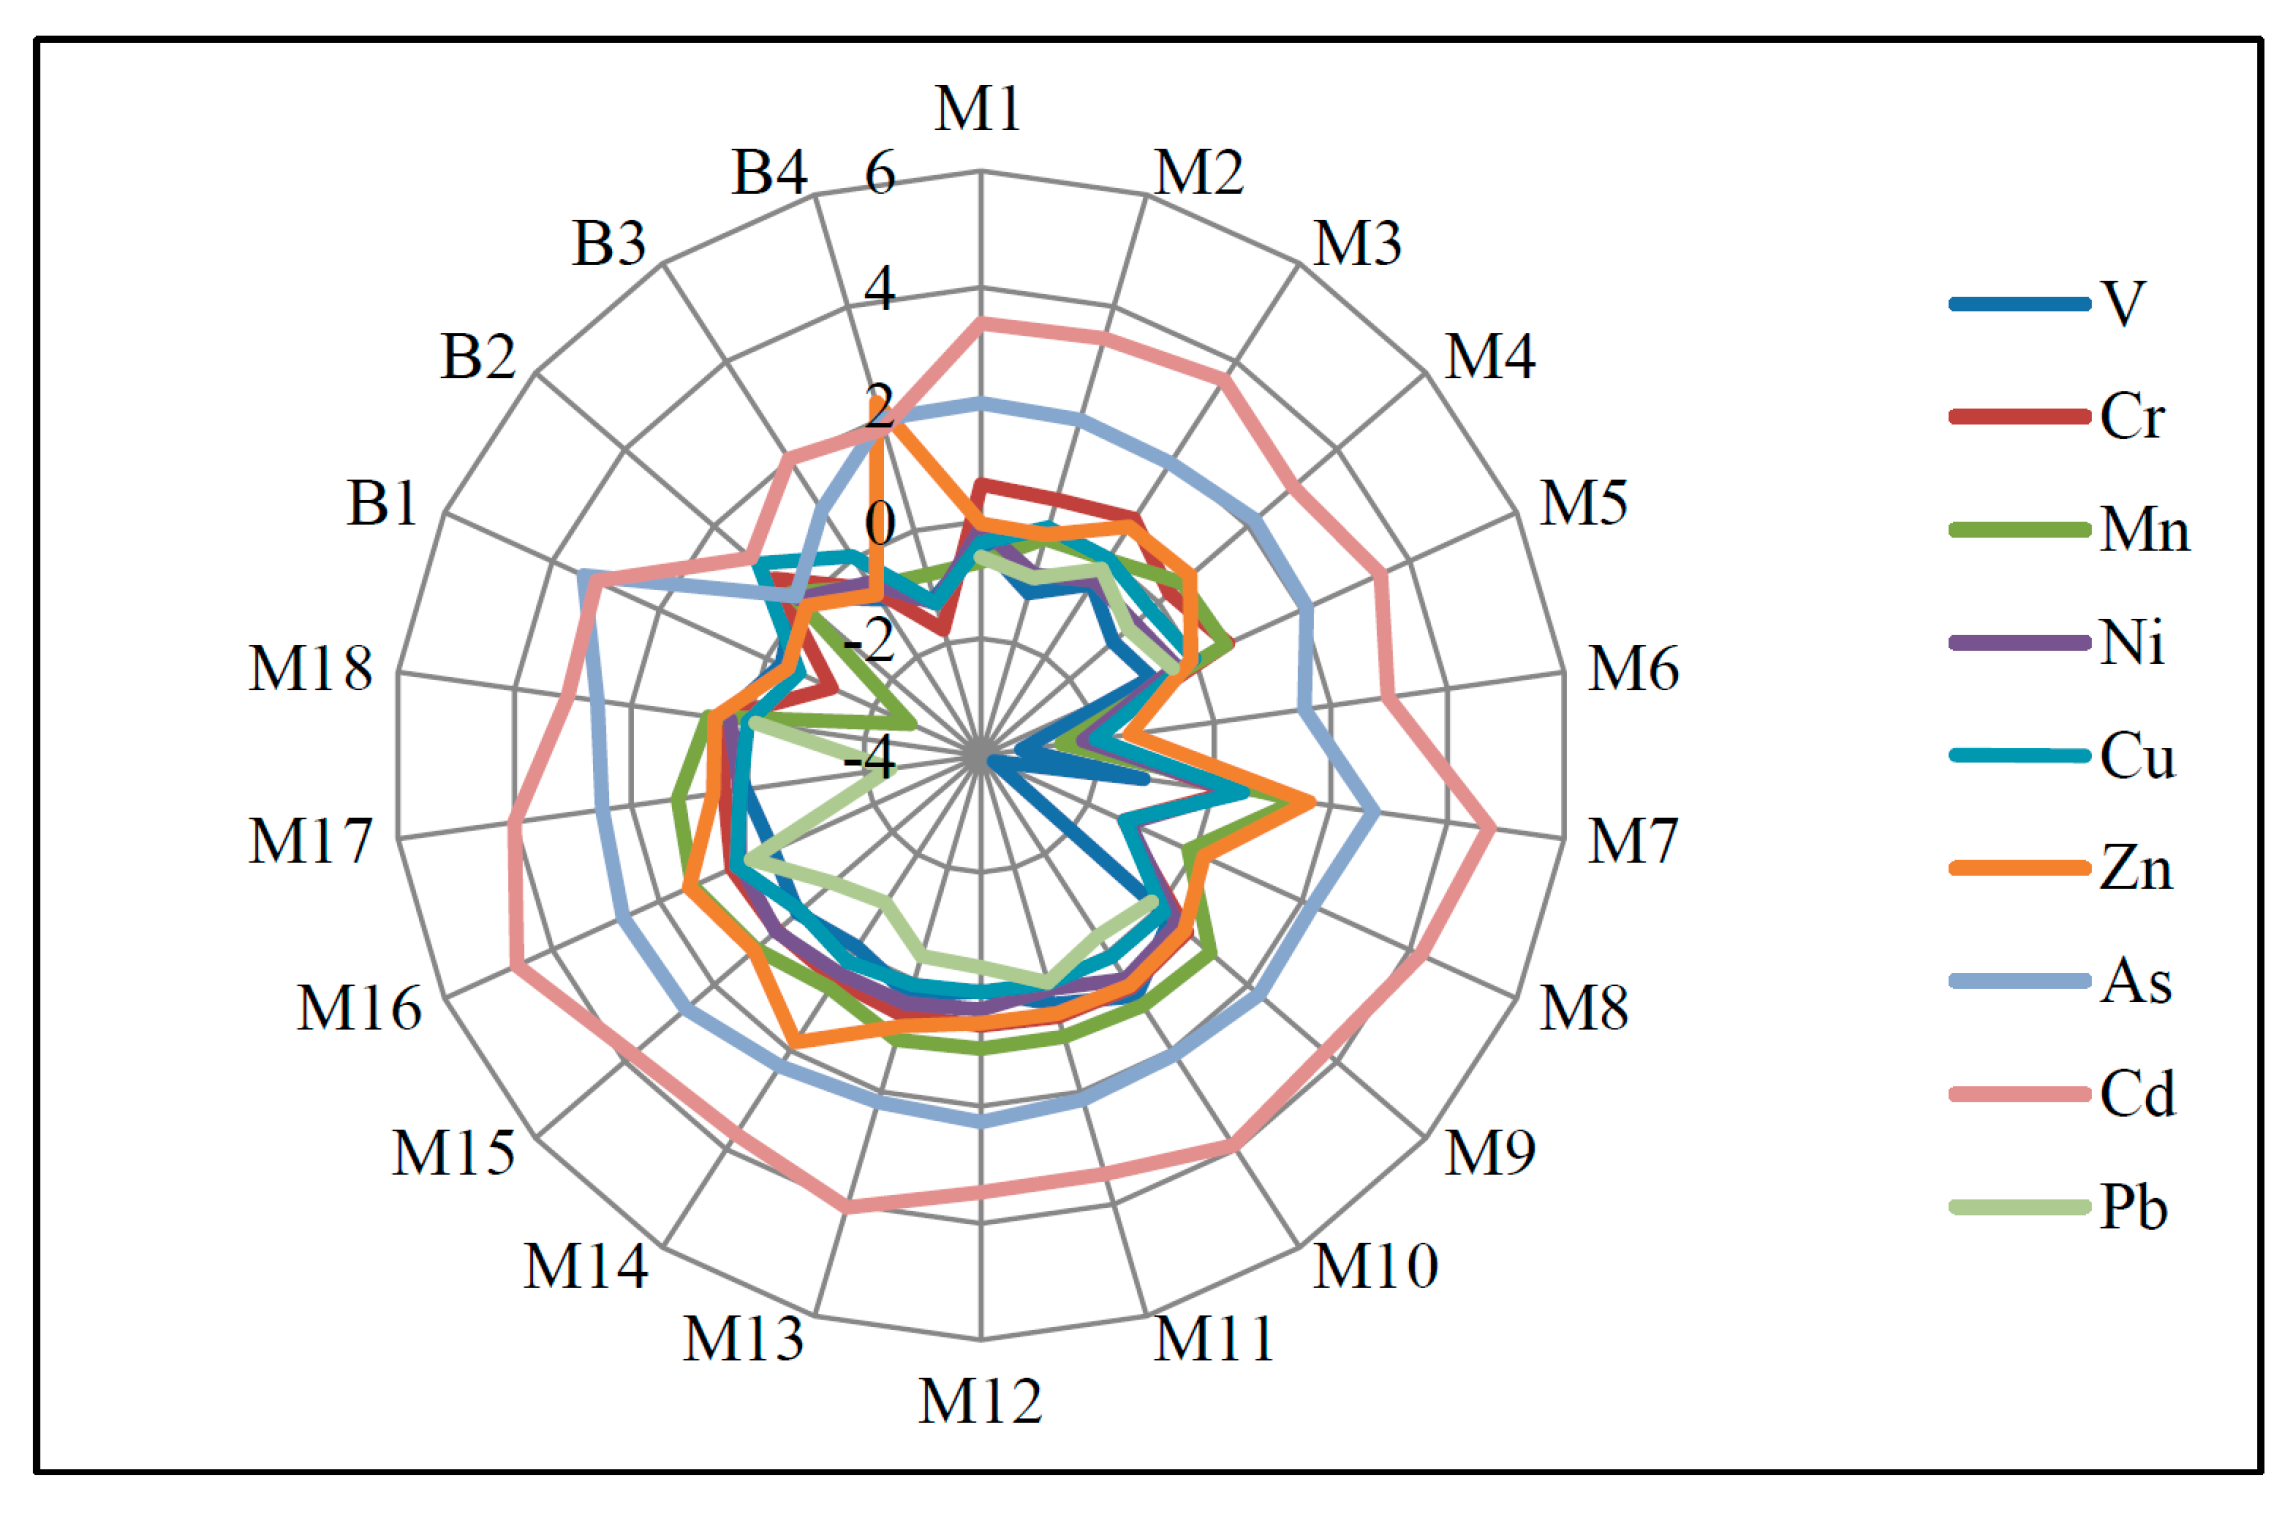
3.2.2. Enrichment Factor

The abundance of heavy metal(loid)s in SPM is normalized by the corresponding soil background values [36] in this study (Figure 2). Most metal(loid)s had a soil-normalized value which approached one and ranged from 0.1 to 4.1, with the exception of Zn, As and Cd. Soil-normalized values of As and Cd were 1.7 to 15.9 and 3.3 to 39.7, respectively, and indicate that all the SPM samples are enriched in metal(loid)s of As and Cd. Zn shows the soil-normalized value of varying degrees (0.8 to 7.4), which is more obvious in the headstream reach (M1 to M6, B1 to B4) and the XJR reach (M14 to M18).
In order to quantitively evaluate the enrichment degree of heavy metal(loid)s in the Zhujiang River SPM, the enrichment factor (EF) was applied in the present study. As shown in Figure 3, the mean EF values of the SPM in all sites decreased in the order of Cd (23.3) > As (11.0) > Zn (3.2) > Mn (2.1) > Cr (1.8) > Cu (1.6) > Ni (1.4) > V (1.3) > Pb (0.9), indicating extremely severe enrichment of Cd and As. In the current study, the EF values of Cd in most sampling sites exceed 10 (severe enrichment, Table 1), and a few sampling sites exceed 50 (M6, M8, and B1), which can be defined as extremely severe enrichment (Table 1). The EF values of As mainly range from 5 to 10, which is a moderately severe enrichment. Cr, Mn, Ni, Cu, and Zn are slightly enriched, with mean EF values between 1.4 and 3.2, while the remaining metals (V and Pb) show no enrichment characteristics in most of the sites (EF < 1). It should be noted that the EF values of V (6.2), Cr (3.3), Cu (5.0), and As (79.8) are highest at B1, and the rest of the metals also have higher EF values, which illustrates that site B1 is the most strongly related to human activities [24]. Compared with the monthly SPM sampling of BPR (the mean EF values are 2.8, 3.1, 1.9, 2.7, 1.8, 2.4, 11.9, and 2.0 for V, Cr, Mn, Ni, Cu, Zn, Cd, and Pb, respectively) [21], most of the metals in our study have a relatively lower EF value, indicating that although the lgKd values in this study (wet season) reflect the powerful adsorption capacity of SPM for heavy metals, there may be stronger water/particle interaction at the monthly scale, particularly particle adsorption. Furthermore, compared with the mean EF values of 11.0, 12.5, 10.0, 5.0, 19.6, and 19.6 for Cr, Ni, Cu, Zn, Cd, and Pb, respectively, in the polluted river (Soan River, Pakistan) [20], the enrichment degree of heavy metals in the Zhujiang River SPM is relatively slight.

3.2.3. Geo-Accumulation Index

Based on the local soil background values (Table 3), the contamination degrees of heavy metal(loid)s in SPM of the Zhujiang River are assessed by the geo-accumulation index method (Equation (2)). The mean value of Igeo shows a contamination level order similar to EF (Cd > As > Zn > Mn > Cr > Cu ≈ Ni > V ≈ Pb, Figure 4). The most contaminated heavy metal(loid)s are Cd and As, with mean Igeo values of 3.4 and 2.1, respectively (Figure 4), revealing heavily polluted and moderately to heavily polluted levels. The mean value of Igeo for Zn (0.5), Mn (0.3), and Cr (0.1) classifies these metals as lightly polluted. The remaining metals (Cu, Ni, V, and Pb) have mean Igeo values of less than 0, indicating the unpolluted level (Figure 4). The mean Igeo values of the present study are consistently lower than those of the Beijiang River, an important tributary of the lower Zhujiang River, with several polymetallic mines and metal smelting enterprises (the mean values of Igeo are 2.1, 2.7, 3.1, 7.0, and 1.5 for Cu, Zn, As, Cd, and Pb, respectively) [8], revealing that the pollution intensity of heavy metal(loid)s in SPM is assuaged by the varying landscape setting of the whole Zhujiang River basin. This could be further confirmed by the comparison with polluted rivers [20].

3.3. Origins of Heavy Metal(loid)s in the SPM

3.3.1. Correlation Analysis

A Pearson correlation matrix was employed to distinguish correlations between the nine heavy metal(loid)s of the SPM in the Zhujiang River (Table S1). The heavy metals with high correlation coefficients in the aquatic system could have similar sources, migration processes and chemical behavior [43,54]. In the current study, Cr, Mn, Ni, Cu, and Pb are remarkably positively correlated with each other (p < 0.01), indicating that these metals may be derived from the same source. Strong positive correlations are also observed between As and Cd (0.780), but these are poorly correlated with the remaining metals, suggesting that the sources of As and Cd are different from those metals. V is only significantly correlated with Cr (0.741), while Zn is not correlated with any metal (Table S1).

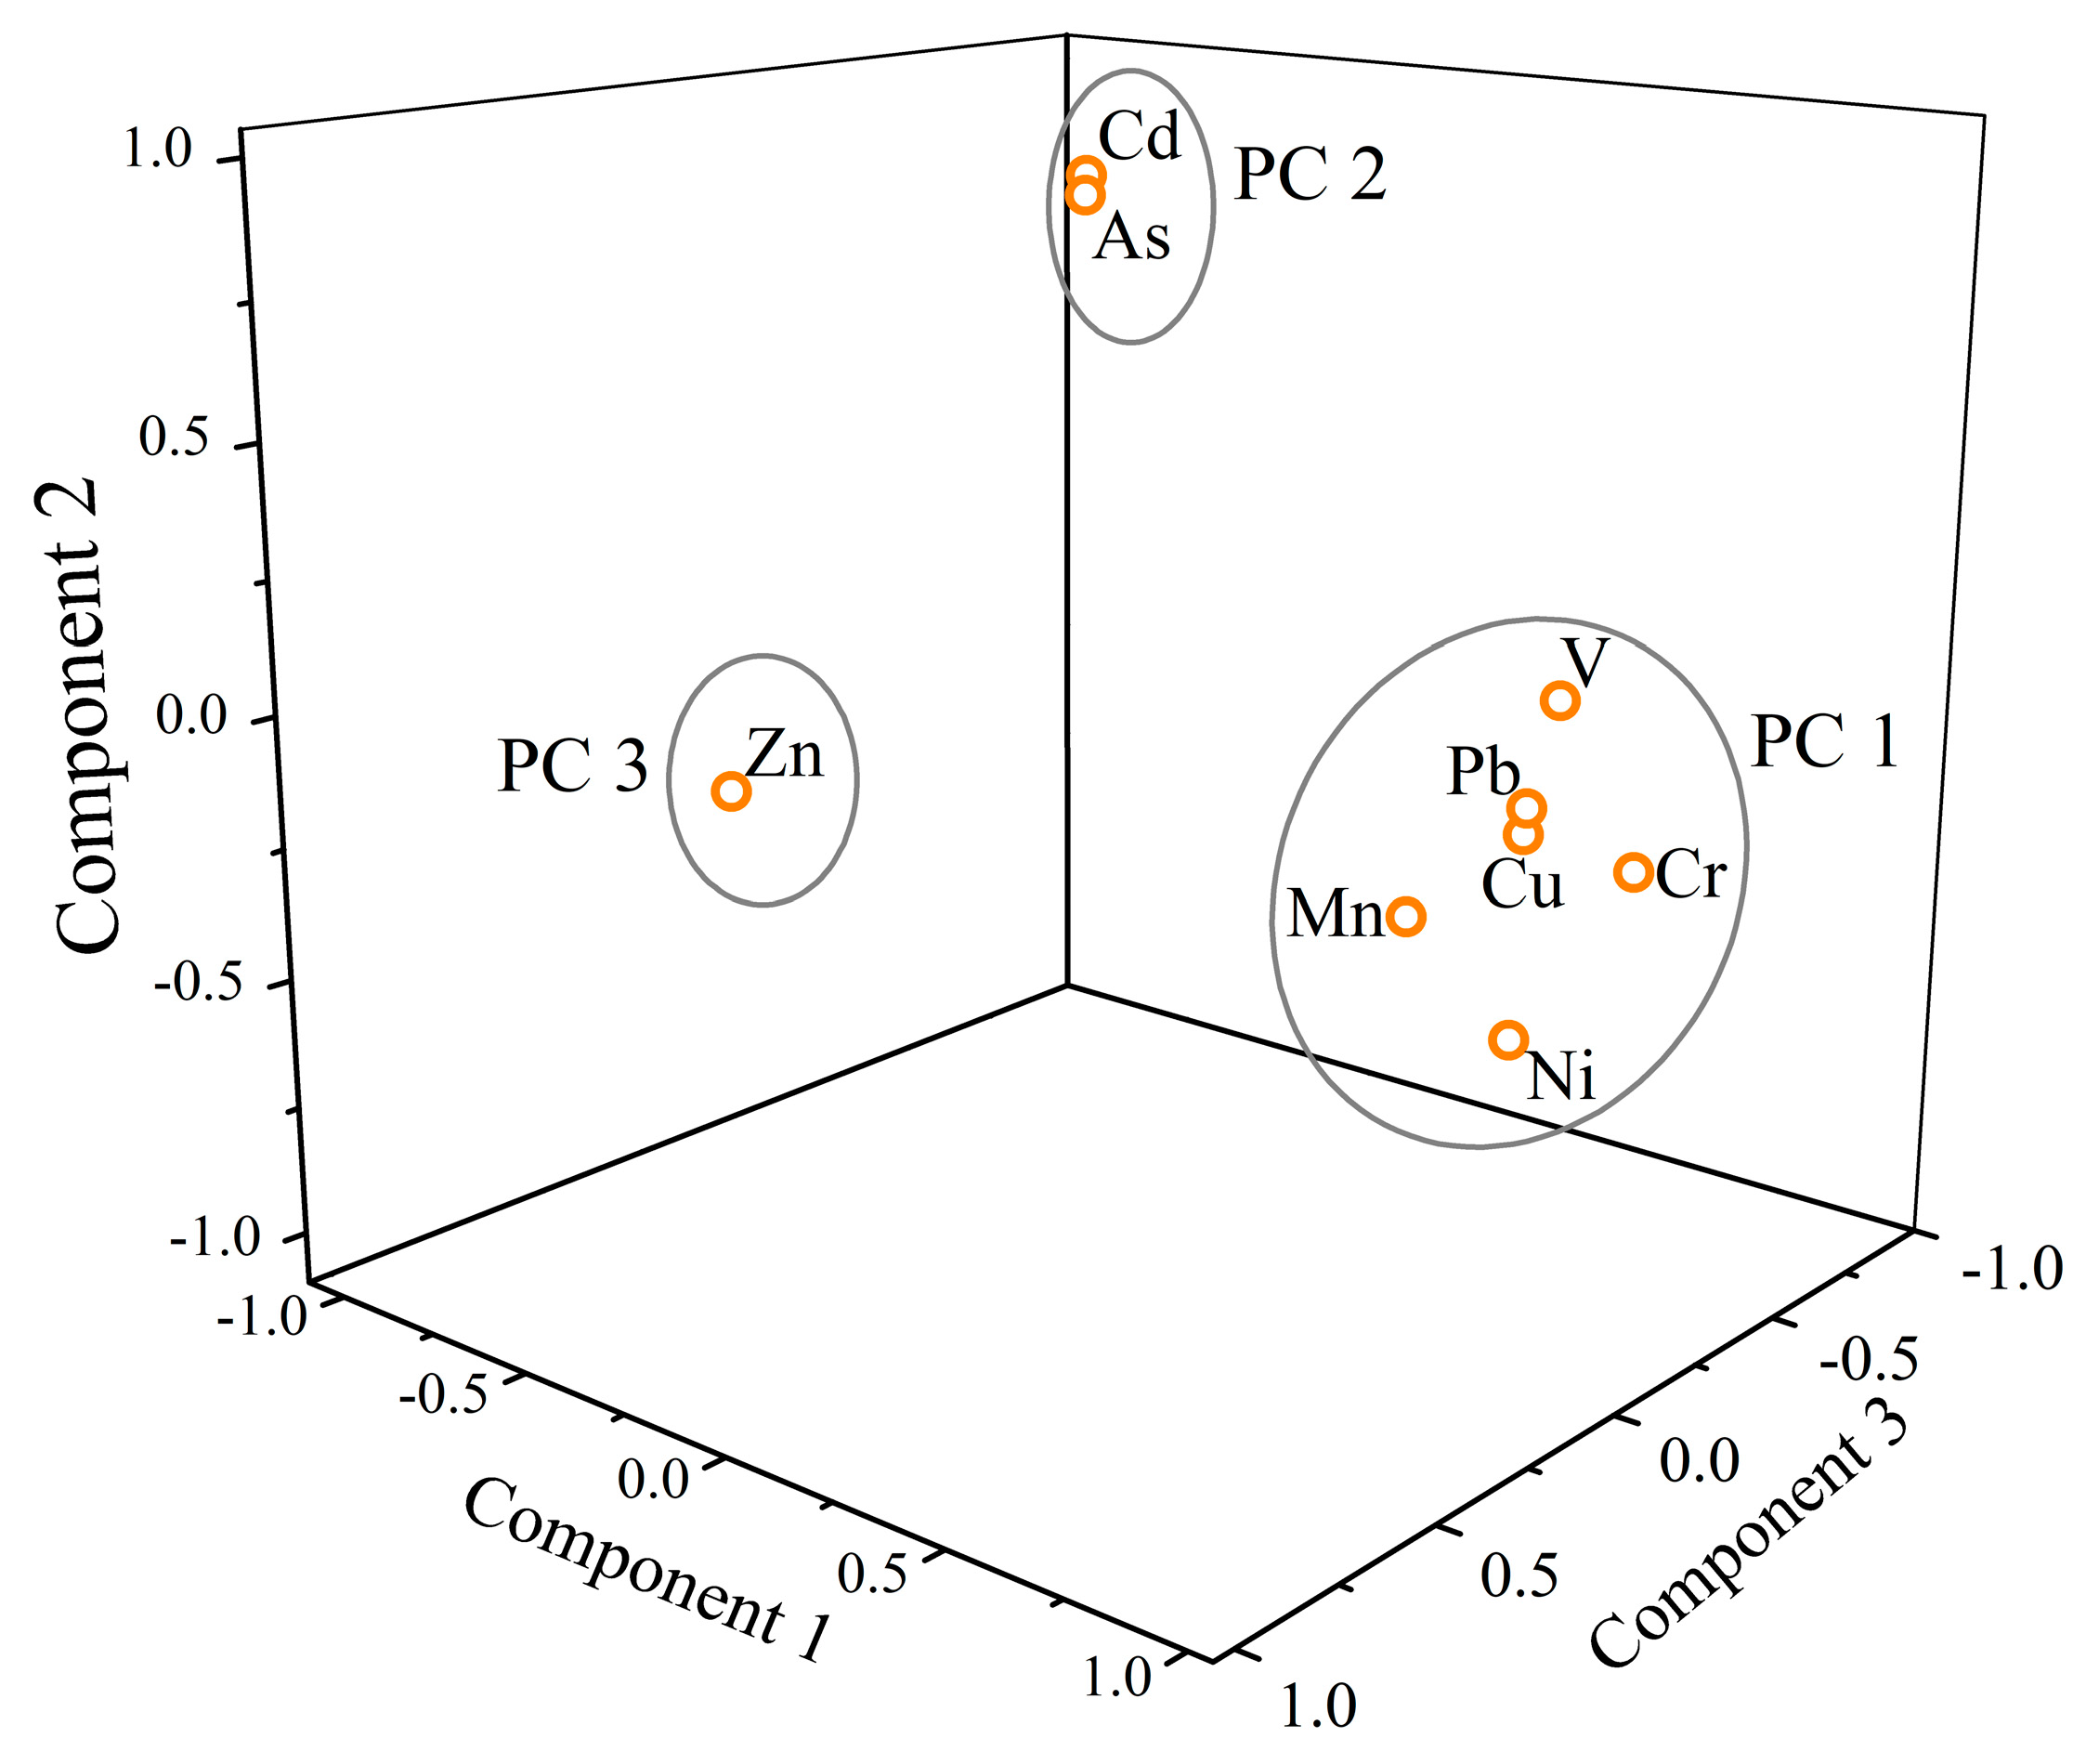
3.3.2. Principal Component Analysis

In this study, PCA with the varimax rotation method was performed for heavy metal(loid)s of SPM in the Zhujiang River. There are three principal components (PC, eigenvalues >1) that are extracted and summarized in Table 6. PC 1 explains 44.51% of the total variance and predominantly includes V, Cr, Mn, Ni, Cu, and Pb. PC 2 explains 22.36% of the total variance with significant loadings of As and Cd. PC 3 explains 12.33% of the variance which is only contributed by Zn, and most of the heavy metal(loid)s exhibit a strong loading in their PCs (loading values >0.75) [48,55]. In total, these three PCs account for 79.19% of the total variance and are presented in a three-dimensional space, as shown in Figure 5. For PC 1, V is from lithophile elements [56], and Mn, Ni, and Cr are from natural sources of rock weathering and subsequent pedogenesis [24,57]. Although urban and industrial activities such as mining, metal smelting, and automobile exhausts can be the primary source of Cu and Pb [58], the lower EF values of Cu (1.6) and Pb (0.9) (Figure 3) indicate that the contribution of anthropogenic sources is limited [7,20]; hence, we attribute PC 1 to the natural origins controlled by geology and lithology. There are two metal(loid)s (As and Cd) with positive loadings on PC 2, and the correlation analysis suggests that the sources of As and Cd are different from those metals in PC 1. Considering the extremely high EF values of As (11.0) and Cd (23.3), we conclude that PC 2 is mainly contributed by anthropogenic origins in the basin [20,59]. In addition, Zn is the sole contributor to PC 3 and is not correlated with any metal (Table S1). In combination with the moderate enrichment of Zn (EF = 3.2), PC 3 can be attributed to mixed sources of geologic and anthropogenic origins.

3.4. Potential Risk Assessment and Heavy Metal(loid) Export Budget

3.4.1. Toxic Risk Index (TRI)

According to MacDonald [40], when the negative effects are less than 10% within the minimal effect range, the TEL is considered reliable, while the PEL is considered reliable if the negative effects exceed 65% of the probable effect range [5,40]. Thus, the TRI integrating the TEL and PEL, does not consider only the acute toxicity but also the lasting chronic toxic effects of heavy metals [24]. Based on the consensus TEL and PEL values [40] in (Table 3) and Equation (3), the TRI of seven metal(loid)s were calculated to evaluate the total toxic risk of both the acute and chronic toxic effects of SPM heavy metal(loid)s; V and Mn were excluded from the TRI calculations due to the lack of TEL and PEL values. As shown in Figure 6, the TRI values of the 22 sites range from 9.5 (M6) to 32.9 (B1), with a mean value of 17.9, indicating considerable toxic risk for most of the sites (15 < TRI ≤ 20). Additionally, three sites (M7, M16, and B1, TRI > 20) present very high toxic risk, while low toxic risk is observed at M6 (5 < TRI ≤ 10) (Figure 6). In contrast to the EF and Igeo values, the mean TRI of individual metal(loid)s follow a decreasing order of As (8.8) > Cd (2.8) > Cr (2.3) > Ni (1.3) > Zn (1.1) > Cu (1.0) > Pb (0.6), with mean contributions of 48.3 ± 10.4%, 15.6 ± 4.3%, 13.0 ± 5.5%, 7.7 ± 3.0%, 6.3 ± 4.5%, 5.8 ± 3.0%, and 3.3 ± 2.1%, respectively, to the TRI, indicating that As accounts for the majority of the overall SPM toxicity. The considerable contributions of As and Cd to the TRI are attributed mainly to their relatively low TEL and high concentration in SPM. This highlights the potential toxicity of SPM in the Zhujiang River, with two metal(loid)s (As and Cd) deserving more concern.

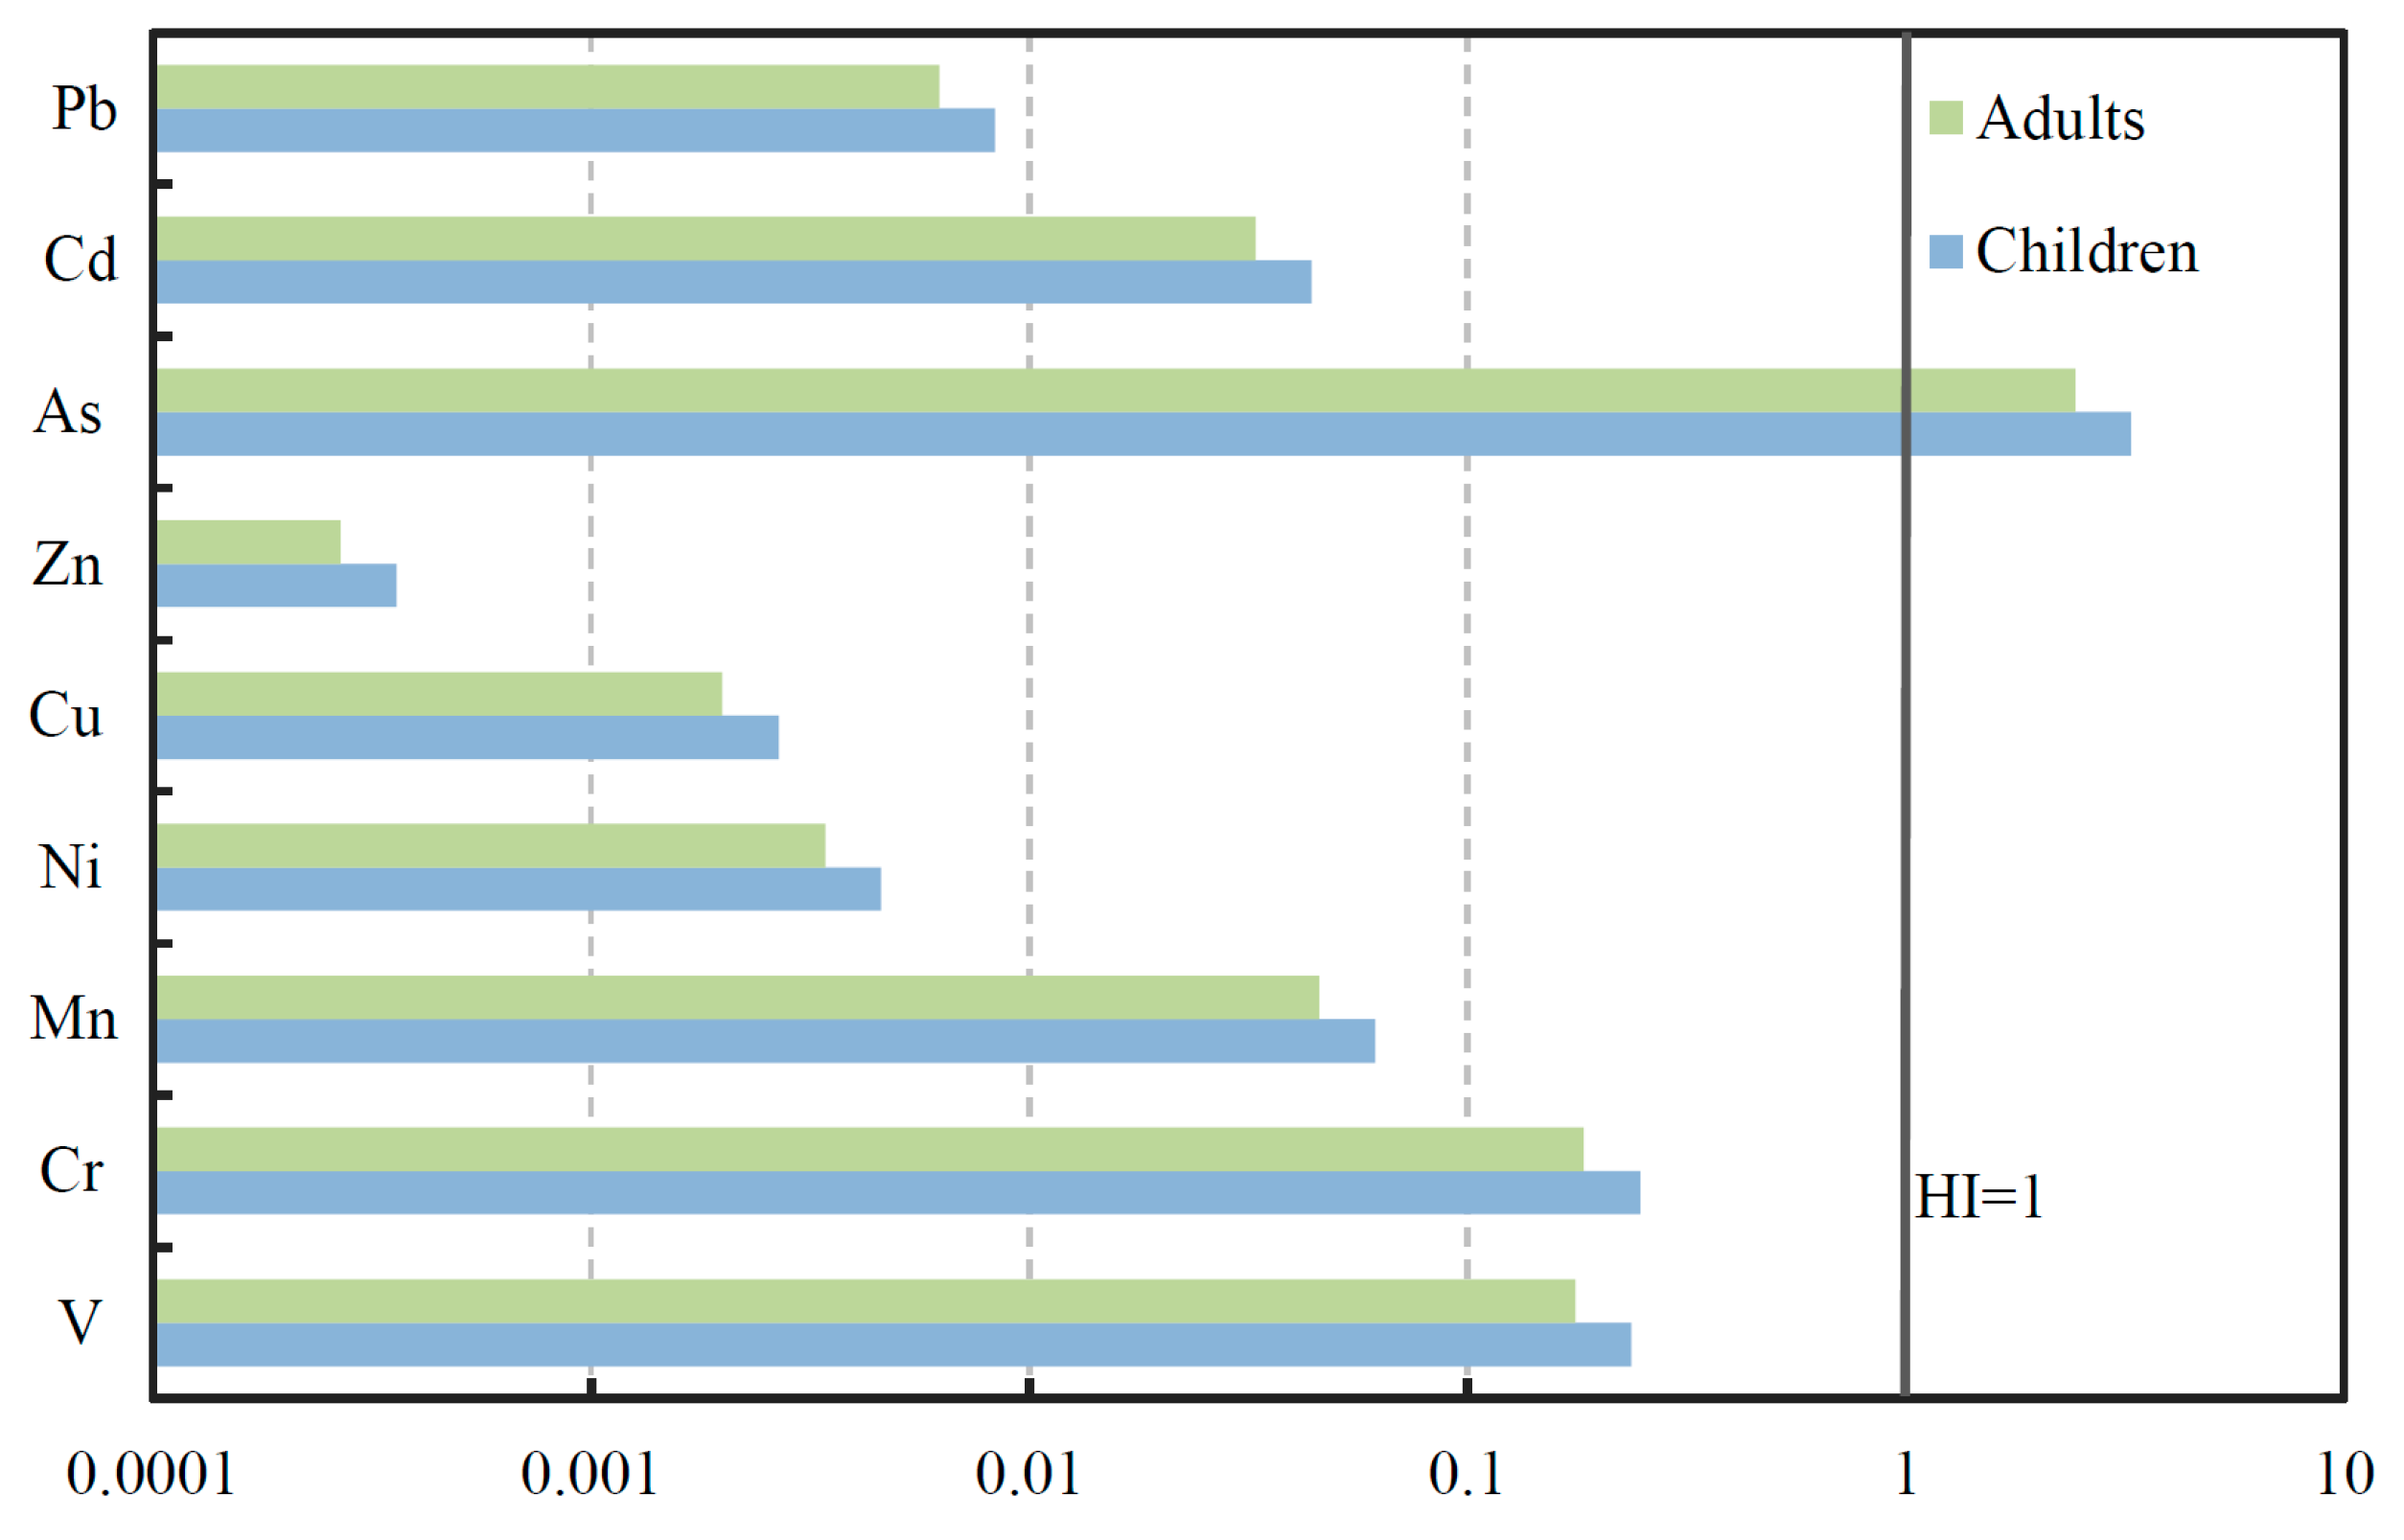
3.4.2. Health Risk Assessment

To better assess the health risk of human exposure to SPM of the Zhujiang River, the hazard index (HI) for the selected heavy metal(loid)s is calculated based on the reference dose (RfD) of each metal [37,45,60] (Table S2). The mean HI values are shown in Figure 7, and the HI calculated results for each site are summarized in Table S2. It should be noted that mean HI values of As exceed 1 for both children (3.3) and adults (2.4), indicating that non-carcinogenic effects may occur. For both adults and children, the HI for all the metals (except As) are less than 1 (Figure 7, Table S2), indicating that for these metals, little hazard is presented through the only exposure pathway—dermal absorption—in the whole basin area. In general, children have a higher HI value than adults (Figure 7), indicating that children face greater serious health risks due to SPM heavy metals than adults. Additionally, the previous studies concluded that negative health effects may occur for HI values >0.1 in the child cohort [37,61]. Consequently, the V and Cr (with mean HI values of 0.24 and 0.25 for children, Table S2) exposure to the SPM is non-negligible in this study. Considering species-specific toxicity, arsenic (As) mainly afflicts the mucous membrane by directly damaging the capillaries [37,62]; chromium (Cr) can result in asphyxia via reducing oxygen demand of the biochemical process [63]; and vanadium (V) exhibits hepatotoxic, nephrotoxic properties and reproductive system toxicity [64]. Here, we conclude that As is the primary health risk and more attention should also be paid to V and Cr in the Zhujiang River.

3.4.3. Heavy Metal Export Budget Estimation

Based on the concentrations of the heavy metals in SPM and the discharge of the wet season (April to September) at the last site (M18) of the Zhujiang River (River and Sediment Bulletin of China, http://www.mwr. gov.cn/sj/tjgb/zgstbcgb/), river fluxes of each heavy metal in SPM are estimated that range from 38.6 (Cd) to 16,171 (Mn) tons (Table 7). Here, we only calculate the budget of the wet season, and the results may be overestimated due to sampling only once. However, considering that we do not have any samples in the dry season, the overestimated part could approximately equal the export flux of the dry season. Therefore, our results can represent the annual export budget of SPM heavy metal to a certain extent. In combination with the data for dissolved heavy metals [32], the total export budget of each heavy metal was evaluated and decreased in the order of Mn > V > Cr > Ni > Cu > Pb > Cd (Table 7). To eliminate the large uncertainty in evaluation, high-frequency samplings and observations are needed to quantify the annual heavy metal budget, especially in the wet flow season, when the heavy metal concentrations could vary significantly after a storm event.

4. Conclusions

In conclusion, this study indicates that systematic analyses of data on nine heavy metal(loid)s in SPM samples of the Zhujiang River using multi-indicators/statistical techniques—including partition coefficient, enrichment factor (EF), geo-accumulation index (Igeo), toxic risk index, hazard index, correlation analysis and principal component analysis—can provide important support regarding the prevention–control of heavy metal pollution, and health risk control in the whole basin. Our results show that the SPM samples contained high concentrations of several heavy metal(loid)s, including Cr, Mn, Zn, As, and Cd (higher than all soil background values), and the investigated heavy metal(loid)s are powerfully adsorbed by the SPM during water/particle interaction. In particular, the enrichments of As and Cd are noticeable in the SPM, with the consistently high EF and Igeo values. Anthropogenic emissions are the main source of the SPM extremely enriched elements (As and Cd), while natural origins are the source responsible for V, Cr, Mn, Ni, Cu, and Pb, and the sources of the remaining heavy metals are controlled by mixed anthropogenic and geologic origins. Moreover, our systematic risk assessment concluded that As could pose potential non-carcinogenic effects on human health and accounted for the majority of the SPM toxicity in the entire catchment. The potential risks of V and Cr with their relatively higher hazard index, is also not negligible. In order to incorporate the possible uncertainty of the single sampling and the variations of geochemical fractions of heavy metal(loid)s in SPM, and to estimate the potential risk clearly, there is a need for further research including high-frequency sampling and heavy metal(loid)s speciation analysis that would help understand the geochemical cycle of heavy metal(loid)s and its environmental effect in the Zhujiang River basin.

Supplementary Materials

The following are available online at https://www.mdpi.com/1660-4601/16/10/1843/s1, Table S1: Pearson correlation matrix of heavy metal(loid)s of the SPM in the Zhujiang River. Table S2: Hazard index (HI) calculated results for each site, and reference dose for heavy metal(loid)s in the Zhujiang River.

Author Contributions

Conceptualization, G.H.; Methodology, G.H., Q.W. and Y.T.; Investigation, G.H., Q.W. and Y.T.; Software, J.Z.; Data curation, J.Z., G.H., Q.W. and Y.T.; Writing—original draft, J.Z. and G.H.; Writing—review and editing, J.Z. and G.H.

Funding

This work was supported by the National Natural Science Foundation of China (Grant No.41325010; 41661144029).

Acknowledgments

The authors thank Danyang Zhang from China University of Geosciences, Beijing for laboratory analysis.

Conflicts of Interest

The authors declare no conflicts of interest.

References

  1. Farahat, E.; Linderholm, H.W. The effect of long-term wastewater irrigation on accumulation and transfer of heavy metals in Cupressus sempervirens leaves and adjacent soils. Sci. Total Environ. 2015, 512–513, 1–7. [Google Scholar] [CrossRef] [PubMed]
  2. Wilbers, G.-J.; Becker, M.; Nga, L.T.; Sebesvari, Z.; Renaud, F.G. Spatial and temporal variability of surface water pollution in the Mekong Delta, Vietnam. Sci. Total Environ. 2014, 485–486, 653–665. [Google Scholar] [CrossRef]
  3. Zaric, N.M.; Deljanin, I.; Ilijević, K.; Stanisavljević, L.; Ristić, M.; Gržetić, I. Assessment of spatial and temporal variations in trace element concentrations using honeybees (Apis mellifera) as bioindicators. PeerJ 2018, 6, e5197. [Google Scholar] [CrossRef]
  4. Chouba, L.; Mzoughi, N. Assessment of heavy metals in sediment and in suspended particles affected by multiple anthropogenic contributions in harbours. Int. J. Environ. Sci. Technol. 2013, 10, 779–788. [Google Scholar] [CrossRef] [Green Version]
  5. Gao, L.; Wang, Z.; Li, S.; Chen, J. Bioavailability and toxicity of trace metals (Cd, Cr, Cu, Ni, and Zn) in sediment cores from the Shima River, South China. Chemosphere 2018, 192, 31–42. [Google Scholar] [CrossRef]
  6. Hamad, S.H.; Schauer, J.J.; Shafer, M.M.; Al-Raheem, E.A.; Satar, H. The Distribution between the Dissolved and the Particulate Forms of 49 Metals across the Tigris River, Baghdad, Iraq. Sci. World J. 2012. [Google Scholar] [CrossRef]
  7. Islam, M.S.; Ahmed, M.K.; Raknuzzaman, M.; Habibullah-Al-Mamun, M.; Islam, M.K. Heavy metal pollution in surface water and sediment: A preliminary assessment of an urban river in a developing country. Ecol. Indic. 2015, 48, 282–291. [Google Scholar] [CrossRef]
  8. Li, R.; Tang, C.; Cao, Y.; Jiang, T.; Chen, J. The distribution and partitioning of trace metals (Pb, Cd, Cu, and Zn) and metalloid (As) in the Beijiang River. Environ. Monit. Assess. 2018, 190, 399. [Google Scholar] [CrossRef]
  9. Zhang, N.; Zang, S.; Sun, Q. Health risk assessment of heavy metals in the water environment of Zhalong Wetland, China. Ecotoxicology 2014, 23, 518–526. [Google Scholar] [CrossRef]
  10. Liu, C.; Fan, C.; Shen, Q.; Shao, S.; Zhang, L.; Zhou, Q. Effects of riverine suspended particulate matter on post-dredging metal re-contamination across the sediment–water interface. Chemosphere 2016, 144, 2329–2335. [Google Scholar] [CrossRef]
  11. Viers, J.; Dupré, B.; Gaillardet, J. Chemical composition of suspended sediments in World Rivers: New insights from a new database. Sci. Total Environ. 2009, 407, 853–868. [Google Scholar] [CrossRef]
  12. Liu, Z.; Zhao, Y.; Colin, C.; Stattegger, K.; Wiesner, M.G.; Huh, C.-A.; Zhang, Y.; Li, X.; Sompongchaiyakul, P.; You, C.-F.; et al. Source-to-sink transport processes of fluvial sediments in the South China Sea. Earth-Sci. Rev. 2016, 153, 238–273. [Google Scholar] [CrossRef]
  13. Asselman, N.E.M. Fitting and interpretation of sediment rating curves. J. Hydrol. 2000, 234, 228–248. [Google Scholar] [CrossRef]
  14. Zhang, W.; Wei, X.; Jinhai, Z.; Yuliang, Z.; Zhang, Y. Estimating suspended sediment loads in the Pearl River Delta region using sediment rating curves. Cont. Shelf Res. 2012, 38, 35–46. [Google Scholar] [CrossRef]
  15. Beltrame, M.O.; De Marco, S.G.; Marcovecchio, J.E. Dissolved and particulate heavy metals distribution in coastal lagoons. A case study from Mar Chiquita Lagoon, Argentina. Estuar. Coast. Shelf Sci. 2009, 85, 45–56. [Google Scholar] [CrossRef]
  16. Avila-Perez, P.; Zarazua, G.; Carapia-Morales, L.; Tejeda, S.; Diaz-Delgado, C.; Barcelo-Quintal, I. Evaluation of heavy metal and elemental composition of particles in suspended matter of the Upper Course of the Lerma River. J. Radioanal. Nucl. Chem. 2007, 273, 625–633. [Google Scholar] [CrossRef]
  17. Bhosale, U.; Sahu, K.C. Heavy metal pollution around the island city of Bombay, India. Part II: distribution of heavy metals between water, suspended particles and sediments in a polluted aquatic regime. Chem. Geol. 1991, 90, 285–305. [Google Scholar] [CrossRef]
  18. Kassim, T.I.; AlSaadi, H.A.; AlLami, A.A.; AlJaberi, H.H. Heavy metals in water, suspended particles, sediments and aquatic plants of the upper region of Euphrates river, Iraq. J. Environ. Sci. Health Part A-Environ. Sci. Eng. Toxic Hazard. Subst. Control 1997, 32, 2497–2506. [Google Scholar] [CrossRef]
  19. Matsunaga, T.; Tsuduki, K.; Yanase, N.; Kritsananuwat, R.; Ueno, T.; Hanzawa, Y.; Naganawa, H. Temporal variations in metal enrichment in suspended particulate matter during rainfall events in a rural stream. Limnology 2014, 15, 13–25. [Google Scholar] [CrossRef]
  20. Nazeer, S.; Hashmi, M.Z.; Malik, R.N. Heavy metals distribution, risk assessment and water quality characterization by water quality index of the River Soan, Pakistan. Ecol. Indic. 2014, 43, 262–270. [Google Scholar] [CrossRef]
  21. Liu, J.; Li, S.-L.; Chen, J.-B.; Zhong, J.; Yue, F.-J.; Lang, Y.; Ding, H. Temporal transport of major and trace elements in the upper reaches of the Xijiang River, SW China. Environ. Earth Sci. 2017, 76, 299. [Google Scholar] [CrossRef]
  22. Nie, F.-H.; Li, T.; Yao, H.-F.; Feng, M.; Zhang, G.-K. Characterization of suspended solids and particle-bound heavy metals in a first flush of highway runoff. J. Zhejiang Univ. Sci. A 2008, 9, 1567–1575. [Google Scholar] [CrossRef]
  23. Yao, Q.Z.; Wang, X.J.; Jian, H.M.; Chen, H.T.; Yu, Z.G. Characterization of the Particle Size Fraction associated with Heavy Metals in Suspended Sediments of the Yellow River. Int. J. Environ. Res. Public Health 2015, 12, 6725–6744. [Google Scholar] [CrossRef]
  24. Li, R.; Tang, C.; Li, X.; Jiang, T.; Shi, Y.; Cao, Y. Reconstructing the historical pollution levels and ecological risks over the past sixty years in sediments of the Beijiang River, South China. Sci. Total Environ. 2019, 649, 448–460. [Google Scholar] [CrossRef]
  25. Han, G.; Lv, P.; Tang, Y.; Song, Z. Spatial and temporal variation of H and O isotopic compositions of the Xijiang River system, Southwest China. Isot. Environ. Health Stud. 2018, 54, 137–146. [Google Scholar] [CrossRef]
  26. Li, C.; Li, S.-L.; Yue, F.-J.; Liu, J.; Zhong, J.; Yan, Z.-F.; Zhang, R.-C.; Wang, Z.-J.; Xu, S. Identification of sources and transformations of nitrate in the Xijiang River using nitrate isotopes and Bayesian model. Sci. Total Environ. 2019, 646, 801–810. [Google Scholar] [CrossRef]
  27. Zhen, G.; Li, Y.; Tong, Y.; Yang, L.; Zhu, Y.; Zhang, W. Temporal variation and regional transfer of heavy metals in the Pearl (Zhujiang) River, China. Environ. Sci. Pollut. Res. 2016, 23, 8410–8420. [Google Scholar] [CrossRef]
  28. Niu, H.Y.; Deng, W.J.; Wu, Q.H.; Chen, X.G. Potential toxic risk of heavy metals from sediment of the Pearl River in South China. J. Environ. Sci. 2009, 21, 1053–1058. [Google Scholar] [CrossRef]
  29. Zhang, J.; Yan, Q.; Jiang, J.; Song, B.; Chen, T. Distribution and risk assessment of heavy metals in river surface sediments of middle reach of Xijiang River basin, China. Hum. Ecol. Risk Assess. 2018, 24, 347–361. [Google Scholar] [CrossRef]
  30. Zhang, C.; Wang, L. Multi-element geochemistry of sediments from the Pearl River system, China. Appl. Geochem. 2001, 16, 1251–1259. [Google Scholar] [CrossRef]
  31. Liu, S.; Wang, Z.; Zhang, Y.; Liu, Y.; Yuan, W.; Zhang, T.; Liu, Y.; Li, P.; He, L.; Chen, J. Distribution and partitioning of heavy metals in large anthropogenically impacted river, the Pearl River, China. Acta Geochim. 2019. [Google Scholar] [CrossRef]
  32. Zeng, J.; Han, G.; Wu, Q.; Tang, Y. Geochemical characteristics of dissolved heavy metals in Zhujiang River, Southwest China: Spatial-temporal distribution, source, export flux estimation, and a water quality assessment. PeerJ 2019, 7, e6578. [Google Scholar] [CrossRef]
  33. Tang, Y.; Han, G. Characteristics of major elements and heavy metals in atmospheric dust in Beijing, China. J. Geochem. Explor. 2017, 176, 114–119. [Google Scholar] [CrossRef]
  34. Audry, S.; Schäfer, J.; Blanc, G.; Jouanneau, J.-M. Fifty-year sedimentary record of heavy metal pollution (Cd, Zn, Cu, Pb) in the Lot River reservoirs (France). Environ. Pollut. 2004, 132, 413–426. [Google Scholar] [CrossRef]
  35. Taylor, S.R.; McLennan, S.M. The geochemical evolution of the continental-crust. Rev. Geophys. 1995, 33, 241–265. [Google Scholar] [CrossRef]
  36. Centre, C.N.E.M. Chinese Soil Element Background Value; China Environmental Science Press: Beijing, China, 1990. [Google Scholar]
  37. Wu, T.; Bi, X.; Li, Z.; Sun, G.; Feng, X.; Shang, L.; Zhang, H.; He, T.; Chen, J. Contaminations, Sources, and Health Risks of Trace Metal(loid)s in Street Dust of a Small City Impacted by Artisanal Zn Smelting Activities. Int. J. Environ. Res. Public Health 2017, 14, 961. [Google Scholar] [CrossRef]
  38. Müller, G. Index of geoaccumulation in sediments of the Rhine River. Geochem. J. 1969, 8, 108–118. [Google Scholar]
  39. Gong, Q.; Deng, J.; Xiang, Y.; Wang, Q.; Yang, L. Calculating Pollution Indices by Heavy Metals in Ecological Geochemistry Assessment and a Case Study in Parks of Beijing. J. China Univ. Geosci. 2008, 19, 230–241. [Google Scholar] [CrossRef]
  40. MacDonald, D.D.; Ingersoll, C.G.; Berger, T.A. Development and Evaluation of Consensus-Based Sediment Quality Guidelines for Freshwater Ecosystems. Arch. Environ. Contam. Toxicol. 2000, 39, 20–31. [Google Scholar] [CrossRef]
  41. U.S. Environmental Protection Agency (EPA). Risk Assessment: “Supplemental Guidance for Dermal Risk Assessment”. Part E of Risk Assessment Guidance for Superfund, Human Health Evaluation Manual (Volume I). 16 August 2004. Available online: www.epa.gov/risk/risk-assessment-guidance-superfund-rags-part-e (accessed on 23 May 2019).
  42. Li, S.; Zhang, Q. Risk assessment and seasonal variations of dissolved trace elements and heavy metals in the Upper Han River, China. J. Hazard. Mater. 2010, 181, 1051–1058. [Google Scholar] [CrossRef]
  43. Wang, J.; Liu, G.; Liu, H.; Lam, P.K. Multivariate statistical evaluation of dissolved trace elements and a water quality assessment in the middle reaches of Huaihe River, Anhui, China. Sci. Total Environ. 2017, 583, 421–431. [Google Scholar] [CrossRef]
  44. Zheng, N.; Liu, J.; Wang, Q.; Liang, Z. Health risk assessment of heavy metal exposure to street dust in the zinc smelting district, Northeast of China. Sci. Total Environ. 2010, 408, 726–733. [Google Scholar] [CrossRef]
  45. Wan, D.J.; Zhan, C.L.; Yang, G.L.; Liu, X.Q.; Yang, J.S. Preliminary Assessment of Health Risks of Potentially Toxic Elements in Settled Dust over Beijing Urban Area. Int. J. Environ. Res. Public Health 2016, 13, 491. [Google Scholar] [CrossRef]
  46. Loska, K.; Wiechuła, D. Application of principal component analysis for the estimation of source of heavy metal contamination in surface sediments from the Rybnik Reservoir. Chemosphere 2003, 51, 723–733. [Google Scholar] [CrossRef]
  47. Li, S.; Li, J.; Zhang, Q. Water quality assessment in the rivers along the water conveyance system of the Middle Route of the South to North Water Transfer Project (China) using multivariate statistical techniques and receptor modeling. J. Hazard. Mater. 2011, 195, 306–317. [Google Scholar] [CrossRef]
  48. Gao, L.; Wang, Z.; Shan, J.; Chen, J.; Tang, C.; Yi, M.; Zhao, X. Distribution characteristics and sources of trace metals in sediment cores from a trans-boundary watercourse: An example from the Shima River, Pearl River Delta. Ecotoxicol. Environ. Saf. 2016, 134, 186–195. [Google Scholar] [CrossRef]
  49. Nguyen, H.L.; Leermakers, M.; Elskens, M.; De Ridder, F.; Doan, T.H.; Baeyens, W. Correlations, partitioning and bioaccumulation of heavy metals between different compartments of Lake Balaton. Sci. Total Environ. 2005, 341, 211–226. [Google Scholar] [CrossRef]
  50. Drndarski, N.; Stojić, D.; Župančić, M.; Čupić, S. Determination of partition coefficients of metals in the Sava River environment. J. Radioanal. Nucl. Chem. 1990, 140, 341–348. [Google Scholar] [CrossRef]
  51. Duc, T.A.; Loi, V.D.; Thao, T.T. Partition of heavy metals in a tropical river system impacted by municipal waste. Environ. Monit. Assess. 2013, 185, 1907–1925. [Google Scholar] [CrossRef]
  52. Huo, W.; Chen, J. Water-particulate distribution coefficient of heavy metal and application in sediment quality criteria in China rivers. Environ. Sci. 1997, 18, 10–13. (in Chinese). [Google Scholar]
  53. Allison, J.D.; Allison, T.L. Partition coefficients for metals in surface water, soil, and waste; EPA/600/R-05/074; United States Environmental Protection Agency: Washington, DC, USA, 2005.
  54. Helena, B.; Pardo, R.; Vega, M.; Barrado, E.; Fernandez, J.M.; Fernandez, L. Temporal evolution of groundwater composition in an alluvial aquifer (Pisuerga River, Spain) by principal component analysis. Water Res. 2000, 34, 807–816. [Google Scholar] [CrossRef]
  55. Liu, C.-W.; Lin, K.-H.; Kuo, Y.-M. Application of factor analysis in the assessment of groundwater quality in a blackfoot disease area in Taiwan. Sci. Total Environ. 2003, 313, 77–89. [Google Scholar] [CrossRef]
  56. Krishna, A.K.; Satyanarayanan, M.; Govil, P.K. Assessment of heavy metal pollution in water using multivariate statistical techniques in an industrial area: A case study from Patancheru, Medak District, Andhra Pradesh, India. J. Hazard. Mater. 2009, 167, 366–373. [Google Scholar] [CrossRef]
  57. Li, S.; Zhang, Q. Spatial characterization of dissolved trace elements and heavy metals in the upper Han River (China) using multivariate statistical techniques. J. Hazard. Mater. 2010, 176, 579–588. [Google Scholar] [CrossRef] [PubMed]
  58. Li, J.; He, M.; Han, W.; Gu, Y. Analysis and assessment on heavy metal sources in the coastal soils developed from alluvial deposits using multivariate statistical methods. J. Hazard. Mater. 2009, 164, 976–981. [Google Scholar] [CrossRef] [PubMed]
  59. Zhang, H.; Shan, B. Historical records of heavy metal accumulation in sediments and the relationship with agricultural intensification in the Yangtze–Huaihe region, China. Sci. Total Environ. 2008, 399, 113–120. [Google Scholar] [CrossRef]
  60. Ferreira-Baptista, L.; De Miguel, E. Geochemistry and risk assessment of street dust in Luanda, Angola: A tropical urban environment. Atmos. Environ. 2005, 39, 4501–4512. [Google Scholar] [CrossRef] [Green Version]
  61. De Miguel, E.; Iribarren, I.; Chacón, E.; Ordoñez, A.; Charlesworth, S. Risk-based evaluation of the exposure of children to trace elements in playgrounds in Madrid (Spain). Chemosphere 2007, 66, 505–513. [Google Scholar] [CrossRef]
  62. Tanda, S.; Licbinsky, R.; Hegrova, J.; Faimon, J.; Goessler, W. Arsenic speciation in aerosols of a respiratory therapeutic cave: A first approach to study arsenicals in ultrafine particles. Sci. Total Environ. 2019, 651, 1839–1848. [Google Scholar] [CrossRef]
  63. Arcega-Cabrera, F.; Fargher, L.; Quesadas-Rojas, M.; Moo-Puc, R.; Oceguera-Vargas, I.; Noreña-Barroso, E.; Yáñez-Estrada, L.; Alvarado, J.; González, L.; Pérez-Herrera, N.; et al. Environmental Exposure of Children to Toxic Trace Elements (Hg, Cr, As) in an Urban Area of Yucatan, Mexico: Water, Blood, and Urine Levels. Bull. Environ. Contam. Toxicol. 2018, 100, 620–626. [Google Scholar] [CrossRef]
  64. Wilk, A.; Szypulska-Koziarska, D.; Wiszniewska, B. The toxicity of vanadium on gastrointestinal, urinary and reproductive system, and its influence on fertility and fetuses malformations. Postepy Hig. I Med. Dosw. 2017, 71, 850–859. [Google Scholar] [CrossRef] [PubMed]
Figure 1. Map showing sampling locations and sample numbers of the Zhujiang River.
Ijerph 16 01843 g001
Figure 2. Abundances of nine heavy metal(loid)s in SPM normalized to local soil in the Zhujiang River.
Ijerph 16 01843 g002
Figure 3. Enrichment factors (EF) of SPM in the Zhujiang River; (a) headstream, (b) downstream.
Ijerph 16 01843 g003
Figure 4. Geo-accumulation index (Igeo) of heavy metal(loid)s of the SPM.
Ijerph 16 01843 g004
Figure 5. 3D plot of scores for heavy metal(loid)s obtained from PCA results of SPM in the Zhujiang River.
Ijerph 16 01843 g005
Figure 6. The toxic risk index (TRI) of heavy metal(loid)s of SPM in the Zhujiang River.
Ijerph 16 01843 g006
Figure 7. Hazard index (HI) for each metal(loid) of SPM in the Zhujiang River.
Ijerph 16 01843 g007
Table 1. Contamination and toxic risk categories based on enrichment factor (EF), geo-accumulation index (Igeo) and toxic risk index (TRI).
EFEnrichment LevelIgeoPollution IntensityTRIToxic Risk
<1no enrichment<0unpolluted<5no toxic risk
1–3minor enrichment0–1lightly polluted5–10low toxic risk
3–5moderate enrichment 1–2moderately polluted10–15moderate toxic risk
5–10moderately severe enrichment2–3moderately to heavily polluted15–20considerable toxic risk
10–25severe enrichment3–4heavily polluted>20very high toxic risk
25–50very severe enrichment4–5heavily to extremely polluted
>50extremely severe enrichment>5extremely polluted
Table 2. Values and factors used for non-carcinogenic hazard health risk assessment.
ParameterPhysical MeaningUnitChildrenAdultsReference
CConcentration of heavy metal(loid)s in SPMmg kg−1 This study
EFExposure frequencyday year−1350350[41]
EDExposure durationyear630[41]
SAExposed skin areacm218005000[37]
AFAdherence factormg cm−2 day−111[37]
ABSDermal absorption factor-0.03 for As; 0.001 for other metals0.03 for As; 0.001 for other metals[37,44]
BWAverage body weight kg1555.9[37]
ATAverage timeday365 × ED365 × ED[37,44]
Table 3. Descriptive statistics of heavy metal(loid)s in suspended particulate matter (SPM) and the SPM concentration of the Zhujiang River (n = 22), and the local soil background values of the Zhujiang River basin.
ParameterVCrMnNiCuZnAsCdPbSPM Concentration
Min10.920.7152.713.113.649.333.52.18.28.0
Max270.3221.51487.162.596.4732.8317.68.954.7944.0
Med150.5147.71103.641.636.3139.1109.23.538.6138.0
AM143.6129.1982.439.944.1186.8116.83.838.1177.2
SD61.548.8379.712.019.9138.151.61.611.6205.5
SGZ138.895.9794.039.132.099.520.00.6635.2
SYN154.965.2626.042.546.389.718.40.2240.6
SGDGX97.666.3362.520.522.461.514.70.1630.0
TEL43.422.731.6121.09.81.035.8
PEL111.048.6149.0459.033.05.0128.0
K-S test0.960.290.550.530.320.140.160.100.650.22
Note: Units in mg kg−1 for heavy metal(loid)s, mg L−1 for SPM concentration; Min, minimum; Max, Maximum; Med, median; AM, arithmetical mean; SD, arithmetical standard deviation; SGZ, soil background values of Guizhou province [36]; SYN, soil background values of Yunnan province [36]; SGDGX, mean soil background values of Guangdong and Guangxi provinces [36]; TEL, threshold effect level [40]; PEL, probable effect level [40]; K–S test, Kolmogorov–Smirnov test; —, no data.
Table 4. Comparison of heavy metals in SPM of global rivers (unit in mg kg−1).
RiversVCr MnNi Cu Zn As CdPb
Zhujiang River (this study)143.6129.1 982.4 39.9 44.1 186.8 116.8 3.8 38.1
World River average129.0130.0 1679.0 74.5 75.9 208.0 36.3 1.6 61.1
South American River average131.079.0 700.0 46.0 59.0 184.0 76.0
North American River average188.0115.0 1430.0 50.0 34.0 137.0 22.0
Asia (Russia) River average128.0260.0 5767.0 123.0 145.0 300.0 35.0
Asia (China) River average135.0117.0 970.0 68.0 53.0 145.0 64.0
Africa River average116.0130.0 1478.0 78.0 53.0 130.0 46.0
Europe River average85.0164.0 1884.0 66.0 172.0 346.0 71.0
Note: The data for global rivers are from Viers et al. [11]; —, no data.
Table 5. The partition coefficients (lgKd) of heavy metals in the Zhujiang River and global rivers.
RiverV Cr MnNi Cu CdPb
Zhujiang River
(this study)
Min3.63.34.73.72.94.65.4
Max5.04.57.04.55.35.56.2
AM4.64.26.34.24.65.05.9
Rivers in US5.14.64.74.75.6
Tigris River6.76.66.56.36.36.7
Day River5.55.05.35.45.75.3
Sava River4.74.25.94.43.93.04.6
Yangtze River4.15.03.94.14.25.2
Jialingjiang River4.35.03.84.24.85.1
Beijiang River4.74.85.2
Upper Zhujiang River5.45.66.65.34.95.15.7
Note: Min, minimum; Max, maximum; AM, arithmetical mean; —, no data; Rivers in US [53]; Tigris River [6]; Day River [51]; Sava River [50]; Yangtze River and Jialingjiang River [52]; Beijiang River [8]; Upper Zhujiang River [21].
Table 6. Varimax rotated component matrix for heavy metal(loid)s of SPM in the Zhujiang River.
VariablePC 1PC 2PC 3Communalities
V0.680.05−0.310.56
Cr0.94−0.17−0.160.94
Mn0.80−0.160.290.75
Ni0.83−0.450.030.89
Cu0.74−0.14−0.130.58
Zn−0.060.040.940.89
As−0.160.94−0.010.91
Cd−0.100.920.050.85
Pb0.86−0.020.050.75
Eigenvalues4.012.011.11
Variance (%)44.5122.3612.33
Cumulative (%)44.5166.8679.19
Note: Extraction method, principal component analysis; Rotation method, Varimax with Kaiser normalization; the “bold” values mean the factor loadings (the correlation coefficients between PC and initial variable) are “strong” or “moderate”.
Table 7. Export fluxes of heavy metals (t yr−1) and proportions (%) of SPM and the dissolved flux to the total flux in the Zhujiang River.
ParameterVCrMnNiCuCdPb
Flux%Flux%Flux%Flux%Flux%Flux%Flux%
SPM 3707832585621617199709596287838.677760.099
Dissolved736171561381061498411742211.3 238.6 1
Total flux4442 4146 16277 1207 802 50.0 768.6

