Spatiotemporal Variations of Indoor PM2.5 Concentrations in Nanjing, China


Abstract
:1. Introduction
2. Materials and Methods
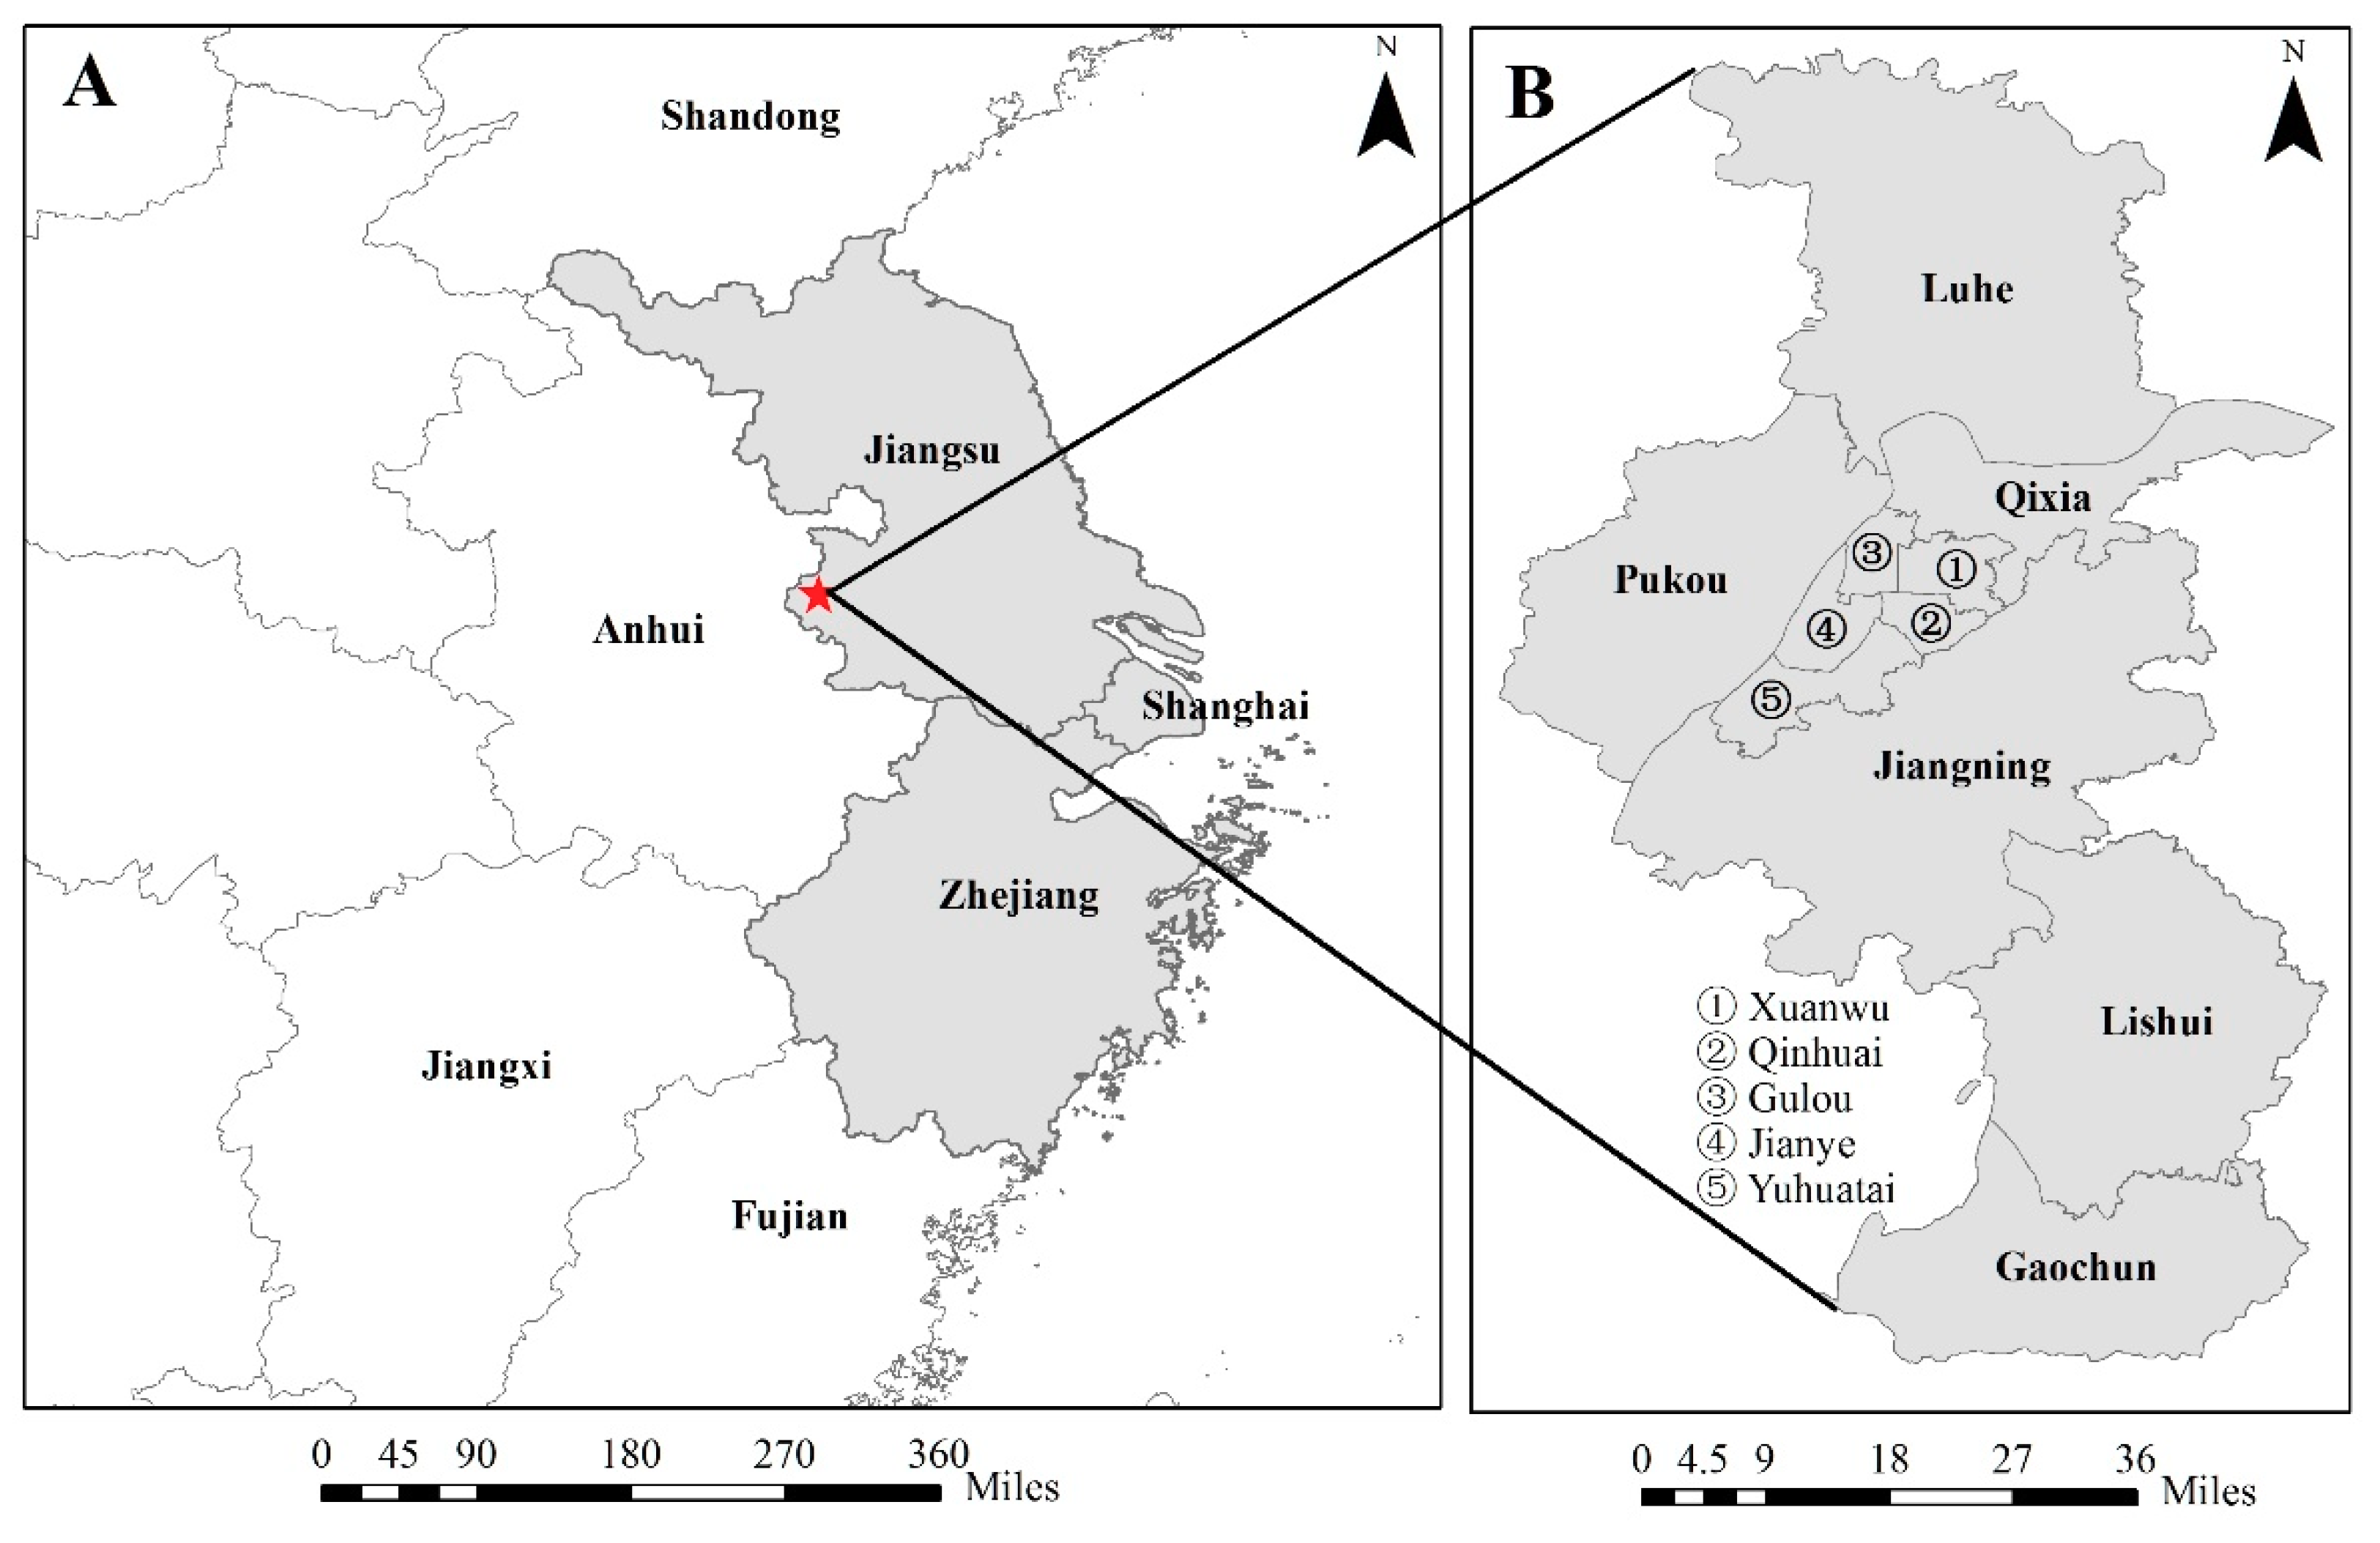
2.1. Study Area
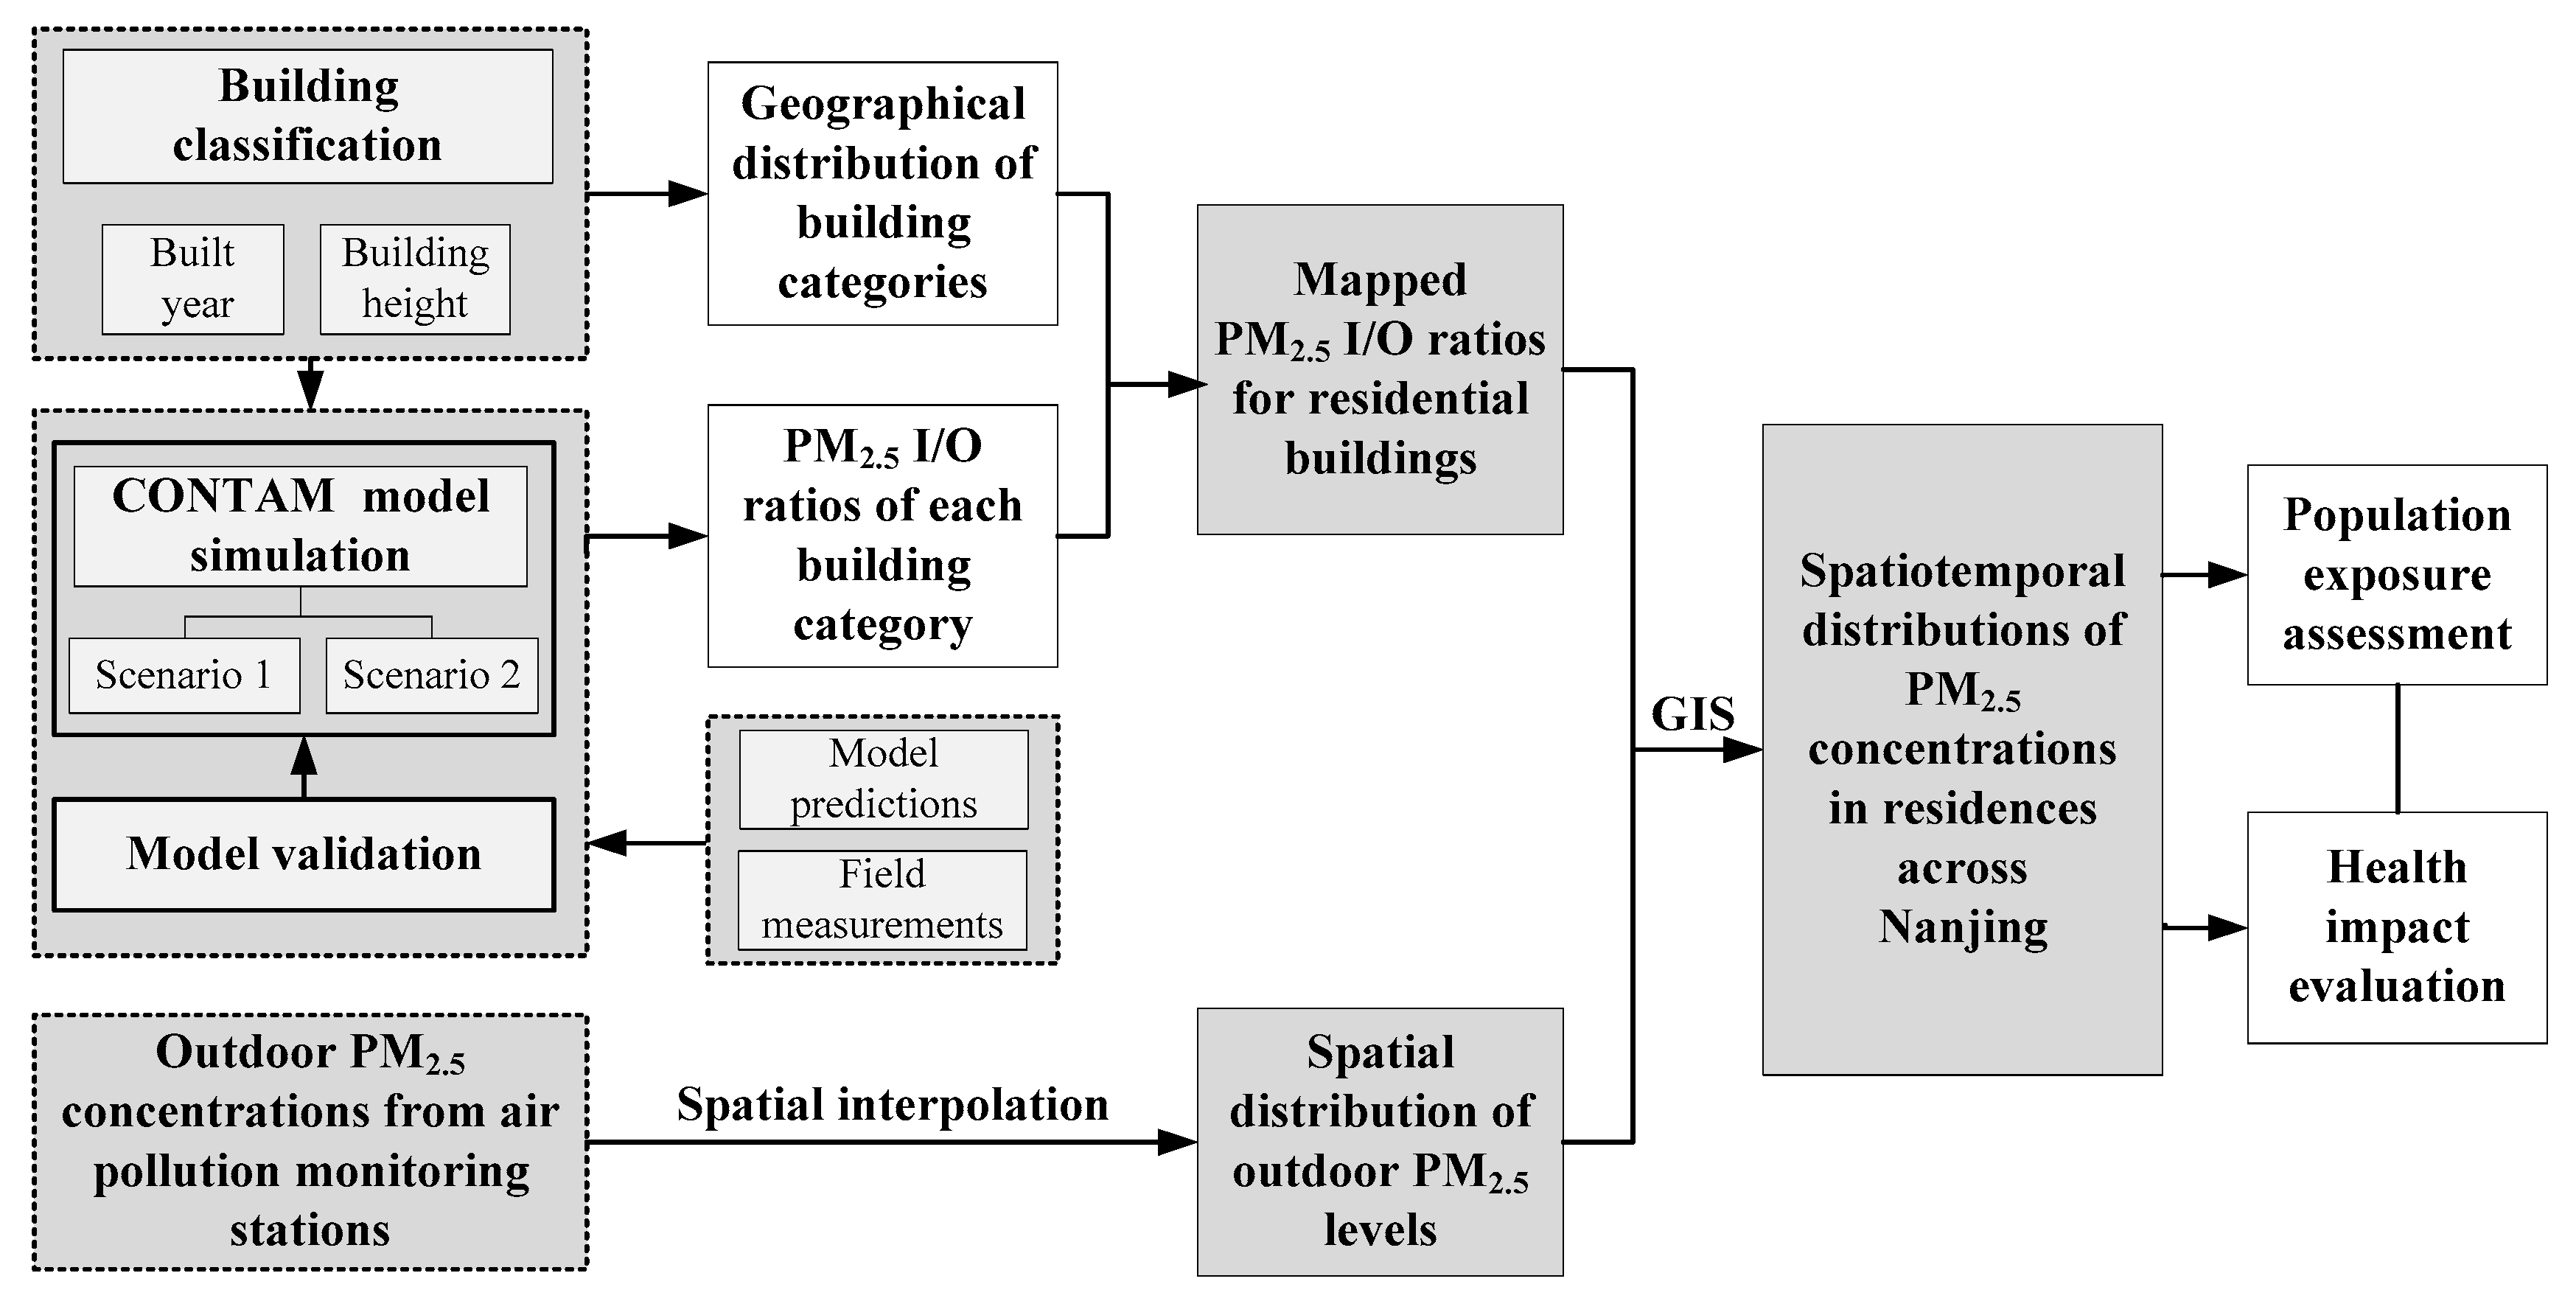
2.2. Study Design
2.3. Residential Building Category
2.4. PM2.5 I/O Ratios of Residential Buildings
2.4.1. CONTAM Model Simulation
2.4.2. Scenario Analysis
2.4.3. Data Collection and Analysis
2.4.4. Validation of the CONTAM Model
2.5. Spatiotemporal Distributions of Indoor PM2.5 Concentrations
2.5.1. Outdoor PM2.5 Concentrations
2.5.2. Mapped PM2.5 I/O Ratios for Residential Buildings
2.5.3. GIS Integration
2.6. Exposure Estimation and Health Impact Evaluation
2.7. Sensitivity Analysis
3. Results and Discussion
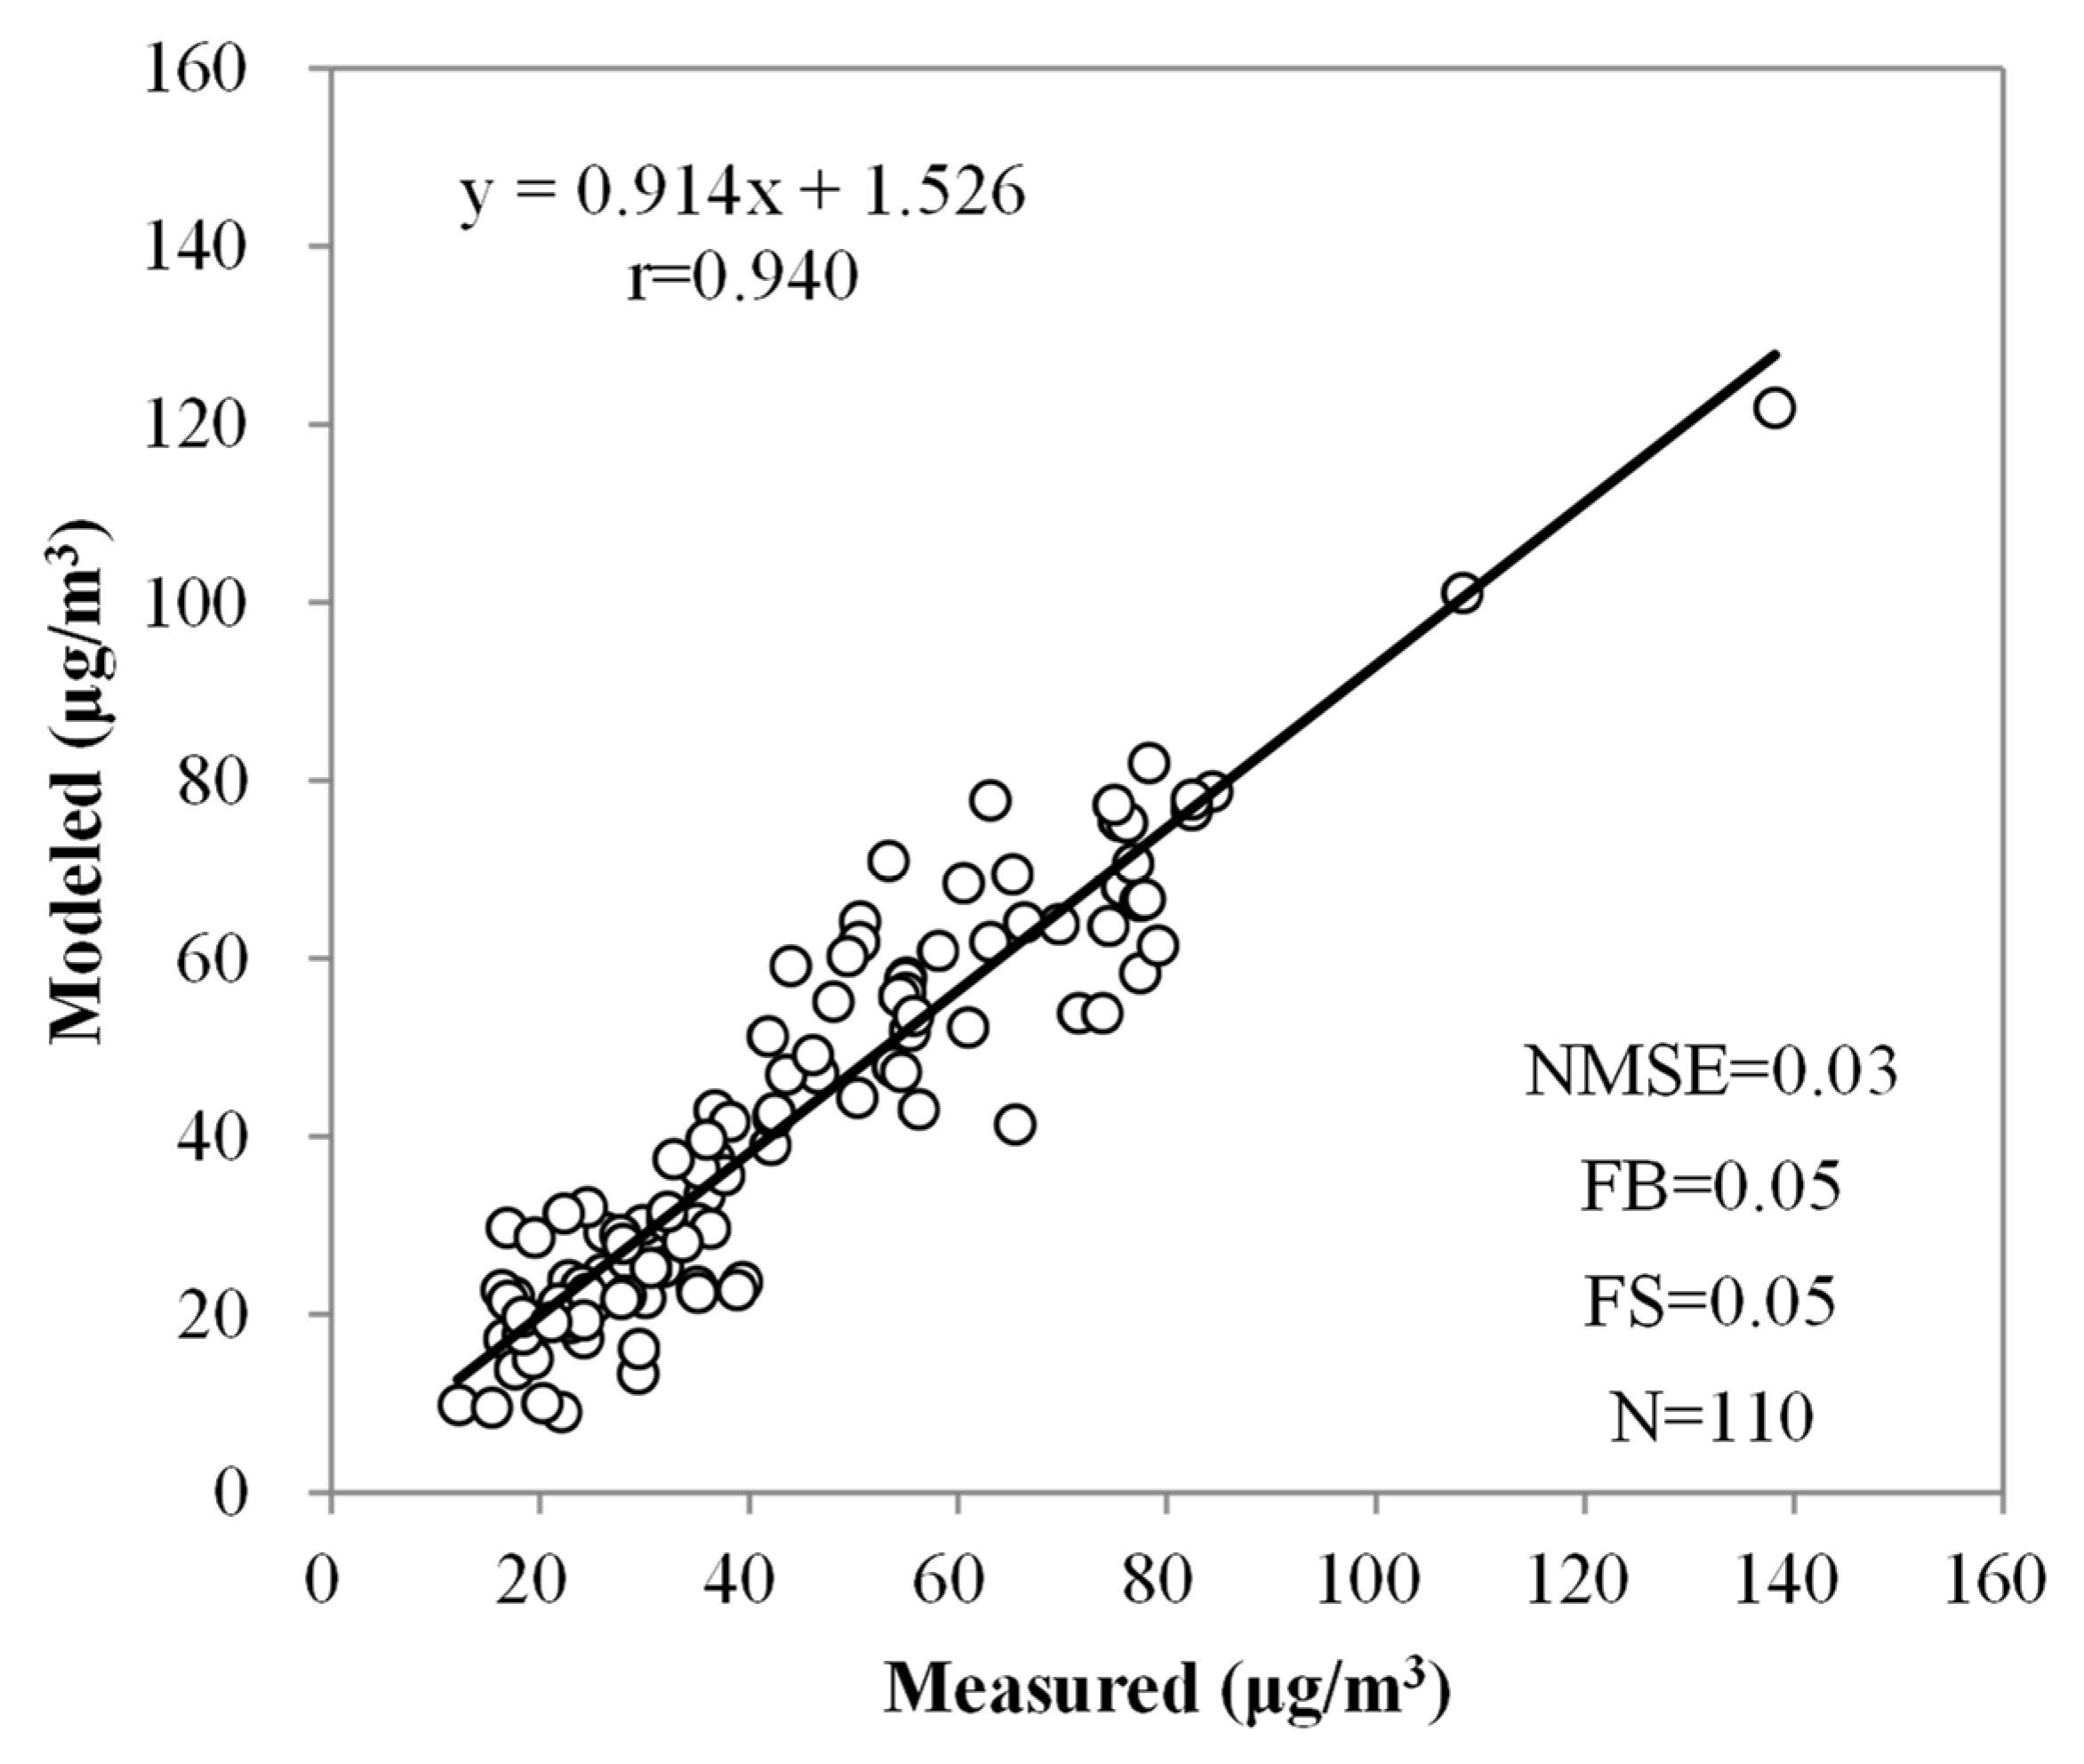
3.1. CONTAM Model Validation Result
3.2. The I/O Ratios of Each Residential Building
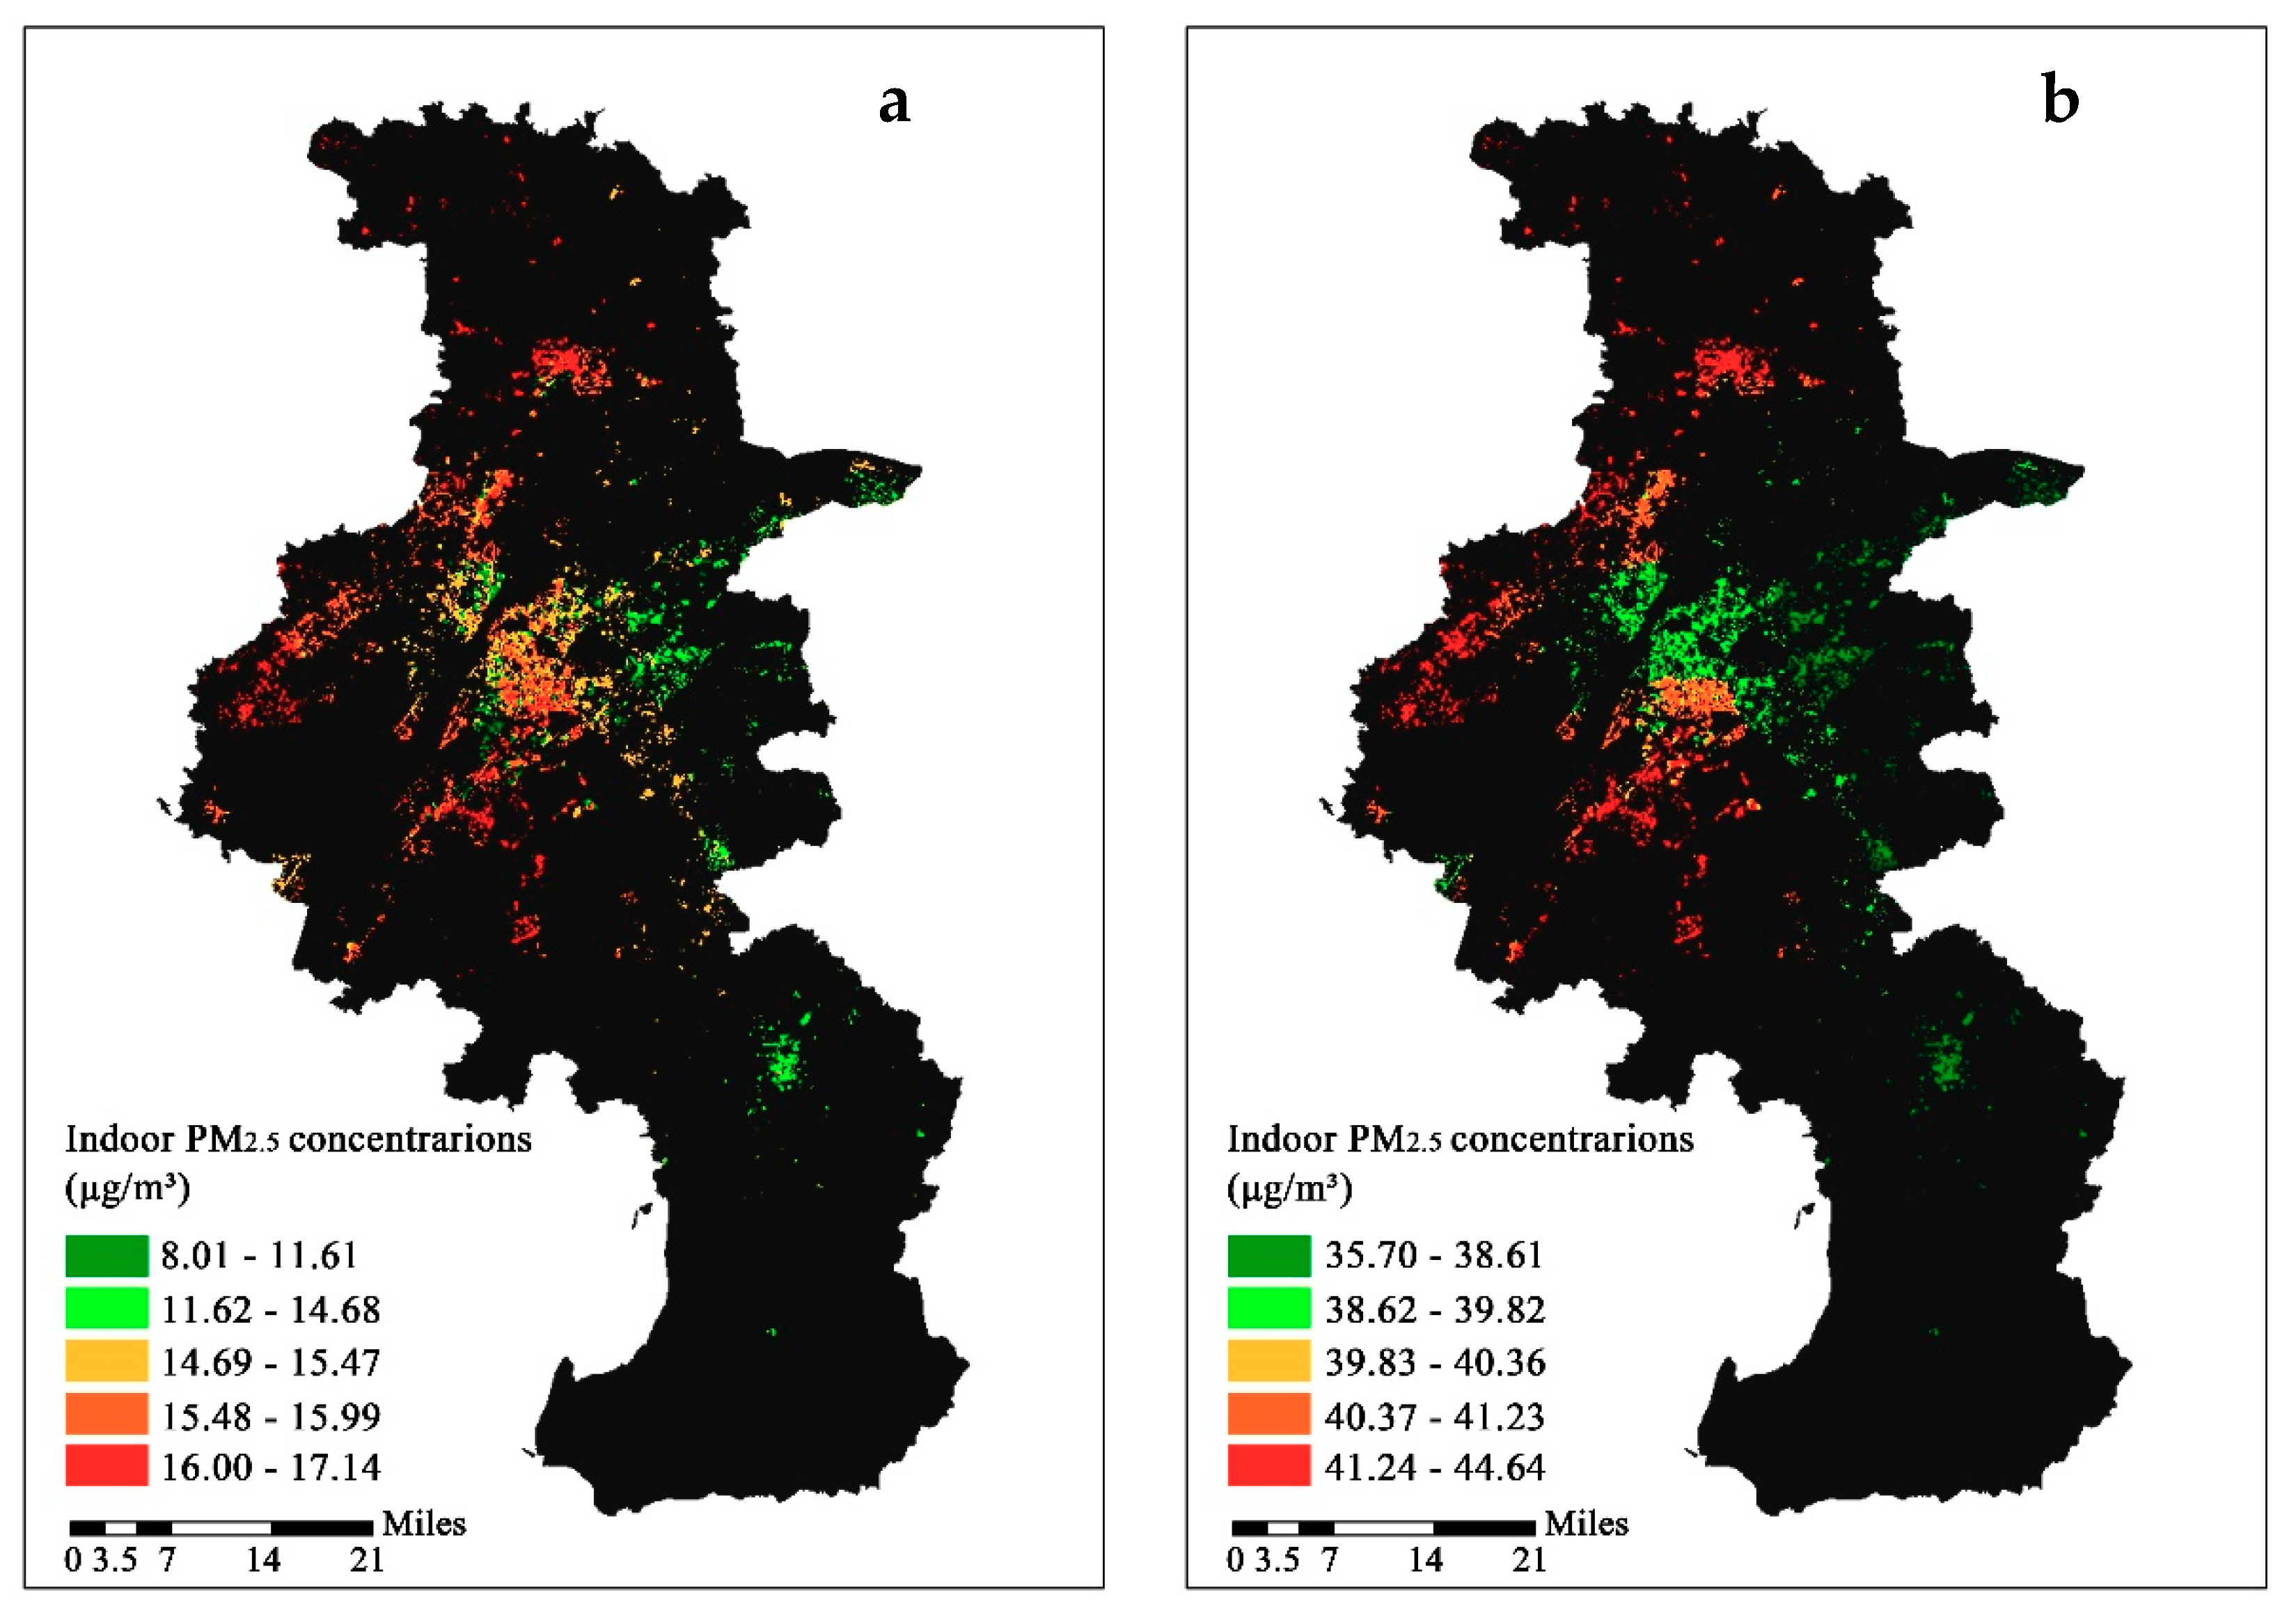
3.3. Spatial and Temporal Distributions of Indoor PM2.5 Concentrations
3.4. Exposure Estimation and Health Impact Evaluation
4. Conclusions
Supplementary Materials
Author Contributions
Funding
Acknowledgments
Conflicts of Interest
References
- Ministry of Ecology and Environment of the People’s Republic of China. Ecological Environment Status Bulletin in China in 2017; Ministry of Ecological Environment: Beijing, China, 2018.
- Liu, M.; Bi, J.; Ma, Z. Visibility-Based PM2.5 Concentrations in China: 1957–1964 and 1973–2014. Environ. Sci. Technol. 2017, 51, 13161–13169. [Google Scholar] [CrossRef] [PubMed]
- Forouzanfar, M.H.; Afshin, A.; Alexander, L.T.; Anderson, H.R.; Bhutta, Z.A.; Biryukov, S.; Brauer, M.; Burnett, R.; Cercy, K.; Charlson, F.J.; et al. Global, regional, and national comparative risk assessment of 79 behavioural, environmental and occupational, and metabolic risks or clusters of risks, 1990–2015: A systematic analysis for the Global Burden of Disease Study 2015. Lancet 2016, 388, 1659–1724. [Google Scholar] [CrossRef]
- Brunekreef, B.; Holgate, S.T. Air pollution and health. Lancet 2002, 360, 1233–1242. [Google Scholar] [CrossRef]
- Arnold, C. Disease Burdens Associated with PM2.5 Exposure How a New Model Provided Global Estimates. Environ. Health Perspect. 2014, 122, A111. [Google Scholar] [CrossRef] [PubMed]
- Lin, H.; Liu, T.; Xiao, J.; Zeng, W.; Li, X.; Guo, L.; Xu, Y.; Zhang, Y.; Vaughn, M.G.; Nelson, E.J.; et al. Quantifying short-term and long-term health benefits of attaining ambient fine particulate pollution standards in Guangzhou, China. Atmos. Environ. 2016, 137, 38–44. [Google Scholar] [CrossRef]
- Fang, D.; Wang, Q.; Li, H.; Yu, Y.; Lu, Y.; Qian, X. Mortality effects assessment of ambient PM2.5 pollution in the 74 leading cities of China. Sci. Total Environ. 2016, 569, 1545–1552. [Google Scholar] [CrossRef]
- EPA. Exposure Factors Handbook, EPA/600/R-090/52F; Office of Research and Development: Washington, DC, USA, 2011.
- Jang, J.Y.; Jo, S.N.; Kim, S.J.; Cheong, H.K. Development of Korean Exposure Factors Handbook. Epidemiology 2008, 19, S214. [Google Scholar] [CrossRef]
- Duan, X. Exposure Factors Handbook of Chinese Population (Adults); China Environmental Science Press: Beijing, China, 2013. [Google Scholar]
- Atkinson, R.W.; Carey, I.M.; Kent, A.J.; van Staa, T.P.; Anderson, H.R.; Cook, D.G. Long-Term Exposure to Outdoor Air Pollution and Incidence of Cardiovascular Diseases. Epidemiology 2013, 24, 44–53. [Google Scholar] [CrossRef]
- Anderson, H.R.; Favarato, G.; Atkinson, R.W. Long-term exposure to outdoor air pollution and the prevalence of asthma: Meta-analysis of multi-community prevalence studies. Air Qual. Atmos. Health 2013, 6, 57–68. [Google Scholar] [CrossRef]
- Atkinson, R.W.; Carey, I.M.; Kent, A.J.; van Staa, T.P.; Anderson, H.R.; Cook, D.G. Long-term exposure to outdoor air pollution and the incidence of chronic obstructive pulmonary disease in a national English cohort. Occup. Environ. Med. 2015, 72, 42–48. [Google Scholar] [CrossRef]
- Avery, C.L.; Mills, K.T.; Williams, R.; McGraw, K.A.; Poole, C.; Smith, R.L.; Whitsel, E.A. Estimating Error in Using Residential Outdoor PM2.5 Concentrations as Proxies for Personal Exposures: A Meta-analysis. Environ. Health Perspect. 2010, 118, 673–678. [Google Scholar] [CrossRef] [PubMed]
- Che, W.W.; Frey, H.C.; Lau, A.K.H. Comparison of Sources of Variability in School Age Children Exposure to Ambient PM2.5. Environ. Sci. Technol. 2015, 49, 1511–1520. [Google Scholar] [CrossRef] [PubMed]
- Kearney, J.; Wallace, L.; MacNeill, M.; Xu, X.; VanRyswyk, K.; You, H.; Kulka, R.; Wheeler, A.J. Residential indoor and outdoor ultrafine particles in Windsor, Ontario. Atmos. Environ. 2011, 45, 7583–7593. [Google Scholar] [CrossRef]
- Shao, Z.; Bi, J.; Ma, Z.; Wang, J. Seasonal trends of indoor fine particulate matter and its determinants in urban residences in Nanjing, China. Build. Environ. 2017, 125, 319–325. [Google Scholar] [CrossRef]
- Rohra, H.; Tiwari, R.; Khare, P.; Taneja, A. Indoor-outdoor association of particulate matter and bounded elemental composition within coarse, quasi-accumulation and quasi-ultrafine ranges in residential areas of northern India. Sci. Total Environ. 2018, 631, 1383–1397. [Google Scholar] [CrossRef] [PubMed]
- Kearney, J.; Wallace, L.; MacNeill, M.; Heroux, M.-E.; Kindzierski, W.; Wheeler, A. Residential infiltration of fine and ultrafine particles in Edmonton. Atmos. Environ. 2014, 94, 793–805. [Google Scholar] [CrossRef] [Green Version]
- Godish, T.; Spengler, J.D. Relationships between ventilation and indoor air quality: A review. Indoor Air 1996, 6, 135–145. [Google Scholar] [CrossRef]
- Du, Y.; Wang, Y.; Du, Z.; Zhang, Y.; Xu, D.; Li, T. Modeling of residential indoor PM2.5 exposure in 37 counties in China. Environ. Pollut. 2018, 238, 691–697. [Google Scholar] [CrossRef] [PubMed]
- Tang, C.H.; Garshick, E.; Grady, S.; Coull, B.; Schwartz, J.; Koutrakis, P. Development of a modeling approach to estimate indoor-to-outdoor sulfur ratios and predict indoor PM2.5 and black carbon concentrations for Eastern Massachusetts households. J. Expos. Sci. Environ. Epidemiol. 2018, 28, 125–130. [Google Scholar] [CrossRef]
- Dols, W.S.; Polidoro, B.J. CONTAM User Guide and Program Documentation Version 3.2; NIST Technical Note 1887; National Institute of Standards and Technology: Gaithersburg, MD, USA, 2015.
- Shrubsole, C.; Ridley, I.; Biddulph, P.; Milner, J.; Vardoulakis, S.; Ucci, M.; Wilkinson, P.; Chalabi, Z.; Davies, M. Indoor PM2.5 exposure in London’s domestic stock: Modelling current and future exposures following energy efficient refurbishment. Atmos. Environ. 2012, 62, 336–343. [Google Scholar] [CrossRef]
- Fabian, P.; Adamkiewicz, G.; Levy, J.I. Simulating indoor concentrations of NO2 and PM2.5 in multifamily housing for use in health-based intervention modeling. Indoor Air 2012, 22, 12–23. [Google Scholar] [CrossRef] [PubMed]
- Mao, J.; Yang, W.; Gao, N. The transport of gaseous pollutants due to stack and wind effect in high-rise residential buildings. Build. Environ. 2015, 94, 543–557. [Google Scholar] [CrossRef]
- Shi, S.; Chen, C.; Zhao, B. Air infiltration rate distributions of residences in Beijing. Build. Environ. 2015, 92, 528–537. [Google Scholar] [CrossRef]
- Barraza, F.; Jorquera, H.; Valdivia, G.; Montoya, L.D. Indoor PM2.5 in Santiago, Chile, spring 2012: Source apportionment and outdoor contributions. Atmos. Environ. 2014, 94, 692–700. [Google Scholar] [CrossRef]
- Han, Y.; Li, X.; Zhu, T.; Lv, D.; Chen, Y.; Hou, L.; Zhang, Y.; Ren, M. Characteristics and Relationships between Indoor and Outdoor PM2.5 in Beijing: A Residential Apartment Case Study. Aerosol Air Qual. Res. 2016, 16, 2386–2395. [Google Scholar] [CrossRef]
- Kalaiarasan, G.; Balakrishnan, R.M.; Sethunath, N.A.; Manoharan, S. Source Apportionment of PM2.5 Particles: Influence of Outdoor Particles on Indoor Environment of Schools Using Chemical Mass Balance. Aerosol Air Qual. Res. 2017, 17, 616–625. [Google Scholar] [CrossRef]
- Szigeti, T.; Dunster, C.; Cattaneo, A.; Spinazze, A.; Mandin, C.; Le Ponner, E.; Fernandes, E.D.O.; Ventura, G.; Saraga, D.E.; Sakellaris, I.A.; et al. Spatial and temporal variation of particulate matter characteristics within office buildings—The OFFICAIR study. Sci. Total Environ. 2017, 587, 59–67. [Google Scholar] [CrossRef]
- Prasauskas, T.; Martuzevicius, D.; Krugly, E.; Ciuzas, D.; Stasiulaitiene, I.; Sidaraviciute, R.; Kauneliene, V.; Seduikyte, L.; Jurelionis, A. Haverinen-Shaughnessy, U. Spatial and temporal variations of particulate matter concentrations in multifamily apartment buildings. Build. Environ. 2014, 76, 10–17. [Google Scholar] [CrossRef]
- Patel, S.; Li, J.; Pandey, A.; Pervez, S.; Chakrabarty, R.K.; Biswas, P. Spatio-temporal measurement of indoor particulate matter concentrations using a wireless network of low-cost sensors in households using solid fuels. Environ. Res. 2017, 152, 59–65. [Google Scholar] [CrossRef]
- Chen, C.; Zhao, B.; Weschler, C.J. Indoor Exposure to “Outdoor PM10” Assessing Its Influence on the Relationship Between PM10 and Short-term Mortality in US Cities. Epidemiology 2012, 23, 870–878. [Google Scholar] [CrossRef]
- Zhou, B.; Zhao, B.; Guo, X.; Chen, R.; Kan, H. Investigating the geographical heterogeneity in PM10-mortality associations in the China Air Pollution and Health Effects Study (CAPES): A potential role of indoor exposure to PM10 of outdoor origin. Atmos. Environ. 2013, 75, 217–223. [Google Scholar] [CrossRef]
- Persily, A.; Musser, A.; Emmerich, S.J. Modeled infiltration rate distributions for U.S. housing. Indoor Air 2010, 20, 473–485. [Google Scholar] [CrossRef] [PubMed]
- Jung, K.H.; Bernabe, K.; Moors, K.; Yan, B.; Chillrud, S.N.; Whyatt, R.; Camann, D.; Kinney, P.L.; Perera, F.P.; Miller, R.L. Effects of Floor Level and Building Type on Residential Levels of Outdoor and Indoor Polycyclic Aromatic Hydrocarbons, Black Carbon, and Particulate Matter in New York City. Atmosphere 2011, 2, 96–109. [Google Scholar] [CrossRef] [PubMed] [Green Version]
- Nasir, Z.A.; Colbeck, I. Particulate pollution in different housing types in a UK suburban location. Sci. Total Environ. 2013, 445, 165–176. [Google Scholar] [CrossRef] [PubMed] [Green Version]
- Taylor, J.; Shrubsole, C.; Davies, M.; Biddulph, P.; Das, P.; Hamilton, I.; Vardoulakis, S.; Mavrogianni, A.; Jones, B.; Oikonomou, E. The modifying effect of the building envelope on population exposure to PM2.5 from outdoor sources. Indoor Air 2014, 24, 639–651. [Google Scholar] [CrossRef]
- Nanjing Municipal Statistical Bureau. Statistical Yearbook of Nanjing; China Statistics Press: Nanjing, China, 2016.
- Nanjing Environmental Protection Agency. Nanjing Environmental Aspect Bulletin in 2016; Nanjing Environmental Protection Agency: Nanjing, China, 2017.
- General Administration of Quality Supervision, Inspection and Quarantine of the People’s Republic of China. Graduations and Test Methods of Air Permeability, Watertightness, Wind Load Resistance Performance for Building External Windows and Doors; GB/T 7106-2008; General Administration of Quality Supervision, Inspection and Quarantine of the People’s Republic of China: Beijing, China, 2008.
- Ministry of Housing and Urban-Rural Development of the People’s Republic of China. Design Standard for Energy Efficiency of Residential Buildings in Hot Summer and Cold Winter Zone; Industry standards of the People’s Republic of China JGJ 134-2010; Ministry of Housing and Urban-Rural Development of the People’s Republic of China: Beijing, China, 2010.
- Walton, G.N.; Dols, W.S. CONTAM User Guide and Program Documentation; NISTIR 7251; National Institute of Standards and Technology: Gaithersburg, MD, USA, 2005.
- Chan, W.Y.R.; Nazaroff, W.W.; Price, P.N.; Sohn, M.D.; Gadgil, A.J. Analyzing a database of residential air leakage in the United States. Atmos. Environ. 2005, 39, 3445–3455. [Google Scholar] [CrossRef] [Green Version]
- Burke, J.M.; Zufall, M.J.; Ozkaynak, H. A population exposure model for particulate matter: Case study results for PM2.5 in Philadelphia, PA. J. Expo. Anal. Environ. Epidemiol. 2001, 11, 470–489. [Google Scholar] [CrossRef] [PubMed]
- Long, C.M.; Suh, H.H.; Catalano, P.J.; Koutrakis, P. Using time- and size-resolved particulate data to quantify indoor penetration and deposition behavior. Environ. Sci. Technol. 2001, 35, 2089–2099. [Google Scholar] [CrossRef]
- Ministry of Housing and Rural-Urban Development of Jiangsu. Design Standard of Thermo-Environment & Energy Conservation for Residential Buildings in Jiangsu Province; DGJ32/J 71-2014; Ministry of Housing and Rural-Urban Development of Jiangsu: Nanjing, China, 2014.
- Klepeis, N.E.; Nazaroff, W.W. Modeling residential exposure to secondhand tobacco smoke. Atmos. Environ. 2006, 40, 4393–4407. [Google Scholar] [CrossRef] [Green Version]
- Rim, D.; Persily, A.; Emmerich, S.; Dols, W.S.; Wallace, L. Multi-zone modeling of size-resolved outdoor ultrafine particle entry into a test house. Atmos. Environ. 2013, 69, 219–230. [Google Scholar] [CrossRef]
- ASTM. Standard Guide for Statistical Evaluation of Indoor Air Quality Models; D5157-91; American Society for Testing and Materials: West Conshohocken, PA, USA, 2003. [Google Scholar]
- Burnett, R.T.; Pope, C.A., III; Ezzati, M.; Olives, C.; Lim, S.S.; Mehta, S.; Shin, H.H.; Singh, G.; Hubbell, B.; Brauer, M.; et al. An Integrated Risk Function for Estimating the Global Burden of Disease Attributable to Ambient Fine Particulate Matter Exposure. Environ. Health Perspect. 2014, 122, 397–403. [Google Scholar] [CrossRef] [PubMed] [Green Version]
- Jiang, X.; Zhang, Q.; Zhao, H.; Geng, G.; Peng, L.; Guan, D.; Kan, H.; Huo, H.; Lin, J.; Brauer, M.; et al. Revealing the Hidden Health Costs Embodied in Chinese Exports. Environ. Sci. Technol. 2015, 49, 4381–4388. [Google Scholar] [CrossRef]
- Ostro, B. Outdoor Air Pollution: Assessing the Environmental Burden of Disease at National and Local Levels; Environmental Burden of Disease Series, No. 5; Prüss-Üstün, A., Campbell-Lendrum, D., Corvalán, C., Woodward, A., Eds.; World Health Organization: Geneva, Switzerland, 2004; Available online: http://www.who.int/quantifying_ehimpacts/ publications/ebd5.pdf (accessed on 3 January 2019).
- GBD. Global Burden of Disease Study 2016 (GBD 2016) Results; Global Burden of Disease Collaborative Network; Institute for Health Metrics and Evaluation (IHME): Seattle, WA, USA, 2017; Available online: http://ghdx.healthdata.org/gbd-results-tool (accessed on 3 January 2019).
- MacNeill, M.; Kearney, J.; Wallace, L.; Gibson, M.; Heroux, M.E.; Kuchta, J.; Guernsey, J.R.; Wheeler, A.J. Quantifying the contribution of ambient and indoor-generated fine particles to indoor air in residential environments. Indoor Air 2014, 24, 362–375. [Google Scholar] [CrossRef] [PubMed]
- Zhao, W.; Cheng, J.; Guo, M.; Cao, Q.; Yin, Y.; Wang, W. Ambient Air Particulate Matter in the Yangtze River Delta Region, China: Spatial, Annual, and Seasonal Variations and Health Risks. Environ. Eng. Sci. 2011, 28, 795–802. [Google Scholar] [CrossRef]
- Kinney, P.L.; Chillrud, S.N.; Ramstrom, S.; Ross, J.; Spengler, J.D. Exposures to multiple air toxics in New York City. Environ. Health Perspect. 2002, 110, 539–546. [Google Scholar] [CrossRef] [PubMed]
- WHO. WHO Guidelines for Indoor Air Quality: Selected Pollutants; WHO Regional Office for Europe: Copenhagen, Denmark, 2010. [Google Scholar]
- WHO. WHO Air Quality Guidelines for Particulate Matter, Ozone, Nitrogen Dioxide and Sulfur Dioxide, Globan Update 2005; WHO Regional Office for Europe: Copenhagen, Denmark, 2006. [Google Scholar]
- Wang, F.; Meng, D.; Li, X.; Tan, J. Indoor-outdoor relationships of PM2.5 in four residential dwellings in winter in the Yangtze River Delta, China. Environ. Pollut. 2016, 215, 280–289. [Google Scholar] [CrossRef] [PubMed]
- Ji, W.; Zhao, B. Contribution of outdoor-originating particles, indoor-emitted particles and indoor secondary organic aerosol (SOA) to residential indoor PM2.5 concentration: A model-based estimation. Build. Environ. 2015, 90, 196–205. [Google Scholar] [CrossRef]


| Building Code | Construction Year | Building Story | Permeability of Exterior Door and Windows a (m3/(m2·h)) | Effective Leakage Area of the Exterior Wall b (cm2/m2) |
|---|---|---|---|---|
| R01 | Before 1990 | Multistory | 7.5 | 1.88 |
| R02 | 1991–2000 | Multistory | 1.69 | |
| R03 | 2001–2010 | Multistory | 1.52 | |
| R04 | 2011–now | Multistory | 1.36 | |
| R05 | 1991–2000 | High-rise | 4.5 | 1.08 |
| R06 | 2001–2010 | High-rise | 0.97 | |
| R07 | 2011–now | High-rise | 0.87 | |
| R08 c | Unknown | Multistory | 7.5 | - |
© 2019 by the authors. Licensee MDPI, Basel, Switzerland. This article is an open access article distributed under the terms and conditions of the Creative Commons Attribution (CC BY) license (http://creativecommons.org/licenses/by/4.0/).
Share and Cite
Shao, Z.; Yin, X.; Bi, J.; Ma, Z.; Wang, J. Spatiotemporal Variations of Indoor PM2.5 Concentrations in Nanjing, China. Int. J. Environ. Res. Public Health 2019, 16, 144. https://doi.org/10.3390/ijerph16010144
Shao Z, Yin X, Bi J, Ma Z, Wang J. Spatiotemporal Variations of Indoor PM2.5 Concentrations in Nanjing, China. International Journal of Environmental Research and Public Health. 2019; 16(1):144. https://doi.org/10.3390/ijerph16010144
Chicago/Turabian StyleShao, Zhijuan, Xiangjun Yin, Jun Bi, Zongwei Ma, and Jinnan Wang. 2019. "Spatiotemporal Variations of Indoor PM2.5 Concentrations in Nanjing, China" International Journal of Environmental Research and Public Health 16, no. 1: 144. https://doi.org/10.3390/ijerph16010144