
Direct Quantification of Rare Earth Elements Concentrations in Urine of Workers Manufacturing Cerium, Lanthanum Oxide Ultrafine and Nanoparticles by a Developed and Validated ICP-MS


Abstract
:1. Introduction
2. Materials and Methods
2.1. Sampling
2.2. Reagents
2.3. Instrumentation
2.4. Sample Preparation and Quality Control
2.5. Statistical Analysis
3. Results and Discussion
3.1. Method Validation
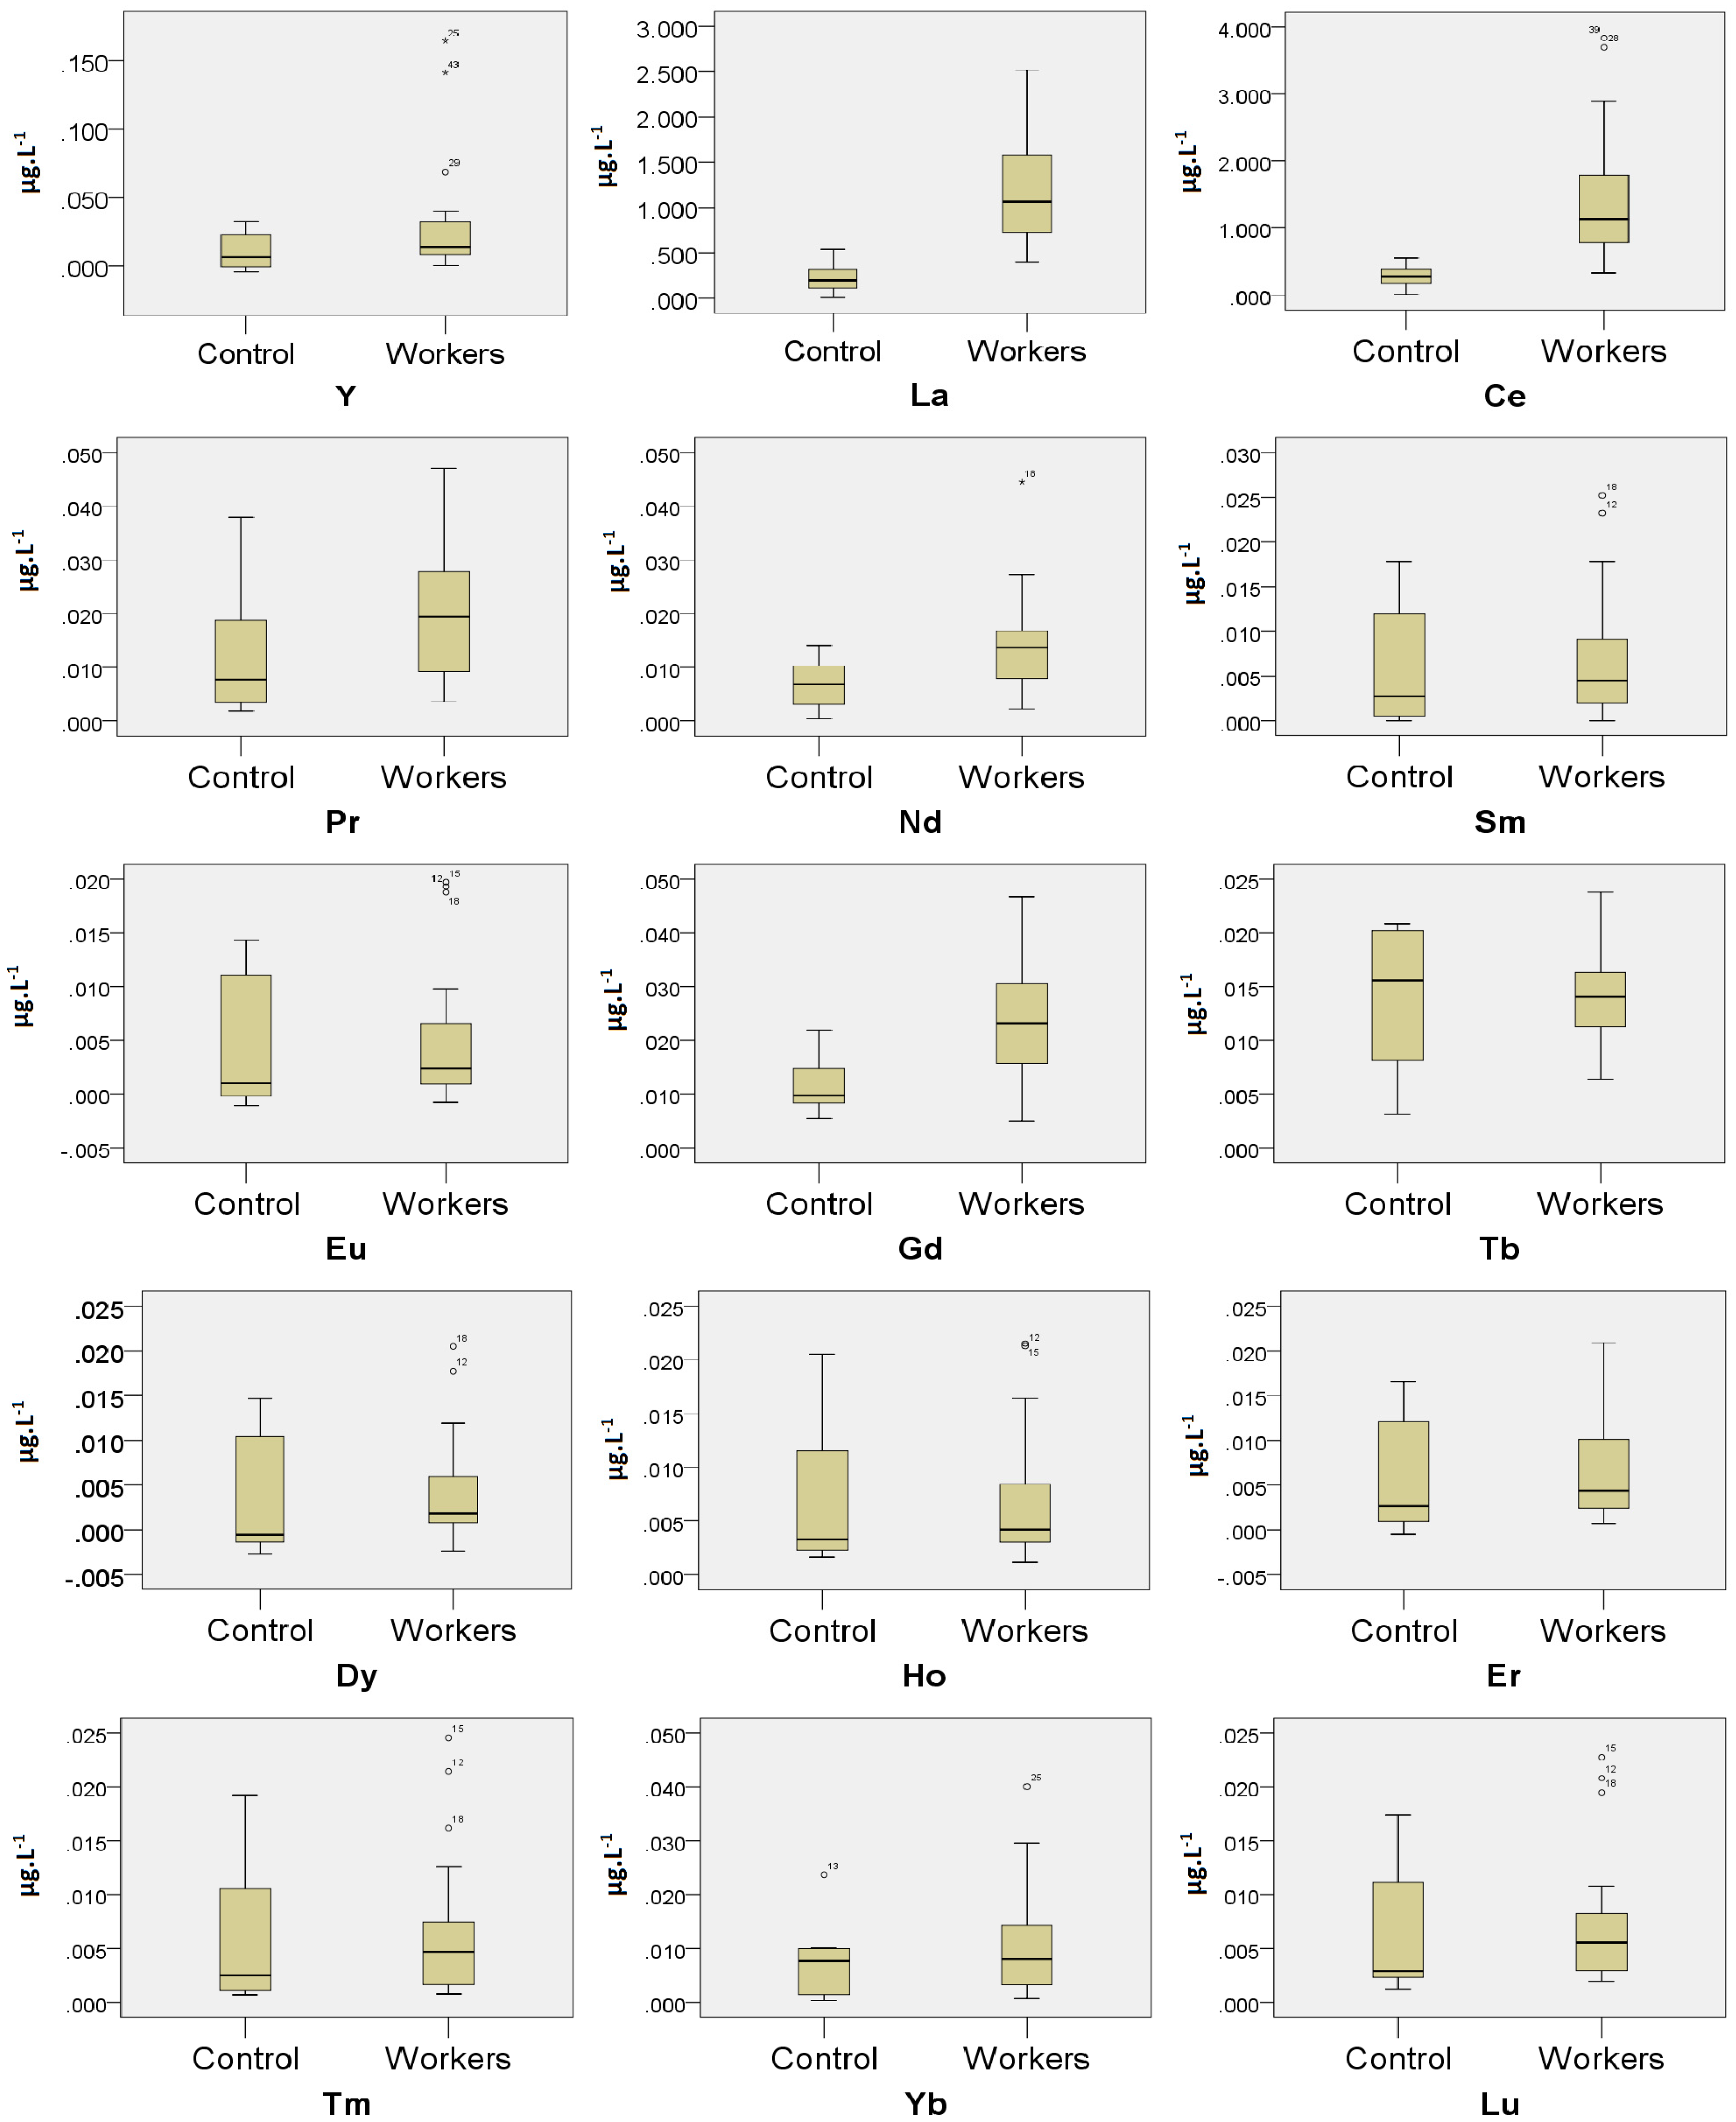
3.2. Comparison of the Urinary REEs Concentrations between the Exposed Workers and the Control
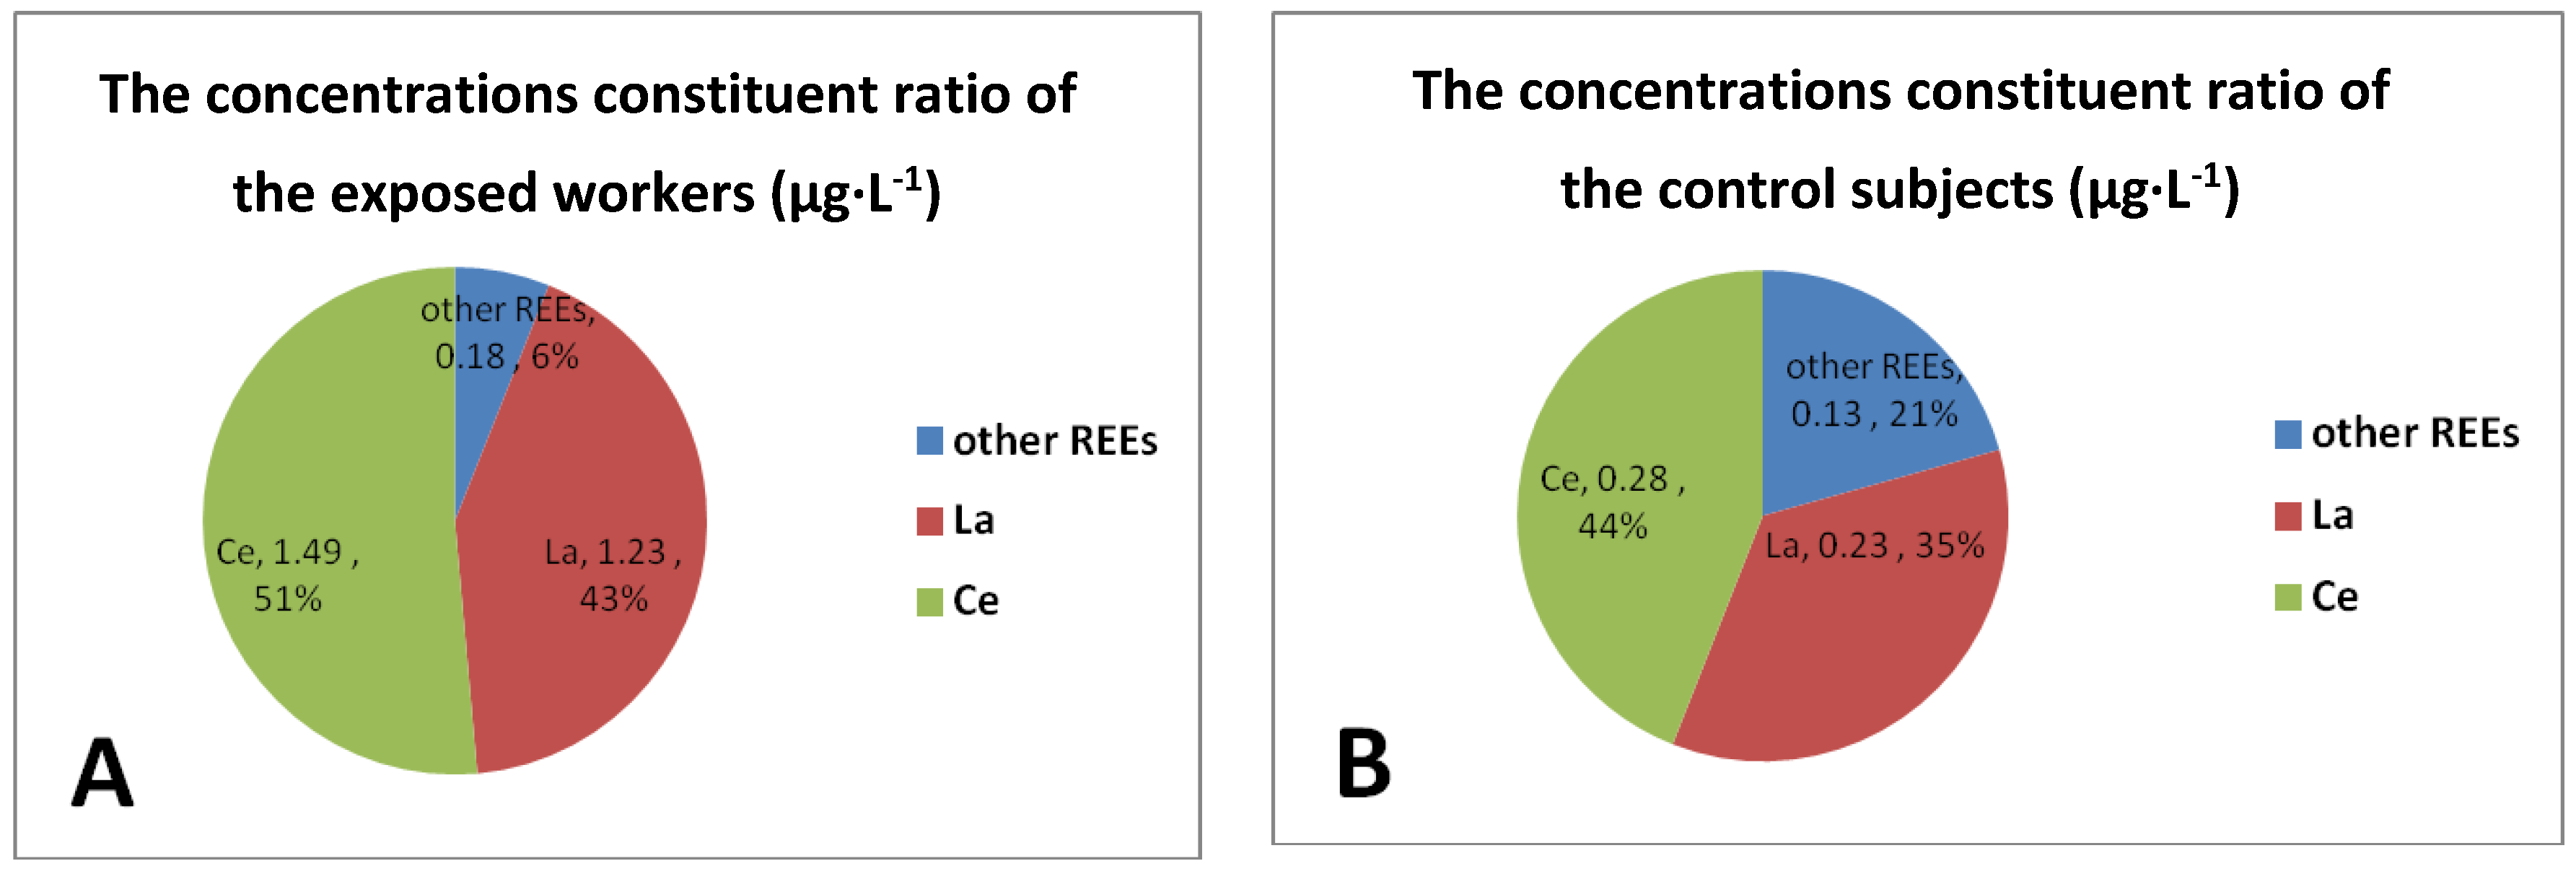
3.3. The Distribution Pattern of 15 REEs Concentrations in Urinary Samples
3.4. Comparison of the Urinary REEs Concentrations with Other Published Data
4. Conclusions
Acknowledgments
Author Contributions
Conflicts of Interest
References
- Heitland, P.; Koster, H.D. Biomonitoring of 30 trace elements in urine of children and adults by ICP-MS. Clin. Chim. Acta 2006, 365, 310–318. [Google Scholar] [CrossRef] [PubMed]
- Wang, J.; Zhou, G.; Chen, C.; Yu, H.; Wang, T.; Ma, Y.; Jia, G.; Gao, Y.; Li, B.; Sun, J.; et al. Acute toxicity and biodistribution of different sized titanium dioxide particles in mice after oral administration. Toxicol. Lett. 2007, 168, 176–185. [Google Scholar] [CrossRef] [PubMed]
- Hao, Z.; Li, Y.; Li, H.; Wei, B.; Liao, X.; Liang, T.; Yu, J. Levels of rare earth elements, heavy metals and uranium in a population living in Baiyun Obo, Inner Mongolia, China: A pilot study. Chemosphere 2015, 128, 161–170. [Google Scholar] [CrossRef] [PubMed]
- Jiang, D.G.; Yang, J.; Zhang, S.; Yang, D.J. A survey of 16 rare earth elements in the major foods in China. Biomed. Environ. Sci. 2012, 25, 267–271. [Google Scholar] [PubMed]
- Pagano, G.; Guida, M.; Tommasi, F.; Oral, R. Health effects and toxicity mechanisms of rare earth elements-knowledge gaps and research prospects. Ecotoxicol. Environ. Saf. 2015, 115, 40–48. [Google Scholar] [CrossRef] [PubMed]
- Li, X.; Chen, Z.; Chen, Z.; Zhang, Y. A human health risk assessment of rare earth elements in soil and vegetables from a mining area in Fujian Province, Southeast China. Chemosphere 2013, 93, 1240–1246. [Google Scholar] [CrossRef] [PubMed]
- Wu, H.; Li, X.; Feng, J.; Li, W.; Li, Z.; Liao, P.; Wu, Y.; Pei, F. Comparison of biochemical effects induced by Changle between male and female rats using NMR and ICP-MS techniques. J. Rare Earths 2006, 24, 108–114. [Google Scholar] [CrossRef]
- Dahle, J.T.; Arai, Y. Environmental geochemistry of cerium: Applications and toxicology of cerium oxide nanoparticles. Int. J. Environ. Res. Public Health 2015, 12, 1253–1278. [Google Scholar] [CrossRef] [PubMed]
- George, C.M.; Gamble, M.; Slavkovich, V.; Levy, D.; Ahmed, A.; Ahsan, H.; Graziano, J. A cross-sectional study of the impact of blood selenium on blood and urinary arsenic concentrations in Bangladesh. Environ. Health 2013, 12, 52. [Google Scholar] [CrossRef] [PubMed]
- Rohr, A.C.; Campleman, S.L.; Long, C.M.; Peterson, M.K.; Weatherstone, S.; Quick, W.; Lewis, A. Potential occupational exposures and health risks associated with biomass-based power generation. Int. J. Environ. Res. Public Health 2015, 12, 8542–8605. [Google Scholar] [CrossRef] [PubMed]
- Duncan, M.; Vale, S.; Santos, M.; Ribeiro, J.; Mota, J. The association between cardiovascular disease risk and parental educational level in portuguese children. Int. J. Environ. Res. Public Health 2012, 9, 4311–4320. [Google Scholar] [CrossRef] [PubMed]
- Graff, J.J.; Sathiakumar, N.; Macaluso, M.; Maldonado, G.; Matthews, R.; Delzell, E. The effect of uncertainty in exposure estimation on the exposure-response relation between 1,3-butadiene and leukemia. Int. J. Environ. Res. Public Health 2009, 6, 2436–2455. [Google Scholar] [CrossRef] [PubMed]
- Cao, L.; Zeng, J.; Liu, K.; Bao, L.; Li, Y. Characterization and cytotoxicity of PM < 0.2, PM 0.2–2.5 and PM 2.5–10 around MSWI in Shanghai, China. Int. J. Environ. Res. Public Health 2015, 12, 5076–5089. [Google Scholar] [PubMed]
- Wang, C.; Tu, Y.; Yu, Z.; Lu, R. PM2.5 and cardiovascular diseases in the elderly: An overview. Int. J. Environ. Res. Public Health 2015, 12, 8187–8197. [Google Scholar] [CrossRef] [PubMed]
- Wei, B.; Li, Y.; Li, H.; Yu, J.; Ye, B.; Liang, T. Rare earth elements in human hair from a mining area of China. Ecotoxicol. Environ. Saf. 2013, 96, 118–123. [Google Scholar] [CrossRef] [PubMed]
- Shamuyarira, K.K.; Gumbo, J.R. Assessment of heavy metals in municipal sewage sludge: A case study of Limpopo Province, South Africa. Int. J. Environ. Res. Public Health 2014, 11, 2569–2579. [Google Scholar] [CrossRef] [PubMed]
- Wang, L.; Ai, W.; Zhai, Y.; Li, H.; Zhou, K.; Chen, H. Effects of nano-ceo(2) with different nanocrystal morphologies on cytotoxicity in Hepg2 cells. Int. J. Environ. Res. Public Health 2015, 12, 10806–10819. [Google Scholar] [CrossRef] [PubMed]
- Forrer, R.; Gautschi, K.; Stroh, A.; Lutz, H. Direct determination of selenium and other trace elements in serum samples by ICP-MS. J. Trace Elem. Med. Biol. 1999, 12, 240–247. [Google Scholar] [CrossRef]
- Apostoli, P. Elements in environmental and occupational medicine. J. Chromatogr. B Anal. Technol. Biomed. Life Sci. 2002, 778, 63–97. [Google Scholar] [CrossRef]
- Niu, J.; Rasmussen, P.E.; Wheeler, A.; Williams, R.; Chénier, M. Evaluation of airborne particulate matter and metals data in personal, indoor and outdoor environments using ED-XRF and ICP-MS and co-located duplicate samples. Atmos. Environ. 2010, 44, 235–245. [Google Scholar] [CrossRef]
- Parsons, P.J.; Barbosa, F. Atomic spectrometry and trends in clinical laboratory medicine. Spectrochim. Acta B Atomic Spectrosc. 2007, 62, 992–1003. [Google Scholar] [CrossRef]
- Gao, J.; Yu, J.; Yang, L. Urinary arsenic metabolites of subjects exposed to elevated arsenic present in coal in Shaanxi Province, China. Int. J. Environ. Res. Public Health 2011, 8, 1991–2008. [Google Scholar] [CrossRef] [PubMed]
- Becker, J.S.; Burow, M.; Boulyga, S.F.; Pickhardt, C.; Hille, R.; Ostapczuk, P. ICP-MS determination of Uranium and thorium concentrations and 235U/238U isotope ratios at trace and ultratrace levels in urine. Atom. Spectrosc. 2002, 23, 177–182. [Google Scholar]
- Helfrich, A.; Bettmer, J. Analysis of gold nanoparticles using ICP-MS-based hyphenated and complementary ESI-MS techniques. Int. J. Mass Spectrom. 2011, 307, 92–98. [Google Scholar] [CrossRef]
- Persoons, R.; Arnoux, D.; Monssu, T.; Culie, O.; Roche, G.; Duffaud, B.; Chalaye, D.; Maitre, A. Determinants of occupational exposure to metals by gas metal arc welding and risk management measures: A biomonitoring study. Toxicol. Lett. 2014, 231, 135–141. [Google Scholar] [CrossRef] [PubMed]
- Navratilova, J.; Praetorius, A.; Gondikas, A.; Fabienke, W.; von der Kammer, F.; Hofmann, T. Detection of engineered copper nanoparticles in soil using single particle ICP-MS. Int. J. Environ. Res. Public Health 2015, 12, 15756–15768. [Google Scholar] [CrossRef] [PubMed]
- Morton, J.; Leese, E.; Cotton, R.; Warren, N.; Cocker, J. Beryllium in urine by ICP-MS: A comparison of low level exposed workers and unexposed persons. Int. Arch. Occup. Environ. Health 2011, 84, 697–704. [Google Scholar] [CrossRef] [PubMed]
- McDiarmid, M.A.; Engelhardt, S.M.; Oliver, M.; Gucer, P.; Wilson, P.D.; Kane, R.; Kabat, M.; Kaup, B.; Anderson, L.; Hoover, D.; et al. Biological monitoring and surveillance results of Gulf War I veterans exposed to depleted uranium. Int. Arch. Occup. Environ. Health 2006, 79, 11–21. [Google Scholar] [CrossRef] [PubMed]
- Schramel, P.; Wendler, I.; Angerer, J. The determination of metals (antimony, bismuth, lead, cadmium, mercury, palladium, platinum, tellurium, thallium, tin and tungsten) in urine samples by inductively coupled plasma-mass spectrometry. Int. Arch. Occup. Environ. Health 1997, 69, 219–223. [Google Scholar] [CrossRef] [PubMed]
- Goulle, J.P.; Mahieu, L.; Castermant, J.; Neveu, N.; Bonneau, L.; Laine, G.; Bouige, D.; Lacroix, C. Metal and metalloid multi-elementary ICP-MS validation in whole blood, plasma, urine and hair. Reference values. Forensic Sci. Int. 2005, 153, 39–44. [Google Scholar] [CrossRef] [PubMed]
- LeBlanc, A.; Dumas, P.; Lefebvre, L. Trace element content of commercial shampoos: Impact on trace element levels in hair. Sci. Total Environ. 1999, 229, 121–124. [Google Scholar] [CrossRef]
- Dongarra, G.; Varrica, D.; Tamburo, E.; D’Andrea, D. Trace elements in scalp hair of children living in differing environmental contexts in Sicily (Italy). Environ. Toxicol. Pharmacol. 2012, 34, 160–169. [Google Scholar] [CrossRef] [PubMed]
- Saussereau, E.; Lacroix, C.; Cattaneo, A.; Mahieu, L.; Goulle, J.P. Hair and fingernail gadolinium ICP-MS contents in an overdose case associated with nephrogenic systemic fibrosis. Forensic Sci. Int. 2008, 176, 54–57. [Google Scholar] [CrossRef] [PubMed]
- Rodushkin, I.; Axelsson, M.D. Application of double focusing sector field ICP-MS for multielemental characterization of human hair and nails. Part II. A study of the inhabitants of northern Sweden. Sci. Total Environ. 2000, 262, 21–36. [Google Scholar] [CrossRef]
- Osman, K.; Zejda, J.E.; Schutz, A.; Mielzynska, D.; Elinder, C.G.; Vahter, M. Exposure to lead and other metals in children from Katowice district, Poland. Int. Arch. Occup. Environ. Health 1998, 71, 180–186. [Google Scholar] [CrossRef] [PubMed]
- Schutz, A.; Olsson, M.; Jensen, A.; Gerhardsson, L.; Borjesson, J.; Mattsson, S.; Skerfving, S. Lead in finger bone, whole blood, plasma and urine in lead-smelter workers: Extended exposure range. Int. Arch. Occup. Environ. Health 2005, 78, 35–43. [Google Scholar] [CrossRef] [PubMed]
- Ikeda, M.; Zhang, Z.W.; Moon, C.S.; Shimbo, S.; Watanabe, T.; Nakatsuka, H.; Matsuda-Inoguchi, N.; Higashikawa, K. Possible effects of environmental cadmium exposure on kidney function in the Japanese general population. Int. Arch. Occup. Environ. Health 2000, 73, 15–25. [Google Scholar] [CrossRef] [PubMed]
- He, M.; Hu, B.; Zeng, Y.; Jiang, Z. ICP-MS direct determination of trace amounts of rare earth impurities in various rare earth oxides with only one standard series. J. Alloys Compd. 2005, 390, 168–174. [Google Scholar] [CrossRef]
- Xie, H.; Nie, X.; Tang, Y. Direct determination of trace elements in high purity gallium by high resolution inductively coupled plasma mass spectrometry. Chin. J. Anal. Chem. 2006, 34, 1570–1574. [Google Scholar] [CrossRef]
- García-Poyo, M.C.; Grindlay, G.; Gras, L.; de Loos-Vollebregt, M.T.C.; Mora, J. Non-spectral interferences due to the presence of sulfuric acid in inductively coupled plasma mass spectrometry. Spectrochim. Acta B Atom. Spectrosc. 2015, 105, 71–76. [Google Scholar] [CrossRef]
- Ivanenko, N.B.; Ivanenko, A.A.; Solovyev, N.D.; Zeimal, A.E.; Navolotskii, D.V.; Drobyshev, E.J. Biomonitoring of 20 trace elements in blood and urine of occupationally exposed workers by sector field inductively coupled plasma mass spectrometry. Talanta 2013, 116, 764–769. [Google Scholar] [CrossRef] [PubMed]
- Benkhedda, K.; Epov, V.N.; Evans, R.D. Flow-injection technique for determination of uranium and thorium isotopes in urine by inductively coupled plasma mass spectrometry. Anal. Bioanal. Chem. 2005, 381, 1596–1603. [Google Scholar] [CrossRef] [PubMed]
- He, Y.; Miao, M.; Wu, C.; Yuan, W.; Gao, E.; Zhou, Z.; Li, D.K. Occupational exposure levels of bisphenol a among chinese workers. J. Occup. Health 2009, 51, 432–436. [Google Scholar] [CrossRef] [PubMed]
- Hoppe, P.; Cohen, S.; Meibom, A. Nanosims: Technical aspects and applications in cosmochemistry and biological geochemistry. Geostand. Geoanal. Res. 2013, 37, 111–154. [Google Scholar] [CrossRef]
- Wang, L.; Huang, X.; Zhou, Q. Effects of rare earth elements on the distribution of mineral elements and heavy metals in horseradish. Chemosphere 2008, 73, 314–319. [Google Scholar] [CrossRef] [PubMed]
- Mazurova, I.; Khvaschevskaya, A.; Guseva, N. The choice of conditions for the determination of vanadium, chromium and arsenic concentration in waters by ICP-MS using collision mode. Procedia Chem. 2015, 15, 201–205. [Google Scholar] [CrossRef] [Green Version]
- Mari, M.; Nadal, M.; Schuhmacher, M.; Barbería, E.; García, F.; Domingo, J.L. Human exposure to metals: Levels in autopsy tissues of individuals living near a hazardous waste incinerator. Biol. Trace Elem. Res. 2014, 159, 15–21. [Google Scholar] [CrossRef] [PubMed]
- Mohmand, J.; Eqani, S.A.; Fasola, M.; Alamdar, A.; Mustafa, I.; Ali, N.; Liu, L.; Peng, S.; Shen, H. Human exposure to toxic metals via contaminated dust: Bio-accumulation trends and their potential risk estimation. Chemosphere 2015, 132, 142–151. [Google Scholar] [CrossRef] [PubMed]
- Li, B.; Yin, M. Characterization and correction of oxide interference for the determination of rare earth elements in biological samples by ICP-MS. Rock Miner. Anal. 2000, 19, 101–105. (In Chinese) [Google Scholar]
- Liu, H.-S.; Zhu, H.-D.; Wang, X.-Y.; Wang, N.-F.; Wang, J.-Y. Determination of 15 micro rare earth elements in human urine sample by ICP-MS. J. Chin. Mass Spectrom. Soc. 2008, 29, 1–2. (In Chinese) [Google Scholar]


| Parameter | Values |
|---|---|
| RF Power | 1550 W |
| Focus Lens | 21.00 |
| Wash Time | 45 s |
| Sample Uptake Time | 45 s |
| Read Delay | 0 |
| Plasma Gas | Ar |
| Aux. Ar Flow | 0.8 L∙min−1 |
| Nebulizer Ar Flow | 0.9 L∙min−1 |
| Cool Ar Flow | 14 L∙min−1 |
| Additional Gas Flow | 0 |
| Dwell Time per Isotope | 10 ms |
| Sweeps/Reading/Number of Sweep | 10 |
| Pump Rate | 40 rpm |
| Extraction Lens 1 Negative | −196.5 V |
| Extraction Lens 1 Positive | −0.05 V |
| Extraction Lens 2 | −187.7 V |
| Sample Depth | 5 mm |
| Interface Cones | Pt |
| Measure Mode | STD |
| 140Ce16O/140Ce | 1.69% (Tuned Intensity) |
| Element | r2 | LOD | LOQ | CV% (1) | CV% (2) |
|---|---|---|---|---|---|
| 89Y | 1.000 | 0.010 | 0.034 | 0.43 | 0.59 |
| 139La | 0.997 | 0.009 | 0.030 | 0.51 | 0.56 |
| 140Ce | 0.999 | 0.009 | 0.029 | 1.18 | 0.79 |
| 141Pr | 1.000 | 0.010 | 0.034 | 0.75 | 0.61 |
| 146Nd | 1.000 | 0.011 | 0.037 | 0.58 | 0.65 |
| 147Sm | 1.000 | 0.010 | 0.031 | 0.51 | 0.62 |
| 153Eu | 1.000 | 0.010 | 0.034 | 0.59 | 0.54 |
| 157Gd | 0.999 | 0.010 | 0.034 | 0.54 | 0.51 |
| 159Tb | 1.000 | 0.010 | 0.034 | 0.93 | 0.59 |
| 163Dy | 0.999 | 0.010 | 0.035 | 0.64 | 0.41 |
| 165Ho | 0.999 | 0.010 | 0.033 | 0.82 | 0.57 |
| 166Er | 0.999 | 0.010 | 0.033 | 0.75 | 0.54 |
| 169Tm | 0.999 | 0.010 | 0.031 | 0.75 | 0.59 |
| 172Yb | 0.999 | 0.010 | 0.033 | 1.19 | 0.79 |
| 175Lu | 0.998 | 0.010 | 0.033 | 1.28 | 0.85 |
| Control (n = 8) | Workers (n = 23) | |||||
|---|---|---|---|---|---|---|
| Element | % (>LOD) | Mean ± S.D. (μg∙L−1) | 95% CI (μg∙L−1) | % (>LOD) | Mean ± S.D. (μg∙L−1) | 95% CI (μg∙L−1) |
| 89Y | 62.5 | 0.013 ± 0.011 | 0.004–0.023 | 87.0 | 0.031 ± 0.042 | 0.013–0.049 |
| 139La * | 100.0 | 0.225 ± 0.170 | 0.083–0.367 | 100.0 | 1.234 ± 0.626 | 0.963–1.505 |
| 140Ce * | 100.0 | 0.281 ± 0.171 | 0.137–0.424 | 100.0 | 1.492 ± 0.995 | 1.061–1.922 |
| 141Pr | 62.5 | 0.014 ± 0.011 | 0.005–0.023 | 95.7 | 0.020 ± 0.013 | 0.015–0.026 |
| 146Nd * | 62.5 | 0.009 ± 0.003 | 0.006–0.011 | 87.0 | 0.015 ± 0.009 | 0.011–0.019 |
| 147Sm | 62.5 | 0.008 ± 0.004 | 0.004–0.012 | 65.2 | 0.009 ± 0.006 | 0.006–0.011 |
| 153Eu | 50.0 | 0.008 ± 0.003 | 0.005–0.011 | 56.5 | 0.008 ± 0.004 | 0.006–0.010 |
| 157Gd * | 100.0 | 0.012 ± 0.006 | 0.007–0.016 | 100.0 | 0.023 ± 0.010 | 0.019–0.028 |
| 159Tb | 87.5 | 0.015 ± 0.006 | 0.009–0.020 | 100.0 | 0.014 ± 0.005 | 0.012–0.016 |
| 163Dy | 50.0 | 0.008 ± 0.003 | 0.005–0.011 | 56.5 | 0.008 ± 0.004 | 0.006–0.010 |
| 165Ho | 62.5 | 0.009 ± 0.006 | 0.004–0.014 | 73.9 | 0.008 ± 0.005 | 0.006–0.010 |
| 166Er | 50.0 | 0.009 ± 0.004 | 0.005–0.013 | 65.2 | 0.009 ± 0.005 | 0.006–0.011 |
| 169Tm | 50.0 | 0.009 ± 0.004 | 0.005–0.013 | 56.5 | 0.009 ± 0.005 | 0.006–0.011 |
| 172Yb | 62.5 | 0.010 ± 0.006 | 0.005–0.015 | 65.2 | 0.013 ± 0.010 | 0.009–0.016 |
| 175Lu | 50.0 | 0.009 ± 0.004 | 0.005–0.012 | 65.2 | 0.009 ± 0.005 | 0.006–0.011 |
| Element | This Work (n = 31, Median, μg∙L−1) | LIU Hu-sheng [50] (n = 19, Median, μg∙L−1) | Zhe Hao [3] (n = 128, Median, μg∙L−1) | |
|---|---|---|---|---|
| Workers (n = 23) | Control (n = 8) | |||
| 89Y | 0.014 | 0.008 | 0.030 | 0.094 |
| 139La | 1.066 | 0.194 | 0.036 | 0.079 |
| 140Ce | 1.134 | 0.280 | 0.064 | 0.089 |
| 141Pr | 0.019 | 0.008 | 0.008 | 0.030 |
| 146Nd | 0.014 | 0.007 | 0.045 | 0.153 |
| 147Sm | 0.006 | 0.006 | 0.054 | 0.040 |
| 153Eu | 0.006 | 0.006 | 0.001 | 0.019 |
| 157Gd | 0.023 | 0.010 | 0.007 | 0.024 |
| 159Tb | 0.014 | 0.016 | 0.002 | 0.015 |
| 163Dy | 0.006 | 0.006 | 0.004 | 0.020 |
| 165Ho | 0.007 | 0.006 | 0.002 | 0.171 |
| 166Er | 0.006 | 0.006 | 0.003 | 0.011 |
| 169Tm | 0.006 | 0.006 | 0.001 | 0.002 |
| 172Yb | 0.008 | 0.008 | 0.003 | 0.007 |
| 175Lu | 0.006 | 0.006 | 0.001 | 0.002 |
© 2016 by the authors; licensee MDPI, Basel, Switzerland. This article is an open access article distributed under the terms and conditions of the Creative Commons by Attribution (CC-BY) license (http://creativecommons.org/licenses/by/4.0/).
Share and Cite
Li, Y.; Yu, H.; Zheng, S.; Miao, Y.; Yin, S.; Li, P.; Bian, Y. Direct Quantification of Rare Earth Elements Concentrations in Urine of Workers Manufacturing Cerium, Lanthanum Oxide Ultrafine and Nanoparticles by a Developed and Validated ICP-MS. Int. J. Environ. Res. Public Health 2016, 13, 350. https://doi.org/10.3390/ijerph13030350
Li Y, Yu H, Zheng S, Miao Y, Yin S, Li P, Bian Y. Direct Quantification of Rare Earth Elements Concentrations in Urine of Workers Manufacturing Cerium, Lanthanum Oxide Ultrafine and Nanoparticles by a Developed and Validated ICP-MS. International Journal of Environmental Research and Public Health. 2016; 13(3):350. https://doi.org/10.3390/ijerph13030350
Chicago/Turabian StyleLi, Yan, Hua Yu, Siqian Zheng, Yang Miao, Shi Yin, Peng Li, and Ying Bian. 2016. "Direct Quantification of Rare Earth Elements Concentrations in Urine of Workers Manufacturing Cerium, Lanthanum Oxide Ultrafine and Nanoparticles by a Developed and Validated ICP-MS" International Journal of Environmental Research and Public Health 13, no. 3: 350. https://doi.org/10.3390/ijerph13030350