Article

Mercury Exposure in Healthy Korean Weaning-Age Infants: Association with Growth, Feeding and Fish Intake

1
Department of Pediatrics, Seoul National University College of Medicine, Seoul 110-799, Korea
2
Seoul Metropolitan Government-Seoul National University Boramae Medical Center, Seoul 156-707, Korea
3
Department of Laboratory Medicine, Seoul National University College of Medicine, Seoul 110-799, Korea
*
Author to whom correspondence should be addressed.
Int. J. Environ. Res. Public Health 2015, 12(11), 14669-14689; https://doi.org/10.3390/ijerph121114669
Submission received: 28 August 2015 / Revised: 9 November 2015 / Accepted: 11 November 2015 / Published: 17 November 2015

Abstract

:
Low-level mercury (Hg) exposure in infancy might be harmful to the physical growth as well as neurodevelopment of children. The aim of this study was to investigate postnatal Hg exposure and its relationship with anthropometry and dietary factors in late infancy. We recruited 252 healthy Korean infants between six and 24 months of age from an outpatient clinic during the 2009/2010 and 2013/2014 seasons. We measured the weight and height of the infants and collected dietary information using questionnaires. The Hg content of the hair and blood was assessed using inductively coupled plasma mass spectroscopy. The geometric mean Hg concentration in the hair and blood was 0.22 (95% confidence interval: 0.20–0.24) µg/g and 0.94 (n = 109, 95% confidence interval: 0.89–0.99) µg/L, respectively. The hair Hg concentration showed a good correlation with the blood Hg concentration (median hair-to-blood Hg ratio: 202.7, r = 0.462, p < 0.001) and was >1 µg/g in five infants. The hair Hg concentration showed significant correlations with weight gain after birth (Z-score of the weight for age—Z-score of the birthweight; r = −0.156, p = 0.015), the duration (months) of breastfeeding as the dominant method of feeding (r = 0.274, p < 0.001), and the duration of fish intake more than once per week (r = 0.138, p = 0.033). In an ordinal logistic regression analysis with categorical hair Hg content (quartiles), dietary factors, including breastfeeding as the dominant method of feeding in late infancy (cumulative odds ratio: 6.235, 95% confidence interval: 3.086–12.597, p < 0.001) and the monthly duration of fish intake more than once per week (cumulative odds ratio: 1.203, 95% confidence interval: 1.034–1.401; p = 0.017), were significantly associated with higher hair Hg content. Weight gain after birth was not, however, significantly associated with hair Hg content after adjustment for the duration of breastfeeding as the dominant method of feeding. Low-level Hg exposure through breastfeeding and fish intake as a complementary food did not directly affect anthropometry in this population. If prolonged breastfeeding is expected, however, the Hg exposure through fish intake may need to be monitored for both mothers and infants.

1. Introduction

Excessive exposure to mercury (Hg) during infancy can irreversibly damage normal infant development [1]. In addition, because infants have a lower toxic metal tolerance than adults, even low-level Hg exposure can be harmful to the infant body [2]. Recently, Hg levels were found to be higher in populations of Korean adults and school-age children compared with those in Western populations [3,4]. Compared with the data on Hg exposure in adults and older children, data on Hg exposure in post-neonatal infants are relatively scarce worldwide, as well as in Korea [5,6,7].
In addition to adversely affecting neurodevelopment, Hg has also been reported to affect the physical growth of infants even at low levels of exposure [2]. It has been postulated, although not yet established, that Hg can affect growth by damaging cell membranes and disturbing the function of enzymes in various metabolic pathways [8,9]. Among the studies investigating the influence of Hg on the growth of infants, the relationship between prenatal Hg exposure and birth outcomes has been most actively investigated using the Hg levels in umbilical cord blood or in maternal or neonate hair as biomarkers for body Hg burden [10,11]. There are conflicting reports concerning the significance of the relationship between low levels of prenatal Hg exposure and birth outcomes [2,12,13,14]. A few of these studies investigated the influence of prenatal Hg exposure on growth during infancy, and all of these studies showed a significant inverse association [8,10]. However, regarding the impact of ongoing low levels of postnatal Hg exposure on the growth of the infants, few studies have been available in the literature, although some studies have investigated this issue in representative populations at high levels of Hg exposure [15,16,17].
Infancy, the first 1–2 years after birth, is regarded as the most important postnatal period for the growth of children. In addition, during late infancy, the transitional period of weaning, children are vulnerable to potential risk factors that might negatively affect healthy growth. For example, inadequate ingestion of supplementary food during the weaning period could lead to iron or zinc deficiency and insufficient protein or calorie intake, which have been reported to negatively affect the growth of children [18,19]. Low-level methyl Hg exposure during infancy has been shown to result from trans-placental acquisition from the mother, breastfeeding, or the consumption of fish as a complementary food [20]. Among those potential sources, the latter two are assumed to contribute the most to body Hg burden in late infancy. Although breastfeeding (following fish intake by the mother), and direct fish intake as supplemental nutrition, are reportedly associated with increased Hg exposure in children, there are many beneficial effects of fish intake on infant health [21], including nervous-system and immunity development. Thus a uniform restriction or avoidance of fish intake by mothers and infants without clear supporting evidence should not be recommended.
Better knowledge of the degree to which feeding and fish intake influence body Hg burden during complementary feeding and of the association between Hg exposure and growth during infancy could help provide a basis for better feeding recommendations for infants. In the literature, epidemiological studies examining the relationships among feeding, fish intake, and Hg exposure in weaning-age infants are limited. Therefore, this study aimed to assess the Hg exposure among healthy weaning infants in Korea using both hair and blood samples and to explore the relationships among Hg exposure, anthropometry, feeding method, and fish intake during infancy.

2. Materials and Methods

2.1. Subjects and Study Design

This study included Korean infants who visited the Pediatric Clinic of Seoul Metropolitan Government-Seoul National University Boramae Medical Center for health examinations and iron deficiency screening from June 2009 to May 2010 or from July 2013 to December 2014. All of the subjects were resided within Seoul city. The subjects were selected based on the following criteria: 6–24 months of age, healthy, no intake of herbal medicine, and no evidence of chronic diseases in the physical examination and medical history. The estimated number of the subjects was greater than 167 from sample size calculation based on our preliminary data (Type I error = 0.05, power = 0.8, partial correlation coefficient between anthropometric parameter and Hg content = −0.227, and assumed drop-out rate: 10%).
For each subject, we obtained information related to feeding from the parents or grandparents by experienced pediatricians using modified validated questionnaires [22]. Dietary information included the dominant feeding method and its duration from birth to the time of the study, the monthly age at which fish was introduced as a complementary food to the infant, and the species of fish and the frequency of fish intake by the infant and mother (2013/2014 season only; Table 1, Supplementary Table S3). The dominant feeding methods were categorized as mostly breastfeeding, mostly formula feeding, mixed feeding, or others. The mostly breastfed infants were defined as those who were exclusively or dominantly breastfed before the introduction of complementary food and were mostly breastfed thereafter with supplemental complementary food until the time of the study or 6–12 months of age. The mixed-fed infants were defined as those who were exclusively or dominantly breastfed for at least 4–6 months after birth and were mostly formula fed thereafter with supplemental complementary food until the time of the study or 6–12 months of age. The mostly formula-fed infants were defined as those who were exclusively or dominantly fed formula for at least 4 to 6 months after birth and were mostly formula fed thereafter with supplemental complementary food until the time of the study or 6–12 months of age. The infants who were not classified as mostly breastfed, mixed fed, or mostly formula fed were defined as having “other” dominant feeding methods. The duration of breastfeeding was counted as the period of exclusive or mostly breastfeeding. The question concerning fish intake in the 2009/2010 season was: “Has your infant been fed fish-containing food regularly on a weekly basis?” In the 2013/2014 season, information on the precise frequency of fish intake was obtained. Thus, the duration of fish intake was ascertained for only infants who ingested fish more than once per week. The questionnaires also required that the names of commonly ingested fish species be recorded in the 2013/2014 season.
Anthropometric measurements were taken with the infant dressed in light clothing by experienced nurses as described previously [23]. Z-scores for birthweight (BWZ), weight for age (WAZ), height for age (HAZ), and the difference of the weight percentiles between birth and the time of the study (WAZ-BWZ) were calculated using WHO Anthro (version 3.2.2., January 2011), which is available online (http://www.who.int/childgrowth/software/en/). Other physical examinations were performed by experienced pediatricians.
Hair and blood samples from the subjects were collected with approval from the Boramae Hospital Institutional Review Board (IRB number 20090318/06-2009-32/82, 20130416/16-2013-55/051), and informed consent was obtained for all participants in the study.

2.2. Hair Hg Analysis

We collected approximately 120 mg of hair by cutting approximately 3 cm of hair from the back of the infant’s head with sterilized, stainless steel scissors. The hair Hg analysis was performed by Trace Elements, Inc. (Dallas, TX, USA), a professional institution specializing in hair mineral analysis.
The hair samples were washed to eliminate microelements settled inside the hair tissue and pollutants such as dust, sweat, and debris from the atmosphere and outer environment. After the hair samples were placed into 50 mL tubes, 25 mL Triton X-100 was added, and the samples were vigorously vortexed for 5 s. The process was then repeated four times. Next, 25 mL acetone was added, and the samples were again vigorously vortexed for 5 s. Next, 30 mL deionized water was added, and the samples were placed in a large ultrasonic bath and sonicated for 10 min. The sonication process was repeated three times. The acetone wash step was repeated twice, after which the samples were placed into a preheated drying oven (75 ± 5 °C) for 15 min. After that, each hair sample was finely cut into 1–2 mm sections using stainless steel scissors and mixed to ensure homogeneity. The cut hair was weighed to the nearest 0.001 g on an analytical-grade balance (Ohaus Explorer, Ohaus Corporation, Parsippany, NJ, USA) and then placed in a uniquely labeled, single-use, sterile polypropylene test tube. An aliquot of concentrated 70% trace metal-grade nitric acid (Fox Instrapure, Fox Scientific, Alvarado, TX, USA) was dispensed into each test tube. The tubes were then capped with sterile, two-position test tube caps, racked into a sample holder, and placed into a computer-controlled microwave digestion system (MARS 5, CEM Corporation, Matthews, NC, USA). After the microwave digestion procedure was complete, the samples were rehydrated with a diluent consisting of 18 MΩ de-ionized water and a solution of gold and a trace of HCl acid. The samples were then re-capped and mixed in a vortex mixer to ensure a uniform solution. From that point, the finished samples were placed into test tube racks to await analysis. Quantitative analysis was performed by Inductively Coupled Plasma Mass Spectrometry using the Elan 6100 and Elan 9000 analytical systems (Perkin Elmer, Akron, OH, USA).
In-line internal standardization and external calibration using certified standard solutions (Spex Certiprep, Metuchen, NJ, USA) traceable to the National Institute of Standards and Technology were used for the quantitative analysis. The reliability of the analysis performed by Trace Elements Inc. was monitored using four levels of standard material controls (two in an inorganic matrix and two in an organic matrix). The yearly mean Hg value from 2009 through 2014 was 0.11 μg/g (standard deviation = 0.02 μg/g; coefficient of variation n = 18.2%). Proficiency testing was performed on a twice-yearly basis. This laboratory participates in the Quebec Multi-element External Quality Assessment Scheme program administered by the Quebec National Institute of Health in Quebec, Canada.

2.3. Blood Tests

To screen for iron deficiency, complete blood counts, iron/TIBC, and ferritin levels were measured in the hospital laboratory as previously described [23]. Iron deficiency (ID) was defined as a ferritin value <12 ng/mL and iron deficiency anemia (IDA) as Hg level < 11.0 g/dL with ID.
Blood Hg was examined only in the 2013/2014 season. For the blood Hg analysis, whole blood was collected in a 6 mL trace element K2 EDTA vacutainer tube (Becton Dickinson, Franklin Lakes, NJ, USA) by venipuncture from the cubital fossa or dorsum of the hand. One hundred microliters whole blood was mixed with diluent consisting of 0.05% Triton X-100, 5% butanol, 0.05% EDTA, and 0.5% NH4OH. The Hg level in the whole blood was determined by Inductively Coupled Plasma Mass Spectrometry (Agilent 7700, Agilent, CA, USA) at the Greencross Reference Laboratory (Yongin-City, Kyunggi-do, Korea). In-line internal standardization and external calibration using certified standard solutions (Agilent, Santa Clara, CA, USA; PerkinElmer, Akron, OH, USA) traceable to the National Institute of Standards and Technology were used for the quantitative analysis. The reliability of the analysis was monitored using three levels (low: 1.49 ± 0.26, mid: 6.35 ± 0.80, high: 7.98 ± 0.80 ug/L) of control materials (ClinChek-Control, Recipe, Germany). The cumulative coefficients of variation of control materials for Hg during study period were 4.54%–4.84%. Proficiency testing was performed twice yearly by the German External Quality Assessment Scheme program (http://www.g-equas.de/).

2.4. Statistical Analysis

Normality was tested by the Kolmogorov-Smirnov test. Among continuous variables, anthropometric Z-scores showed normal distribution. These values were expressed as means and 95% confidence interval (CIs) and were tested using independent-samples t-test or ANOVA. Other continuous variables including Hg level in hair and blood did not show normal distribution, therefore, they were expressed as medians and corresponding 25th and 75th percentiles (interquartile range, IQR) and were tested using the Mann-Whitney or the Kruskal-Wallis test. Categorical variables were compared using the Chi-squared test. Correlations between continuous variables were tested with Spearman’s rank coefficient. To determine the association between the Hg level and dietary factors, the data were analyzed using ordinal logistic regressions with the Hg content as the dependent variable and age, sex, anthropometric data, feeding method, monthly duration of fish intake, and iron status as explanatory variables. For the association between the hair Hg content and anthropometry, we performed multiple linear regression analysis with the Z-score as the dependent variable and age, sex, gestational age, feeding method, fish intake, iron status, and hair Hg level as explanatory variables. All analyses were conducted using SPSS version 20.0 at significance level (p < 0.05) (SPSS, Chicago, IL, USA).
Table 1. Demographic, anthropometric, and diet-related parameters and iron status of 252 infants according to the study periods.
CharacteristicsTotal2009/20102013/2014p Value a
Subjects, n252111141
Age, months b11.1 (10.2, 12.0)11.0 (9.9, 12.35)11.0 (10.3, 12.0)0.571 c
Gender, n
Male12555700.988
Female1275671
Gestational age, weeks b39.0 (38.0, 40.0)39.0 (38.0, 40.0)39.0 (38.0, 40.0)0.972 c
<37 weeks, n12570.969
Anthropometry, Z-score d
Birthweight, kg3.25 (3.20, 3.30)3.28 (3.20, 3.35)3.23 (3.17, 3.30)0.404 e
birthweight <2.5 kg, n9270.232
birthweight−0.11 (−0.21, −0.01)−0.04 (−0.21, 0.12)−0.16 (−0.29, −0.02)0.302 e
weight for age0.13 (0.02, 0.24)0.51 (0.34, 0.69)0.53 (0.39, 0.67)0.466 e
WAZ-BWZ f0.63 (0.51, 0.76)0.55 (0.34, 0.76)0.69 (0.54, 0.84)0.298 e
height for age0.55 (0.41, 0.69)0.51 (0.28, 0.75)0.59 (0.41, 0.77)0.290 e
Dominant feeding method, n
mostly breast fed1448262<0.001
mixed fed31427
mostly formula fed662541
others11011
Duration of mostly breastfeeding, months b6.0 (0.0, 10.9)9.9 (0, 11)6.0 (0, 10.95)0.308 c
Fish intake (n = 241)
Presence, n (%)134 (55.6)61(61.0)73 (51.8)0.155
Absence, n1073968
Duration of fish intake, months b1.0 (0.0, 2.0)1.0 (0.0, 3.0)0.0 (0.0, 2.0)0.204 c
Frequency of fish intake by infants, n 141 (100)
<1/week 68 (48.2)
1–2/weeks 62 (44.0)
≥3/weeks 11 (7.8)
Iron status, n
Deficiency835231<0.001
No deficiency16959110
Iron deficiency anemia3924150.019
a The values were calculated using the chi-square test, unless otherwise stated; b The values are presented as the median and interquartile range; c The values were calculated using the Mann-Whitney’s test; d The values are presented as the mean and 95% confidence interval; e The values were calculated using the independent-samples t-test; f BWZ-WAZ: The difference of the weight percentiles between birth and the time of the study; BWZ: Z-scores for birthweight; WAZ: Z-scores for weight for age (WAZ).

3. Results

3.1. Characteristics of the Study Subjects

The study included 252 infants with a median age of 11.1 (range: 6.0–22.0, IQR: 10.2–12.0) months and a gender ratio of 125 males to 127 females (M/F = 0.98; Table 1). The median gestational age was 39.0 (range: 35.0–43.0, IQR: 38.0–40.0) weeks, and 12 subjects had a gestational age under 37 weeks. The mean birth weight was 3.25 (95% CI: 3.20–3.30) kg, and eight subjects had a birth weight less than 2.50 kg. The WAZ was 0.13 (95% CI: 0.02–0.24), and the number of underweight (WAZ < −2) and overweight infants (WAZ > 2) was two and 11, respectively. The WAZ-BWZ was 0.81 (95% CI: 0.10–1.42). One hundred forty-four infants (57.1%) were mostly breastfed, 31 (12.3%) were mixed fed, and 66 (26.2%) were mostly formula fed. The median duration of mostly breastfeeding was 6.0 (range: 0.0–17.0, IQR: 0–10.9) months. Information about fish intake was available for 241 infants. Among those, 134 started regular fish intake as a complementary food at least once per week. The median duration of fish intake was 1.0 (range: 0–11, IQR: 0–3.0) month. The distributions of dominant feeding method and iron status were significantly different between the infants included during the 2009/2010 season and those included during the 2013/2014 season (p < 0.001; Table 1). The other clinical characteristics were not different between the two periods.

3.2. Hg Levels in the Hair and Blood and Their Interrelationships

The median hair Hg content was 0.20 μg/g (IQR: 0.10–0.30 μg/g; Table 2). The hair Hg content was >1.0 μg/g in five (1.98%) infants (four in the 2009/2010 season and one in the 2013/2014 season). The hair Hg content was significantly different between the two study periods (p < 0.001). The blood Hg was measured in 109 infants, and the median value was 0.82 (IQR: 0.63–1.28) μg/L. All whole-blood Hg levels were <5.8 μg/L. There was a significant correlation between the hair Hg content and the blood Hg concentration (r = 0.462, p < 0.001; Figure 1). The median ratio between the hair and blood Hg concentrations was 202.7 (IQR: 135.1–326.1).
Table 2. Mercury content of hair and blood in infants.
Number of InfantsGeometric Mean (95% CI)PercentilesMaximum Value
1025507590
Hair mercury (µg/g)
 total2520.22 (0.20, 0.24)0.10.10.20.30.51.3
 2009/20101110.28 (0.24, 0.31)0.10.20.30.40.61.3
 2013/20141410.18 (0.17, 0.20)0.10.10.20.30.41.0
 mostly breastfed1440.28 (0.25, 0.30)0.10.20.30.40.521.3
 fish fed 1340.23 (0.21, 0.26)0.10.10.20.40.61.3
Blood mercury (μg/L)
 2013/20141090.94 (0.89, 0.99)0.370.630.821.281.774.15
Figure 1. Correlation between whole blood mercury concentration and hair mercury content.
Ijerph 12 14669 g001

3.3. The Relationship between Hg Level and Anthropometry

Overall, the hair Hg content was negatively correlated with the WAZ-BWZ (r = −0.156, p = 0.015; Figure 2). That correlation was significant among the 141 infants in the 2012/2013 season (r = −0.194, p = 0.021) but not among the 111 infants in the 2009/2010 season (r = −0.091, p = 0.368). There was a marginally significant correlation between the blood Hg level and the WAZ-BWZ among 109 infants (r = −0.182, p = 0.059; Supplementary Figure S1). The WAZ-BWZ value was smallest among the infants with hair Hg content in the highest quartile (p = 0.031; Table 3). This associative trend between the WAZ-BWZ and categorized Hg content was also observed in blood Hg related analysis, although not statistically significant (p = 0.08; Supplementary Table S1). Other anthropometric parameters including BWZ, WAZ, and HAZ were not significantly correlated with the hair or whole-blood Hg contents.
Figure 2. Correlation between hair mercury content and WAZ-BWZ.
Ijerph 12 14669 g002
Table 3. Demographic, anthropometric, and diet-related parameters and iron status in three categories of infants according to the quartile values of hair mercury content.
Characteristics Hair Mercury Level (µg/g)p Value a
≤0.1 (n = 75)>0.1 and <0.4 (n = 115)≥0.4 (n = 62)
Age, months b 11.0 (10.2, 12.0)11.1 (10.3, 12.35)11.25 (9.75~12.1)0.644 c
Male4254290.417
Female336133
Gestational age, weeks b39 (38, 40)39 (38, 40)39 (38, 40)0.241 c
<37 weeks, n6420.194
Study years, n
2009/2010155541<0.001
2013/2014606021
Anthropometry, Z-score d
Birthweight, kg3.23 (3.13, 3.33)3.26 (3.19, 3.33)3.25 (3.17, 3.34)0.878 e
birthweight <2.5 kg, n6300.013
birthweight−0.17 (−0.39, 0.05)−0.08 (−0.24, 0.07)−0.08 (−0.27, 0.10)0.743 e
weight for age0.67 (0.49, 0.88)0.49 (0.32, 0.65)0.39 (0.17. 0.60)0.142 e
WAZ-BWZ0.86 (0.62, 1.10)0.57 (0.39, 0.75)0.46 (0.22, 0.70)0.045 e
height for age0.58 (0.32, 0.84)0.55 (0.33, 0.77)0.51 (0.23, 0.79)0.983 e
Dominant feeding method, n
mostly breastfed207450<0.001
mixed fed11146
mostly formula fed37245
others731
Duration of mostly breastfeeding, months b0 (0–9)10 (3.5–11.35)10.25 (6.3–12.0)<0.001 c
Fish intake (presence/absence)
total (n = 241)35/3960/4939/190.024
2009/2010 (n = 100)7/726/2328/90.035
2013/2014 (n = 141)28/3234/2611/100.448
Duration of fish intake, months b
total0.0 (0.0, 2.0)0.0 (0.0, 2.0)1.0 (0.0, 3.25)0.033 c
2009/20100.5 (0.0, 3.0)0.0 (0.0, 2.0)2.0 (0.0, 4.0)0.006 c
2013/20140.0 (0.0, 2.0)1.0 (0.0, 2.0)1.0 (0.0, 2.0)0.867 c
Iron status, n
Deficiency104429<0.001
No deficiency657133
Iron deficiency anemia422130.011
a The values were calculated using the chi-square test, unless otherwise stated; b The values are presented as the median and interquartile range; c The values were calculated using the Kruskal-Wallis test; d The values are presented as the mean and 95% confidence interval; e The values were calculated using the ANOVA.
Because the WAZ-BWZ was also significantly correlated with the duration of mostly breast feeding (r = −0.190, p = 0.006), a multiple linear regression analysis was performed with sex, gestational age, monthly age, duration of mostly breastfeeding, duration of fish intake, ID status, and log hair Hg content as explanatory variables and the WAZ-BWZ as the dependent variable (Table 4). The WAZ-BWZ was significantly associated with the duration of mostly breastfeeding (p = 0.005), but not with the hair Hg content or the ID status.
Table 4. Multiple regression analysis of the difference of weight percentiles (WAZ-BWZ) in 252 infants according to possible growth-related factors including hair mercury content.
ParameterBSEBetap Value95% CI
lowerupper
Male gender0.1390.1320.0710.292−0.1200.399
Gestational age−0.1980.044−0.302<0.001−0.285−0.111
Monthly age0.0450.0340.0960.185−0.0220.111
Duration of mostly breastfeeding−0.0430.015−0.2290.005−0.073−0.013
Duration of fish intake0.0180.0370.0350.629−0.0560.092
Iron deficiency−0.2320.159−0.1110.146−0.5440.081
Hair mercury (log)−0.0460.115−0.0290.692−0.2730.182

3.4. The Relationship between the Hg Level and Diet Factors

The hair Hg content was significantly correlated with the duration of mostly breastfeeding among 252 infants (r = 0.402, p < 0.001; Supplementary Figure S2) and with the duration of fish intake (r = 0.138, p = 0.033; Supplementary Figure S3) among 241 infants. Among the five infants with hair Hg content > 1 μg/g, three were dominantly breastfed and ingested fish for more than 3–6 months, one was dominantly breastfed without fish intake, and one was dominantly formula fed and ingested fish for more than six months. Among the 141 infants enrolled in the 2013/2014 season, for whom the precise history of fish intake was available, 11 (7.8%) ingested fish more than three times per week, and 62 (44.0%) ingested fish more than one to two times per week (Table 1). No children or their mothers ingested fish excess seven times per week. There was no significant difference, however, in the hair Hg content or the blood Hg content based on the frequency of fish intake. The commonly ingested fish species by 95 infants and their mothers are summarized in Table S3. The blood Hg level was also significantly correlated with the duration of breastfeeding (r = 0.272, p = 0.004; Supplementary Figure S2) and the duration of fish intake (r = 0.218, p = 0.046; Supplementary Figure S3).
The Hg content in hair and blood was categorized into three groups based on the quartile values for comparison (Table 3 and Supplementary Table S1, respectively). The dominant feeding method was significantly different among the three groups of hair Hg and blood Hg content. The frequency of dominant breastfeeding was significantly higher in the group with hair Hg content in the highest quartile compared with that in the other two groups (80.6% vs. 64.3% or 26.7%, p < 0.001). The frequency of fish intake was also significantly higher in the group with hair Hg content in the highest quartile compared with that in the group with hair Hg content in the lowest quartile (67.2% vs. 47.3%, p = 0.024).
In order to adjust for the multiple factors influencing Hg content in hair and blood, ordinal logistic regression analysis was performed with age, sex, gestational age, dominant feeding method, duration of fish intake, WAZ-BWZ and ID status as explanatory variables (Table 5 and Supplementary Table S2, respectively). Mostly breastfeeding (cumulative odds ratio: 6.235, 95% CI: 3.086–12.597, p < 0.001) and the duration of fish intake (cumulative odds ratio: 1.203, 95% CI: 1.034–1.401, p = 0.017) were significantly associated with hair Hg content. In addition, when the infants were categorized into six groups according to feeding method and fish intake, the hair Hg content was highest in the group that was mostly breastfed with complementary fish intake and lowest in the group that was mostly formula fed without fish intake (p < 0.001; Figure 3). The result of ordinal logistic analysis of three groups according to the quartile value of blood Hg was similar (Supplementary Table S2). The blood Hg content was also highest in the group that was mostly breastfed with complementary fish intake and lowest in the group that was mostly formula fed or mixed fed without fish intake (p = 0.012; Supplementary Figure S4).
Table 5. Ordinal regression analysis of categorized hair mercury content in 241 infants according to demographic, anthropometric, and diet-related factors and iron status.
ParameterBSE95% CI Exp (B)95% CI
LowerUpperp ValueLowerUpper
Male gender−0.1380.266−0.6600.3850.6060.8720.5171.469
Gestational age0.0450.096−0.1430.2330.6381.0460.8671.262
Monthly age0.0450.077−0.1060.1960.5601.0460.8991.216
Mostly breastfeeding1.8300.3591.1272.533<0.0016.2353.08612.597
Mixed feeding1.0550.4490.1751.9350.0192.8731.1926.924
Duration of fish intake0.1850.0770.0330.3370.0171.2031.0341.401
WAZ-BWZ−0.0940.147−0.3810.1930.5220.9100.6831.213
Iron deficiency0.4150.319−0.2111.0410.1941.5150.8102.832
Figure 3. Hair mercury content in six categorized groups of infants according to the feeding method and fish intake (p < 0.001). FF: mostly formula feeding, MF: mixed feeding, BF: mostly breastfeeding.
Ijerph 12 14669 g003

4. Discussion

Our study shows that the body Hg burden in healthy Korean weaning-age infants residing in Seoul city is usually within the range recommended by the Environmental Protection Agency (EPA) and has been decreasing recently [24,
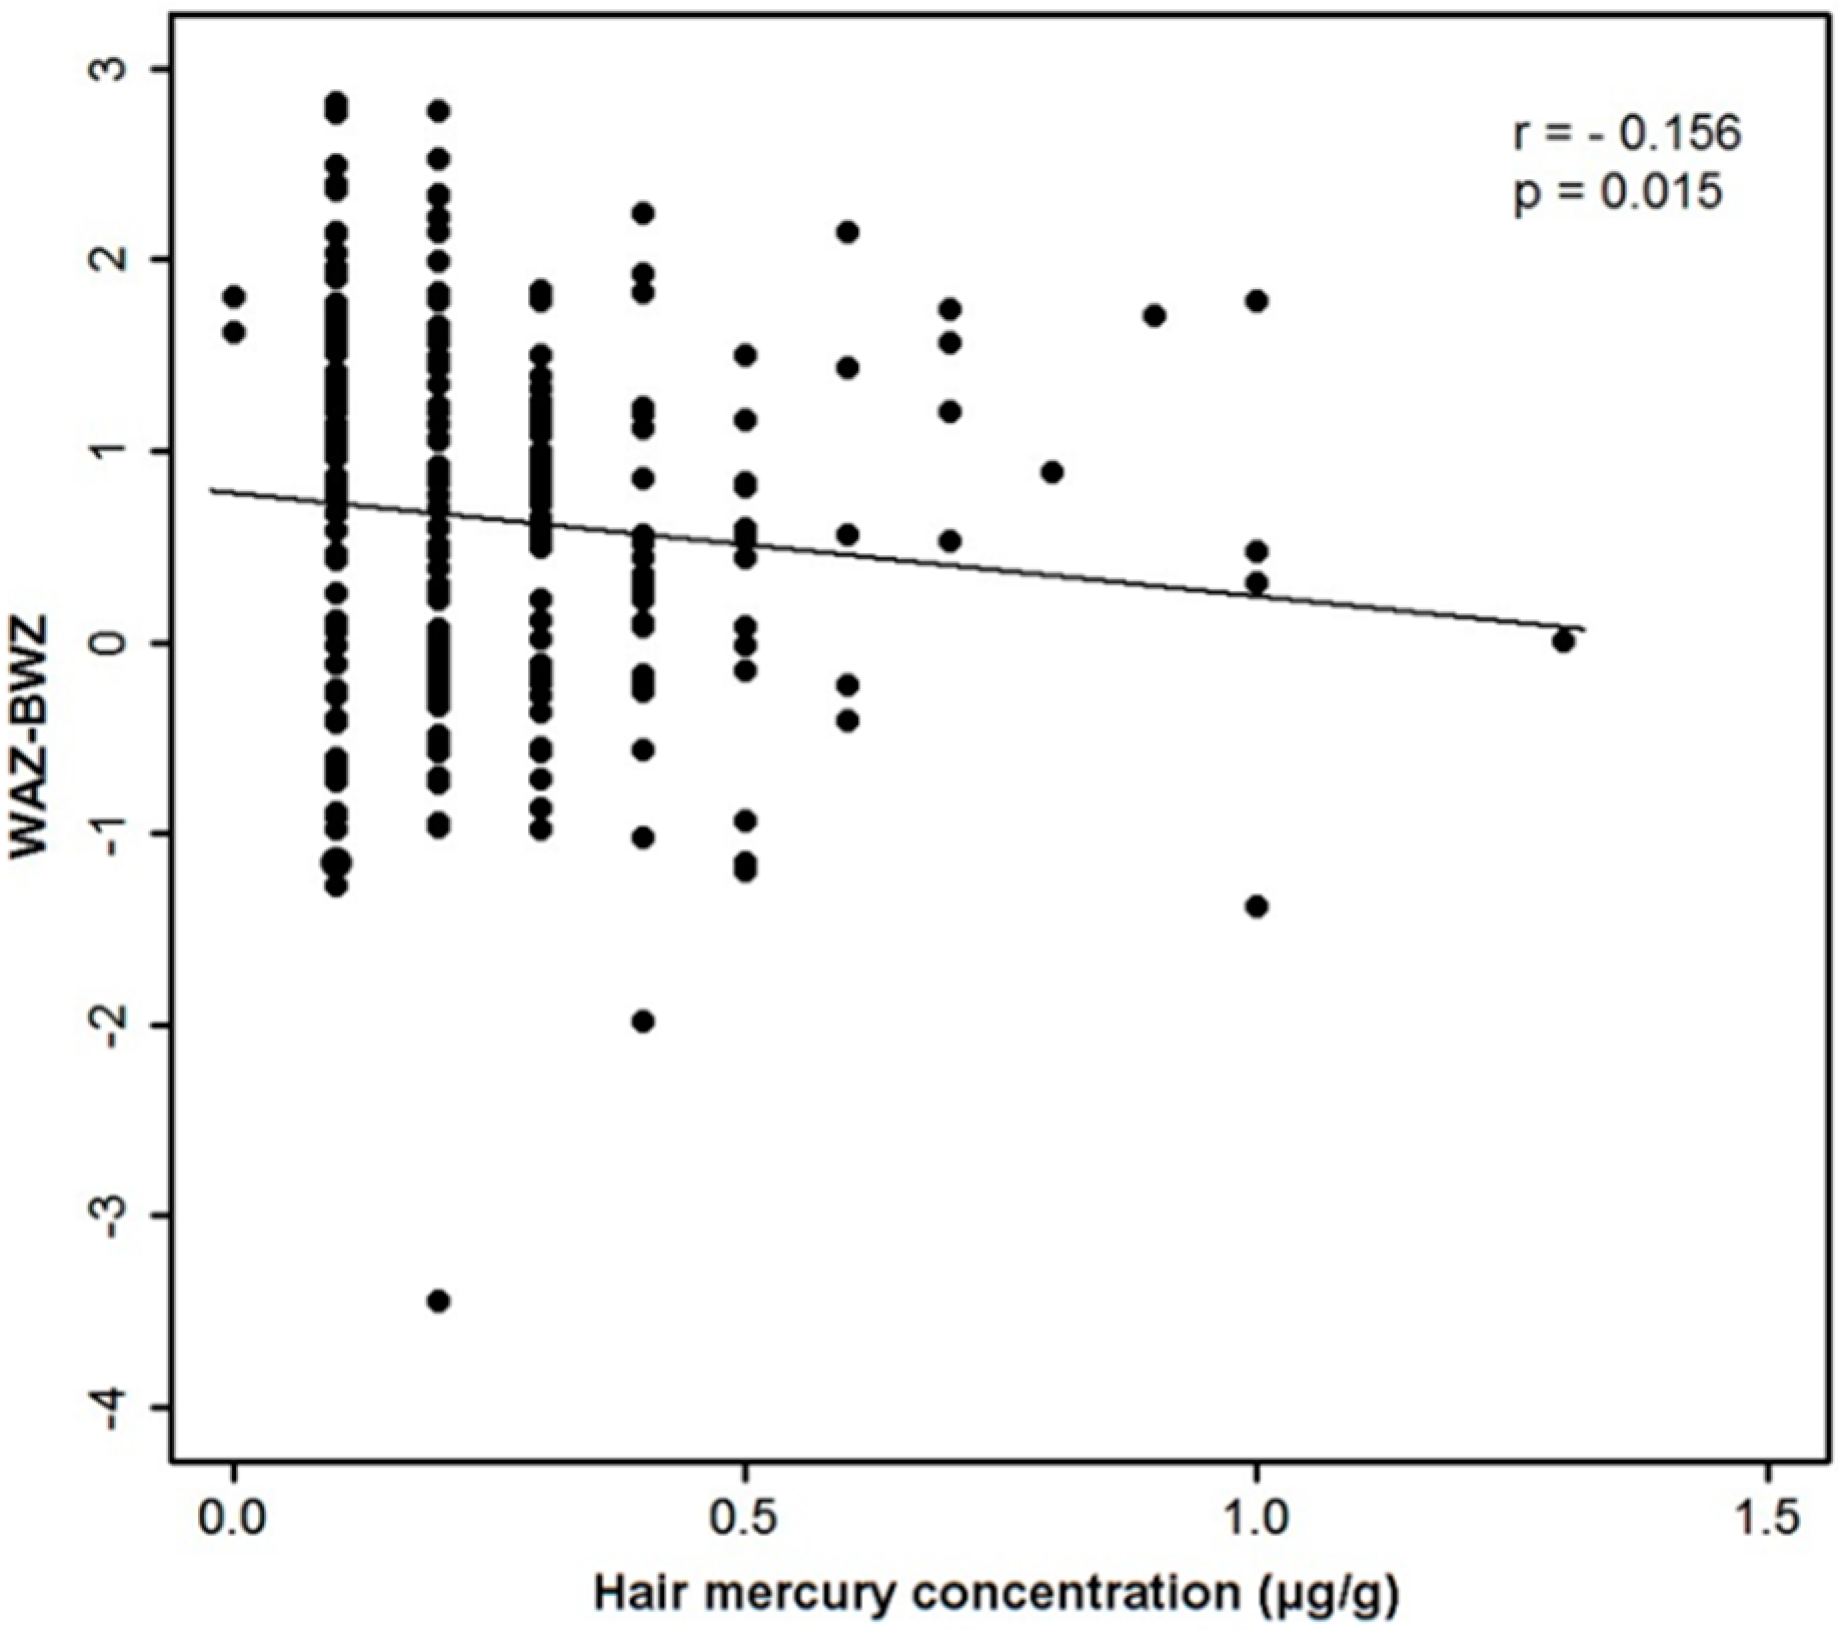
25]. Hg exposure at that level may not significantly affect anthropometry during infancy. Although there was a significant inverse correlation between the hair Hg content and weight gain among our subjects, the association disappeared after adjustment for the feeding method or the duration of breastfeeding, which make a far greater contribution to the anthropometry of infants than the body Hg burden. To our knowledge, this is one of the first reports to clarify the relationship among hair Hg content, anthropometry, and breastfeeding during weaning-age infancy using Hg levels in both hair and blood samples as biomarkers for chronic and recent exposure. In addition, we demonstrated that the Hg content in hair and whole blood is closely correlated with diet patterns in infancy, both breast-milk or formula feeding and the consumption of solids such as fish. Although our investigation was limited because fish intake was not precisely quantified and fish species ingested by infants and mothers was not examined thoroughly, we found significant correlations among feeding, fish intake, and Hg exposure that are comparable with the results of previous reports in older populations.
As for the body Hg burden in Korean infants, previous studies reported relatively higher Hg levels in neonates [8,26]. In the Mothers and Children’s Environmental Health study conducted in 2006, the geometric mean cord-blood Hg level among 797 neonates was 5.2 μg/L, and the level was more than 5.8 μg/L in as many as 39.1% of the subjects [8]. Beyond the neonatal age, one study performed in 2006 with 111 Korean mother-child pairs residing in a coastal area revealed that the hair Hg content of children approximately three years of age had a mean of 0.62 μg/g and was >1 μg/g in 17.9% of the children [5]. That study included only a small, undocumented number of infants. Compared with those previous studies, the Hg content in our subjects was relatively low, and it decreased significantly in 2013/2014 (geometric mean hair Hg: 0.18 μg/g) compared with that in 2009/2010 (geometric mean hair Hg: 0.28 μg/g). No subjects in 2013/2014 showed a blood Hg value greater than the US EPA limit of 5.8 μg/L. The body Hg content in weaning-age infants might be lower than that in neonates, adults, or older children, and it might decrease in pregnant women and babies, probably because of reduced fish intake by pregnant mothers for fear of Hg hazard to the fetus or radiation exposure after March 2011, at which time a nuclear power-plant disaster occurred in Japan. The relatively low Hg levels in our study subjects are still much higher, however, than those in older children in Western countries [27,28,29]. Further studies are needed to document whether this level of Hg exposure leads to adverse neurodevelopmental consequences. Recently, increasing evidence has demonstrated that the cognitive benefits of fish consumption during pregnancy outweigh the toxic effects of Hg exposure [21]. Therefore, the monitoring of Hg exposure through seafood consumption needs to be balanced with education efforts regarding the beneficial effects of unsaturated fatty acids on the neurodevelopment of children through ingestion of oily fish.
So far, the results concerning the influence of Hg exposure on the growth of children are debatable [2]. A significant inverse association between Hg exposure and growth has been observed in some, but not all, studies of both populations with relatively low levels of Hg exposure and definitively high levels of Hg exposure [12,15,16,17]. Incomplete adjustment for other factors influencing the growth of children might be one of the possible explanations for the discordant results among the studies. In a study of 171 infants in the Faroe Islands with high levels of Hg exposure (the geometric mean of cord-blood Hg was 20.3 μg/L) [15], the weight of infants at 18 months was independently associated with postnatal Hg exposure through breastfeeding apart from prenatal Hg exposure. The association remained significant after adjustment for the adverse influence of breastfeeding itself on growth. However, in this study, the biomarker for postnatal Hg exposure was not directly measured but was instead estimated from the cord-blood Hg and the duration of breastfeeding. Therefore, our study is probably one of the first to investigate the influence of directly measured, low-level Hg exposure during the postnatal period on growth while considering the confounding effect of breastfeeding. We suggest that to document the influence of Hg exposure on the postnatal growth of infants, adjustment should be made for the breastfeeding effect.
The relative slow growth in breastfed infants compared with formula-fed infants during the first few years of life are well documented [30,31,32,33]. Although toxic contaminants such as Hg or polychlorinated biphenyls above certain levels might contribute to the relative slow growth in breastfed infants [15], low-level exposure to contaminants such as that among our subjects might not significantly affect the postnatal growth of infants. Recently, the relatively slow growth pattern of breastfed infants has been regarded as physiological, whereas the accelerated early growth pattern of formula-fed infants can be regarded as a risk factor for future obesity [30,
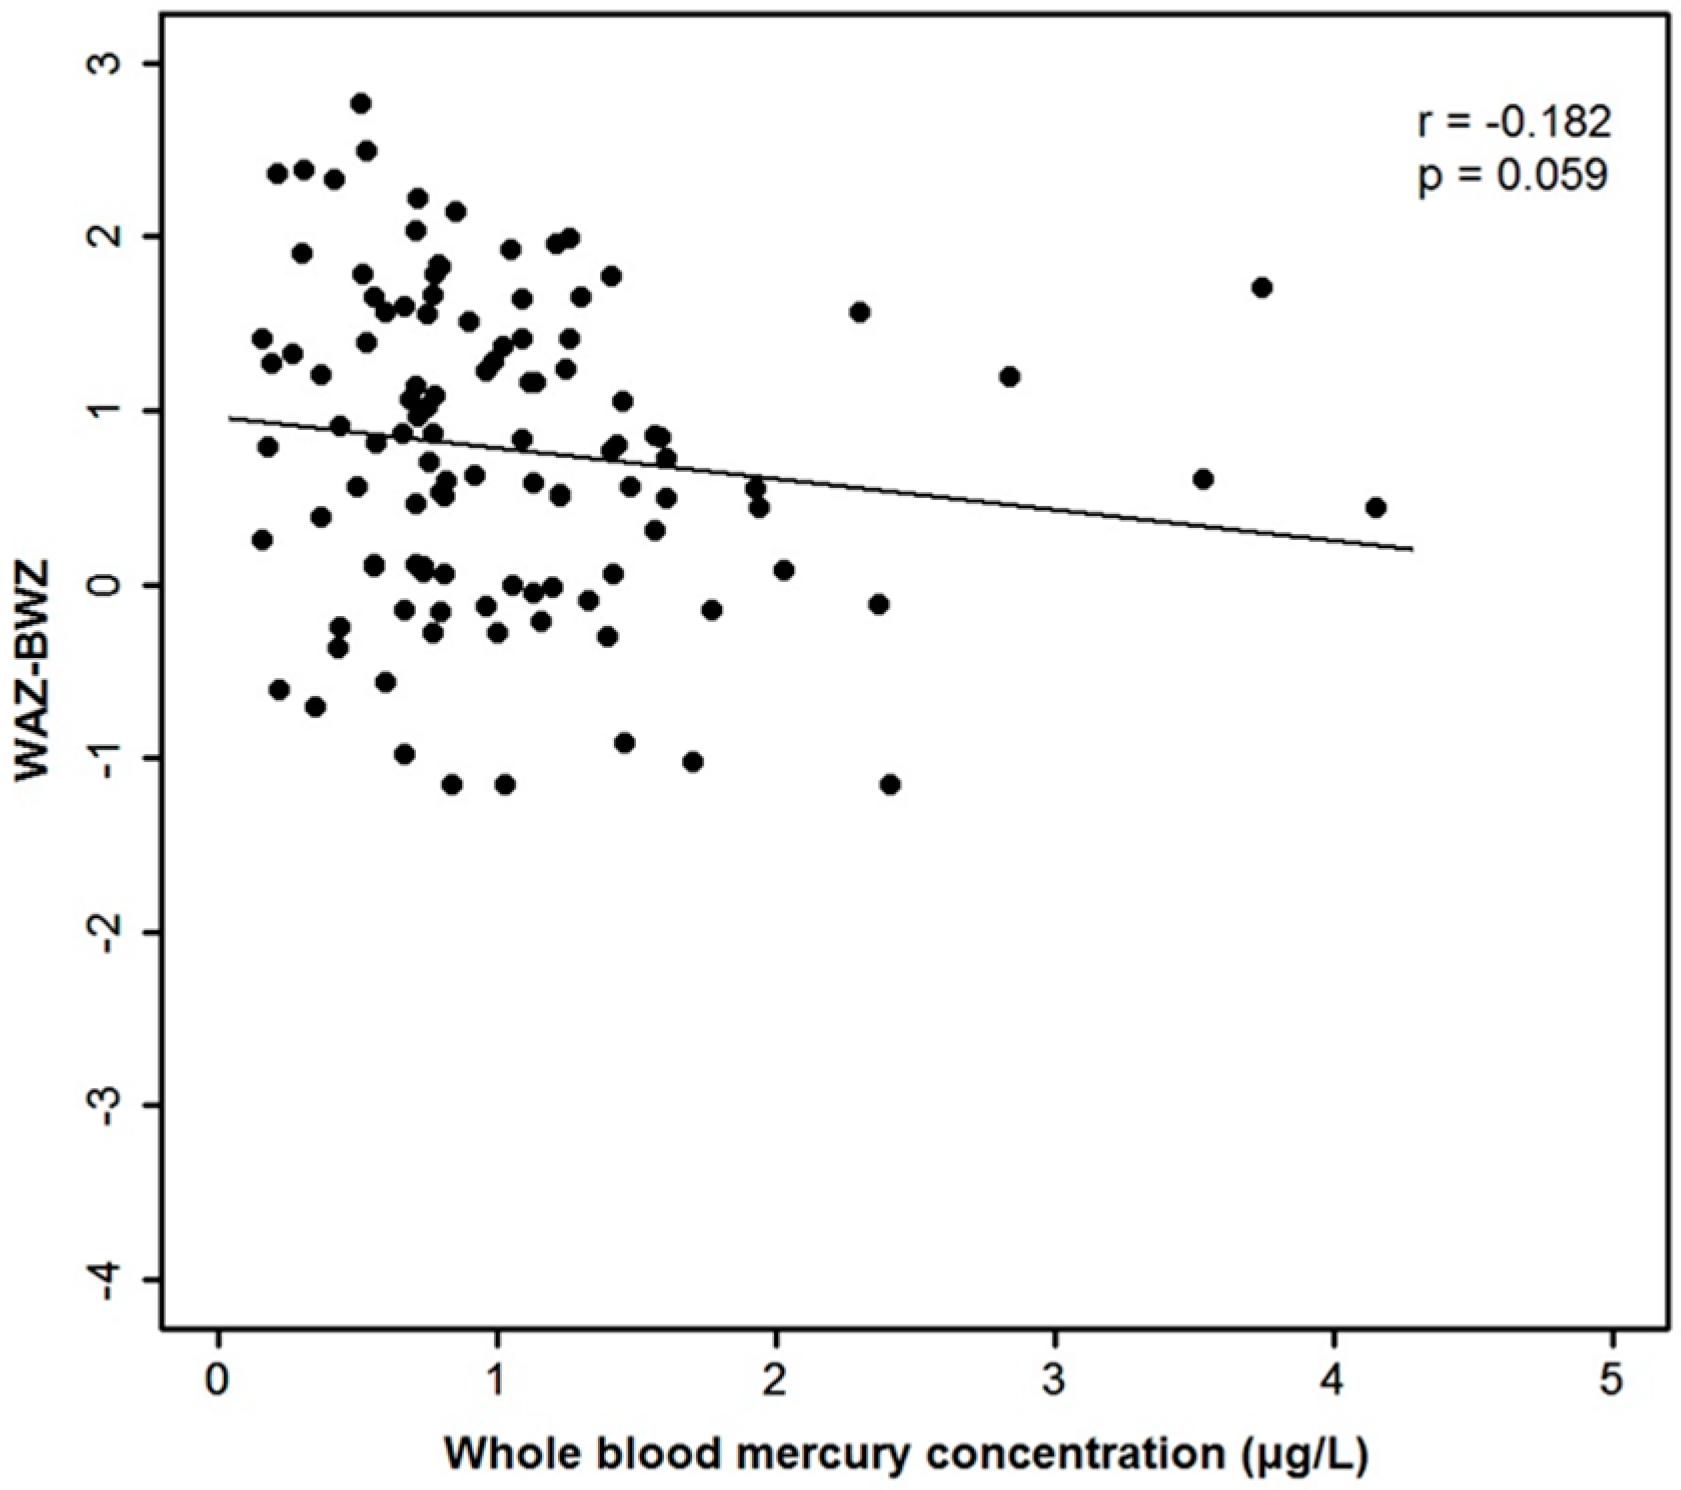
34]. One of the limitations of our study is that the cord-blood Hg level was not measured at birth. Hence, the association between prenatal Hg exposure and the anthropometry of neonates or infants could not be evaluated. The number of low birth weight infants was significantly higher, however, in the group of infants with the lowest hair Hg content compared with that in the other groups (Table 3, p = 0.013). Furthermore, the hair and blood Hg contents of the infants were not significantly correlated with growth at birth. Thus, if postnatal Hg exposure in infants is assumed to be correlated with prenatal Hg exposure [5,35], it is possible that prenatal growth might not be inversely correlated with prenatal Hg content in our study population.
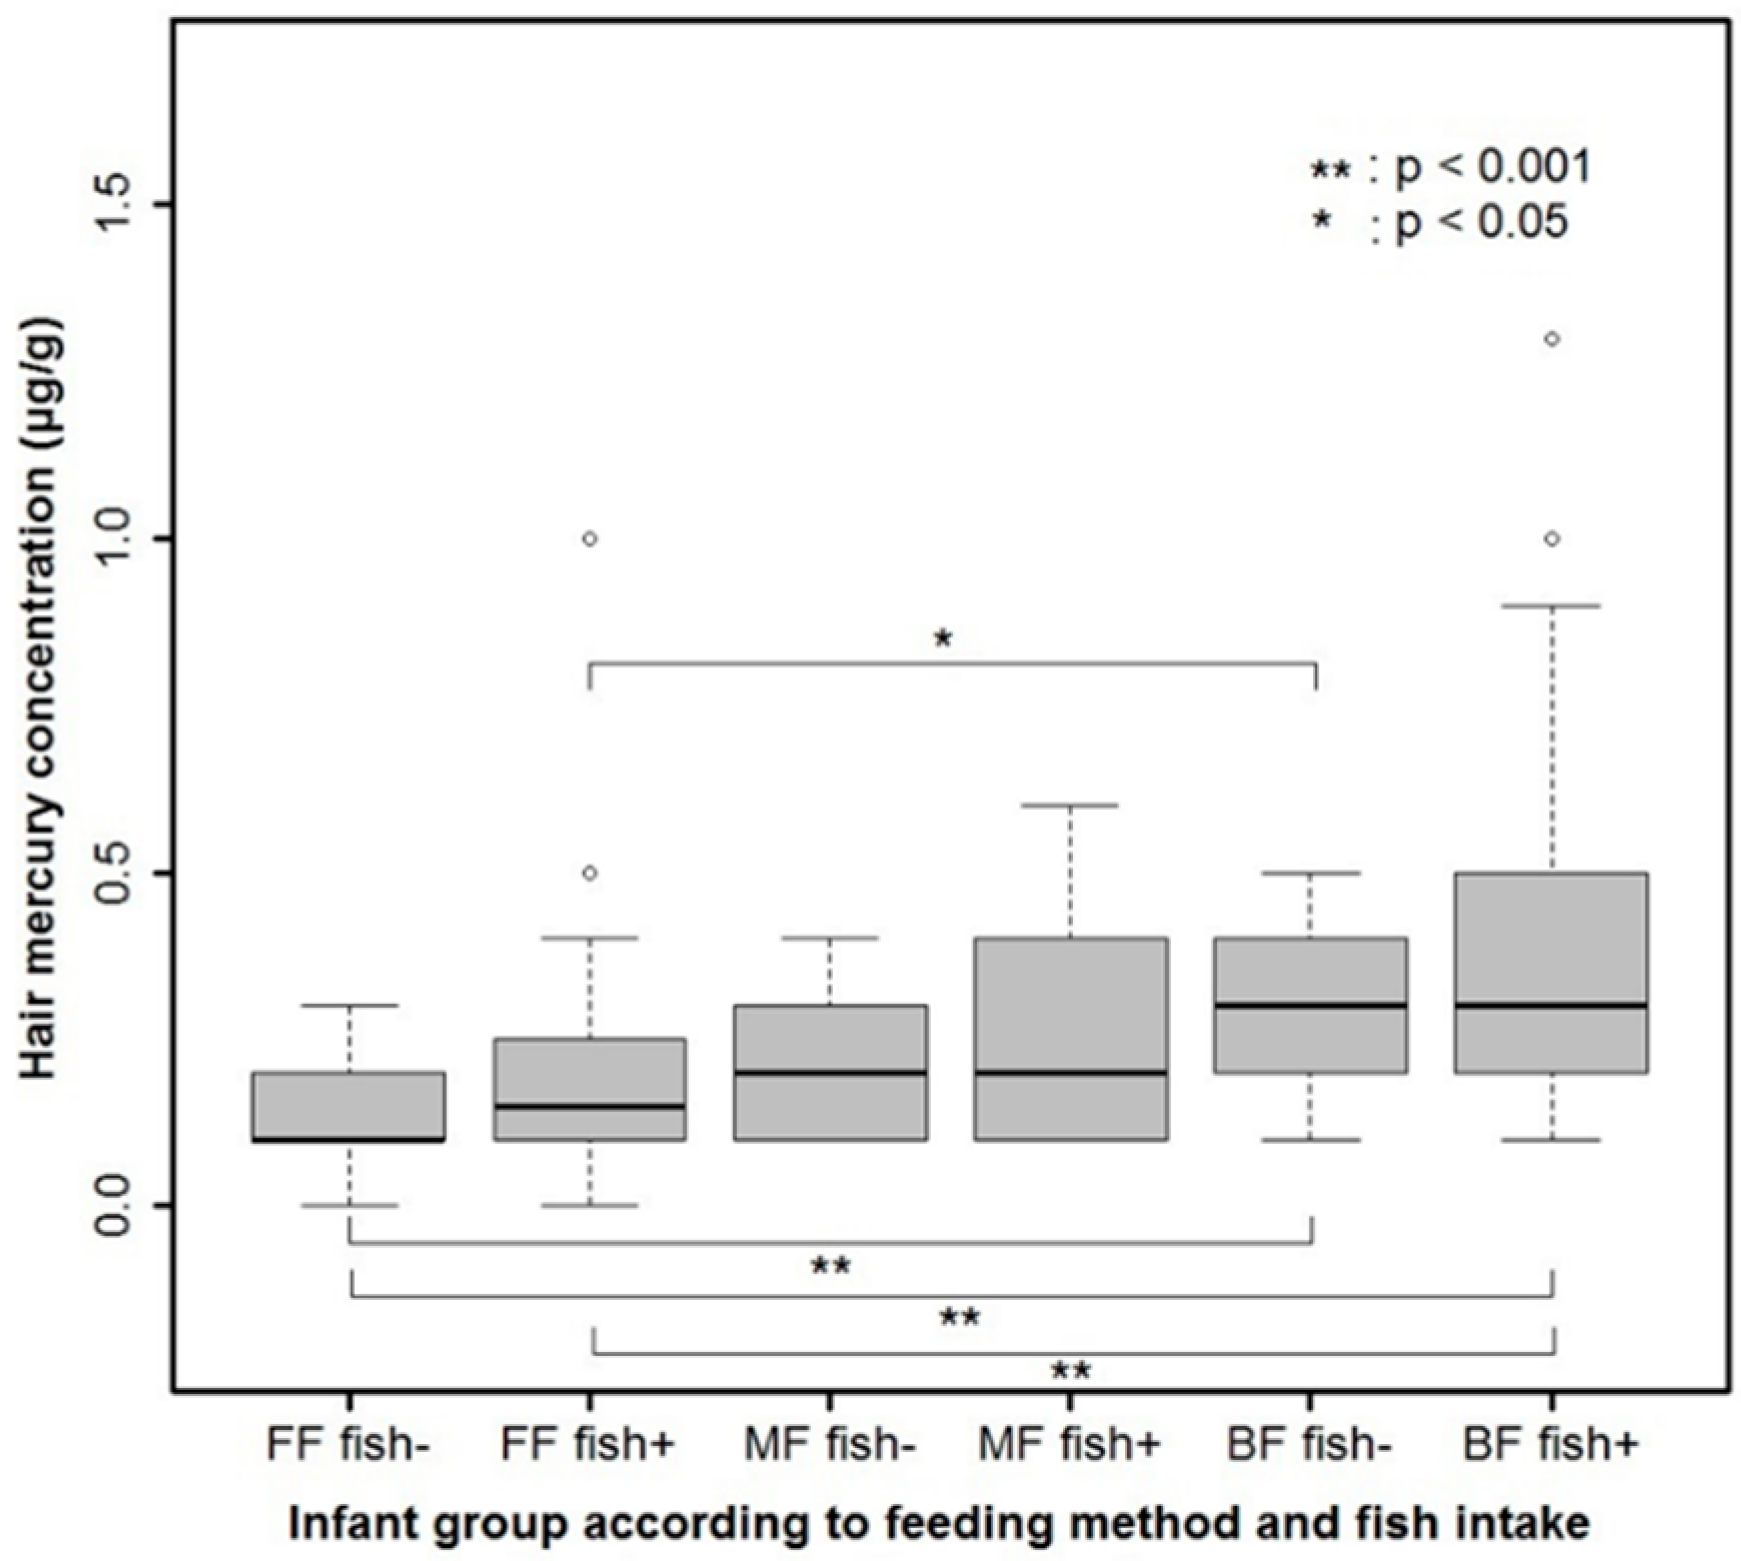
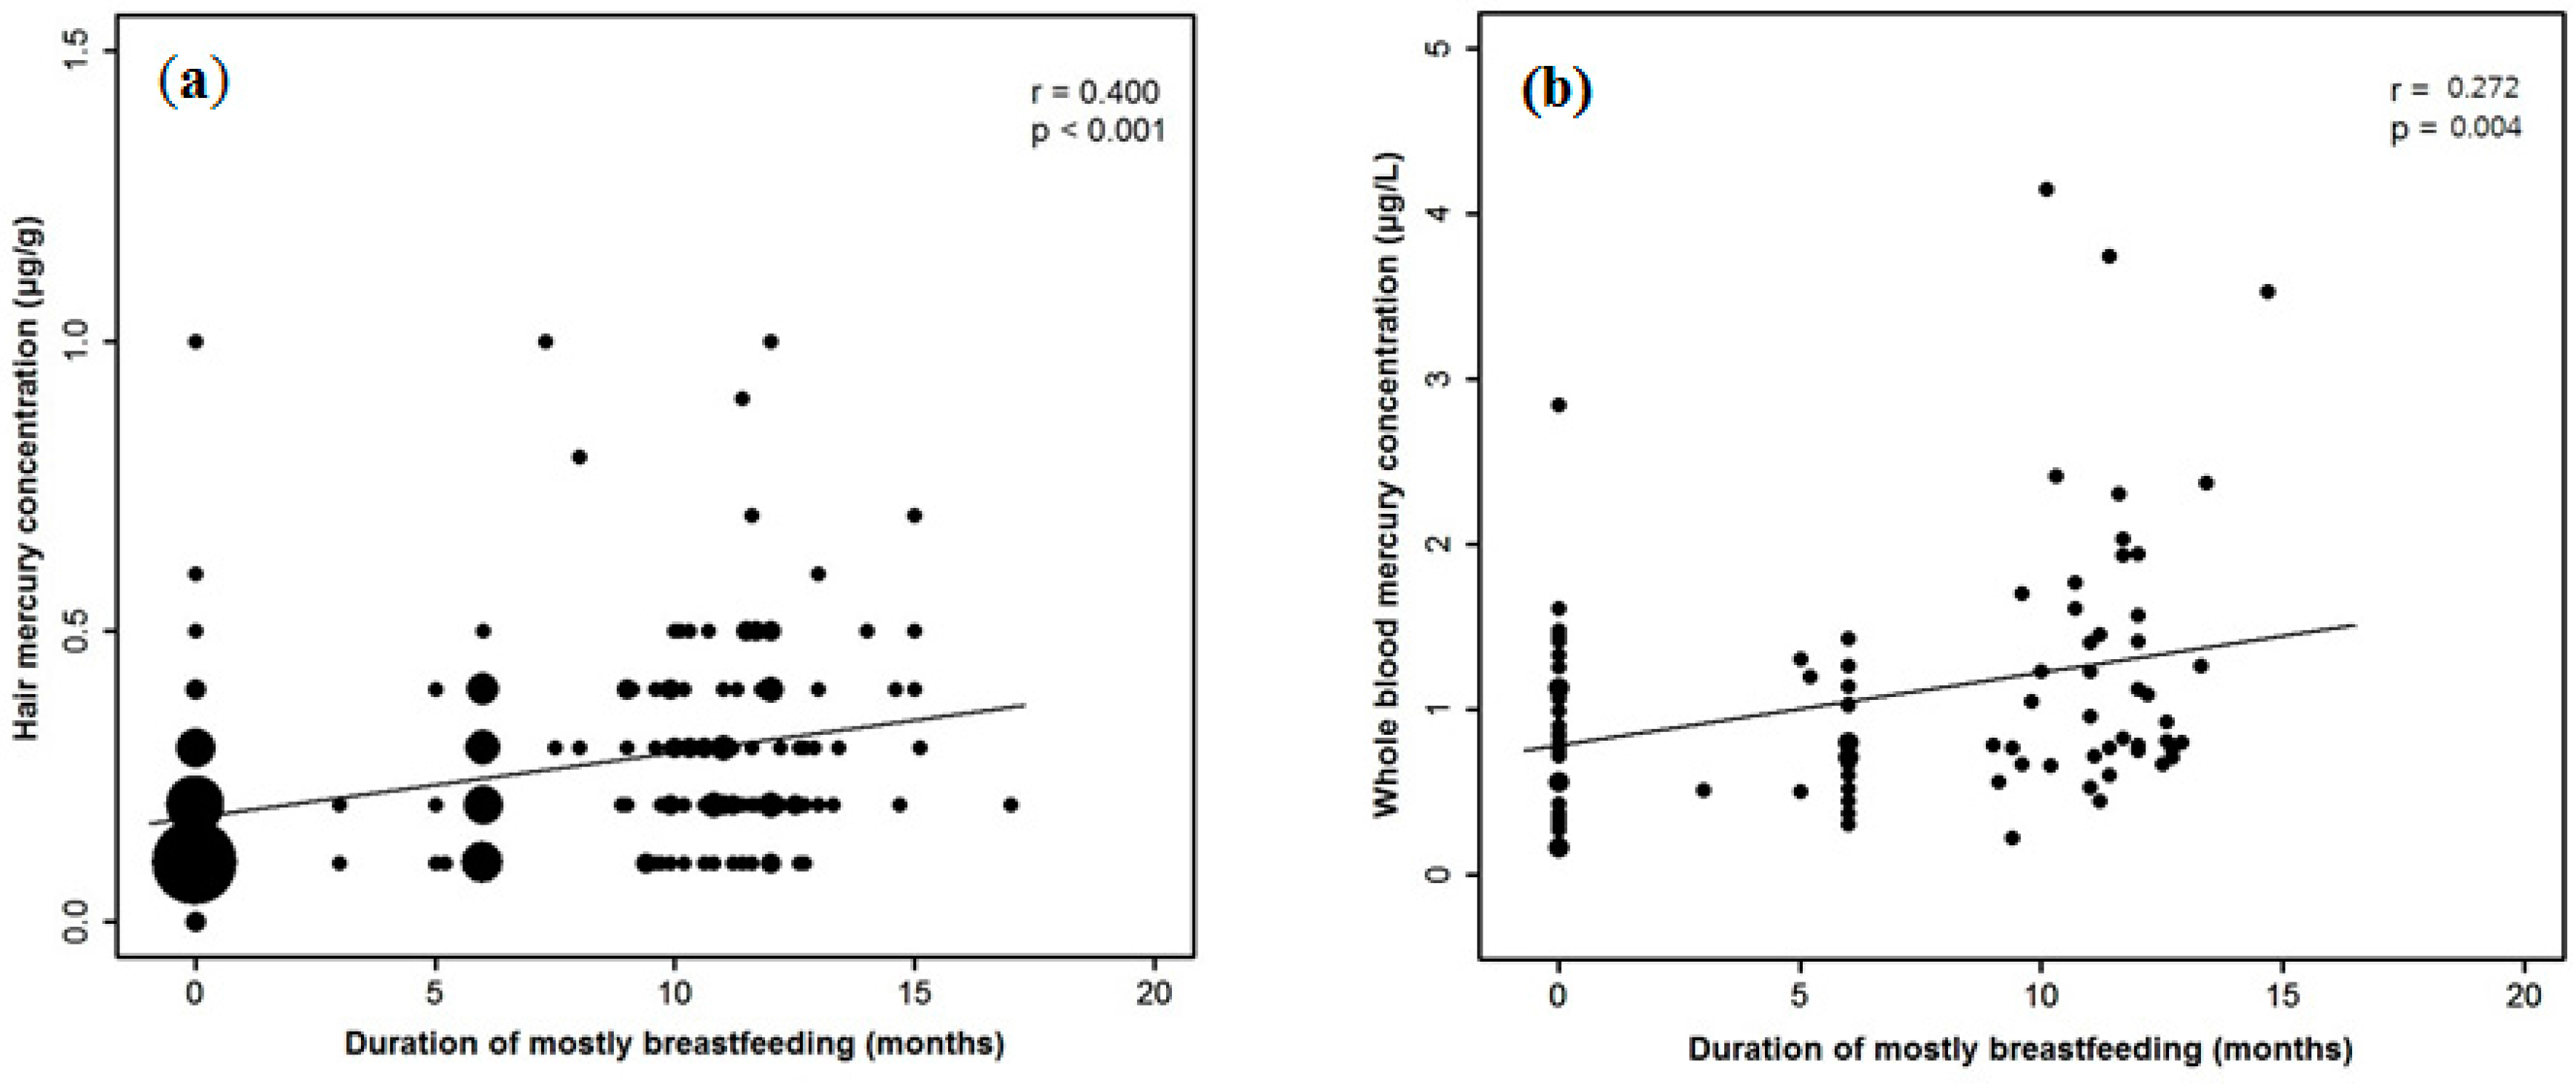
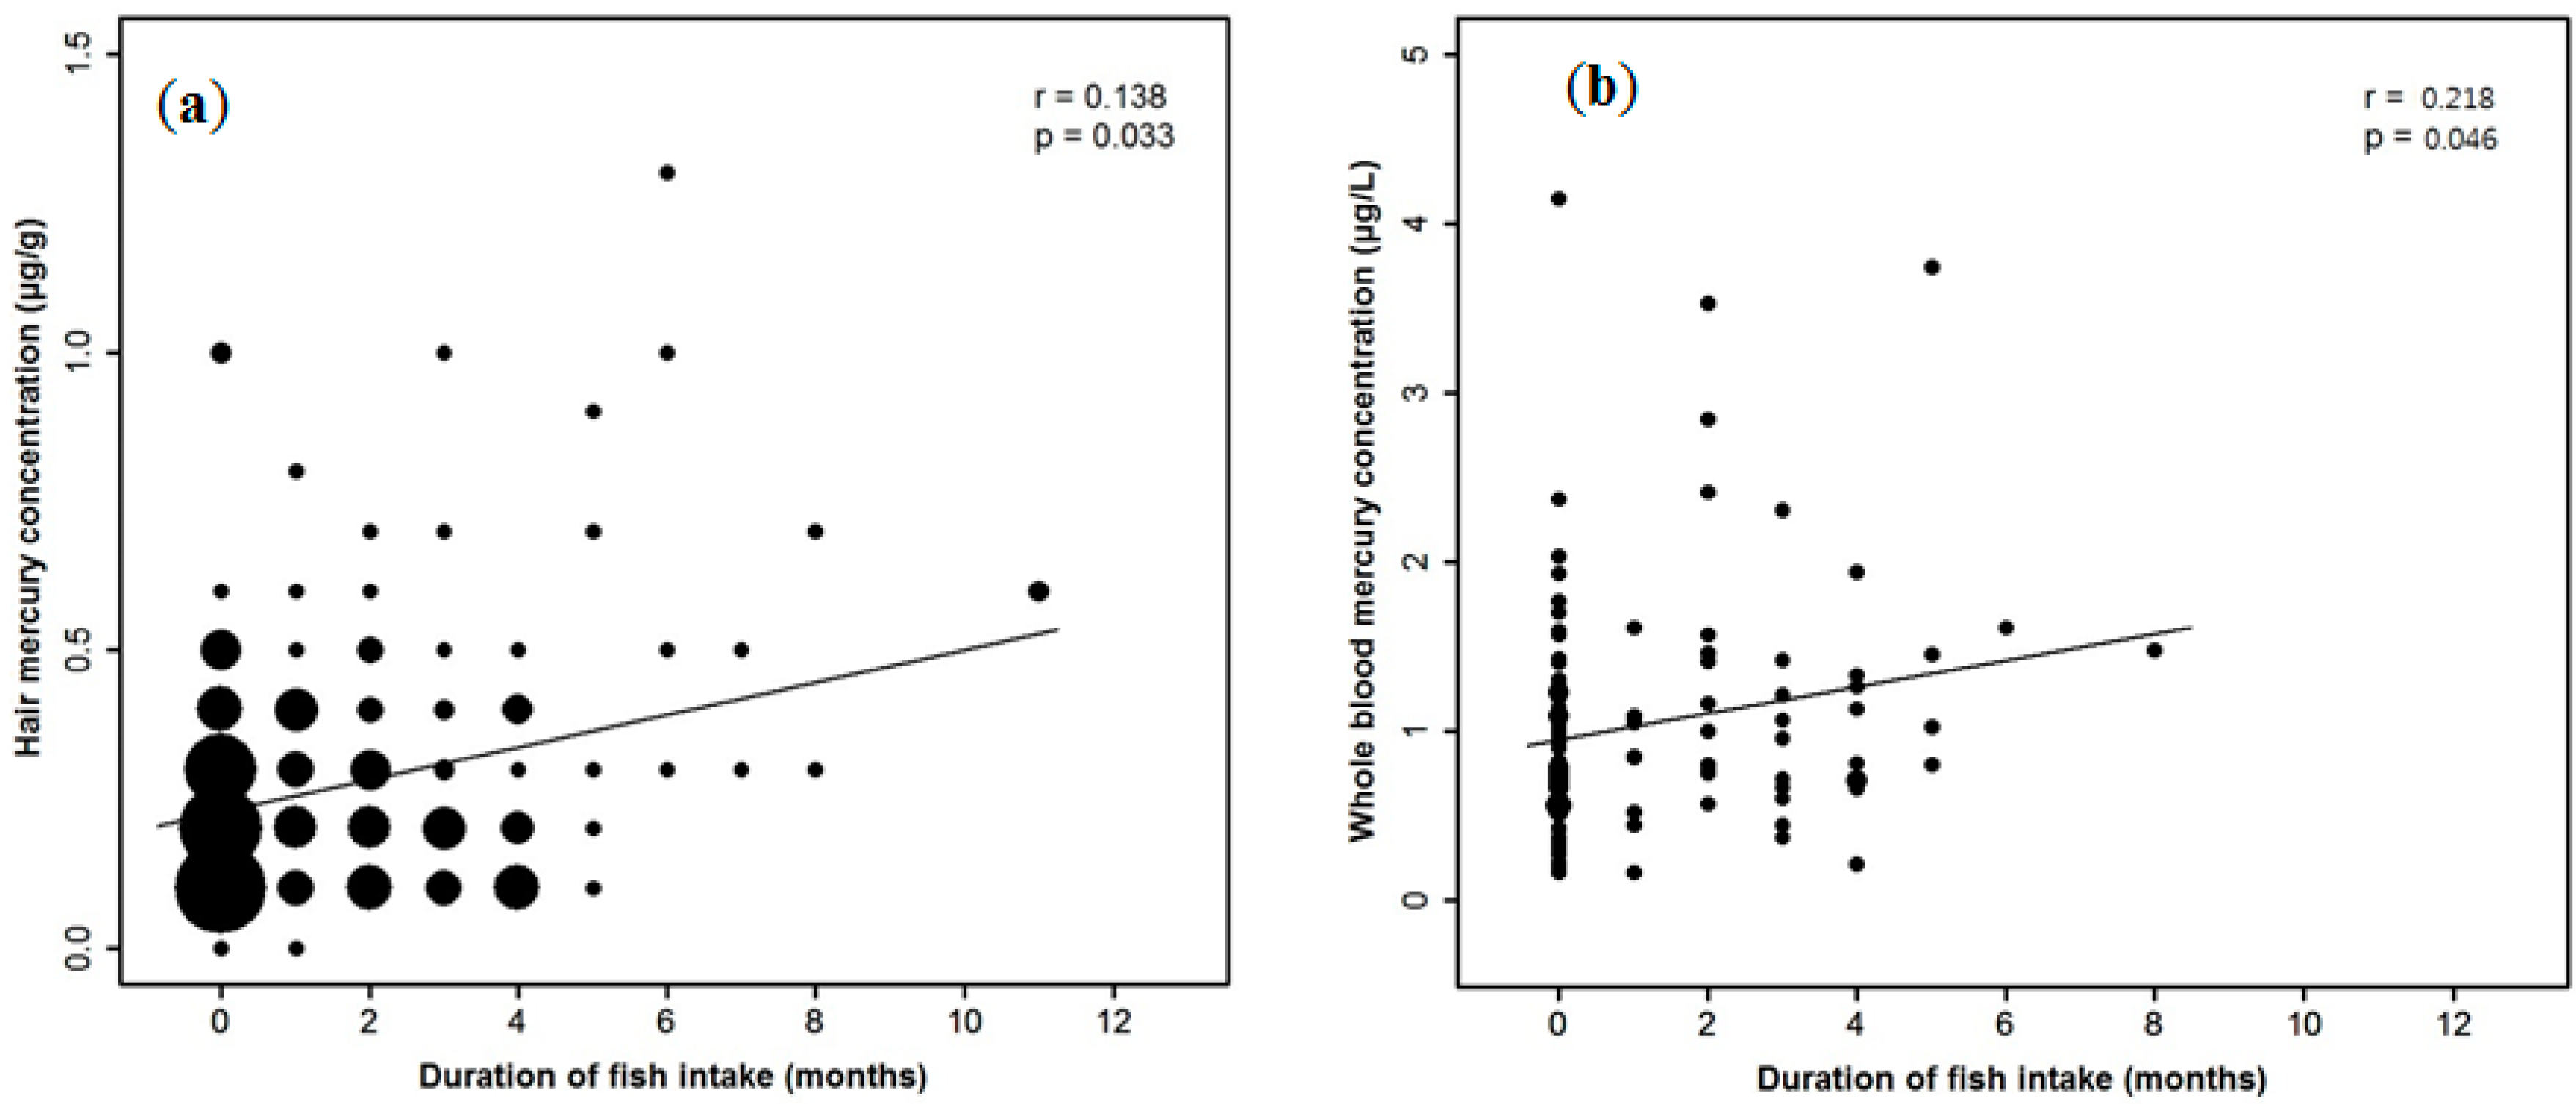
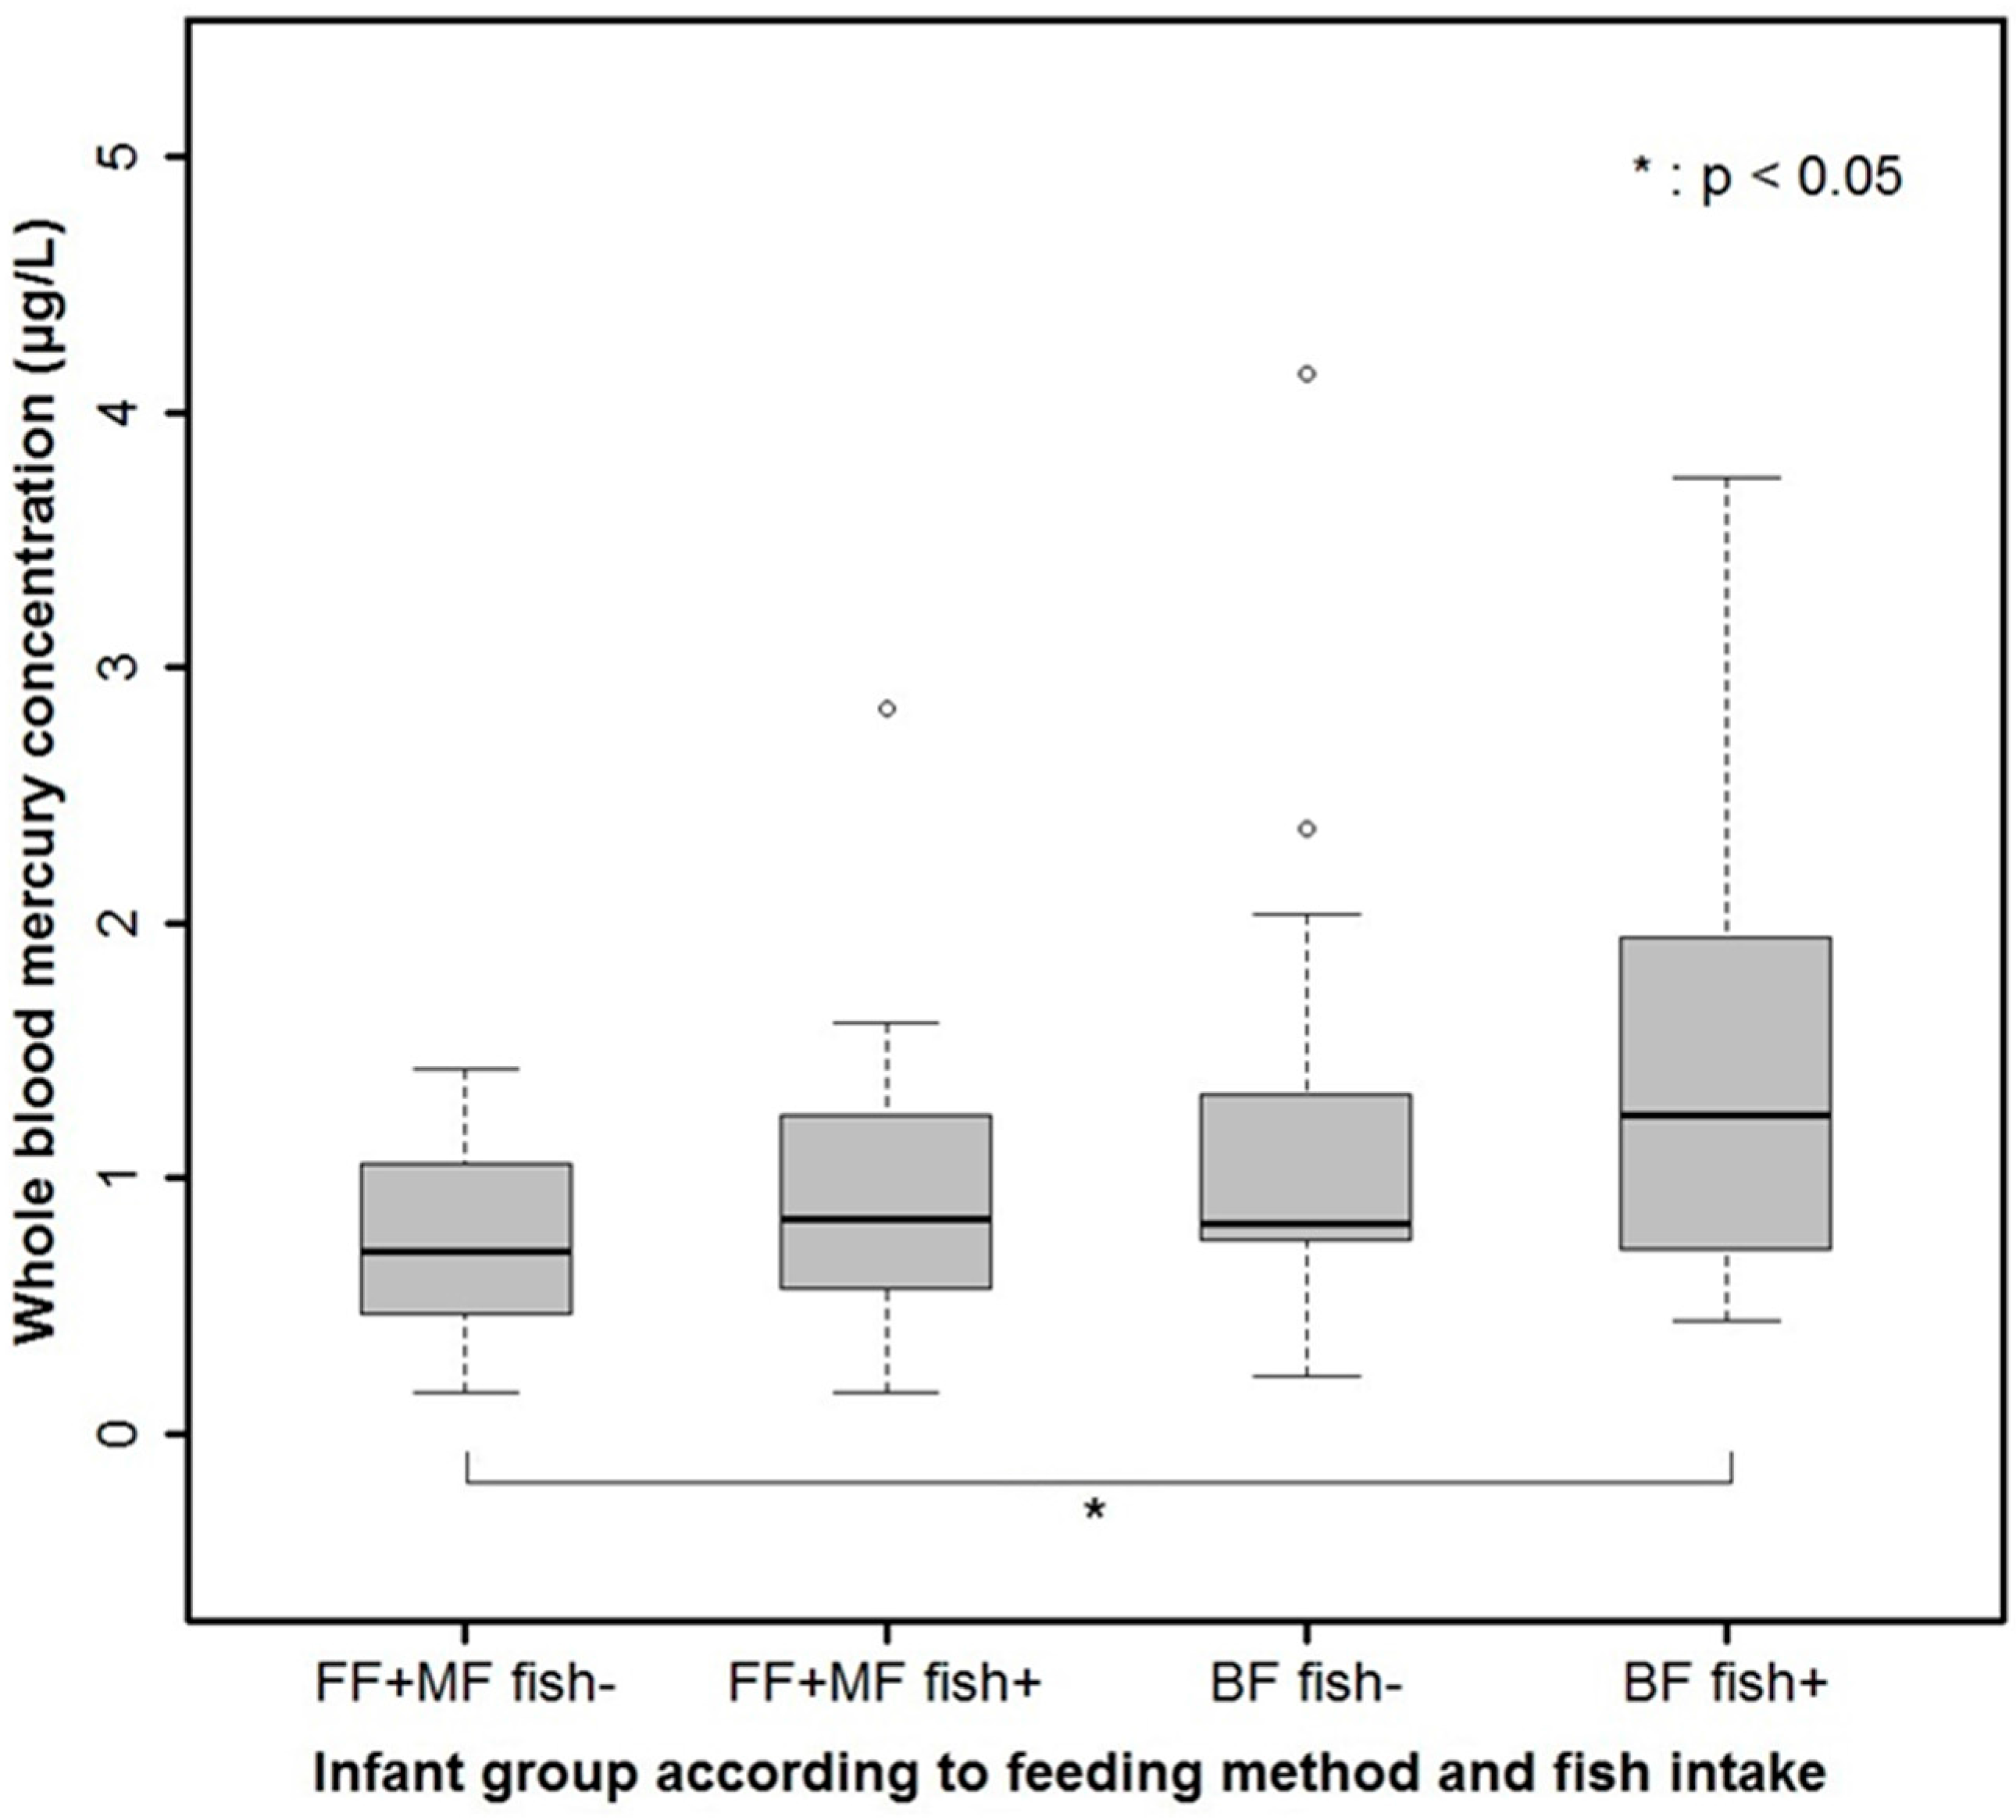
In our study, the feeding method or duration of breastfeeding and the duration of fish intake were independently and significantly correlated with the Hg content of both the hair and the blood in late infancy. The duration of breastfeeding might reflect the amount of Hg exposure from the mother, which is probably mainly associated with the fish intake of the mother. Therefore, the fish intake of both the mother and the infant are important sources of Hg exposure in late infancy. The recommended amount, frequency, starting age, and type of fish intake as a complementary food by infants who continue breastfeeding after exclusively or mostly breastfeeding for the first six months of life, may need to be determined with caution, and the information regarding the balance of Hg and unsaturated fatty acid intake via oily fish should be given to parents. In our study, Hg exposure significantly decreased in the 2013/2014 season compared with that in the 2009/2010 season, which can be explained by the significant difference in the breastfeeding rate between the two periods. In addition, although not statistically significant, there was a tendency for children enrolled in 2009/2010 to start eating fish earlier and more frequently than those enrolled in 2013/2014. Since the fish intake patterns of children are usually associated with those of their mothers, Hg exposure through breastfeeding, which is closely associated with the fish-intake pattern of the mother, might also be higher in the children examined in 2009/2010. In our study, a precise history of the frequencies and type of fish intake by the mothers and infants was taken only in 2013/2014; thus, a direct comparison of the amount of fish intake between the two periods was not possible. However, the proportion of mothers who ate fish more than once per week and more than three times per week was 19/95 (20.0%) and 4/95 (4.2%), respectively, which is far less than the 33/63 (52.4%) and 9/63 (14.3%) pregnant women residing in Seoul who did so in a 2004 study [36]. The Hg exposure in the general Korean population has also been reported to be decreasing through 2008–2011 [25].
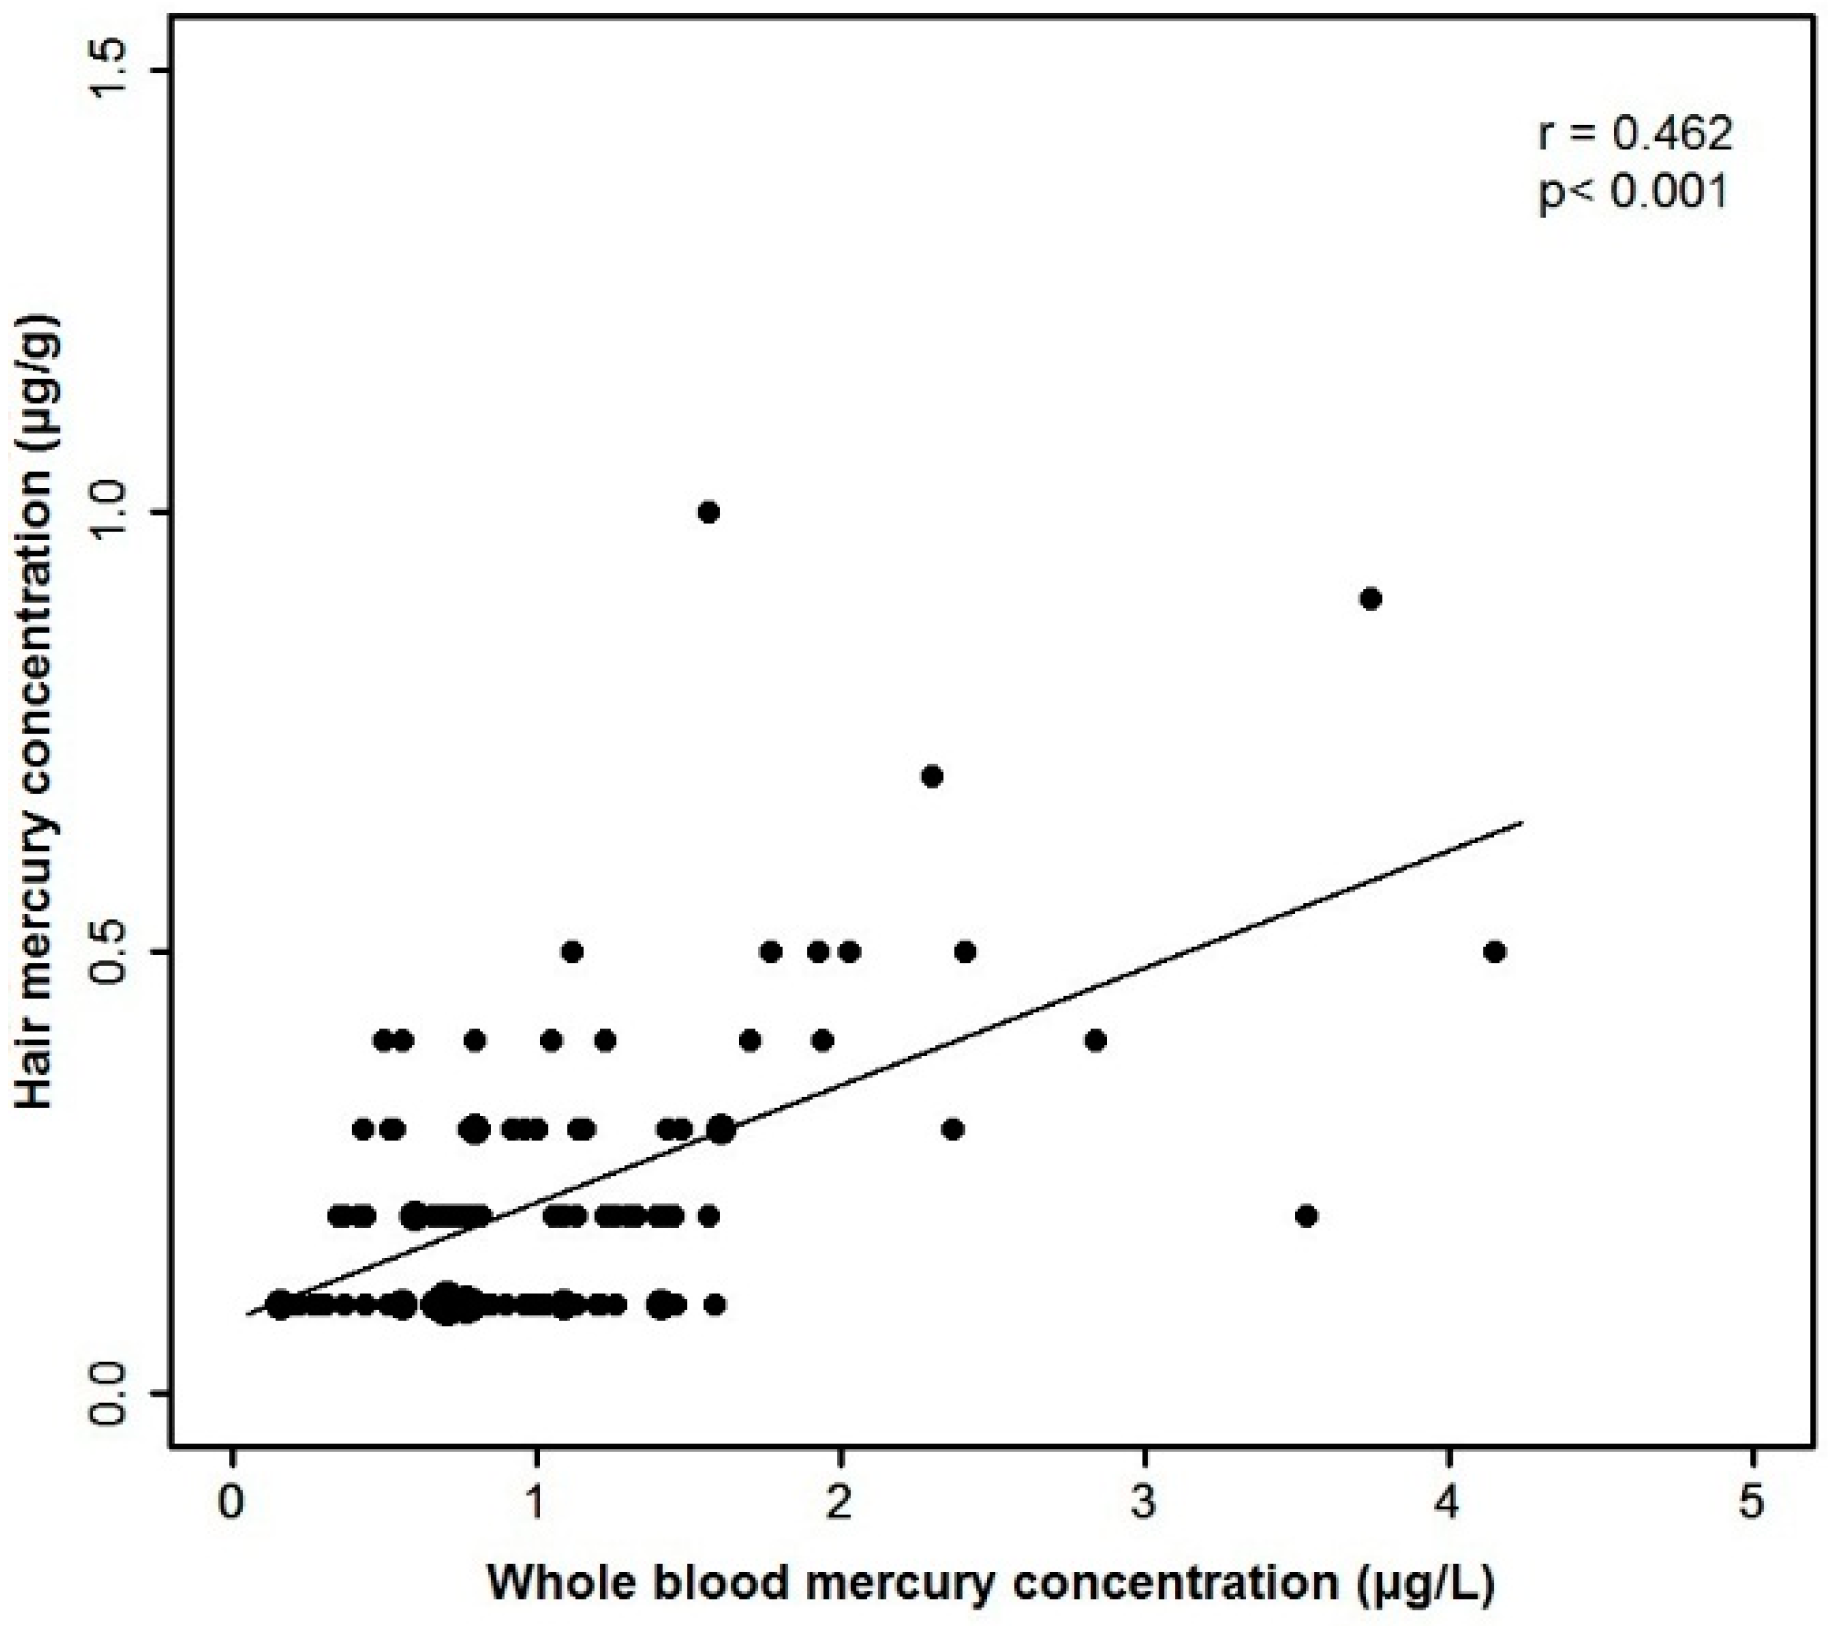
Finally, the hair Hg content was strongly correlated with the blood Hg content in late infancy, which is compatible to the results of many previous studies in adults [37,38]. The ratio between the hair and blood Hg concentrations (median 202.7) is also close to the ratios of the Hg contents of maternal hair and cord blood found in previous studies [10,38,39]. Although both hair and blood Hg levels have been considered reliable biomarkers for the body burden of methyl Hg, they represent different time frames and, thus, might not necessarily be correlated [40]. While the whole-blood Hg content represents recent Hg exposure with a half-life of approximately 60 days, the hair Hg content represents previous chronic exposure of varying duration [41]. If a 3 cm length of hair is examined, the resulting Hg content might represent approximately three months of exposure in adults and about five months of exposure in infants [42]. This difference between the two biomarkers were reflected in slightly different results between hair Hg- and blood Hg-related analyses in our study, although the major results of the analyses on Hg content and diet were in agreement between the hair and blood-related analyses. For example, the median duration of fish intake in the 2013/2014 season was less than one month, which might explain the observation that the blood Hg content, but not the hair Hg content, significantly correlated with the duration of fish intake by the infants during the 2013/2014 season (Table 3, Figure S3); blood Hg content more accurately reflects recent exposure compared with the hair Hg content. This was also reflected in the finding that the blood Hg level of mixed-fed infants (who were mostly formula fed during late infancy) and formula-fed infants were not significantly different in contrast to the result of hair Hg related analyses (Supplementary Table S1 and Table S2).

5. Conclusions

In summary, low-level Hg exposure during infancy was not significantly associated with weight gain from birth to around 11 months of age after adjustment for the effect of breastfeeding on growth. The Hg contents of both the hair and the blood in weaning-age infants residing in Seoul city was usually in the safe range and have decreased in recent years. The duration of breastfeeding and the fish intake by infants were independently associated with body Hg content in late infancy. Therefore, if a prolonged period of mostly breastfeeding is expected in late infancy, fish intake patterns of both mothers and infants during that period may need to be monitored. The hair Hg content shows a good correlation with the blood Hg content, and can therefore be used as a reliable biomarker for Hg exposure in large-scale studies of post-neonatal infants.

Supplementary Materials

Table S1. Demographic, anthropometric, and diet-related parameters and iron status in three categories of infants according to the quartile values of whole blood mercury content.
CharacteristicsWhole Blood Mercury Level (µg/L)p Value a
≤0.63 (n = 27)>0.63 and <1.28 (n = 55)≥1.28 (n = 27)
Age, months b10.8 (9.8, 11.7)11.5 (10.7, 12.5)11.5 (10.9, 12.1)0.014 c
Gender
  Male1525160.786
  Female123011
Gestational age, weeks b39 (37.6, 40)39 (38, 40)40 (38.4, 40.4)0.049 c
  <37 weeks4110.075
Anthropometry, Z-score d
  birth weight, kg3.26 (2.89, 3.48)3.20 (2.98, 3.41)3.21 (3.04, 3.56)0.750 e
  birth weight < 2.5kg, n2300.195
  birth weight0.07 (−0.96, 0.41)−0.30 (−0.64, 0.28)−0.07 (−0.53, 0.49)0.738 e
  weight for age0.93 (−0.06, 1.29)0.58 (0.12, 0.97)0.42 (−0.06. 0.93)0.184 e
  WAZ - BWZ1.21 (0.12, 1.79)0.87 (0.07, 1.51)0.55 (−0.09, 0.86)0.080 e
Dominant feeding method, n
  mostly breast-fed524160.022
  mixed-fed7122
  mostly formula-fed12137
  others362
Duration of mostly breastfeeding, months b1.5 (0–6)6.0 (0–11.7)10.7 (0–11.7)0.009 c
Fish intake, n
  presence1630130.415
  absence112514
Duration of fish intake, months b0 (0–1)0 (0–2)2.0 (0–3)0.078 c
Iron status, n
  Iron deficiency21260.162
  Non-iron-deficiency254321
  Iron deficiency anemia2630.685
a The values were calculated using the Chi-square test, unless otherwise stated; b The values are presented as the median and interquartile range; c The values were calculated using the Kruskal-Wallis test; d The values are presented as the mean and 95% confidence interval; e The values were calculated using the ANOVA.
Table S2. Ordinal regression analysis of categorized whole blood mercury content in 109 infants according to demographic, anthropometric, and diet-related factors and iron status.
ParameterBSE95% CIExp (B)95% CI
LowerUpperp ValueLowerUpper
Male gender0.3530.4160.4621.1690.3951.4240.6303.218
Gestational age0.2790.1400.0050.5520.0461.3211.0051.737
Monthly age0.2120.1250.0320.4560.0881.2360.9691.578
Mostly breastfeeding1.1270.5440.0622.1930.0383.0871.0648.959
Mixed feeding0.0350.5811.1041.1740.9521.0360.3323.235
Duration of fish intake0.3420.1280.0920.5930.0071.4081.0971.809
WAZ-BWZ0.3320.2520.8270.1630.1890.7180.4371.177
Iron deficiency0.1860.5750.9421.3130.7471.2040.3903.719
Table S3. Fish species commonly ingested by infants and their mothers enrolled during the 2013/2014 season.
Fish SpeciesInfant (n = 95)Mother (n = 95)
Number aPercentNumber aPercent
Cod3738.988.4
Shrimp2122.11010.5
Anchovy1717.92223.2
Croaker1414.71920
Hair tail44.299.5
Flat fish22.110
Mackerel22.11414.7
Tuna22.11010.5
Japanese Spanish mackerel0055.3
a Mothers may have provided multiple answers to the open question on the species of fish.
Figure S1. Correlation between whole blood mercury content and WAZ-BWZ.
Ijerph 12 14669 g004
Figure S2. Correlation between duration of mostly breastfeeding and mercury content in hair (a), and in whole blood (b).
Ijerph 12 14669 g005
Figure S3. Correlation between duration of fish intake and mercury content in hair (a) and in whole blood (b).
Ijerph 12 14669 g006
Figure S4. Hair mercury content in four categorized groups of infants according to the feeding method and fish intake (p = 0.012). FF+MF: mostly formula feeding + mixed feeding, BF: mostly breastfeeding.
Ijerph 12 14669 g007

Acknowledgments

We appreciate statistical consultation provided by the Medical Research Collaborating Center at the Seoul National University College of Medicine/the Seoul National University Hospital and Professor So Hee Oh from the Department of Medical Statistics at the Boramae Medical Center. This study was supported by Grant No. 16-2013-55 from the SK Telecom Research Fund.

Author Contributions

Ju Young Chang designed the study. Ju Young Chang and Sue Shin analyzed data. Ju Young Chang and Jeong Su Park wrote the article. Hye Ran Yang, Jin Soo Moon, and Jae Sung Ko contributed to the production and interpretation of the results. All authors drafted the article and revised it critically for important intellectual content, and approved the final article.

Conflicts of Interest

The authors declare no conflict of interest.

References

  1. Akagi, H.; Grandjean, P.; Takizawa, Y.; Weihe, P. Methylmercury dose estimation from umbilical cord concentrations in patients with minamata disease. Environ. Res. 1998, 77, 98–103. [Google Scholar] [CrossRef] [PubMed]
  2. Karagas, M.R.; Choi, A.L.; Oken, E.; Horvat, M.; Schoeny, R.; Kamai, E.; Cowell, W.; Grandjean, P.; Korrick, S. Evidence on the human health effects of low-level methylmercury exposure. Environ. Health Perspect. 2012, 120, 799–806. [Google Scholar] [CrossRef] [PubMed]
  3. Lee, J.W.; Lee, C.K.; Moon, C.S.; Choi, I.J.; Lee, K.J.; Yi, S.M.; Jang, B.K.; Yoon, B.J.; Kim, D.S.; Peak, D.; et al. Korea national survey for environmental pollutants in the human body 2008: Heavy metals in the blood or urine of the Korean population. Int. J. Hyg. Environ. Health 2012, 215, 449–457. [Google Scholar] [CrossRef] [PubMed]
  4. Ha, M.; Kwon, H.J.; Leem, J.H.; Kim, H.C.; Lee, K.J.; Park, I.; Lim, Y.W.; Lee, J.H.; Kim, Y.; Seo, J.H.; et al. Korean environmental health survey in children and adolescents (KorEHS-C): Survey design and pilot study results on selected exposure biomarkers. Int. J. Hyg. Environ. Health 2014, 217, 260–270. [Google Scholar] [CrossRef] [PubMed]
  5. Kim, S.A.; Jeon, C.K.; Paek, D.M. Hair mercury concentrations of children and mothers in Korea: Implication for exposure and evaluation. Sci. Total Environ. 2008, 402, 36–42. [Google Scholar] [CrossRef] [PubMed]
  6. Llop, S.; Murcia, M.; Aguinagalde, X.; Vioque, J.; Rebagliato, M.; Cases, A.; Iniguez, C.; Amurrio, A.; Lopez-Espinosa, M.J.; Navarrete-Munoz, E.M.; et al. Exposure to mercury among Spanish preschool children: Trend from birth to age four. Environ. Res. 2014, 132, 83–92. [Google Scholar] [CrossRef] [PubMed]
  7. Marques, R.C.; Dorea, J.G.; Bernardi, J.V.; Bastos, W.R.; Malm, O. Prenatal and postnatal mercury exposure, breastfeeding and neurodevelopment during the first 5 years. Cogn. Behav. Neurol. 2009, 22, 134–141. [Google Scholar] [CrossRef] [PubMed]
  8. Kim, B.M.; Lee, B.E.; Hong, Y.C.; Park, H.; Ha, M.; Kim, Y.J.; Kim, Y.; Chang, N.; Kim, B.N.; Oh, S.Y.; et al. Mercury levels in maternal and cord blood and attained weight through the 24 months of life. Sci. Total Environ. 2011, 410–411, 26–33. [Google Scholar] [CrossRef] [PubMed]
  9. Houston, M.C. The role of mercury and cadmium heavy metals in vascular disease, hypertension, coronary heart disease, and myocardial infarction. Altern. Ther. Health Med. 2007, 13, S128–S133. [Google Scholar] [PubMed]
  10. Ou, L.; Chen, C.; Chen, L.; Wang, H.; Yang, T.; Xie, H.; Tong, Y.; Hu, D.; Zhang, W.; Wang, X. Low-level prenatal mercury exposure in north China: An exploratory study of anthropometric effects. Environ. Sci. Technol. 2015, 49, 6899–6908. [Google Scholar] [CrossRef] [PubMed]
  11. Guo, B.Q.; Cai, S.Z.; Guo, J.L.; Xu, J.; Wu, W.; Li, H.; Zhou, X.; Kim, D.S.; Yan, C.H.; Lu, H.D. Levels of prenatal mercury exposure and their relationships to neonatal anthropometry in Wujiang City, China. Environ. Poll. 2013, 182, 184–189. [Google Scholar] [CrossRef] [PubMed]
  12. Drouillet-Pinard, P.; Huel, G.; Slama, R.; Forhan, A.; Sahuquillo, J.; Goua, V.; Thiebaugeorges, O.; Foliguet, B.; Magnin, G.; Kaminski, M.; et al. Prenatal mercury contamination: Relationship with maternal seafood consumption during pregnancy and fetal growth in the “EDEN mother-child” cohort. Br. J. Nutr. 2010, 104, 1096–1100. [Google Scholar] [CrossRef] [PubMed] [Green Version]
  13. Ramon, R.; Ballester, F.; Aguinagalde, X.; Amurrio, A.; Vioque, J.; Lacasana, M.; Rebagliato, M.; Murcia, M.; Iniguez, C. Fish consumption during pregnancy, prenatal mercury exposure, and anthropometric measures at birth in a prospective mother-infant cohort study in Spain. Am. J. Clin. Nutr. 2009, 90, 1047–1055. [Google Scholar] [CrossRef] [PubMed]
  14. Lucas, M.; Dewailly, E.; Muckle, G.; Ayotte, P.; Bruneau, S.; Gingras, S.; Rhainds, M.; Holub, B.J. Gestational age and birth weight in relation to n-3 fatty acids among Inuit (Canada). Lipids 2004, 39, 617–626. [Google Scholar] [CrossRef] [PubMed]
  15. Grandjean, P.; Budtz-Jorgensen, E.; Steuerwald, U.; Heinzow, B.; Needham, L.L.; Jorgensen, P.J.; Weihe, P. Attenuated growth of breast-fed children exposed to increased concentrations of methylmercury and polychlorinated biphenyls. FASEB J. 2003, 17, 699–701. [Google Scholar] [CrossRef] [PubMed]
  16. Marques, R.C.; Dorea, J.G.; Bernardi, J.V.; Bastos, W.R.; Malm, O. Maternal fish consumption in the nutrition transition of the Amazon Basin: Growth of exclusively breastfed infants during the first 5 years. Ann. Hum. Biol. 2008, 35, 363–377. [Google Scholar] [CrossRef] [PubMed]
  17. Marques, R.C.; Dorea, J.G.; Leao, R.S.; Dos Santos, V.G.; Bueno, L.; Marques, R.C.; Brandao, K.G.; Palermo, E.F.; Guimaraes, J.R. Role of methylmercury exposure (from fish consumption) on growth and neurodevelopment of children under 5 years of age living in a transitioning (tin-mining) area of the Western Amazon, Brazil. Arch. Environ. Contam. Toxicol. 2012, 62, 341–350. [Google Scholar] [CrossRef] [PubMed]
  18. Krebs, N.F. Dietary zinc and iron sources, physical growth and cognitive development of breastfed infants. J. Nutr. 2000, 130, 358S–360S. [Google Scholar] [PubMed]
  19. Dijkhuizen, M.A.; Winichagoon, P.; Wieringa, F.T.; Wasantwisut, E.; Utomo, B.; Ninh, N.X.; Hidayat, A.; Berger, J. Zinc supplementation improved length growth only in anemic infants in a multi-country trial of iron and zinc supplementation in South-East Asia. J. Nutr. 2008, 138, 1969–1975. [Google Scholar] [PubMed]
  20. Dorea, J.G.; Donangelo, C.M. Early (in uterus and infant) exposure to mercury and lead. Clin. Nutr. 2006, 25, 369–376. [Google Scholar] [CrossRef] [PubMed]
  21. Strain, J.J.; Davidson, P.W.; Thurston, S.W.; Harrington, D.; Mulhern, M.S.; McAfee, A.J.; van Wijngaarden, E.; Shamlaye, C.F.; Henderson, J.; Watson, G.E.; et al. Maternal pufa status but not prenatal methylmercury exposure is associated with children’s language functions at age five years in the Seychelles. J. Nutr. 2012, 142, 1943–1949. [Google Scholar] [CrossRef] [PubMed]
  22. Yom, H.W.; Seo, J.W.; Park, H.; Choi, K.H.; Chang, J.Y.; Ryoo, E.; Yang, H.R.; Kim, J.Y.; Seo, J.H.; Kim, Y.J.; et al. Current feeding practices and maternal nutritional knowledge on complementary feeding in Korea. Korean J. Pediatr. 2009, 52, 1090–1102. [Google Scholar] [CrossRef]
  23. Park, J.S.; Chang, J.Y.; Hong, J.; Ko, J.S.; Seo, J.K.; Shin, S.; Lee, E.H. Nutritional zinc status in weaning infants: Association with iron deficiency, age, and growth profile. Biol. Trace Elem. Res. 2012, 150, 91–102. [Google Scholar] [CrossRef] [PubMed]
  24. National Research Council (U.S.). Committee on the toxicological effects of methylmercury. In Toxicological Effects of Methylmercury; National Academy Press: Washington, DC, USA, 2000. [Google Scholar]
  25. Park, J.H.; Hwang, M.S.; Ko, A.; Jeong, D.H.; Kang, H.S.; Yoon, H.J.; Hong, J.H. Total mercury concentrations in the general Korean population, 2008–2011. Regul. Toxicol. Pharmacol. RTP 2014, 70, 681–686. [Google Scholar] [CrossRef] [PubMed]
  26. Lee, B.E.; Hong, Y.C.; Park, H.; Ha, M.; Koo, B.S.; Chang, N.; Roh, Y.M.; Kim, B.N.; Kim, Y.J.; Kim, B.M.; et al. Interaction between GSTM1/GSTT1 polymorphism and blood mercury on birth weight. Environ. Health Perspect. 2010, 118, 437–443. [Google Scholar] [CrossRef] [PubMed]
  27. Wilhelm, M.; Schulz, C.; Schwenk, M. Revised and new reference values for arsenic, cadmium, lead, and mercury in blood or urine of children: Basis for validation of human biomonitoring data in environmental medicine. Int. J. Hyg. Environ. Health 2006, 209, 301–305. [Google Scholar] [PubMed]
  28. Gallagher, C.M.; Smith, D.M.; Golightly, M.G.; Meliker, J.R. Total blood mercury and rubella antibody concentrations in U.S. children aged 6–11 years, NHANES 2003–2004. Sci. Total Environ. 2013, 442, 48–55. [Google Scholar] [CrossRef] [PubMed]
  29. McDowell, M.A.; Dillon, C.F.; Osterloh, J.; Bolger, P.M.; Pellizzari, E.; Fernando, R.; Schober, S.E.; Montes de Oca, R.; Sinks, T.; Jones, R.L.; et al. Hair mercury levels in U.S. Children and women of childbearing age: Reference range data from NHANES 1999–2000. Environ. Health Perspect. 2004, 112, 1165–1171. [Google Scholar] [CrossRef] [PubMed]
  30. Oddy, W.H. Infant feeding and obesity risk in the child. Breastfeed. Rev. 2012, 20, 7–12. [Google Scholar] [PubMed]
  31. Haschke, F.; van’t Hof, M.A.; the Euro-growth study group. Euro-growth references for breast-fed boys and girls: Influence of breast-feeding and solids on growth until 36 months of age. J. Pediatr. Gastroenterol. Nutr. 2000, 31 (Suppl. 1), S60–S71. [Google Scholar] [CrossRef] [PubMed]
  32. Martin, R.M. Commentary: Does breastfeeding for longer cause children to be shorter? Int. J. Epidemiol. 2001, 30, 481–484. [Google Scholar] [CrossRef] [PubMed]
  33. Nielsen, G.A.; Thomsen, B.L.; Michaelsen, K.F. Influence of breastfeeding and complementary food on growth between 5 and 10 months. Acta Paediatr. 1998, 87, 911–917. [Google Scholar] [CrossRef] [PubMed]
  34. Oddy, W.H.; Mori, T.A.; Huang, R.C.; Marsh, J.A.; Pennell, C.E.; Chivers, P.T.; Hands, B.P.; Jacoby, P.; Rzehak, P.; Koletzko, B.V.; et al. Early infant feeding and adiposity risk: From infancy to adulthood. Ann. Nutr. Metab. 2014, 64, 262–270. [Google Scholar] [CrossRef] [PubMed]
  35. Grandjean, P.; Jorgensen, P.J.; Weihe, P. Human milk as a source of methylmercury exposure in infants. Environ. Health Perspect. 1994, 102, 74–77. [Google Scholar] [CrossRef] [PubMed]
  36. Kim, E.H.; Kim, I.K.; Kwon, J.Y.; Koo, J.S.; Hwang, H.S.; Kim, S.K.; Park, Y.W.; Noh, J.H.; Lee, D.H. The effect of fish consumption on blood mercury level in pregnant women. Korean J. Obstet. Gynecol. 2005, 48, 2527–2534. [Google Scholar] [CrossRef]
  37. Carrier, G.; Bouchard, M.; Brunet, R.C.; Caza, M. A toxicokinetic model for predicting the tissue distribution and elimination of organic and inorganic mercury following exposure to methyl mercury in animals and humans. II. Application and validation of the model in humans. Toxicol. Appl. Pharmacol. 2001, 171, 50–60. [Google Scholar] [CrossRef] [PubMed]
  38. Grandjean, P.; Weihe, P.; Jorgensen, P.J.; Clarkson, T.; Cernichiari, E.; Videro, T. Impact of maternal seafood diet on fetal exposure to mercury, selenium, and lead. Arch. Environ. Health 1992, 47, 185–195. [Google Scholar] [CrossRef] [PubMed]
  39. Bjornberg, K.A.; Vahter, M.; Petersson-Grawe, K.; Glynn, A.; Cnattingius, S.; Darnerud, P.O.; Atuma, S.; Aune, M.; Becker, W.; Berglund, M. Methyl mercury and inorganic mercury in Swedish pregnant women and in cord blood: Influence of fish consumption. Environ. Health Perspect. 2003, 111, 637–641. [Google Scholar] [CrossRef] [PubMed]
  40. Seiler, H.G.; Sigel, A.; Sigel, H. Handbook on Metals in Clinical and Analytical Chemistry; M. Dekker: New York, NY, USA, 1994. [Google Scholar]
  41. Grandjean, P.; Weihe, P.; Nielsen, J.B. Methylmercury: Significance of intrauterine and postnatal exposures. Clin. Chem. 1994, 40, 1395–1400. [Google Scholar] [PubMed]
  42. Nuttall, K.L. Interpreting hair mercury levels in individual patients. Ann. Clin. Lab. Sci. 2006, 36, 248–261. [Google Scholar] [PubMed]

