Article

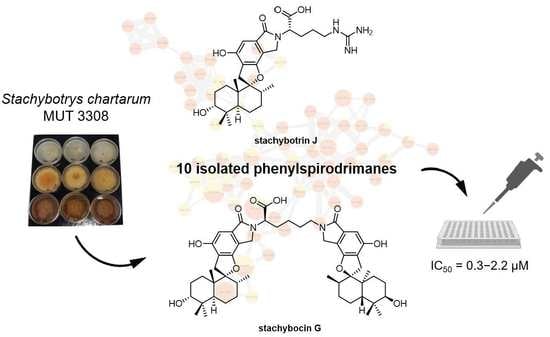
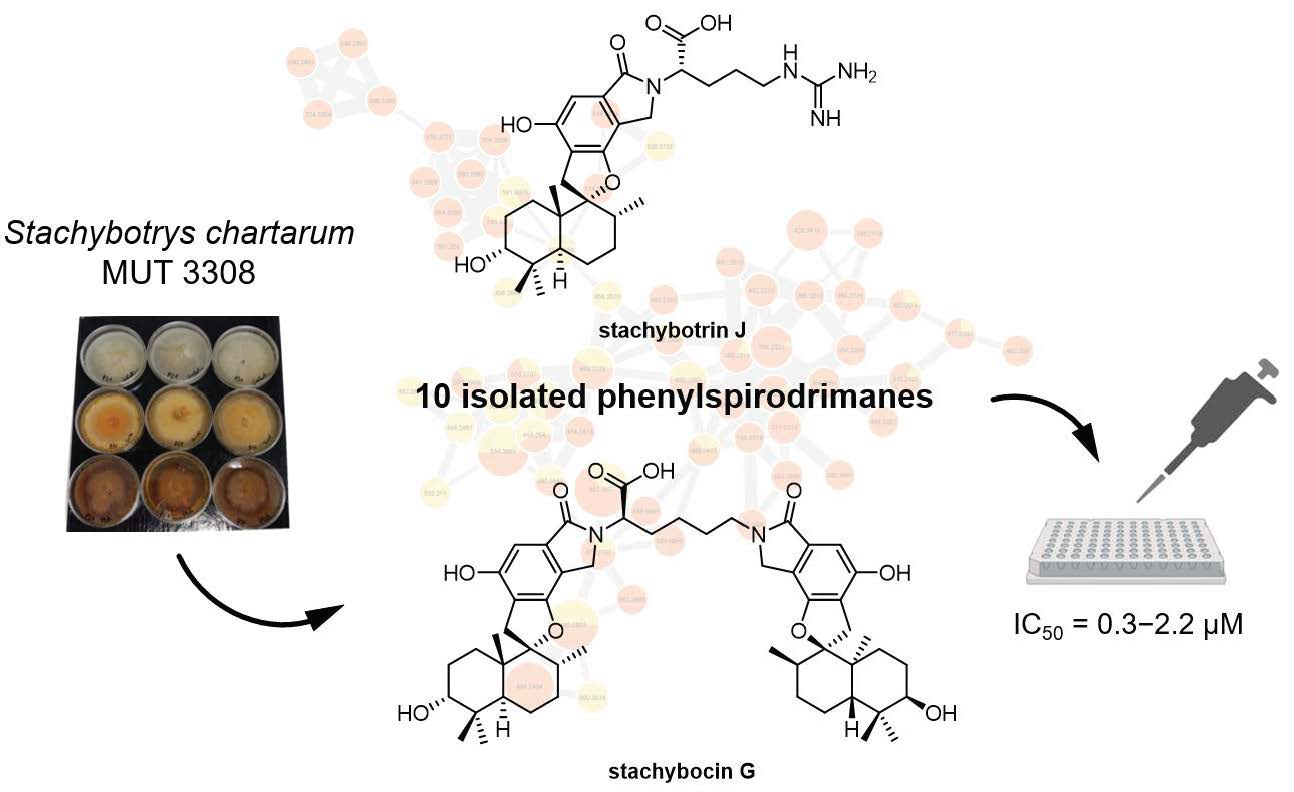
New Phenylspirodrimanes from the Sponge-Associated Fungus Stachybotrys chartarum MUT 3308

1
Marine Natural Products Team, Institut de Chimie de Nice, Université Côte d’Azur, CNRS UMR 7272, 06108 Nice, France
2
Centre Scientifique de Monaco, LIA ROPSE, Laboratoire International Associé, Université Côte d’Azur, 06108 Nice, France
3
Mycotheca Universitatis Taurinensis, Department of Life Sciences and Systems Biology, University of Turin, Viale Mattioli 25, 10125 Turin, Italy
4
UMR Institut Sophia Agrobiotech, INRAE, CNRS, UCA, 400 routes des Chappes, 06903 Sophia Antipolis, France
5
Centre Antoine Lacassagne, Institute for Research on Cancer and Aging of Nice, Université Côte d’Azur, CNRS UMR 7284, INSERM U1081, 06189 Nice, France
6
Parc d’Activités Arôma Grasse/Immeuble Grasse Biotech, 45 boulevard Marcel Pagnol, 06130 Grasse, France
7
Department of Biomedical, Centre Scientifique de Monaco, 98000 Monaco, Monaco
*
Author to whom correspondence should be addressed.
Mar. Drugs 2023, 21(3), 135; https://doi.org/10.3390/md21030135
Submission received: 29 January 2023 / Revised: 14 February 2023 / Accepted: 17 February 2023 / Published: 21 February 2023

Abstract

:
Two phenylspirodrimanes, never isolated before, stachybotrin J (1) and new stachybocin G (epi-stachybocin A) (2), along with the already reported stachybotrin I (3), stachybotrin H (4), stachybotrylactam (5), stachybotrylactam acetate (6), 2α-acetoxystachybotrylactam acetate (7), stachybotramide (8), chartarlactam B (9), and F1839-J (10) were isolated from the sponge-associated fungus Stachybotrys chartarum MUT 3308. Their structures were established based on extensive spectrometric (HRMS) and spectroscopic (1D and 2D NMR) analyses. Absolute configurations of the stereogenic centers of stachybotrin J (1), stachybocin G (2), and stachybotrin I (3), were determined by comparison of their experimental circular dichroism (CD) spectra with their time-dependent density functional theory (TD-DFT) circular dichroism (ECD) spectra. The putative structures of seventeen additional phenylspirodrimanes were proposed by analysis of their respective MS/MS spectra through a Feature-Based Molecular Networking approach. All the isolated compounds were evaluated for their cytotoxicity against five aggressive cancer cell lines (MP41, 786, 786R, CAL33, and CAL33RR), notably including two resistant human cancer cell lines (786R, CAL33RR), and compounds 5, 6, and 7 exhibited cytotoxicity with IC50 values in the range of 0.3−2.2 µM.

Graphical Abstract

1. Introduction

Fungi belonging to the genus Stachybotrys produce a broad range of mycotoxins classified into three structural groups: macrocyclic trichothecenes (MT), atranones, and phenylspirodrimanes (PSDs) [1,2]. Monomeric and dimeric PSDs represent the largest group with over 80 meroterpenoids featuring an unusual PSD skeleton bearing various structural modifications. PSDs can be further divided into three main classes: tetracyclic aromatic sesquiterpenoids with alcohol and/or aldehyde functionalities, such as stachybotrydial [3,4], pentacyclic aromatic sesquiterpenoids, such as stachybotrylactam [5,6] and stachybotrylactone [7,8,9,10,11], and stachyflin and its derivatives which present a pentacyclic moiety with a cis-fused decalin [12,13]. Monomeric PSDs have been reported to exhibit a wide range of pharmacological activities such as antiosteoporosis properties [14], the ability to inhibit immune-complex disease [7,15], tyrosine kinase receptors [5], and antihyperlipidemic effects [16]. On the other side, dimers showed different biological activities compared to monomeric PSDs, such as antibacterial activities, potential ET receptor antagonists, and neuroprotective, anti-inflammatory, and antitumor activities [17,18,19,20]. In the literature, most PSDs were reported to exhibit weak (IC50 18.4–24.7 μM) or no cytotoxicity [21,22]. To the best of our knowledge, PSDs have never been evaluated for their cytotoxicity against resistant cancer lines.
Drug resistance is currently a major problem in several cancers such as UM (uveal melanoma), RCC (renal cell carcinoma), and HNSCC (head and neck squamous cell carcinoma). Although the 1980s was the decade of general radio-chemotherapy with the use of very toxic antitumor drugs and radiation procedures that resulted in numerous side effects, the 2000s was the decade of targeted therapies due to the development of treatments that specifically target driving mutations [23,24,25]. Despite the improvements, many of the patients were not cured and suffered relapses. During the 2010s, the strategies focused on damaging the microenvironment, particularly blood vessels, in colon, breast, lung, and kidney cancers [26]. However, the effect of anti-angiogenic drugs was short-lived, and relapses were inevitable. The 2020s is definitely the decade of immunotherapies improving patient survival, but only in 20% of patients with various cancers such as UM, RCC, and HNSCC [27,28,29,30]. Therefore, to further improve current treatments, the introduction of new therapies is urgently needed. These breakthrough treatments can improve the quality of life or survival of many patients. The discovery of these new drugs from natural products is one of the most important tasks in medicinal chemistry.
In this context, we were interested by PSDs produced by the fungus Stachybotrys chartarum MUT 3308, previously isolated from the Mediterranean sponge Aplysina cavernicola [31] and cultivated in solid and liquid media. Herein, we report the isolation of two PSDs, never isolated before, stachybotrin J (1) and new stachybocin G (epi-stachybocin A) (2), along with the already reported stachybotrin I (3), stachybotrin H (4), stachybotrylactam (5), stachybotrylactam acetate (6), 2α-acetoxystachybotrylactam acetate (7), stachybotramide (8), chartarlactam B (9), and F1839-J (10) (Figure 1). Moreover, structural hypotheses for seventeen additional PSD analogs have also been proposed using a Feature-Based Molecular Networking (FBMN) approach. All the isolated compounds were evaluated for their cytotoxic activities against several aggressive human cancer cell lines, notably including two resistant human cancer cell lines.

2. Results and Discussion

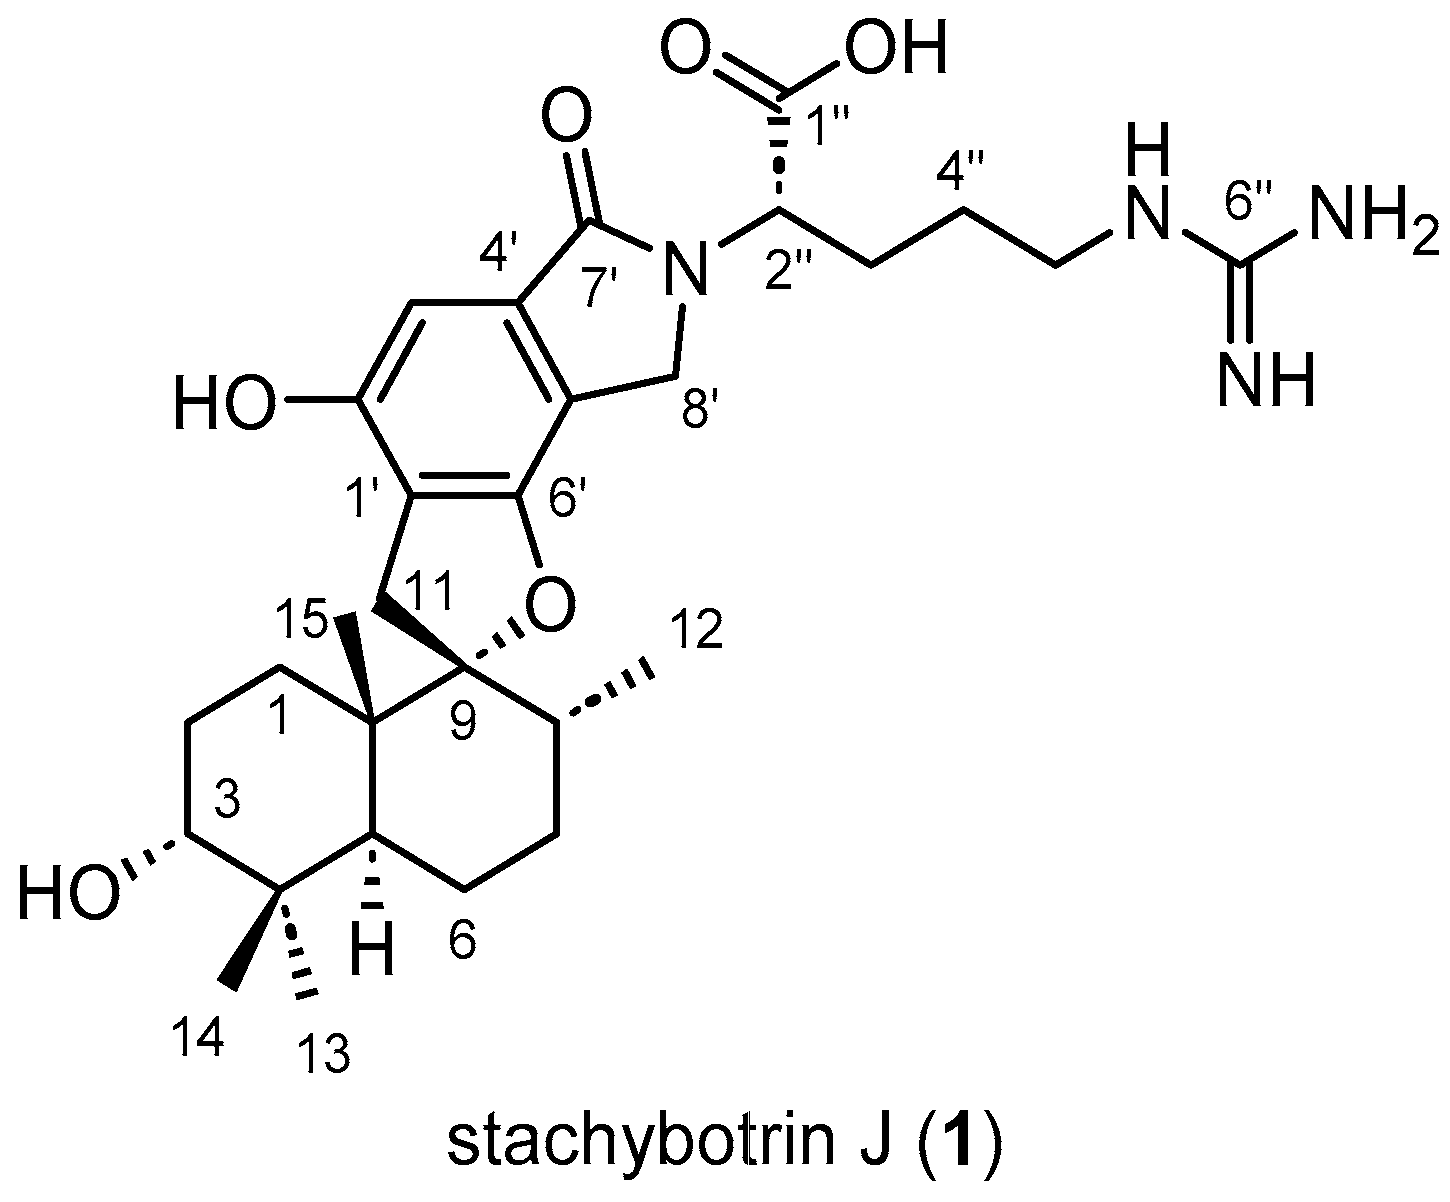
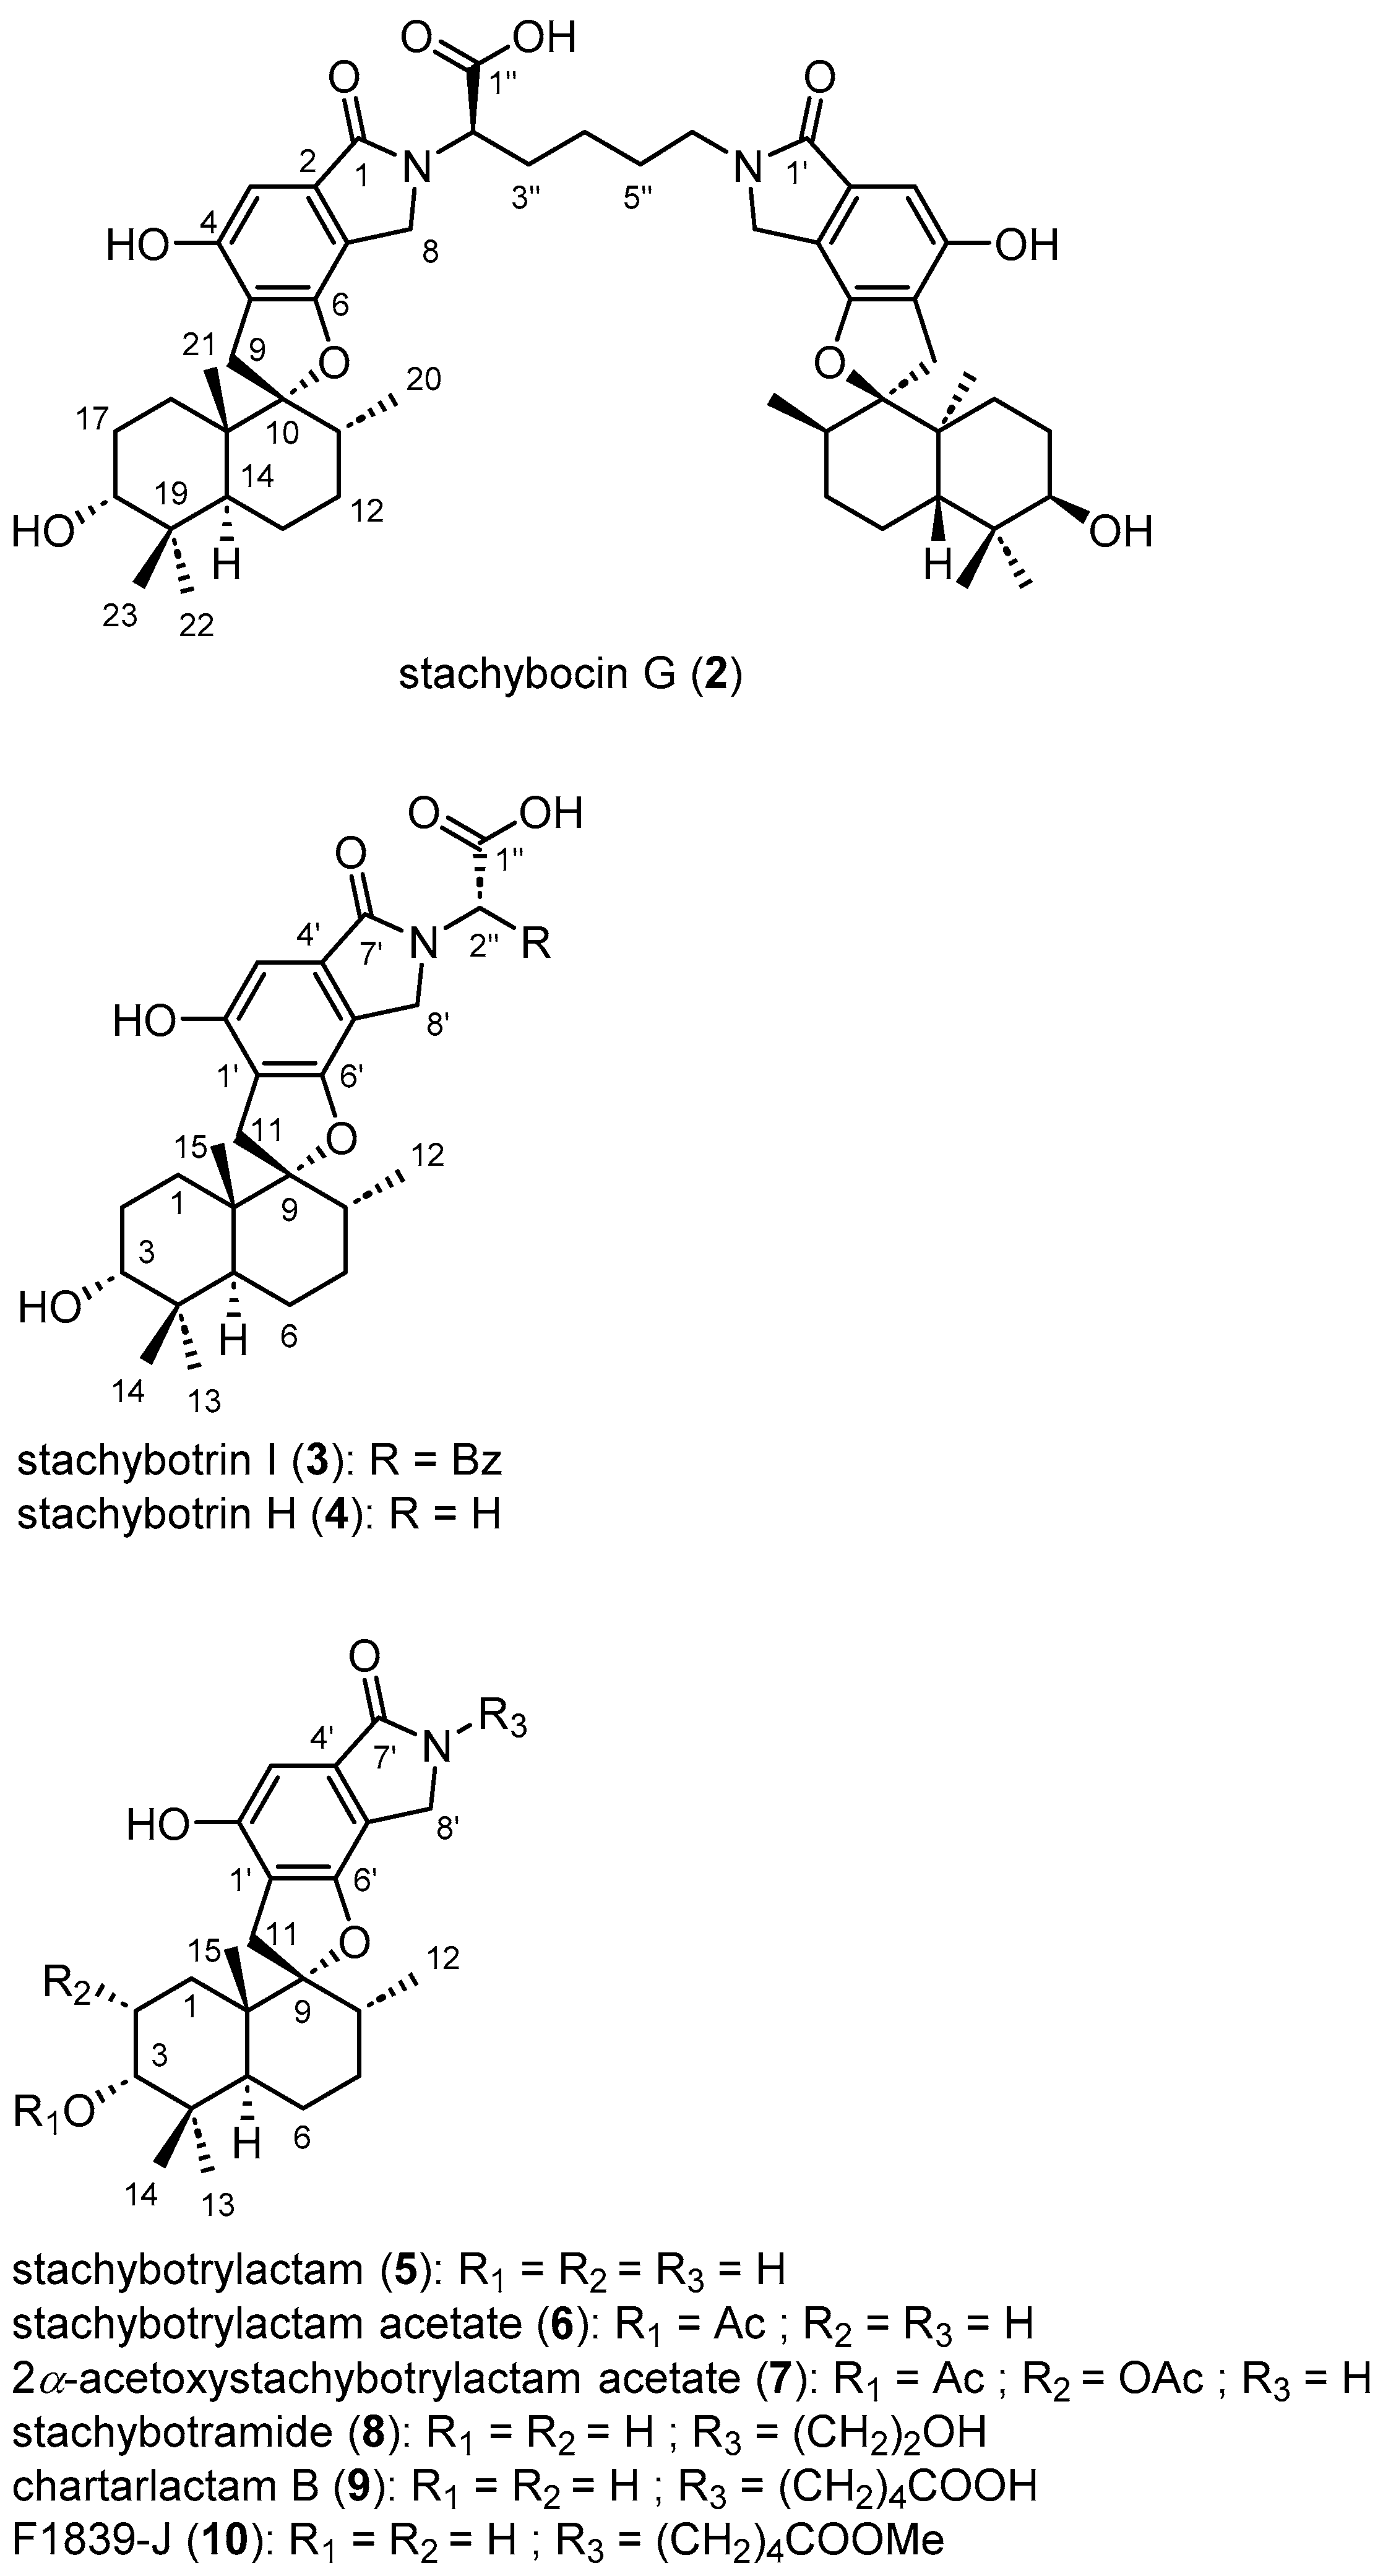
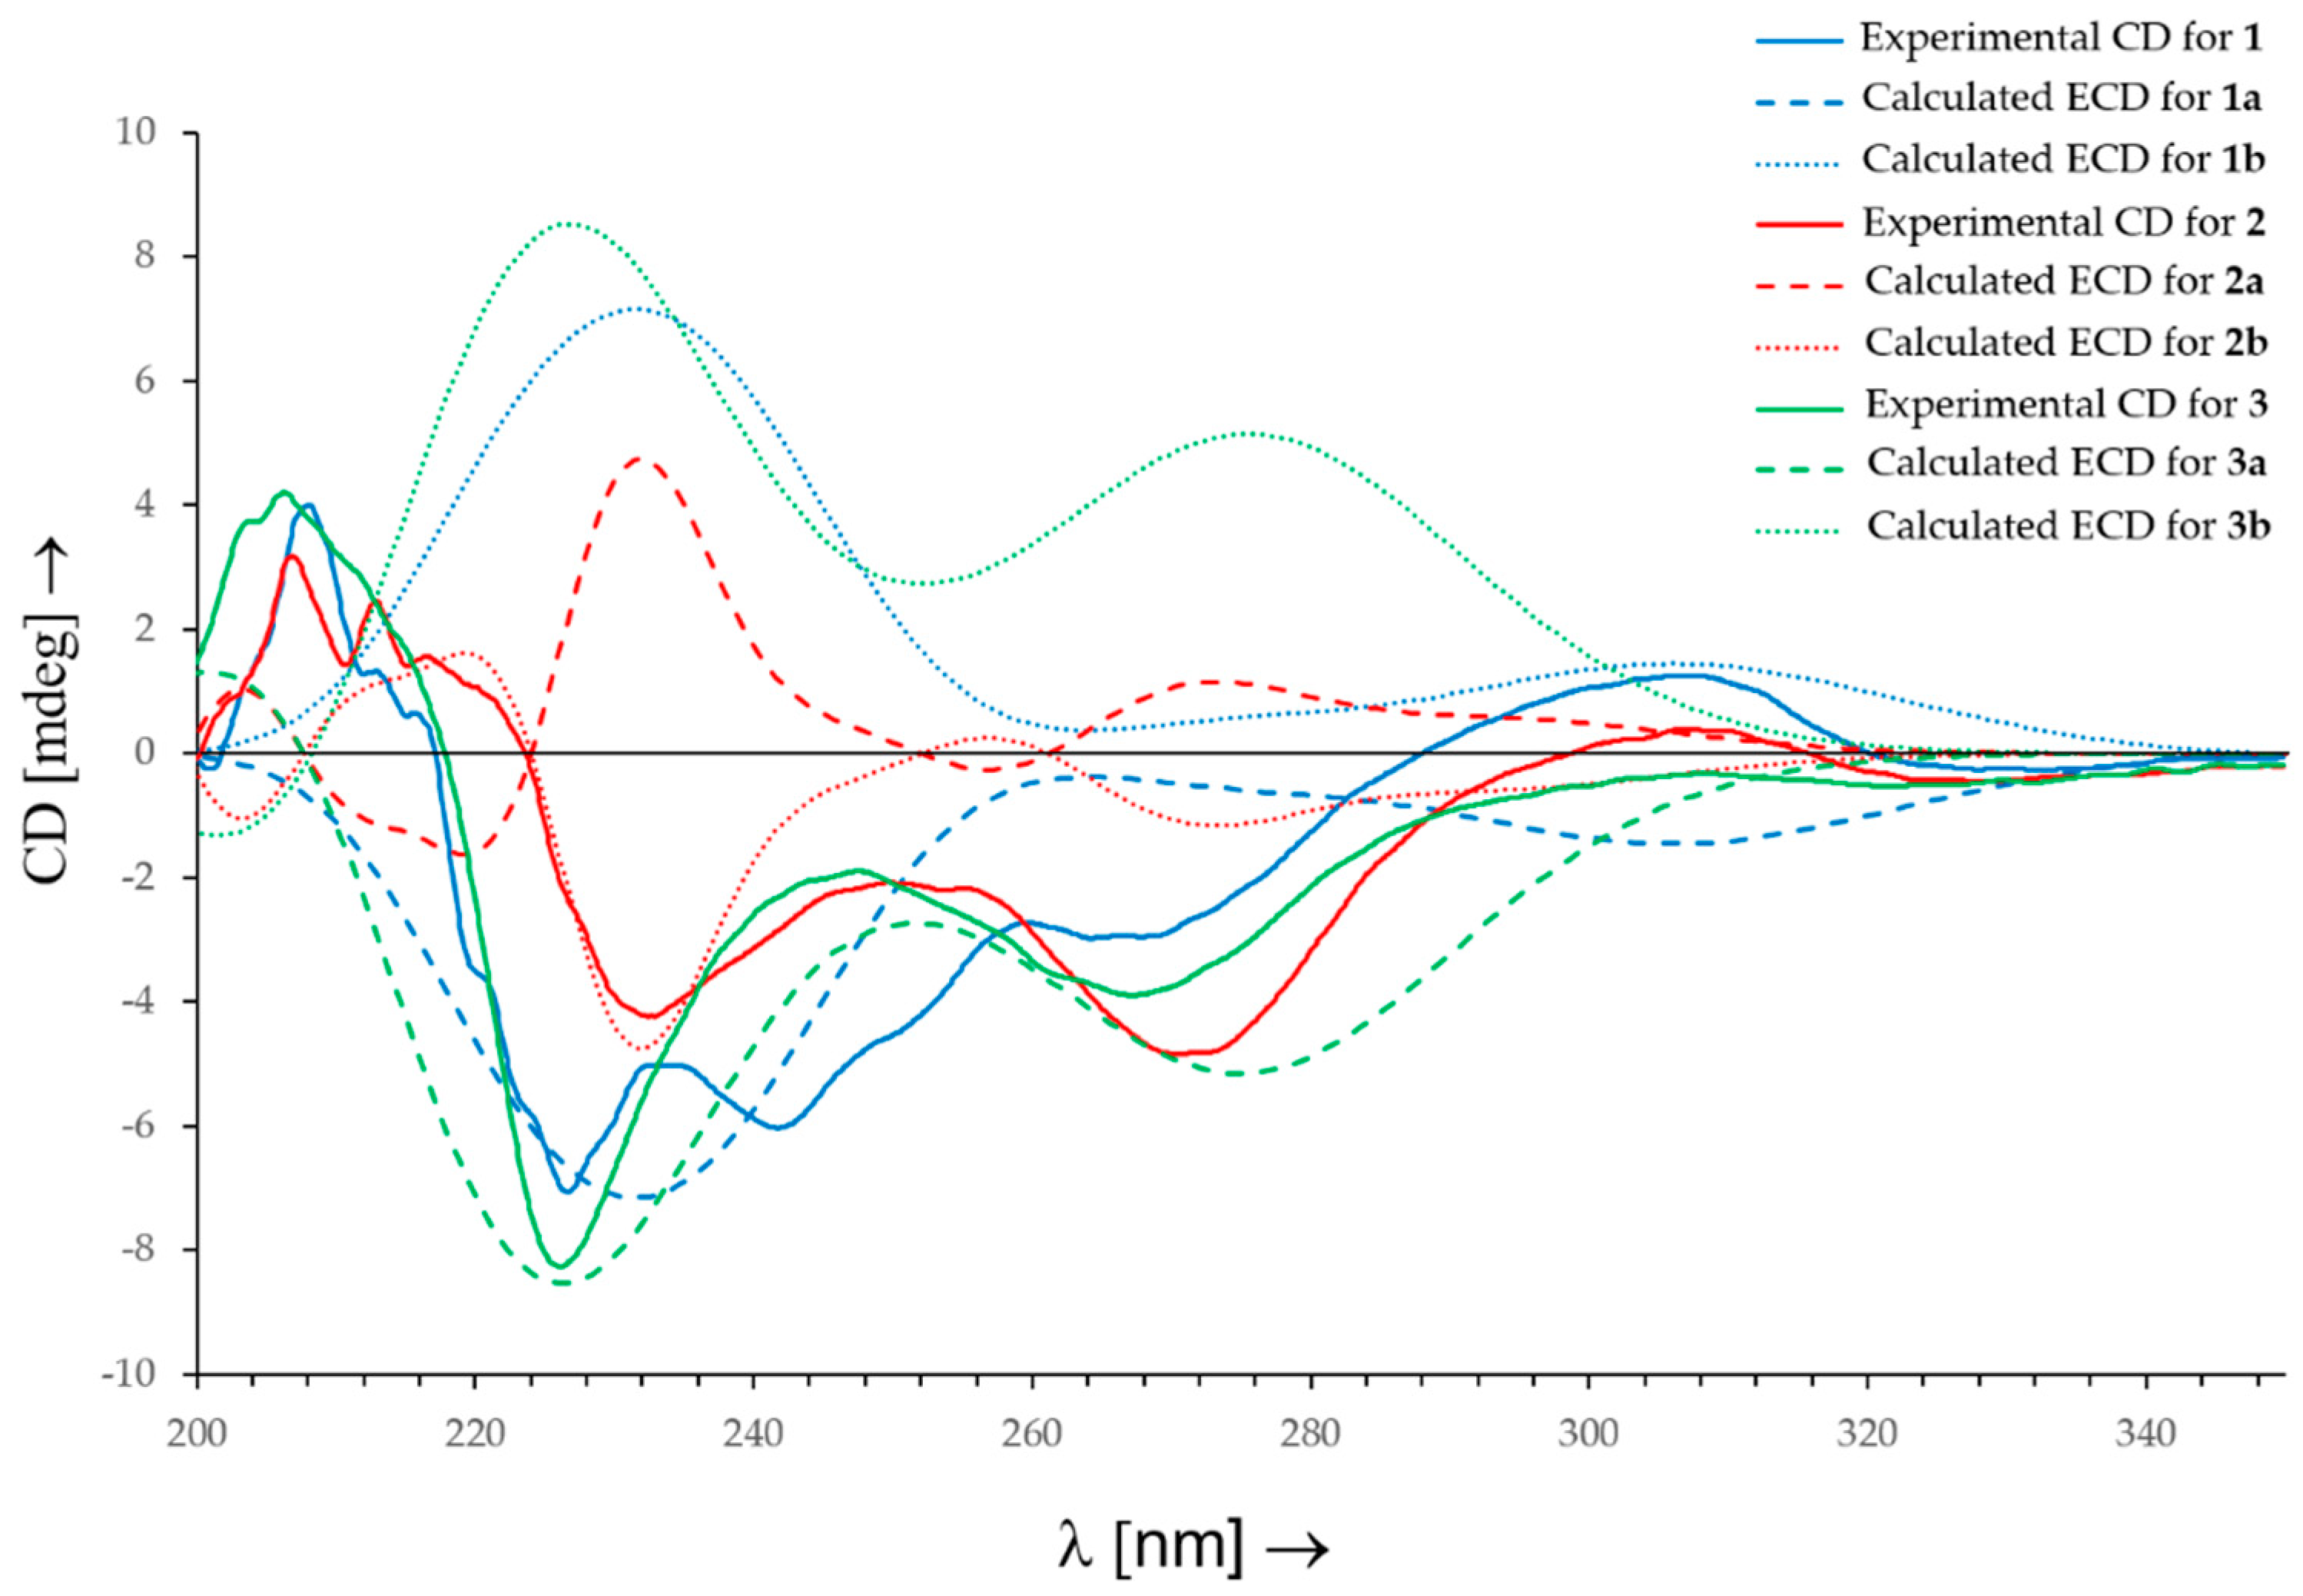
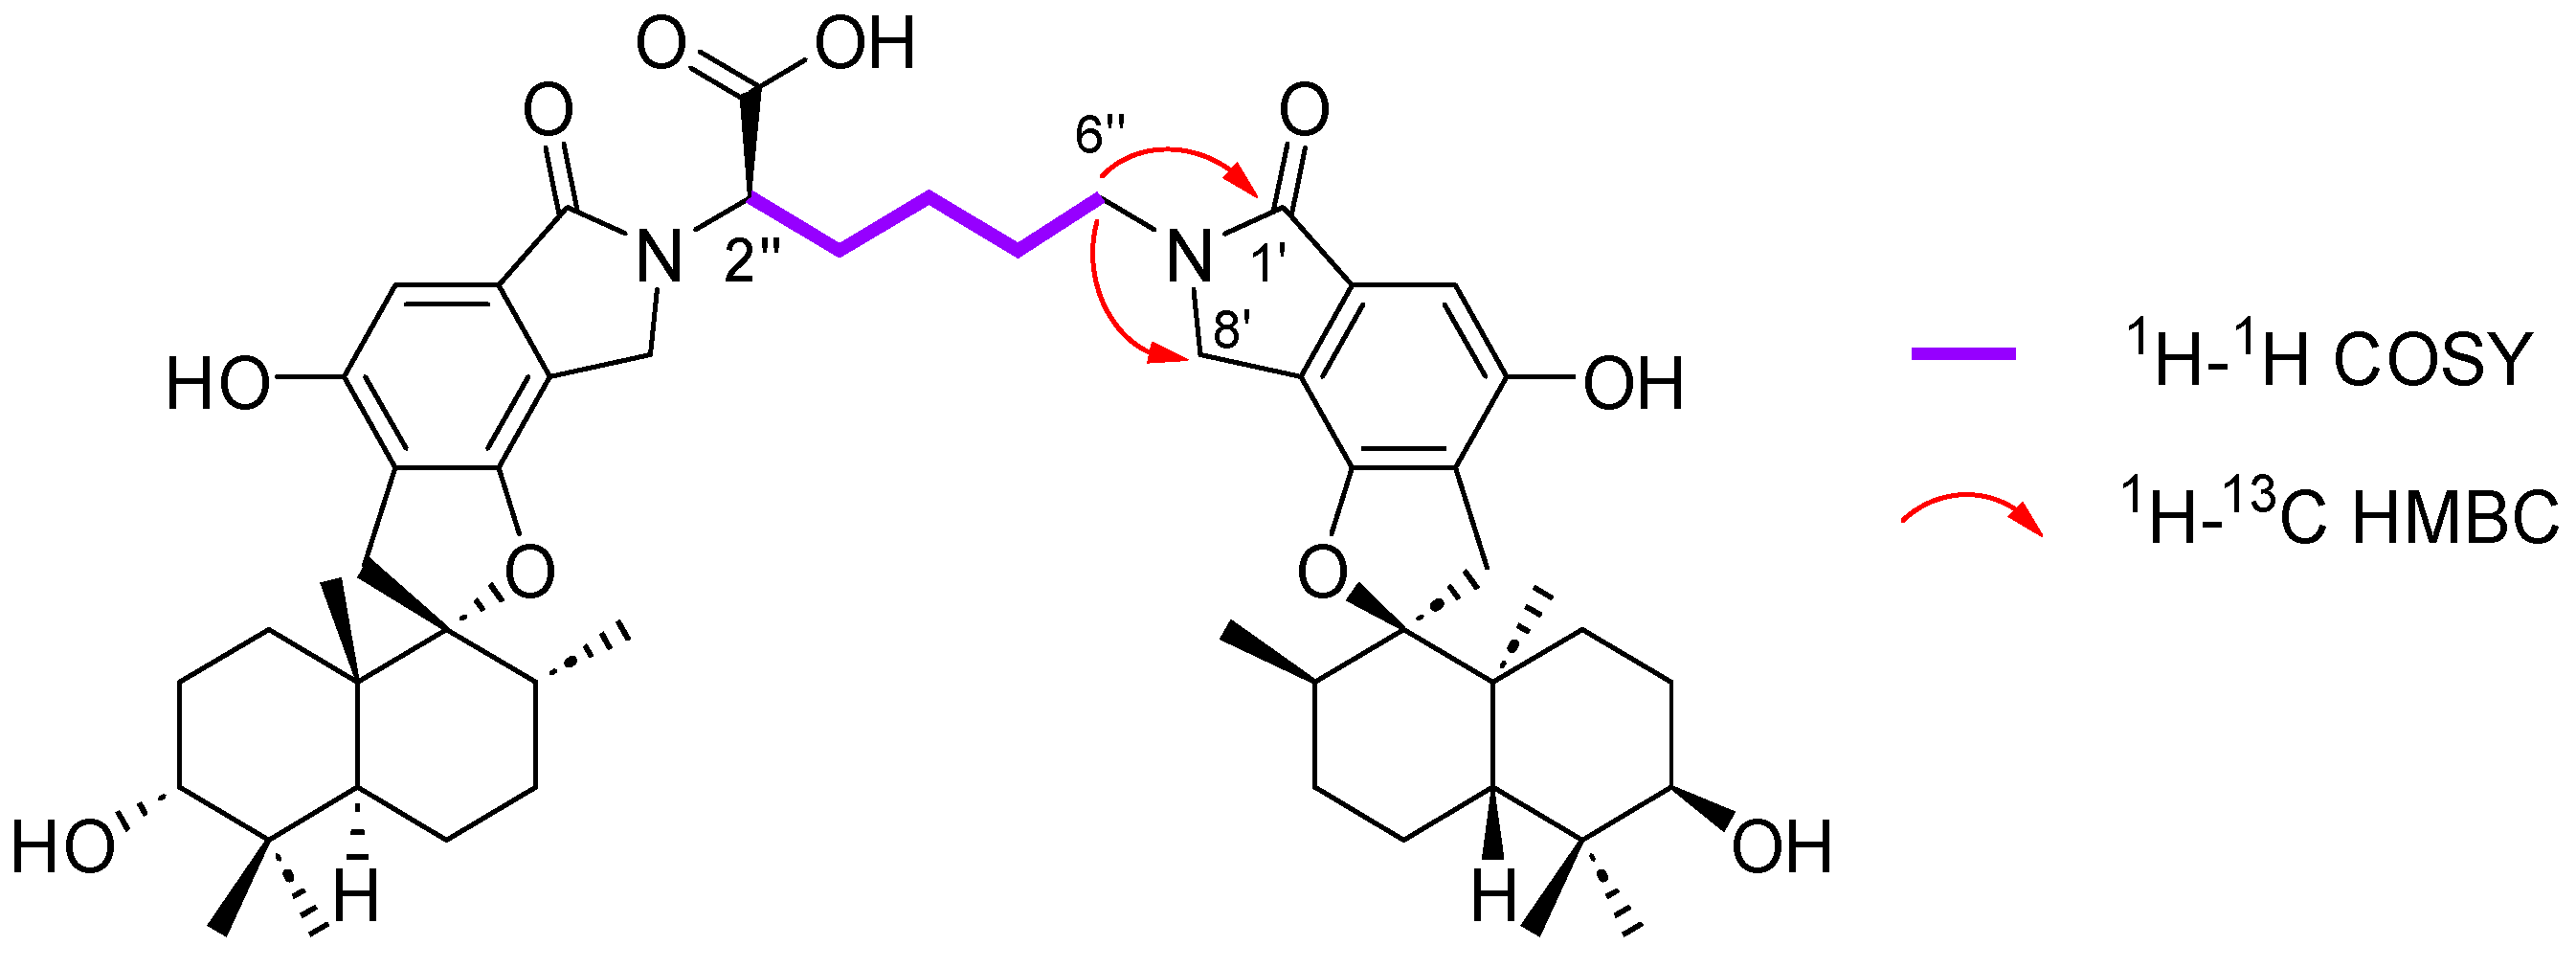
2.1. Structure Elucidation

Stachybotrys chartarum MUT 3308 was cultivated, in solid and liquid conditions, using PDA as a medium. For each culture condition, all the fungal material and the medium were extracted with an appropriate mixture of solvents and fractionated by reverse-phase or normal-phase chromatography. The most interesting fractions, based on the HPLC-PDA-ELSD and UHPLC-HRMS/MS metabolic profiles, were purified by RP HPLC to yield, in total, pure compounds 1 (2.1 mg), 2 (3.5 mg), 3 (3.1 mg), 4 (1.2 mg), 5 (9.4 mg), 6 (2.4 mg), 7 (2.3 mg), 8 (0.6 mg), 9 (2.1 mg), and 10 (1.3 mg), as white amorphous solids.
The molecular formula of compound 1, C29H42N4O6, was deduced from the HRESI(+)MS analysis which showed a pseudo-molecular ion peak at m/z 543.3171 [M + H]+ (543.3177 calc. C29H43N4O6+, 11 degrees of unsaturation). Compound 1 showed 1H and 13C NMR chemical shifts very close to those of stachybotrylactam (5) [ X ¯ (|ΔδH(5-1)|) = 0.03 ppm and s = ΔδH(5-1) = 0.07 ppm, X ¯ (|ΔδC(5-1)|) = 0.3 ppm and s = ΔδC(5-1) = 0.8 ppm] which allowed us to deduce that their PSD moieties share the same absolute configuration: 3R, 5S, 8R, 9R, and 10S. The 1H and 13C NMR spectra of 1 also featured one methine [δH 4,76 (m, 1H, H-2″)], three methylenes [δH 3.24 (m, 2H, H-5″), 2.15 (m, 1H, H-3a″), 1.91 (m, 1H, H-3b″), 1.56 (m, 2H, H-4″), and δC 57.6 (C-2″), 41.9 (C-5″), 28.8 (C-3″), 27.2 (C-4″)], a guanidinium carbon [δC 158.6 (C-6″)], and a carboxylic acid carbon (δC 170.3, C-1″), characteristic of an arginine residue connected to the nitrogen, which was further confirmed by key H-2″/H-3″, H-3″/ H-4″, and H-4″/H-5″ COSY correlations but also key H-2″/C-7′, H-2″/C-8′, H-2″/C-1″, H-2″/C-3″, H-3″/C-4″, H-5″/C-4″, and H-5″/C-6″ HMBC correlations (Table 1, Figure 2, Table S1).
All this data allowed us to identify compound 1 as a PSD derivative never isolated before, named stachybotrin J (1). Although this compound was semi-synthesized by Steinert et al. in 2022, the absolute configuration of the stereogenic center of the arginine residue was not determined [32].
The experimental CD spectrum of 1 exhibited two negative Cotton effects (CEs) at λmax = 227 nm and λmax = 270 nm. The Boltzmann-averaged TD-DFT calculated ECD spectrum for the most stable conformers of the enantiomer 1a (2″S, 3R, 5S, 8R, 9R, 10S), performed at the B3LYP/6-311+G(d,p) level of theory, also showed two negative CEs, at λmax = 230 nm and λmax = 308 nm, which reproduced the signs and differences in amplitude of the experimental CEs. Thus, a 2″S-configuration was determined for 1 (Figure 3, Tables S11–S14, Figure S67).
The molecular formula of compound 2, C52H70N2O10, was deduced from the HRESI(+)MS analysis which showed a pseudo-molecular ion peak at m/z 883.5052 [M + H]+ (calcd for C52H71N2O10+, 883.5103, 19 degrees of unsaturation). The 13C NMR spectrum of compound 2 exhibited 23 pairs of almost identical carbon signals characteristic of two spirohydrobenzofuranlactam units. The dimer structure and lysine residue as the connecting unit was confirmed by the proton spin network H-2″–H-3″–H-4″–H-5″–H-6″ revealed by COSY correlations, and H-6″/C-1′ and H-6″/C-8′ key HMBC correlations (Figure 4 and Figure S14).
Comparison of HRMS and NMR data of 2 with previously published data [33], led to its identification as the planar structure of stachybocin A (33) (Table S2). The PSD moieties of 2 showed very close chemical shifts by 1H and 13C NMR spectroscopy to those of stachybotrylactam (5) [ X ¯ (|ΔδH(5-2)|) = 0.02 ppm and s = ΔδH(5-2) = 0.06 ppm, X ¯ (|ΔδC(5-2)|) = 0.4 ppm and s = ΔδC(5-2) = 1.2 ppm], which allowed us to deduce the following absolute configuration for the spirohydrobenzofuranlactam skeletons: 10R, 10′R, 14S, 14′S, 15S, 15′S, 18R, and 18′R. A 2″S-configuration was determined previously for stachybocin A (33) based on a Jones oxidation to yield the phthalimide derivative, followed by a hydrochloric acid hydrolysis to release the amino acid and an HPLC analysis [33]; however, the reported acidic conditions could lead to total or partial racemization of lysine [34]. In this study, a 2″R-configuration of compound 2 was deduced by comparison of the experimental CD spectrum (negative CEs at λmax = 232 nm and λmax = 271 nm) with the Boltzmann-averaged TD-DFT calculated ECD spectrum for the most stable conformers of the enantiomer 2: 2a (2″S, 10R, 10′R, 13R, 13′R, 14S, 14′S, 15S, 15′S, 18R, 18′R), which exhibited positive CEs, at λmax = 231 nm and λmax = 273 nm, and 2b (2″R, 10R, 10′R, 13R, 13′R, 14S, 14′S, 15S, 15′S, 18R, 18′R), which presents negative CEs at λmax = 231 nm and λmax = 273 nm (Figure 3, Tables S15′S18, Figure S67). Therefore, compound 2 is the C-2″ epimer of stachybocin A (33) named stachybocin G (2), a new PSD dimer derivative.
The molecular formula of compound 3, C32H39NO6, was deduced from the HRESI(+)MS analysis which showed a pseudo-molecular ion peak at m/z 534.2839 [M + H]+ (calcd for C32H40NO6+, 534.2850, 14 degrees of unsaturation). Compound 3 showed very close 1H and 13C NMR chemical shifts for its PSD moiety, which were also very close to those of stachybotrylactam (5) [ X ¯ (|ΔδH(5-3)|) = 0.04 ppm and s = ΔδH(5-3) = 0.07 ppm], which allowed us to infer the following absolute configuration for 3: 3R, 5S, 8R, 9R, and 10S. The 1H and 13C NMR spectra of 3 featured one methine [δH 5.13 (m, 1H, H-2″)], one methylene [δH 3.54 (m, 1H, H-3a″), 3.21 (m, 1H, H-3b″) and δC 38.0 (C-3″)], one aromatic ring [δH 7.26 (d, 3J = 7.3 Hz, 2H, H-5″), 7.19 (t, 3J = 7.3 Hz, 2H, H-6″), 7.10 (t, 3J = 7.3 Hz, 1H, H-7″) and δC 140.2 (C-4″), 129.6 (C-5″), 129.4 (C-6″), 127.3 (C-7″), 59.7 (C-2″)], and a carboxylic acid carbon (δC 170.3, C-1″), characteristic of the phenylalanine residue of stachybotrin I (3) (Table S3) [35]. Stachybotrin I (3) (or an isomer) was previously isolated from the culture of a S. atra ST002348 [35]; however, (i) multiplicities of the protons in the 1H NMR spectrum were not reported, (ii) 13C chemical shifts were deduced from the HMQC spectrum, and consequently the 13C chemical shifts were not determined for quaternary carbons, and (iii) the relative/absolute configurations were not established. The CD spectrum of 3 exhibits two negative Cotton effects at 226 nm and 268 nm. Comparison with the calculated ECD spectra for the most stable conformers of the two possible enantiomers of 3 [3a (2″S 3R, 5S, 8R, 9R, 10S) and 3b (2″R, 3R, 5S, 8R, 9R, 10S)] allowed us to deduce a 2″S-configuration for compound 3 (Figure 3, Tables S19–S22, Figure S67).
An extensive examination of the HRMS and NMR data of 410 and comparison with previously published data [6,16,17,18,21,36,37] (Tables S4–S10), notably those relating to metabolites isolated from the genus Stachybotrys, led to their identification as stachybotrin H (4), stachybotrylactam (5), stachybotrylactam acetate (6), 2α-acetoxystachybotrylactam acetate (7), stachybotramide (8), chartarlactam B (9), and F1839-J (10), respectively.
PSD dimers were scarcely reported in the literature and their origin, natural or artifacts, is still a matter of debate. Recently, Jagels and his group [38] completed the Jarvis hypothesis [36] according to which stachybotrylactam (5) and its N-functionalized derivatives from S. chartarum could be artifacts by showing that isoindolinones production is favored in N-rich media. Several plausible biogenetic pathways for PSDs have been proposed. Structurally, PSDs are mainly polyketide–terpenoid hybrid meroterpenoids [39,40]. Compounds 110 could be derived from a common intermediate, ilicicolin B (14), which originates from farnesyldiphosphate (11) and orsellinic acid (12) (Figure 5). Afterwards, ilicicolin B (14) would undergo a series of reactions, notably oxidations and cyclizations, to yield stachybotrydial (16) [41]. Stachybotrydial (16) could react with a wide range of nucleophiles readily available in the medium, notably amines, for which the complete mechanism is still not fully elucidated [38,42], to give all isoindolinones. For example, ammonia, obtained by the enzymatic conversion of the nitrate present in the medium, would react with stachybotrydial (16) to give stachybotrylactam (5) [38,43]. In an identical way, amino acids, such as glycine, L-phenylalanine, and L-arginine, would react with stachybotrydial (16) to yield stachybotrin H (4), stachybotrin I (3), and stachybotrin J (1), respectively. Very recently, some PSD derivatives, such as stachybotrin J (1), have been obtained by semi-synthesis from stachybotrydial (16) and amino acids to support this hypothesis [32]. However, the absolute configurations of these compounds have not been reported. Thus, stachybocin G (2) could be obtained by reaction of D-lysine with two stachybotrydial (16) units or by C-2″ epimerization of stachybocin A (33) (Figure 5).

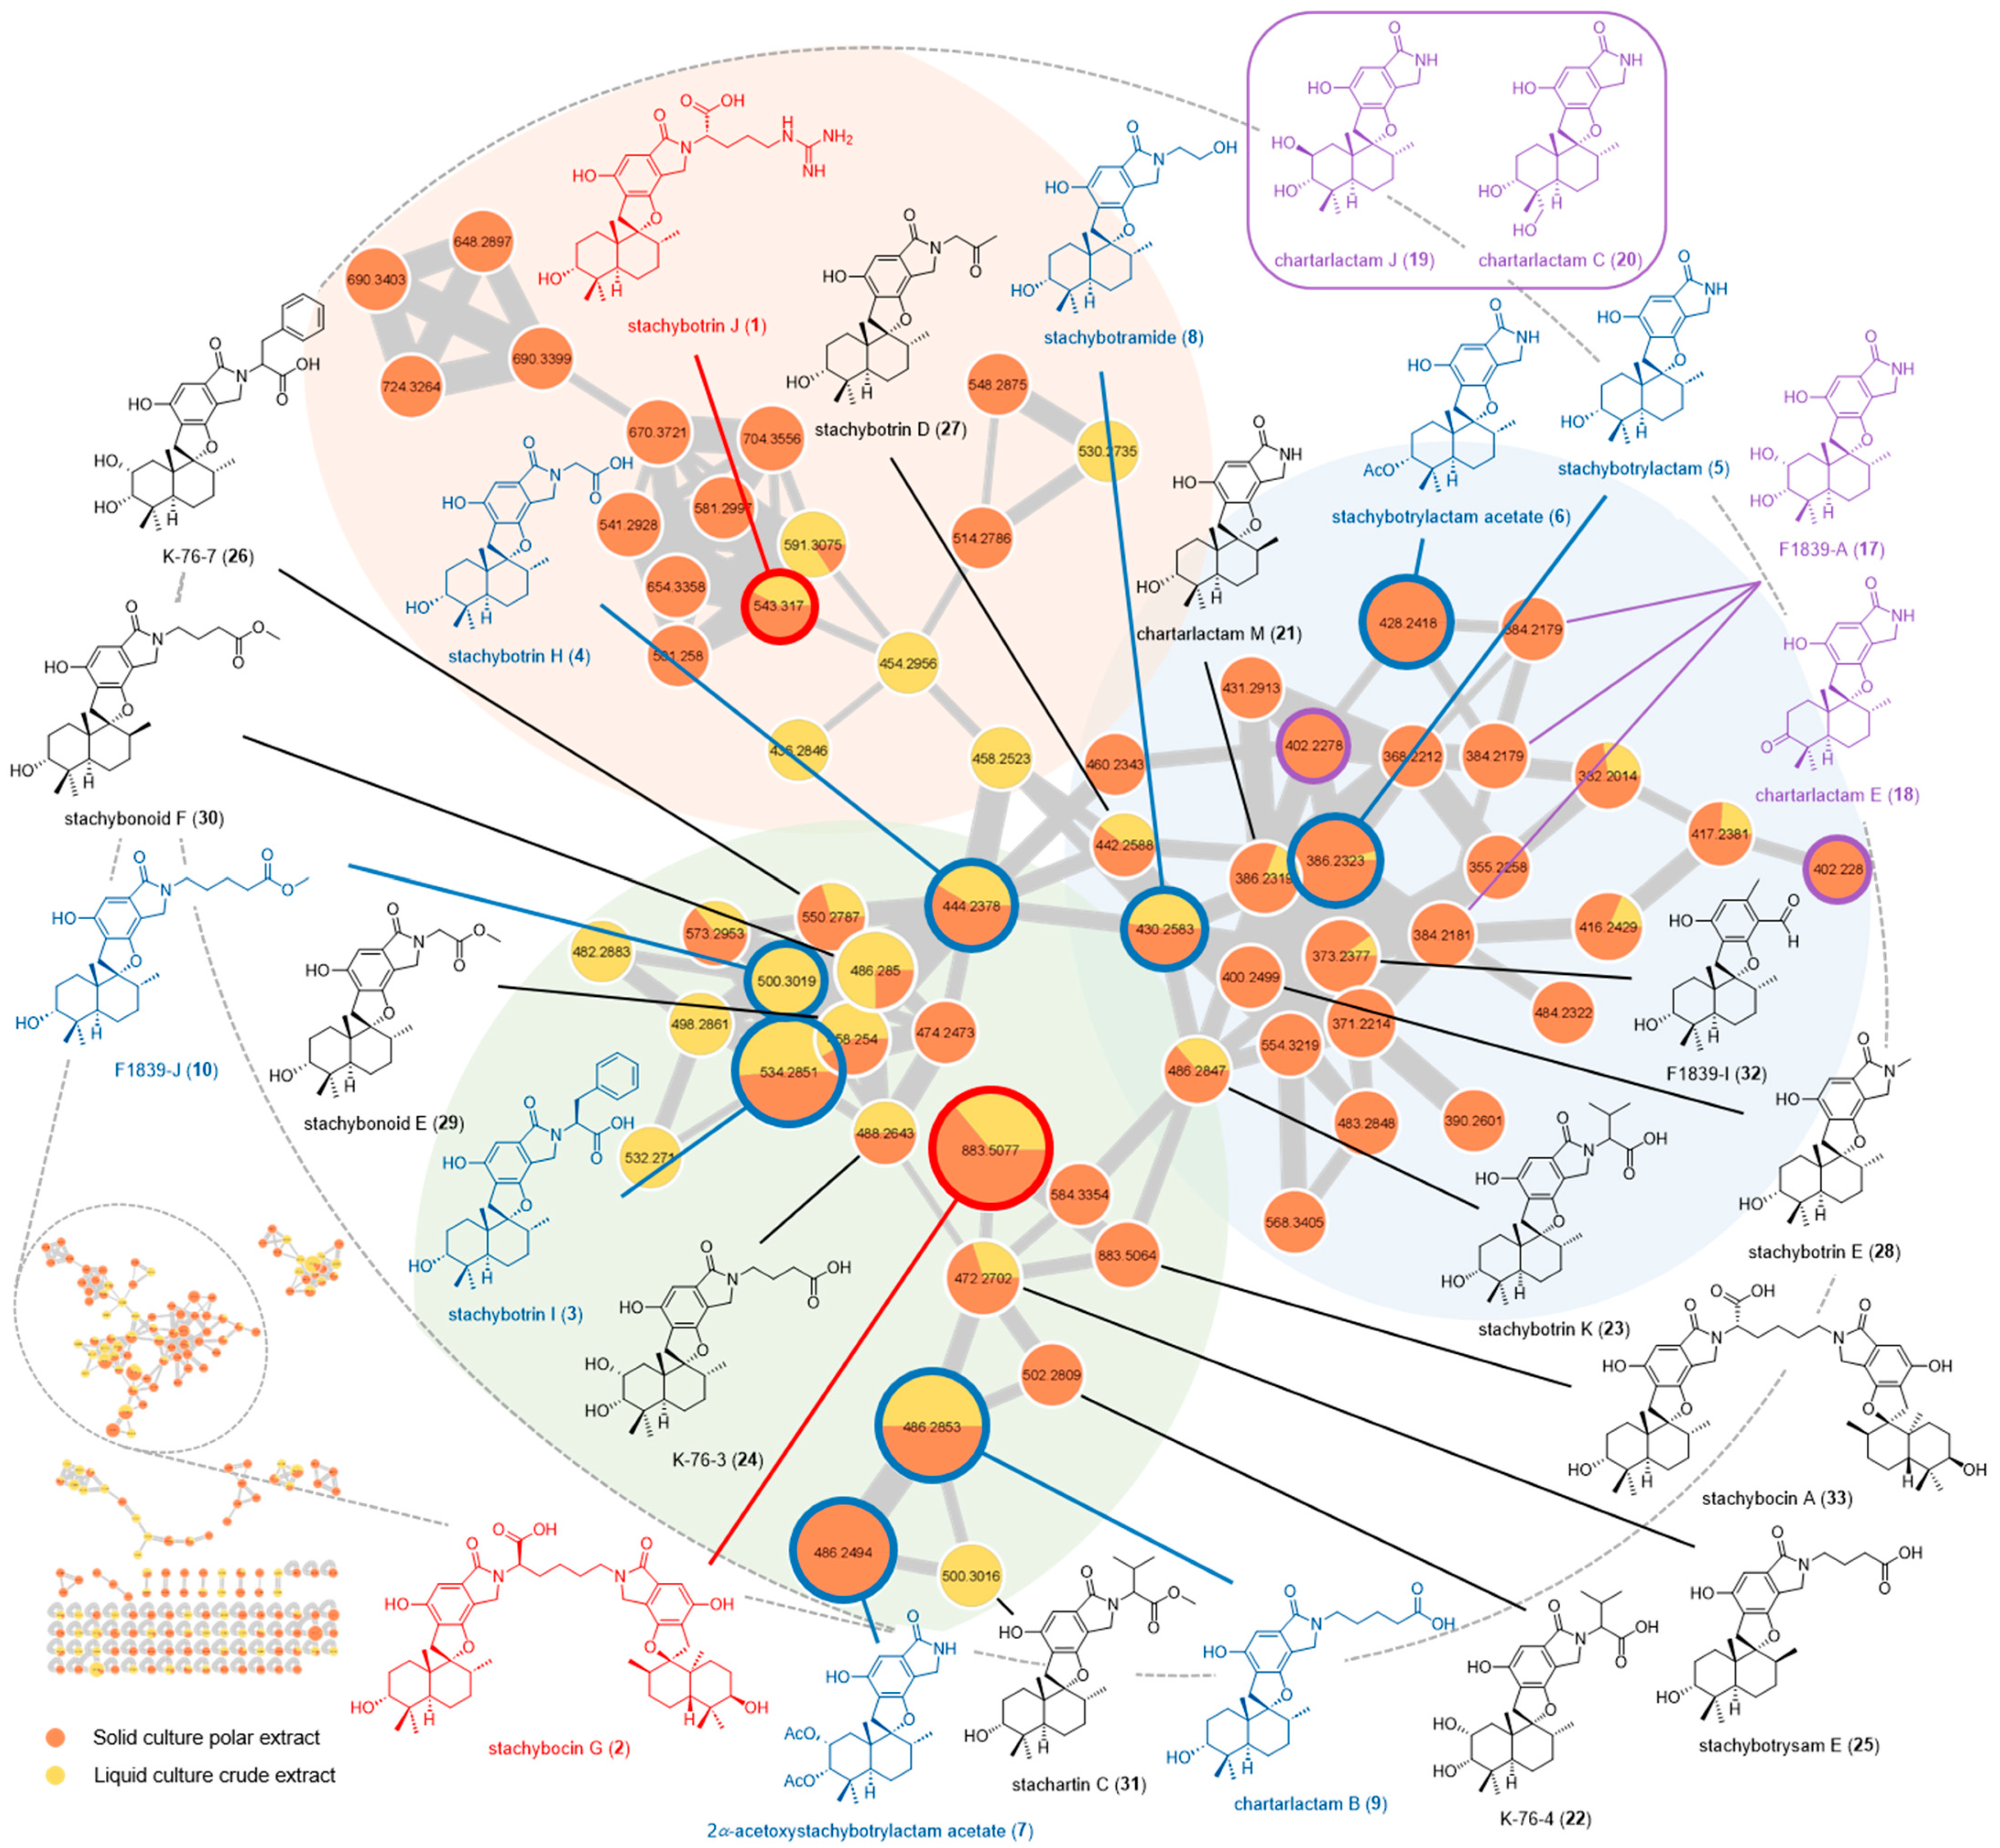
2.2. Feature-Based Molecular Networking Analysis

Mass spectrometry Feature-Based Molecular Networking (FBMN) analyses were performed to putatively assign further PSD derivatives that could be produced by S. chartarum MUT 3308 when cultivated in solid (F2: CH3OH/CH2Cl2 (1:1, v/v) crude extract) and liquid (AcOEt crude extract) conditions [44]. For this purpose, each fungal crude organic extract was (i) analyzed by UHPLC-HRESIMS(/MS), (ii) preprocessed using MZmine 2 [45], and (iii) analyzed by the FBMN approach to also distinguish possible isomers in the network based on their retention time [44]. The graphical representation of the molecular network (depicting the chemical space present in the MS/MS data) of S. chartarum MUT 3308 allowed us to highlight 196 nodes, of which 131 are linked together, which suggests the production of numerous metabolites. The main cluster, dedicated to compounds 110 and their derivatives, is constituted by 64 nodes, of which 21 nodes (33%) were common to both cultivation conditions, 34 nodes (53%) that were only observed for the solid cultivation condition, and 9 nodes (14%) that were specific to the liquid cultivation condition (Figure 6). The FBMN approach allowed us to assign the isolated compounds 110 and to annotate seventeen more PSD derivatives. In total, in this cluster, 28 nodes (44%) have been identified (Figure 6, Table S23).
The green subcluster is constituted by 21 nodes, 6 of which were assigned as 2α-acetoxystachybotrylactam acetate (7) (m/z 486.2494, [M + H]+; RT = 20.69 min), chartarlactam B (9) (m/z 486.2853, [M + H]+; RT = 20.76 min), F1839-J (10) (m/z 500.3019, [M + H]+; RT = 23.74 min), stachybotrin H (4) (m/z 444.2378, [M + H]+; RT = 20.03 min), stachybotrin I (3) (m/z 534.2851, [M + H]+; RT = 23.43 min), and stachybocin G (2) (m/z 883.5077, [M + H]+; RT = 26.41 min) by comparison with the MS data and the retention time of the isolated compounds 2, 3, 4, 7, 9, and 10 (Figure 6, Table S23). Nine nodes were confidently manually annotated to K-76-4 (22) (m/z 502.2809, [M + H]+; RT = 19.33 min), a compound that had never reported named stachybotrin K (23) (m/z 486.2847, [M + H]+; RT = 19.52 min), K-76-3 (30) (m/z 488.2643, [M + H]+; RT = 19.76 min), stachybotrysam E (25) (m/z 472.2702, [M + H]+; RT = 20.33 min), K-76-7 (26) (m/z 550.2787, [M + H]+; RT = 20.86 min), stachybonoid E (29) (m/z 458.2540, [M + H]+; RT = 21.17 min), stachybonoid F (30) (m/z 486.2850, [M + H]+; RT = 22.69 min), stachartin C (31) (m/z 500.3016, [M + H]+; RT = 22.76 min), and stachybocin A (33) (m/z 883.5064, [M + H]+; RT = 24.93 min).
The green subcluster, except for 2α-acetoxystachybotrylactam acetate (7), is mainly dedicated to N-substituted PSD derivatives. K-76-3 (24) and stachybotrysam E (25) contain a butanoic acid moiety, and chartarlactam B (9) features a pentanoic acid moiety [5,16,46]. Stachybonoid F (30) and F1839-J (10) correspond to the ester derivatives of K-76-3 (24) and chartarlactam B (9), respectively [6,41]. Stachybotrin H (4), stachybotrin I (3), stachybotrin K (23), and stachartin C (31) are amino acid derivatives of stachybotrylactam (5) as they feature a glycine, phenylalanine, and valine residue, respectively [35,37,47]. Stachybonoid E (29) correspond to the ester derivative of stachybotrin H (4) [41]. K-76-7 (26) is the hydroxylated derivative of stachybotrin I (3) [5].
The blue subcluster comprised 25 nodes, 3 of which were assigned as stachybotrylactam (5) (m/z 386.2323, [M + H]+; RT = 19.99 min), stachybotrylactam acetate (6) (m/z 428.2418, [M + H]+; RT = 22.16 min), and stachybotramide (8) (m/z 430.2583, [M + H]+; RT = 19.57 min), by comparison with the HRMS(/MS) data and the retention time of the isolated compounds 5, 6, and 8 (Figure 6, Table S23). Three nodes (m/z 384.2179, m/z 384.2181; RT = 16.71 min, RT = 18.99 min, RT = 19.72 min) were manually annotated to F1839-A (17) ([M-H2O+H]+), chartarlactam E (18) ([M + H]+), or their isomers. Two nodes were putatively identified as chartarlactam J (19) (m/z 402.2278, [M + H]+; RT = 17.44 min) or chartarlactam C (20) (m/z 402.2280, [M + H]+; RT = 18.95 min). Four nodes were confidently assigned to chartarlactam M (21) (m/z 386.2319, [M + H]+; RT = 18.86 min), stachybotrin D (27) (m/z 442.2588, [M + H]+; RT = 20.93 min), stachybotrin E (28) (m/z 400.2499, [M + H]+; RT = 20.94 min), and F1839-I (32) (m/z 373.2377, [M + H]+; RT = 23.04 min).
The blue subcluster, except for stachybotramide (8), stachybotrin D (27), stachybotrin E (28), and F1839-I (32) [6,21,36,48], is mainly dedicated to PSD derivatives modulated on the drimane skeleton. Chartarlactam J (19) and chartarlactam M (21) are the C-2 and the C-8 epimers of stachybotrylactam (5) and F1839-A (17), respectively [16,49]. F1839-A (17) and chartarlactam C (20) are the C-2 and C-13 hydroxylated analogs of stachybotrylactam (5), respectively [16,49]. Chartarlactam E (18) is the C-3 oxidized analog of stachybotrylactam (5) [16].
The orange subcluster is comprised of 18 nodes and only 1 of which was annotated as stachybotrin J (1) (m/z 543.3170, [M + H]+; RT = 20.61 min) by comparison with the MS data of the isolated compound 1 (Figure 6, Table S23).
All the putatively annotated compounds could also be proposed as their isomers. The relative and/or absolute configuration cannot be determined unless other appropriate spectroscopic techniques are used. Thirty-six nodes with m/z values of 355.2258, 368.2212, 371.2214, 382.2014, 390.2601, 416.2429, 417.2381, 431.2913, 436.2846, 454.2956, 458.2523, 460.2343, 474.2473, 482.2883, 483.2848, 484.2322, 498.2861, 501,2580, 514.2786, 530.2735, 532.2710, 541.2928, 548.2875, 554.3219, 568.2212, 573.2953, 581.2997, 584.3354, 591.3075, 648.2897, 654.3358, 670.3721, 690.3399, 690.3403, 704.3556, and 724.3264 could not be assigned to any known metabolite by manual or GNPS-based dereplication approaches.

2.3. Biological Assays

Compounds 110, isolated in small amounts, were evaluated for their cytotoxicity against five aggressive human cancer cell lines: MP41 (melanoma), 786 (renal carcinoma), 786R (sunitinib-resistant renal cell carcinoma), CAL33 (head and neck carcinoma), and CAL33RR (cisplatin- and radiotherapy-resistant head and neck carcinoma). The above cells were treated with compounds 110 for two days and XTT assays were used to assess cell metabolism and proliferative capacity. The IC50 values (µM) are shown in Table 2. Compounds 57 showed a weak toxicity against the MP41 cell line (IC50 < 1.0 µM) although compounds 14 and 810 showed almost no cytotoxicity against the MP41 cell line (IC50 > 50 µM). In addition, compounds 57 exhibited better cytotoxic activities against the 786 and CAL33 cell lines (from 3.6 to 2.5-fold less), with IC50 values in the range of 0.3–1.5 µM, compared to sunitinib (IC50 = 2.5 ± 0.5) and cisplatin (IC50 = 1.5 ± 0.3), respectively, which were used as positive controls. Similarly, compounds 57 also showed better cytotoxic activities against the two resistant human cancer cell lines, compared to the positive controls, with IC50 values from 0.8 to 2.2 µM against 786R (sunitinib IC50 > 10 ± 1) and with IC50 values ranging from 0.6 to 1.0 µM against CAL33RR (cisplatin IC50 > 10 ± 1). Compounds 14 and 810 were almost non-cytotoxic against the MP41, 786, 786R, CAL33, and CAL33RR cell lines (except for compound 8, IC50 < 20 µM). Consequently, our results clearly suggest that in terms of structure–activity relationships, a non-substituted lactam functionality in PSDs is required for cytotoxicity against the aggressive human cancer cell lines studied, notably the resistant cancer cell lines. PSDs have hardly been studied for their antitumor activities. In the literature, compounds 5, 4, and 8 showed no cytotoxicity against K562 (leukemia), HL60 (leukemia), and Hela (cervical cancer) cell lines (IC50 > 100 µM) [37], and compounds 5, 3, 7, and 8 showed no cytotoxicity against NIH-3T3 (fibroblast) and HepG2 (liver carcinoma) cell lines (IC50 > 50 µM) [18]. On the other hand, alternative therapies to metastatic RCC and HNSCC are urgently needed to prevent relapse on current conventional treatments (sunitinib for RCC and cisplatin for HNSCC). Recently, N,N′-diarylureas and thioureas with a nitro-benzothiazole moiety, were synthesized and evaluated by our team for their anticancer properties, particularly against the 786 and CAL33 cell lines. Compared to compounds 57, the lead compound of this previous study, named C29, exhibited lower cytotoxic activity against cell lines 786 and CAL33 (1.3- to 6.7-fold higher), with IC50 values of 2 and 4 µM, respectively [50]. Taken together, all these data seem to indicate that small modifications of the PSD skeleton could lead to a significant change in bioactivity and/or selectivity against human cancer cell lines, which is of great interest for the development of new anticancer drugs, especially against resistant cancer cell lines.

3. Materials and Methods

3.1. General

All organic solvents used for material extraction were of analytical grade and purchased from Sigma-Aldrich (Merck KGaA, Saint-Louis, MO, USA). Formic acid (H2CO2) and acetonitrile used for HPLC were of HPLC grade and both were purchased from CARLO ERBA Reagents GmbH (Emmendingen, Germany). Polygoprep C18 (60–80 µm) for the SPE was purchased from Macherey-Nagel GmbH & Co. KG (Düren, Germany). HPLC analyses and purifications by semi-preparative HPLC were performed with a Waters Alliance 2695 HPLC system (Waters Corporation, Milford, MA, USA) coupled with a Waters 996 photodiode array (PDA) detector and a Shimadzu ELSD LT (Shimadzu, Kyoto, Japan). Analyses were performed with a bifunctional Macherey-Nagel NUCLEODUR Sphynx RP column (250 × 4.6 mm, 5 µm) consisting of a balanced ratio of propylphenyl and C18 ligands. Purifications were performed with a bifunctional Macherey-Nagel NUCLEODUR Sphynx RP (250 × 10 mm, 5 µm) and a Phenomenex Prodigy C18 (250 × 21.2 mm, 5 μm) columns. NMR spectra were recorded with 400 and 500 MHz Bruker Avance NMR spectrometers (Bruker Corporation, Billerica, MA, USA). High resolution mass spectra (HRMS) were conducted on a Thermo Q-Exactive (UPLC-HRMS) Orbitrap (Thermo Fisher Scientific, Waltham, MA, USA) using a ThermoFisher Scientific Hypersil GOLD (150 × 2.1 mm, 1.9 μm) column and a mobile phase A H2O + 0.1% formic acid (UPLC/MS grade) and B ACN + 0.1% formic acid (UPLC/MS grade), pumped at a rate of 0.2 mL/min with the following gradient: 0–5 min, 10% B; 5–30 min, 10 to 98% B; 30–35 min, 98% B, and a column reconditioning phase to 10% B for 10 min. The MS parameters were set as follows: spray voltage at 3.7 kV (positive mode) or 2.7 kV (negative mode), capillary temperature at 320 °C, a sheath gas rate at 60 units N2 (ca. 200 mL/min), and an auxiliary gas rate at 15 units N2 (ca. 50 mL/min). The m/z range for data-dependent acquisition was set between 100 and 1200 amu. The data were analyzed using Thermo Xcalibur software. Circular dichroism spectra were measured on a JASCO-J-810 polarimeter (JASCO Corporation, Tokyo, Japan). Optical rotations were recorded on an Anton Paar MCP 150 polarimeter (Anton Paar, Graz, Austria).

3.2. Fungal Material and Fermentation

Stachybotrys chartarum MUT 3308 was isolated from the marine sponge Aplysina cavernicola sampled in the Mediterranean Sea at Villefranche-sur-Mer, France (Lat: 43°41′31.48707839999″ N, Lon: 7°19′12.185658623999″ E) [31]. The fungus was isolated by direct plating of the sponge tissues on Corn Meal Agar Seawater (CMAS; corn meal 2 g, agar 15 g, sea salts mix 30 g, gentamicin sulfate 40 mg, piperacillin and tazobactam 11 mg, Sigma-Aldrich (Merck KGaA, Saint-Louis, MO, USA) up to 1 L DI H2O) after incubation at 15 °C. The fungus was identified based on its morphological features and by molecular analyses with the amplification of the Internal Transcribed Spacer—ITS. The sequence was deposited in GenBank (accession number MG980591), while the fungus was preserved at the Mycotheca Universitatis Taurinensis (MUT—http://www.mut.unito.it (accessed on 29 January 2023)) of the University of Turin, Italy. The cultivation scale-up for the purification of the compounds was performed on Potato Dextrose Agar (PDA; potato extract 4 g, dextrose 20 g, agar 15 g, up to 1 L DI H2O) using 100 Petri dishes (6 cm Ø) or 12 Erlenmeyer flaks (1 L). The plates were incubated for 30 days and the flasks (liquid medium) were agitated for 45 days in the dark at 24 °C.

3.3. Extraction and Isolation

The fungal culture on Petri dishes was freeze-dried before extraction. The material was extracted first with CH2Cl2/AcOEt (1:1, v/v) and then with CH2Cl2/CH3OH (1:1, v/v) to yield fractions F1 and F2, respectively. Fraction F2 was fractionated by liquid chromatography on C18 silica gel with a gradient of decreasing polarity (from H2O to CH3OH to CH2Cl2) to afford ten fractions according to their chromatographic profile. The CH3OH fraction from F2 was further purified by reverse-phase HPLC using a Macherey-Nagel propylphenyl-C18 (250 × 4.6 mm, 5 μm) column to yield pure compounds 5 (6.2 mg, 0.014% w/w), 6 (2.4 mg, 0.005% w/w), and 7 (2.3 mg, 0.005% w/w) using H2O–ACN + 0.1% formic acid for each solvent (gradient: 60:40 to 0:100 in 25 min). Fraction F2 was desalted by liquid chromatography on C18 silica gel by eluting first with water then the organic compounds were desorbed by using a mixture of CH3OH/CH2Cl2 (1:1, v/v) to give two fractions. The organic fraction was then fractionated by liquid chromatography on C18 silica gel with a gradient of decreasing polarity (H2O, ACN, CH3OH, CH2Cl2) to give eleven fractions. The H2O/ACN (1:1, v/v) fraction was subjected to HPLC purification (Macherey-Nagel propylphenyl-C18, 250 × 4.6 mm, 5 μm) using H2O–ACN + 0.1% formic acid for each solvent (gradient: 90:10 to 0:100 in 25 min) to lead to pure compound 1 (2.1 mg, 0.005% w/w). The main compounds present in the CH3OH fraction were purified by semi-preparative HPLC using H2O–ACN + 0.1% formic acid for each solvent (gradient: 70:30 to 0:100 in 25 min) to obtain compounds 2 (2.5 mg, 0.006% w/w) and 5 (2 mg, 0.004% w/w).
Two batches of S. chartarum MUT 3308 liquid culture (5 L and 7 L) were vacuum filtered to separate the filtrate from the mycelium. The filtrates were subjected to a liquid–liquid extraction with AcOEt to obtain two organic crude extracts. These were fractionated by liquid chromatography on silica diol with a gradient of increasing polarity (Cyclohexane, AcOEt, CH3OH) to obtain nineteen fractions. Some fractions, due to their chromatographic similarities following HPLC-PDA-ELSD analyses, were grouped together. Fraction 8 was subjected to purification by semi-preparative HPLC (Gemini C18, 250 × 10 mm, 5 μm) using H2O–ACN + 0.1% formic acid for each solvent (gradient: 90:10 to 10:90 in 25 min) to afford compounds 3 (1.7 mg, 0.004%, w/w) and 10 (1.3 mg, 0.003% w/w). Fraction 9 was subjected to purification by semi-preparative HPLC (Gemini C18, 250 × 10 mm; 5 μm) using H2O–ACN + 0.1% formic acid for each solvent (gradient: 90:10 to 10:90 in 25 min) to afford compounds 3 (1.4 mg, 0.004% w/w) and 4 (1.2 mg, 0.003% w/w). Fraction 10 was subjected to purification by semi-preparative HPLC (Gemini C18, 250 × 10 mm; 5 μm) using H2O–ACN + 0.1% formic acid for each solvent (gradient: 90:10 to 0:100 in 25 min) to obtain compounds 2 (1 mg, 0.002% w/w), 5 (1.2 mg, 0.003% w/w), 8 (0.6 mg, 0.001% w/w), and 9 (2.1 mg, 0.005% w/w).
Stachybotrin J (1): White amorphous solid; [α]24 D = −29 (c 0.1, CH3OH); UV (CH3OH) λmax (log ε): 232 (2.70), 266 (2.80), 303 (0.70) nm; RT = 16.30 min; HRESI(+)MS m/z 543.3171 [M + H]+ (calcd for C29H43N4O6+, 543.3177); 1H NMR (500 MHz, CD3OD), δppm (mult., J): 6.69 (s, 1H, H-3′), 4.76 (m, 1H, H-2″), 4,74 (d, 3J = 17.2 Hz, 1H, H-8′a), 4.29 (d, 3J = 17.2 Hz, 1H, H-8′b), 3.33 (s, 1H, H-3), 3.24 (m, 2H, H-5″), 3.24 (d, 3J = 16.9 Hz, 1H, H-11α), 2.86 (d, 3J = 16.9 Hz, 1H, H-11β), 2.15 (m, 2H, H-5, H-3″a), 1.90 (m, 4H, H-1β, H-6α, H-8, H-3″b), 1.56 (m, 7H, H-2, H-6β, H-7, H-4″), 1.09 (m, 1H, H-1α), 1.06 (s, 3H, H-15), 0.98 (s, 3H, H-13), 0.89 (s, 3H, H-14), 0.74 (d, 3J = 6.5 Hz, 3H, H-12). 13C NMR (125 MHz, CD3OD), δppm: 171.7 (C-7′), 170.3 (C-1″), 158.6 (C-6″), 157.6 (C-6′), 155.1 (C-2′), 135.1 (C-5′), 118.7 (C-1′), 114.9 (C-4′), 102.1 (C-3′), 99.7 (C-9), 76.3 (C-3), 57.6 (C-2″), 45.9 (C-8′), 43.5 (C-10), 41.9 (C-5″), 41.3 (C-5), 38.6 (C-8), 38.5 (C-4), 33.0 (C-11), 32.3 (C-7), 29.0 (C-13), 28.8 (C-3″), 27.2 (C-4″), 26.4 (C-6), 25.3 (C-1), 23.0 (C-14), 22.1 (C-2), 16.6 (C-15), 16.0 (C-12).
Stachybocin G (2): White amorphous solid; [α]20D = −35 (c 0.26, CH3OH); UV (CH3OH) λmax (log ε): 233 (2.65), 266 (2.40), 301 (0.85) nm; RT = 27.26 min; HRESI(+)MS m/z 883.5052 [M + H]+ (calcd for C52H71N2O10+, 883.5103); 1H NMR (500 MHz, CD3OD), δppm (mult., J): 6.67 (s, 1H, H-3), 6.63 (s, 1H, H-3′), 4.76 (m, 1H, H-2″), 4.74 (d, 3J = 16.9 Hz, 1H, H-8a), 4.48 (d, 3J = 17.3 Hz, 1H, H-8′a), 4.31 (d, 3J = 17.3 Hz, 1H, H-8′b), 4.27 (d, 3J = 16.9 Hz, 1H, H-8b), 3.58 (t, 3J = 8.0 Hz, 2H, H-6″), 3.33 (m, 2H, H-18, H-18′), 3.21 (d, 3J = 16.9 Hz, 2H, H-9α, H-9′α), 2.84 (d, 3J = 16.9 Hz, 2H, H-9β, H-9′β), 2.19 (m, 1H, H-3″a), 2.13 (m, 2H, H-14, H-14′), 1.96 (m, 3H, H-13a, H-3″b, H-13′a), 1.84 (m, 5H, H-11, H-16β, H-5″, H-11′, H-16′β), 1.55 (m, 10H, H-13b, H-12, H-17, H-13′b, H-12′, H-17′), 1.37 (m, 2H, H-4″), 1.08 (m, 2H, H-16α, H-16′α), 1.05 (s, 6H, H-21, H-21′), 0.98 (s, 6H, H-22, H-22′), 0.88 (s, 6H, H-23, H-23′), 0,72 (d, 3J = 6.4 Hz, 6H, H-20, H-20′). 13C NMR (125 MHz, CD3OD), δppm: 170.3 (C-1, C-1′), 166.3 (C-1″), 157.6 (C-6), 157.5 (C-6′), 155.2 (C-4), 155.0 (C-4′), 135.1 (C-2′), 134.9 (C-2), 118.7 (C-5), 118.6 (C-5′), 114.9 (C-7), 114.2 (C-7′), 102.1 (C-3, C-3′), 99.7 (C-10), 99.6 (C-10′), 76.4 (C-18, C-18′), 57.7 (C-2″), 48.8 (C-8′), 45.9 (C-8), 43.5 (C-15, C-15′, C-6″), 41.3 (C-14, C-14′), 38.7 (C-11), 38.6 (C-11′), 38.5 (C-19), 38.4 (C-19′), 33.0 (C-9, C-9′), 32.3 (C-12, C-12′), 32.2 (C-3″), 29.0 (C-22, C-22′, C-5″), 26.1 (C-16), 26.0 (C-16′), 25.5 (C-13), 25.4 (C-13′), 25.4 (C-4″), 23.0 (C-23, C-23′), 22.1 (C-17, C-17′), 16.6 (C-21), 16.5 (C-21′), 16.0 (C-20, C-20′).
Stachybotrin I (3): White amorphous solid; [α]20D = −27 (c 0.1, CH3OH); UV (CH3OH) λmax (log ε): 229 (2.30), 267 (1.10), 303 (0.35) nm; RT = 24.49 min; HRESI(+)MS m/z 534.2839 [M + H]+ (calcd for C32H40NO6+, 534.2850); 1H NMR (500 MHz, CD3OD), δppm (mult., J): 7.26 (d, 3J = 7.3 Hz, 2H, H-5″), 7.19 (t, 3J = 7.3 Hz, 2H, H-6″), 7.10 (t, 3J = 7.3 Hz, 1H, H-7″), 6.57 (s, 1H, H-3′), 5.13 (m, 1H, H-2″), 4.67 (d, 3J = 17.0 Hz, 1H, H-8′a), 4.22 (d, 3J = 17.0 Hz, 1H, H-8′b), 3.54 (m, 1H, H-3″a), 3.35 (s, 1H, H-3), 3.21 (m, 1H, H-3″b), 3.17 (d, 3J = 16.8 Hz, 1H, H-11α), 2.80 (d, 3J = 16.8 Hz, 1H, H-11β), 2.13 (m, 1H, H-5), 1.96 (m, 1H, H-6α), 1.84 (m, 2H, H-1β, H-8), 1.55 (m, 5H, H-2, H-6β, H-7), 1.09 (m, 1H, H-1α), 1.04 (s, 3H, H-15), 0.98 (s, 3H, H-13), 0.88 (s, 3H, H-14), 0.67 (d, 3J = 6.5 Hz, 3H, H-12). 13C NMR (125 MHz, CD3OD), δppm: 174.5 (C-7′), 170.3 (C-1″), 157.4 (C-6′), 154.8 (C-2′), 140.1 (C-4″), 135.3 (C-5′), 129.6 (C-5″), 129.4 (C-6″), 127.3 (C-7″), 118.5 (C-1′), 114.9 (C-4′), 102.0 (C-3′), 99.5 (C-9), 76.4 (C-3), 59.7 (C-2″), 46.3 (C-8′), 43.5 (C-10), 41.3 (C-5), 38.6 (C-4), 38.5 (C-8), 38.0 (C-3″), 33.0 (C-11), 32.3 (C-7), 29.0 (C-13), 26.1 (C-6), 25.4 (C-1), 23.0 (C-14), 22.1 (C-2), 16.6 (C-15), 16.0 (C-12).
Stachybotrin H (4): White amorphous solid; [α]20D = −31 (c 0.1, CH3OH); UV (CH3OH) λmax (log ε): 224 (1.70), 265 (0.55), 302 (0.20) nm; RT = 21.09 min; HRESI(+)MS m/z 444.2372 [M + H]+ (calcd for C25H34NO6+, 444.2381); 1H NMR (500 MHz, CD3OD), δppm (mult., J): 6.68 (s, 1H, H-3′), 4.48 (m, 2H, H-2″), 4.23 (d, 3J = 17.0 Hz, 1H, H-8′a), 4.07 (d, 3J = 17.0 Hz, 1H, H-8′b), 3.33 (s, 1H, H-3), 3.22 (d, 3J = 16.8 Hz, 1H, H-11α), 2.84 (d, 3J = 16.8 Hz, 1H, H-11β), 2.14 (m, 1H, H-5), 1.96 (m, 1H, H-6α), 1.86 (m, 2H, H-1β, H-8), 1.64 (m, 2H, H-2), 1.58 (m, 3H, H-6β, H-7), 1.09 (m, 1H, H-1α), 1.05 (s, 3H, H-15), 0.98 (s, 3H, H-13), 0.88 (s, 3H, H-14), 0.73 (d, 3J = 6.5 Hz, 3H, H-12). 13C NMR (125 MHz, CD3OD), δppm: 174.7 (C-7′), 170.4 (C-1″), 157.5 (C-6′), 155.1 (C-2′), 135.2 (C-5′), 118.6 (C-1′), 114.8 (C-4′), 102.2 (C-3′), 99.6 (C-9), 76.5 (C-3), 49.3 (C-2″), 47.4 (C-8′), 43.5 (C-10), 41.3 (C-5), 38.6 (C-4), 38.4 (C-8), 33.0 (C-11), 32.3 (C-7), 28.9 (C-13), 26.1 (C-6), 25.4 (C-1), 23.0 (C-14), 22.1 (C-2), 16.6 (C-15), 15.9 (C-12).
Stachybotrylactam (5): White amorphous solid; [α]20D = −18 (c 0.24, CH3OH) [[α]25D = −19.7 (c 0.05, CH3OH) [16]]; UV (CH3OH) λmax (log ε): 230 (3.10), 264 (2.10), 302 (1.00) nm; RT = 21.15 min; HRESI(+)MS m/z 386.2314 [M + H]+ (calcd for C23H32NO4+, 386.2326); 1H NMR (500 MHz, CD3OD), δppm (mult., J): 6.69 (s, 1H, H-3′), 4.43 (d, 3J = 17.4 Hz, 1H, H-8′a), 4.27 (d, 3J = 17.4 Hz, 1H, H-8′b), 3.34 (s, 1H, H-3), 3.24 (d, 3J = 16.9 Hz, 1H, H-11α), 2.86 (d, 3J = 16.9 Hz, 1H, H-11β), 2.13 (m, 1H, H-5), 1.97 (m, 1H, H-6α), 1.86 (m, 1H, H-8), 1.84 (m, 1H, H-1β), 1.54 (m, 5H, H-2, H-6β, H-7), 1.05 (m, 1H, H-1α), 1.06 (s, 3H, H-15), 0.99 (s, 3H, H-13), 0.89 (s, 3H, H-14), 0.74 (d, 3J = 6.5 Hz, 3H, H-12). 13C NMR (125 MHz, CD3OD), δppm: 174.1 (C-7′), 157.8 (C-6′), 155.2 (C-2′), 134.7 (C-5′), 119.00 (C-1′), 116.7 (C-4′), 102.1 (C-3′), 99.7 (C-9), 76.5 (C-3), 43.9 (C-8′), 43.5 (C-10), 41.3 (C-5), 38.6 (C-4), 38.4 (C-8), 33.0 (C-11), 32.3 (C-7), 29.0 (C-13), 26.0 (C-6), 25.4 (C-1), 22.9 (C-14), 22.1 (C-2), 16.5 (C-15), 16.0 (C-12).
Stachybotrylactam acetate (6): White amorphous solid; [α]20D = −32 (c 0.1, CH3OH); UV (CH3OH) λmax (log ε): 224 (1.90), 262 (0.55), 302 (0.25) nm; RT = 23.54 min; HRESI(+)MS m/z 428.2419 [M + H]+ (calcd for C25H34NO5+, 428.2431); 1H NMR (500 MHz, CD3OD), δppm (mult., J): 6.70 (s, 1H, H-3′), 4.60 (s, 1H, H-3), 4.35 (d, 3J = 17.2 Hz, 1H, H-8′a), 4.23 (d, 3J = 17.2 Hz, 1H, H-8′b), 3.23 (d, 3J = 17.0 Hz, 1H, H-11α), 2.88 (d, 3J = 17.0 Hz, 1H, H-11β), 2.16 (m, 1H, H-5), 2.03 (s, 3H, H-17), 1.87 (m, 2H, H-6α, H-8), 1.71 (m, 1H, H-1β), 1.55 (m, 5H, H-2, H-6β, H-7), 1.15 (m, 1H, H-1α), 1.08 (s, 3H, H-15), 0.97 (s, 3H, H-13), 0.92 (s, 3H, H-14), 0.76 (d, 3J = 6.5 Hz, 3H, H-12). 13C NMR (125 MHz, CD3OD), δppm: 174.0 (C-7′), 172.4 (C-16), 157.6 (C-6′), 155.4 (C-2′), 134.8 (C-5′), 118.9 (C-1′), 116.2 (C-4′), 102.3 (C-3′), 99.6 (C-9), 79.5 (C-3), 43.9 (C-8′), 43.5 (C-10), 42.3 (C-5), 38.2 (C-8), 37.8 (C-4), 32.9 (C-11), 32.2 (C-7), 28.4 (C-13), 25.9 (C-1), 23.4 (C-6), 22.3 (C-14), 21.9 (C-2), 21.1 (C-17), 16.4 (C-15), 15.9 (C-12).
2α-acetoxystachybotrylactam acetate (7): White amorphous solid; [α]20D = −30 (c 0.1, CH3OH) [[α]25D = −29 (c 0.1, CH3OH) [36]]; UV (CH3OH) λmax (log ε): 233 (2.80), 261 (2.60), 302 (1.25) nm; RT = 22.33 min; HRESI(+)MS m/z 486.2474 [M + H]+ (calcd for C27H36NO7+, 486.2486); 1H NMR (500 MHz, CD3OD), δppm (mult., J): 6.73 (s, 1H, H-3′), 5.23 (m, 1H, H-2), 4.95 (s, 1H, H-3), 4.36 (d, 3J = 17.2 Hz, 1H, H-8′a), 4.24 (d, 3J = 17.2 Hz, 1H, H-8′b), 3.24 (d, 3J = 17.1 Hz, 1H, H-11α), 2.93 (d, 3J = 17.1 Hz, 1H, H-11β), 2.13 (m, 1H, H-5), 2.07 (s, 3H, H-17), 1.91 (m, 1H, H-8), 1.86 (s, 3H, H-19), 1.82 (m, 1H, H-1β), 1.66-1.54 (m, 4H, H-6, H-7), 1.40 (m, 1H, H-1α), 1.16 (s, 3H, H-15), 0.94 (s, 3H, H-14), 1.05 (s, 3H, H-13), 0.78 (d, 3J = 6.5 Hz, 3H, H-12). 13C NMR (125 MHz, CD3OD), δppm: 173.8 (C-7′), 172.4 (C-18), 172.3 (C-16), 157.4 (C-6′), 155.5 (C-2′), 135.1 (C-5′), 118.6 (C-1′), 116.9 (C-4′), 102.5 (C-3′), 99.2 (C-9), 78.3 (C-3), 69.6 (C-2), 44.8 (C-10), 43.8 (C-8′), 41.9 (C-5), 39.1 (C-4), 37.8 (C-8), 33.0 (C-11), 32.0 (C-7), 31.5 (C-1), 22.0 (C-14), 28.3 (C-13), 21.5 (C-6), 20.9 (C-17), 20.8 (C-19), 17.3 (C-15), 15.8 (C-12).
Stachybotramide (8): White amorphous solid; [α]20D = −19 (c 0.04, CH3OH) [[α]25D = −16 (c 0.1, CH3OH) [36]]; UV (CH3OH) λmax (log ε): 233 (2.00), 265 (0.70), 300 (0.25) nm; RT = 20.21 min; HRESI(+)MS m/z 430.2581 [M + H]+ (calcd for C25H36NO5+, 430.2588); 1H NMR (500 MHz, CD3OD), δppm (mult., J): 6.67 (s, 1H, H-3′), 4.57 (d, 3J = 17.2 Hz, 1H, H-8′a), 4.43 (d, 3J = 17.2 Hz, 1H, H-8′b), 3.80 (t, 3J = 5.4 Hz, 2H, H-2″), 3.70 (t, 3J = 5.4 Hz, 2H, H-1″), 3.35 (s, 1H, H-3), 3.23 (d, 3J = 16.9 Hz, 1H, H-11α), 2.85 (d, 3J = 16.9 Hz, 1H, H-11β), 2.14 (m, 1H, H-5), 1.97 (m, 1H, H-6α), 1.86 (m, 2H, H-1β, H-8), 1.57 (m, 5H, H-2, H-6β, H-7), 1.10 (m, 1H, H-1α), 1.06 (s, 3H, H-15), 0.98 (s, 3H, H-13), 0.89 (s, 3H, H-14), 0.73 (d, 3J = 6.5 Hz, 3H, H-12).
Chartarlactam B (9): White amorphous solid; [α]20D = −24 (c 0.1, CH3OH) [[α]25D = −22 (c 0.05, CH3OH) [16]]; UV (CH3OH) λmax (log ε): 223.8 (2.05), 265 (0.75), 300 (0.25) nm; RT = 21.63 min; HRESI(+)MS m/z 486.2838 [M + H]+ (calcd for C28H40NO6+, 486.2850); 1H NMR (500 MHz, CD3OD), δppm (mult., J): 6.65 (s, 1H, H-3′), 4.47 (d, 3J = 17.2 Hz, 1H, H-8′a), 4.33 (d, 3J = 17.2 Hz, 1H, H-8′b), 3.61 (t, 3J = 7.0 Hz, 2H, H-1″), 3.33 (s, 1H, H-3), 3.22 (d, 3J = 16.9 Hz, 1H, H-11α), 2.85 (d, 3J = 16.9 Hz, 1H, H-11β), 2.23 (t, 3J = 7.3 Hz, 2H, H-4″), 2.13 (m, 1H, H-5), 1.96 (m, 1H, H-6α), 1.84 (m, 2H, H-1β, H-8), 1.73 (m, 2H, H-2″), 1.67 (m, 2H, H-3″), 1.59 (m, 4H, H-2, H-7), 1.51 (m, 1H, H-6β), 1.08 (m, 1H, H-1α), 1.05 (s, 3H, H-15), 0.98 (s, 3H, H-13), 0.89 (s, 3H, H-14), 0.74 (d, 3J = 6.5 Hz, 3H, H-12). 13C NMR (125 MHz, CD3OD), δppm: 171.7 (C-7′), 170.3 (C-5″), 157.6 (C-6′), 155.2 (C-2′), 135.2 (C-5′), 118.6 (C-1′), 114.3 (C-4′), 102.0 (C-3′), 99.7 (C-9), 76.4 (C-3), 43.6 (C-8′), 43.5 (C-10, C-1″), 41.3 (C-5), 38.6 (C-4″), 38.5 (C-4), 38.4 (C-8), 32.9 (C-11), 32.3 (C-7), 29.5 (C-2″), 29.0 (C-13), 26.0 (C-6), 25.4 (C-1), 25.0 (C-3″), 23.0 (C-14), 22.1 (C-2), 16.5 (C-15), 16.0 (C-12).
F1839-J (10): White amorphous solid; [α]20D = −12 (c 0.2, CH3OH); UV (CH3OH) λmax (log ε): 224 (2.25), 265 (0.80), 301 (0.25) nm; RT = 24.77 min; HRESI(+)MS m/z 500.2995 [M + H]+ (calcd for C29H42NO6+, 500.3007); 1H NMR (500 MHz, CD3OD), δppm (mult., J): 6.67 (s, 1H, H-3′), 4.69 (d, 3J = 16.9 Hz, 1H, H-8′a), 4.24 (d, 3J = 16.9 Hz, 1H, H-8′b), 3.87 (m, 1H, H-1″a), 3.78 (m, 1H, H-1″b), 3.65 (m, 3H, H-6″), 3.35 (s, 1H, H-3), 3.22 (d, 3J = 16.9 Hz, 1H, H-11α), 2.85 (d, 3J = 16.9 Hz, 1H, H-11β), 2.26 (m, 2H, H-4″), 2.11 (m, 1H, H-5), 1.93 (m, 1H, H-6α), 1.88 (m, 1H, H-1β), 1.83 (m, 3H, H-8, H-2″), 1.60 (m, 4H, H-7, H-3″), 1.54 (m, 3H, H-2, H-6β), 1.10 (m, 1H, H-1α), 1.06 (s, 3H, H-15), 0.99 (s, 3H, H-13), 0.89 (s, 3H, H-14), 0.73 (d, 3J = 6.5 Hz, 3H, H-12).

3.4. Feature-Based Molecular Networking Analysis

The data were processed by using the FBMN method [44]. The data files were converted from the raw data format to mzXML format using MSConvert software (ProteoWizard package 3.0). All mzxml values were processed using MZmine 2.53 [45]. Mass detection was realized with an MS1 noise level of 5 × 10⁶ and an MS2 noise level of 5 × 10³. The ADAP chromatogram builder was employed with a minimum group size of scans of 5, a group intensity threshold of 5 × 10⁶, a minimum highest intensity of 1.7 × 10⁷, and m/z tolerance of 0.0 (or 10 ppm). Deconvolution was performed with the Baseline cut-off algorithm according to the following settings: minimum peak height of 2.7 × 10⁷, peak duration range of 0.1–2 min, baseline level of 3 × 10⁶, and an auto m/z center calculation. MS/MS scans were paired using a m/z tolerance range of 0.02 Da and RT tolerance range of 0.1 min. Isotopologs were grouped using the isotopic peak grouper algorithm with a m/z tolerance of 0.0 (or 10 ppm) and a RT tolerance of 0.2 min. Peaks were filtered using a feature list row filter, keeping only peaks with MS/MS scans (GNPS). Peak alignment was performed using the join aligner with a m/z tolerance of 0.0 (or 10 ppm), a weight for m/z at 75%, a RT tolerance of 0.2 min and weight for RT at 25%. The MGF file and the metadata were generated using the export/submit to GNPS option [51]. The molecular network was calculated and visualized using Cytoscape software [52]. The parent mass tolerance was 0.02 Da and the MS/MS fragment ion tolerance was 0.02 Da. The edges were filtered to have a cosine score above 0.6 and more than 6 matched peaks.

3.5. Computational Analysis

TD-DFT calculations of ECD spectra were performed with the Gaussian 16 program package [53]. Conformer distribution analysis and geometry optimizations for all structures were carried out using the AM1 semi-empirical force field implemented in the Spartan 08 program. For each compound, the minimum energy structures were filtered and checked for duplicity. Then, each conformer was geometrically optimized using the hybrid DFT method B3LYP and the basis set 6-31+G(d,p) (B3LYP/6-31+G(d,p)), with thermochemical parameters and the frequencies at 298 K and 1 atm. The solvation effects of methanol were modelized with the polarizable continuum model (PCM). From the TD-DFT calculations performed on each structure optimized conformer, the calculated excitation energy (in nm) and rotatory strength R, in dipole velocity (Rvel) and dipole length (Rlen) forms, were simulated into an ECD curve by using the following Gaussian function (1):
Δ ε ( E ) = i = 1 n ε i ( E ) = i = 1 n ( R i E i 2.29   ×   10 39 π σ e x p [ ( E E i σ ) 2 ] )  
where σ is the width of the band at 1/e height, and Ei and Ri are the excitation energies and rotatory strengths for transition i, respectively. σ = 0.30 eV and Rvel were used. The Boltzmann-averaged ECD spectra were obtained from B3LYP/6-31+G(d,p)-optimized structures. All DFT and TD-DFT calculations were performed using HPC resources from Azzurra.

3.6. Cell Culture

The human head and neck squamous cell carcinoma (HNSCC) cell line CAL33 (DSMZ, ACC 447) was provided through a Material Transfer Agreement with the Oncopharmacology Laboratory, Centre Antoine Lacassagne (CAL), where it had initially been isolated [54]. CAL33RR cells were generated by chronic exposure to cisplatin and several round of irradiation by 8 gray X-rays [55]. The kidney cancer cell line 786-0 (ATCC, CRL-1932) was purchased from the American Tissue Culture Collection. The 786R cell line was generated by chronic exposure to sunitinib [56]. The uveal melanoma cell line MP41 (ATCC, CRL-3297) was purchased from the American Tissue Culture Collection. The cells were cultured in Dulbecco’s Modified Eagle medium (DMEM; Gibco) supplemented with 7% fetal bovine serum (Thermo Fisher Scientific, Waltham, MA, USA).

3.7. Cytotoxicity Measurement (XTT)

The cells (5 × 10³ cells/100 μL) were incubated in a 96-well plate with different concentrations of the drugs for 48 h. Fifty microliters of XTT reagent were added to each well. Each assay was performed in triplicate. The assay is based on the cleavage of the tetrazolium salt 2,3-Bis-(2-methoxy-4-nitro-5-sulfophenyl)–2H-tetrazolium-5-carboxanilide (XTT, Sigma-Aldrich, Merck KGaA, Saint-Louis, MO, USA) in the presence of an electron-coupling reagent to produce a soluble formazan salt. This conversion only occurs in viable (metabolically active) cells. The number of viable cells is directly correlated with the amount of orange formazan by measuring the absorbance of the dye at 450 nm on a spectrophotometer.

4. Conclusions

The marine sponge-associated fungus S. chartarum MUT 3308, grown in solid and liquid media, was studied for its ability to produce PSDs, a family of metabolites with interesting biological properties. Two PSDs that had never been isolated before, stachybotrin J (1) and new stachybocin G (2), along with eight already reported analogues, stachybotrin I (3), stachybotrin H (4), stachybotrylactam (5), stachybotrylactam acetate (6), 2α-acetoxystachybotrylactam acetate (7), stachybotramide (8), chartarlactam B (9), and F1839-J (10), were isolated and fully characterized. Although previously found in the genus Stachybotrys, this is the first time that stachybotrin H (4) and F1839-J (10) have been isolated from S. chartarum. A plausible biosynthetic hypothesis has been proposed for compounds 110. FBMN analysis led us to hypothesize the presence of numerous derivatives and seventeen have been putatively identified. Compounds 5, 6, and 7 showed cytotoxicity against resistant human cancer cell lines in the range of 0.3–2.2 µM. Our data seem to indicate that small modifications on phenylspirodrimane structures could result in a significant change in cytotoxicity activities, which is of value for the development of new anticancer drugs.

Supplementary Materials

The following are available online at https://www.mdpi.com/article/10.3390/md21030135/s1, Figure S1: HRESI(+)MS spectrum of stachybotrin J (1); Figure S2: 1H NMR spectrum (500 MHz, CD3OD) of stachybotrin J (1); Figure S3: 13C NMR spectrum (125 MHz, CD3OD) of stachybotrin J (1); Figure S4: 1H-1H COSY NMR spectrum (500/500 MHz, CD3OD) of stachybotrin J (1); Figure S5: 1H-13C HSQC NMR spectrum (500/125 MHz, CD3OD) of stachybotrin J (1); Figure S6: 1H-13C HMBC NMR spectrum (500/125 MHz, CD3OD) of stachybotrin J (1); Figure S7: 1H-1H NOESY NMR spectrum (500/500 MHz, CD3OD) of stachybotrin J (1); Figure S8: HRESI(+)MS spectrum of stachybocin G (2); Figure S9: 1H NMR spectrum (500 MHz, CD3OD) of stachybocin G (2); Figure S10: 13C NMR spectrum (125 MHz, CD3OD) of stachybocin G (2); Figure S11: 1H-1H COSY NMR spectrum (500/500 MHz, CD3OD) of stachybocin G (2); Figure S12: 1H-13C HSQC NMR spectrum (500/125 MHz, CD3OD) of stachybocin G (2); Figure S13: 1H-13C HMBC NMR spectrum (500/125 MHz, CD3OD) of stachybocin G (2); Figure S14: Zoom of the 1H-13C HMBC NMR spectrum (500/125 MHz, CD3OD) of stachybocin G (2); Figure S15: 1H-1H NOESY NMR spectrum (500/500 MHz, CD3OD) of stachybocin G (2); Figure S16: 1H NMR spectrum (500 MHz, (CD3)2SO) of stachybocin G (2); Figure S17: 13C NMR spectrum (125 MHz, (CD3)2SO) of stachybocin G (2); Figure S18: 1H-1H COSY NMR spectrum (500/500 MHz, (CD3)2SO) of stachybocin G (2); Figure S19: 1H-13C HSQC NMR spectrum (500/125 MHz, (CD3)2SO) of stachybocin G (2); Figure S20: 1H-13C HMBC NMR spectrum (500/125 MHz, (CD3)2SO) of stachybocin G (2); Figure S21: HRESI(+)MS spectrum of stachybotrin I (3); Figure S22: 1H NMR spectrum (500 MHz, CD3OD) of stachybotrin I (3); Figure S23: 13C NMR spectrum (125 MHz, CD3OD) of stachybotrin I (3); Figure S24: 1H-1H COSY NMR spectrum (500/500 MHz, CD3OD) of stachybotrin I (3); Figure S25: 1H-13C HSQC NMR spectrum (500/125 MHz, CD3OD) of stachybotrin I (3); Figure S26: HRESI(+)MS spectrum of stachybotrin H (4); Figure S27: 1H NMR spectrum (500 MHz, CD3OD) of stachybotrin H (4); Figure S28: 13C NMR spectrum (125 MHz, CD3OD) of stachybotrin H (4); Figure S29: 1H-1H COSY NMR spectrum (500/500 MHz, CD3OD) of stachybotrin H (4); Figure S30: 1H-13C HSQC NMR spectrum (500/125 MHz, CD3OD) of stachybotrin H (4); Figure S31: 1H-13C HMBC NMR spectrum (500/125 MHz, CD3OD) of stachybotrin H (4); Figure S32: 1H-1H NOESY NMR spectrum (500/500 MHz, CD3OD) of stachybotrin H (4); Figure S33: HRESI(+)MS spectrum of stachybotrylactam (5); Figure S34: 1H NMR spectrum (500 MHz, CD3OD) of stachybotrylactam (5); Figure S35: 13C NMR spectrum (125 MHz, CD3OD) of stachybotrylactam (5); Figure S36: 1H-1H COSY NMR spectrum (500/500 MHz, CD3OD) of stachybotrylactam (5); Figure S37: 1H-13C HSQC NMR spectrum (500/125 MHz, CD3OD) of stachybotrylactam (5); Figure S38: 1H-13C HMBC NMR spectrum (500/125 MHz, CD3OD) of stachybotrylactam (5); Figure S39: 1H-1H NOESY NMR spectrum (500/500 MHz, CD3OD) of stachybotrylactam (5); Figure S40: HRESI(+)MS spectrum of stachybotrylactam acetate (6); Figure S41: 1H NMR spectrum (500 MHz, CD3OD) of stachybotrylactam acetate (6); Figure S42: 13C NMR spectrum (125 MHz, CD3OD) of stachybotrylactam acetate (6); Figure S43: 1H-1H COSY NMR spectrum (500/500 MHz, CD3OD) of stachybotrylactam acetate (6); Figure S44: 1H-13C HSQC NMR spectrum (500/125 MHz, CD3OD) of stachybotrylactam acetate (6); Figure S45: 1H-13C HMBC NMR spectrum (500/125 MHz, CD3OD) of stachybotrylactam acetate (6); Figure S46: 1H-1H NOESY NMR spectrum (500/500 MHz, CD3OD) of stachybotrylactam acetate (6); Figure S47: HRESI(+)MS spectrum of 2α-acetoxystachybotrylactam acetate (7); Figure S48: 1H NMR spectrum (500 MHz, CD3OD) of 2α-acetoxystachybotrylactam acetate (7); Figure S49: 13C NMR spectrum (125 MHz, CD3OD) of 2α-acetoxystachybotrylactam acetate (7); Figure S50: 1H-1H COSY NMR spectrum (500/500 MHz, CD3OD) of 2α-acetoxystachybotrylactam acetate (7); Figure S51: 1H-13C HSQC NMR spectrum (500/125 MHz, CD3OD) of 2α-acetoxystachybotrylactam acetate (7); Figure S52: 1H-13C HMBC NMR spectrum (500/125 MHz, CD3OD) of 2α-acetoxystachybotrylactam acetate (7); Figure S53: 1H-1H NOESY NMR spectrum (500/500 MHz, CD3OD) of 2α-acetoxystachybotrylactam acetate (7); Figure S54: HRESI(+)MS spectrum of stachybotramide (8); Figure S55: 1H NMR spectrum (500 MHz, CD3OD) of stachybotramide (8); Figure S56: 1H-1H COSY NMR spectrum (500/500 MHz, CD3OD) of stachybotramide (8); Figure S57: HRESI(+)MS spectrum of chartarlactam B (9); Figure S58: 1H NMR spectrum (500 MHz, CD3OD) of chartarlactam B (9); Figure S59: 13C NMR spectrum (125 MHz, CD3OD) of chartarlactam B (9); Figure S60: 1H-1H COSY NMR spectrum (500/500 MHz, CD3OD) of chartarlactam B (9); Figure S61: 1H-13C HSQC NMR spectrum (500/125 MHz, CD3OD) of chartarlactam B (9); Figure S62: 1H-13C HMBC NMR spectrum (500/125 MHz, CD3OD) of chartarlactam B (9); Figure S63: 1H-1H NOESY NMR spectrum (500/500 MHz, CD3OD) of chartarlactam B (9); Figure S64: HRESI(+)MS spectrum of F1839-J (10); Figure S65: 1H NMR spectrum (500 MHz, CD3OD) of F1839-J (10); Figure S66: HPLC-PDA-ELSD chromatograms of compounds 110; Table S1: 1H and 13C NMR data of 1 (500/125 MHz, CD3OD) and synthetic stachybotry-arginine (600/150 MHz, (CD3OD); Table S2: 1H and 13C NMR data of 2 (500/125 MHz, (CD3)2SO) and stachybocin A (400/100 MHz, (CD3)2SO); Table S3: 1H and 13C NMR data of 3 (500/125 MHz, CD3OD) and stachybotrin I (400/100 MHz, (CD3)2SO); Table S4: 1H and 13C NMR data of 4 (500/125 MHz, CD3OD) and stachybotrin H (400/100 MHz, (CD3)2SO); Table S5: 1H and 13C NMR data of 5 (500/125 MHz, CD3OD) and stachybotrylactam ((CD3)2CO, 200 MHz; CDCl3, 50 MHz); Table S6: 1H and 13C NMR data of 6 (500/125 MHz, CD3OD) and stachybotrylactam acetate (200/50 MHz, CDCl3); Table S7: 1H and 13C NMR data of 7 (500/125 MHz, CD3OD) and 2α-acetoxystachybotrylactam acetate (200/50 MHz, CDCl3); Table S8: 1H NMR data of 8 (500 MHz, CD3OD) and stachybotramide (50 MHz, C5D6N); Table S9: 1H and 13C NMR data of 9 (500/125 MHz, CD3OD) and chartarlactam B (500/125 MHz, (CD3)2SO); Table S10: 1H NMR data of 10 (500 MHz, CD3OD) and F1839-J (270 MHz, C5D6N); Table S11: Coordinates (Ångstroms) for conformer (2″S, 3R, 5S, 8R, 9R, 10S)-1_C1 (Energy: −1800.701682 Hartree, Solvent: CH3OH, Boltzmann %: 58.3); Table S12: Coordinates (Ångstroms) for conformer (2″S, 3R, 5S, 8R, 9R, 10S)-1_C2 (Energy: −1800.70038 Hartree, Solvent: CH3OH, Boltzmann %: 14.6); Table S13: Coordinates (Ångstroms) for conformer (2″S, 3R, 5S, 8R, 9R, 10S)-1_C3 (Energy: −1800.700959 Hartree, Solvent: CH3OH, Boltzmann %: 27.1); Table S14: Coordinates (Ångstroms) for conformer (2″S, 3R, 5S, 8R, 9R, 10S)-1_C4 (Energy: −1800.691933 Hartree, Solvent: CH3OH, Boltzmann %: 1.91.10−2); Table S15: Coordinates (Ångstroms) for conformer (2″R, 10R, 10′R, 13R, 13′R, 14S, 14′S, 15S, 15′S, 18R, 18′R)-2_C1 (Energy: −2885.29118 Hartree, Solvent: CH3OH, Boltzmann %: 44.8); Table S16: Coordinates (Ångstroms) for conformer (2″R, 10R, 10′R, 13R, 13′R, 14S, 14′S, 15S, 15′S, 18R, 18′R)-2_C2 (Energy: −2885.28789 Hartree, Solvent: CH3OH, Boltzmann %: 1.4); Table S17: Coordinates (Ångstroms) for conformer (2″R, 10R, 10′R, 13R, 13′R, 14S, 14′S, 15S, 15′S, 18R, 18′R)-2_C3 (Energy: −2885.29129 Hartree, Solvent: CH3OH, Boltzmann %: 50.2); Table S18: Coordinates (Ångstroms) for conformer (2″R, 10R, 10′R, 13R, 13′R, 14S, 14′S, 15S, 15′S, 18R, 18′R)-2_C4 (Energy: −2885.28879 Hartree, Solvent: CH3OH, Boltzmann %: 3.6); Table S19: Coordinates (Ångstroms) for conformer (2″S, 3R, 5S, 8R, 9R, 10S)-3_C1 (Energy: −1748.9471 Hartree, Solvent: CH3OH, Boltzmann %: 73.9); Table S20: Coordinates (Ångstroms) for conformer (2″S, 3R, 5S, 8R, 9R, 10S)-3_C2 (Energy: −1748.9460 Hartree, Solvent: CH3OH, Boltzmann %: 24.3); Table S21: Coordinates (Ångstroms) for conformer (2″S, 3R, 5S, 8R, 9R, 10S)-3_C3 (Energy: −1748.9433 Hartree, Solvent: CH3OH, Boltzmann %: 1.3); Table S22: Coordinates (Ångstroms) for conformer (2″S, 3R, 5S, 8R, 9R, 10S)-3_C4 (Energy: −1748.9424 Hartree, Solvent: CH3OH, Boltzmann %: 0.5); Figure S67: Structures of the low-energy B3LYP/6-311G(d,p) conformers of A) (2″S, 3R, 5S, 8R, 9R, 10S)–1, B) (2″R, 10R, 10′R, 13R, 13′R, 14S, 14′S, 15S, 15′S, 18R, 18′R)-2, and C) (2″S, 3R, 5S, 8R, 9R, 10S)–3 in CH3OH (298 K and 1 atm); Table S23: Molecular network annotations (isolated compounds highlighted in blue).

Author Contributions

M.D. (Marie Dayras) and E.S. purified the compounds and contributed to spectroscopic analyses data collection and interpretation; M.D. (Marie Dayras) contributed to cytotoxicity activity assay data collection and manuscript writing; E.B. cultured the fungus and contributed to manuscript writing; O.R. and M.D. (Maeva Dufies) contributed to cytotoxicity activity assay data collection; F.F.-V. contributed to computational analysis; E.T.-d.-G. and T.L. contributed to manuscript review and editing; G.P. and G.C.V. contributed to manuscript writing, review, and editing; M.M. contributed to spectroscopic analyses data interpretation and manuscript writing, review, and editing. All authors have read and agreed to the published version of the manuscript.

Funding

This work has been supported by the French government, through the UCAJEDI Investments in the Future project managed by the National Research Agency (ANR) with the reference number ANR-15-IDEX-01 and the FINNOVER project (Strategie Innovative per lo Sviluppo di Filiere Verdi Transfrontaliere)—Interreg Alcotra Italy-France European cross-border program 2014–2020, grant number 1198. We thank the Canceropôle Provence-Alpes-Côte d’Azur, and the Provence-Alpes-Côte d’Azur Region for the financial support provided to the MetaboCell and MetaboPure projects. This publication is based upon work from COST Action CA18238 (Ocean4Biotech) supported by the COST (European Cooperation in Science and Technology) program. E.S. and M.D. (Marie Dayras) are recipients of thesis grants from the “Conseil Regional Provence-Alpes-Côte d’Azur”.

Institutional Review Board Statement

Not applicable.

Data Availability Statement

Not applicable.

Acknowledgments

We thank Marc Gaysinski and Lionel Massi for recording the NMR and HRMS spectra, respectively. We thank the OPAL infrastructure and the Université Côte d’Azur’s Center for High-Performance Computing for providing resources and support.

Conflicts of Interest

The authors declare no conflict of interest.

References

  1. Jarvis, B.B. Stachybotrys chartarum: A Fungus for Our Time. Phytochemistry 2003, 64, 53–60. [Google Scholar] [CrossRef]
  2. Ibrahim, S.R.M.; Choudhry, H.; Asseri, A.H.; Elfaky, M.A.; Mohamed, S.G.A.; Mohamed, G.A. Stachybotrys chartarum—A Hidden Treasure: Secondary Metabolites, Bioactivities, and Biotechnological Relevance. J. Fungi 2022, 8, 504. [Google Scholar] [CrossRef] [PubMed]
  3. Kaneto, R.; Dobashi, K.; Kojima, I.; Sakai, K.; Shibamoto, N.; Yoshioka, T.; Nishida, H.; Okamoto, R.; Akagawa, H.; Mizuno, S. Mer-NF5003B, E and F, Novel Sesquiterpenoids as Avian Myeloblastosis Virus Protease Inhibitors Produced by Stachybotrys sp. J. Antibiot. 1994, 47, 727–730. [Google Scholar] [CrossRef] [PubMed]
  4. Lam, Y.K.T.; Wichmann, C.F.; Meinz, M.S.; Guariglia, L.; Giacobbe, R.A.; Mochales, S.; Kong, L.; Honeycutt, S.S.; Zink, D.; Bills, G.F.; et al. A Novel Inositol Mono-Phosphatase Inhibitor from Memnoniella echinata Producing Organism, Fermentation, Isolation, Physico-Chemical and In Vitro Biological Properties. J. Antibiot. 1992, 45, 1397–1402. [Google Scholar] [CrossRef] [PubMed] [Green Version]
  5. Vázquez, M.J.; Vega, A.; Rivera-Sagredo, A.; Jiménez-Alfaro, M.D.; Díez, E.; Hueso-Rodríguez, J.A. Novel Sesquiterpenoids as Tyrosine Kinase Inhibitors Produced by Stachybotrys chartarum. Tetrahedron 2004, 60, 2379–2385. [Google Scholar] [CrossRef]
  6. Sakai, K.; Watanabe, K.; Masuda, K.; Tsuji, M.; Hasumi, K.; Endo, A. Isolation, Characterization and Biological Activities of Novel Triprenyl Phenols as Pancreatic Cholesterol Esterase Inhibitors Produced by Stachybotrys sp. F-1839. J. Antibiot. 1995, 48, 447–456. [Google Scholar] [CrossRef] [PubMed] [Green Version]
  7. Kaise, H.; Shinohara, M.; Miyazaki, W.; Izawa, T.; Nakano, Y.; Sugawara, M.; Sugiura, K.; Sasaki, K. Structure of K-76, a Complement Inhibitor Produced by Stachybotrys complementi nov. sp. K-76. J. Chem. Soc. Chem. Commun. 1979, 16, 726–727. [Google Scholar] [CrossRef]
  8. Ayer, W.A.; Miao, S. Secondary Metabolites of the Aspen Fungus Stachybotrys cylindrospora. Can. J. Chem. 1993, 71, 487–493. [Google Scholar] [CrossRef]
  9. Lin, T.-W.; Chang, W.-W.; Chen, C.-C.; Tsai, Y.-C. Stachybotrydial, a Potent Inhibitor of Fucosyltransferase and Sialyltransferase. Biochem. Biophys. Res. Commun. 2005, 331, 953–957. [Google Scholar] [CrossRef]
  10. Kamalov, L.S.; Aripova, S.F.; Isaev, M.I. Low-Molecular-Mass Metabolites of Fungi I. Stachybotrin from Stachybotrys alternans. Chem. Nat. Compd. 1997, 33, 462–468. [Google Scholar] [CrossRef]
  11. Kamalov, L.S.; Aripova, S.F.; Isaev, M.I. Low-Molecular-Mass Metabolites of Fungi IV. The Structures of Stachybotrin A and Stachybotral. Chem. Nat. Compd. 1999, 35, 82–85. [Google Scholar] [CrossRef]
  12. Minagawa, K.; Kouzuki, S.; Yoshimoto, J.; Kawamura, Y.; Tani, H.; Iwata, T.; Terui, Y.; Nakai, H.; Yagi, S.; Hattori, N.; et al. Stachyflin and Acetylstachyflin, Novel Anti-Influenza A Virus Substances, Produced by Stachybotrys sp. RF-7260. I. Isolation, Structure Elucidation and Biological Activities. J. Antibiot. 2002, 55, 155–164. [Google Scholar] [CrossRef] [PubMed]
  13. Minagawa, K.; Kouzuki, S.; Kamigauchi, T. Stachyflin and Acetylstachyflin, Novel Anti-Influenza A Virus Substances, Produced by Stachybotrys Sp. RF-7260 II. Synthesis and Preliminary Structure-Activity Relationships of Stachyflin Derivatives. J. Antibiot. 2002, 55, 165–171. [Google Scholar] [CrossRef] [PubMed] [Green Version]
  14. Kim, J.W.; Ko, S.-K.; Kim, H.-M.; Kim, G.-H.; Son, S.; Kim, G.S.; Hwang, G.J.; Jeon, E.S.; Shin, K.-S.; Ryoo, I.-J.; et al. Stachybotrysin, an Osteoclast Differentiation Inhibitor from the Marine-Derived Fungus Stachybotrys Sp. KCB13F013. J. Nat. Prod. 2016, 79, 2703–2708. [Google Scholar] [CrossRef]
  15. Sawadjoon, S.; Kittakoop, P.; Isaka, M.; Kirtikara, K.; Madla, S.; Thebtaranonth, Y. Antiviral and Antiplasmodial Spirodihydrobenzofuran Terpenes from the Fungus Stachybotrys nephrospora. Planta Med. 2004, 70, 1085–1087. [Google Scholar] [CrossRef] [PubMed]
  16. Li, Y.; Wu, C.; Liu, D.; Proksch, P.; Guo, P.; Lin, W. Chartarlactams A–P, Phenylspirodrimanes from the Sponge-Associated Fungus Stachybotrys chartarum with Antihyperlipidemic Activities. J. Nat. Prod. 2014, 77, 138–147. [Google Scholar] [CrossRef] [PubMed]
  17. Nakamura, M.; Ito, Y.; Ogawa, K.; Michisuji, Y.; Sato, S.-I.; Takada, M.; Hayashi, M.; Yaginuma, S.; Yamamoto, S. Stachybocins, Novel Endothelin Receptor Antagonists, Produced by Stachybotrys sp. M6222. I. Taxonomy, Fermentation, Isolation and Characterization. J. Antibiot. 1995, 48, 1389–1395. [Google Scholar] [CrossRef] [Green Version]
  18. Wu, B.; Oesker, V.; Wiese, J.; Malien, S.; Schmaljohann, R.; Imhoff, J.F. Spirocyclic Drimanes from the Marine Fungus Stachybotrys sp. Strain MF347. Mar. Drugs 2014, 12, 1924–1938. [Google Scholar] [CrossRef] [Green Version]
  19. Roggo, B.E.; Hug, P.; Moss, S.; Stämpfli, A.; Kriemler, H.-P.; Peter, H.H. Novel Spirodihydrobenzofuranlactams as Antagonists of Endothelin and as Inhibitors of HIV-1 Protease Produced by Stachybotrys sp. II. Structure Determination. J. Antibiot. 1996, 49, 374–379. [Google Scholar] [CrossRef] [Green Version]
  20. Liu, J.; Jia, X.; Zhao, J.; Feng, J.; Chen, M.; Chen, R.; Xie, K.; Chen, D.; Li, Y.; Zhang, D.; et al. Bistachybotrysins L–V, Bioactive Phenylspirodrimane Dimers from the Fungus Stachybotrys chartarum. Org. Chem. Front. 2020, 7, 531–542. [Google Scholar] [CrossRef]
  21. Ma, X.; Li, L.; Zhu, T.; Ba, M.; Li, G.; Gu, Q.; Guo, Y.; Li, D. Phenylspirodrimanes with Anti-HIV Activity from the Sponge-Derived Fungus Stachybotrys Chartarum MXH-X73. J. Nat. Prod. 2013, 76, 2298–2306. [Google Scholar] [CrossRef]
  22. Zhao, J.; Feng, J.; Tan, Z.; Liu, J.; Zhao, J.; Chen, R.; Xie, K.; Zhang, D.; Li, Y.; Yu, L.; et al. Stachybotrysins A–G, Phenylspirodrimane Derivatives from the Fungus Stachybotrys chartarum. J. Nat. Prod. 2017, 80, 1819–1826. [Google Scholar] [CrossRef]
  23. Giugliano, F.; Crimini, E.; Tarantino, P.; Zagami, P.; Uliano, J.; Corti, C.; Trapani, D.; Curigliano, G.; Ascierto, P.A. First Line Treatment of BRAF Mutated Advanced Melanoma: Does One Size Fit All? Cancer Treat. Rev. 2021, 99, 102253. [Google Scholar] [CrossRef] [PubMed]
  24. Al Hamad, M. Contribution of BCR-ABL Molecular Variants and Leukemic Stem Cells in Response and Resistance to Tyrosine Kinase Inhibitors: A Review. F1000Research 2021, 10, 1288. [Google Scholar] [CrossRef] [PubMed]
  25. Morales, S.; Gasol, A.; Sanchez, D.R. Her2-Positive Cancers and Antibody-Based Treatment: State of the Art and Future Developments. Cancers 2021, 13, 5771. [Google Scholar] [CrossRef] [PubMed]
  26. Comandone, A.; Vana, F.; Comandone, T.; Tucci, M. Antiangiogenic Therapy in Clear Cell Renal Carcinoma (CCRC): Pharmacological Basis and Clinical Results. Cancers 2021, 13, 5896. [Google Scholar] [CrossRef]
  27. Moskovitz, J.; Moy, J.; Ferris, R.L. Immunotherapy for Head and Neck Squamous Cell Carcinoma. Curr Oncol Rep 2018, 20, 22. [Google Scholar] [CrossRef] [Green Version]
  28. Motzer, R.J.; Penkov, K.; Haanen, J.; Rini, B.; Albiges, L.; Campbell, M.T.; Venugopal, B.; Kollmannsberger, C.; Negrier, S.; Uemura, M.; et al. Avelumab plus Axitinib versus Sunitinib for Advanced Renal-Cell Carcinoma. N. Engl. J. Med. 2019, 380, 1103–1115. [Google Scholar] [CrossRef]
  29. Rini, B.I.; Plimack, E.R.; Stus, V.; Gafanov, R.; Hawkins, R.; Nosov, D.; Pouliot, F.; Alekseev, B.; Soulières, D.; Melichar, B.; et al. Pembrolizumab plus Axitinib versus Sunitinib for Advanced Renal-Cell Carcinoma. N. Engl. J. Med. 2019, 380, 1116–1127. [Google Scholar] [CrossRef]
  30. Killock, D. Tebentafusp for Uveal Melanoma. Nat. Rev. Clin. Oncol. 2021, 18, 747. [Google Scholar] [CrossRef]
  31. Bovio, E.; Sfecci, E.; Poli, A.; Gnavi, G.; Prigione, V.; Lacour, T.; Mehiri, M.; Varese, G.C. The Culturable Mycobiota Associated with the Mediterranean Sponges Aplysina cavernicola, Crambe crambe and Phorbas tenacior. FEMS Microbiol. Lett. 2019, 366, fnaa014. [Google Scholar] [CrossRef] [PubMed]
  32. Steinert, K.; Berg, N.; Kalinin, D.V.; Jagels, A.; Würthwein, E.-U.; Humpf, H.-U.; Kalinina, S. Semisynthetic Approach toward Biologically Active Derivatives of Phenylspirodrimanes from S. chartarum. ACS Omega 2022, 7, 45215–45230. [Google Scholar] [CrossRef] [PubMed]
  33. Ogawa, K.; Nakamura, M.; Hayashi, M.; Yaginuma, S.; Yamamoto, S.; Furihata, K.; Shin-Ya, K.; Seto, H. Stachybocins, Novel Endothelin Receptor Antagonists, Produced by Stachybotrys sp. M6222. II. Structure Determination of Stachybocins A, B and C. J. Antibiot. 1995, 48, 1396–1400. [Google Scholar] [CrossRef] [Green Version]
  34. Kaiser, K.; Benner, R. Hydrolysis-Induced Racemization of Amino Acids. Limnol. Oceanogr. Methods 2005, 3, 318–325. [Google Scholar] [CrossRef]
  35. Eder, C.; Kurz, M.; Toti, L. Novel Spirobenzofuranlactams and the Derivatives Thereof, Methods for the Production Thereof, and Use Thereof 2004. CA 2508229A1, 1 June 2005. [Google Scholar]
  36. Jarvis, B.B.; Salemme, J.; Morais, A. Stachybotrys Toxins. 1. Nat. Toxins 1995, 3, 10–16. [Google Scholar] [CrossRef] [PubMed]
  37. Ma, X.; Zheng, W.; Sun, K.; Gu, X.; Zeng, X.; Zhang, H.; Zhong, T.; Shao, Z.; Zhang, Y. Two New Phenylspirodrimanes from the Deep-Sea Derived Fungus Stachybotrys sp. MCCC 3A00409. Nat. Prod. Res. 2019, 33, 386–392. [Google Scholar] [CrossRef] [PubMed]
  38. Jagels, A.; Lindemann, V.; Ulrich, S.; Gottschalk, C.; Cramer, B.; Hübner, F.; Gareis, M.; Humpf, H.-U. Exploring Secondary Metabolite Profiles of Stachybotrys spp. by LC-MS/MS. Toxins 2019, 11, 133. [Google Scholar] [CrossRef] [Green Version]
  39. Geris, R.; Simpson, T.J. Meroterpenoids Produced by Fungi. Nat. Prod. Rep. 2009, 26, 1063–1094. [Google Scholar] [CrossRef] [Green Version]
  40. Yin, Y.; Fu, Q.; Wu, W.; Cai, M.; Zhou, X.; Zhang, Y. Producing Novel Fibrinolytic Isoindolinone Derivatives in Marine Fungus Stachybotrys longispora FG216 by the Rational Supply of Amino Compounds According to Its Biosynthesis Pathway. Mar. Drugs 2017, 15, 214. [Google Scholar] [CrossRef] [Green Version]
  41. Zhang, P.; Li, Y.; Jia, C.; Lang, J.; Niaz, S.-I.; Li, J.; Yuan, J.; Yu, J.; Chen, S.; Liu, L. Antiviral and Anti-Inflammatory Meroterpenoids: Stachybonoids A–F from the Crinoid-Derived Fungus Stachybotrys chartarum 952. RSC Adv. 2017, 7, 49910–49916. [Google Scholar] [CrossRef] [Green Version]
  42. Augner, D.; Gerbino, D.C.; Slavov, N.; Neudörfl, J.-M.; Schmalz, H.-G. N-Capping of Primary Amines with 2-Acyl-Benzaldehydes to Give Isoindolinones. Org. Lett. 2011, 13, 5374–5377. [Google Scholar] [CrossRef] [PubMed]
  43. Keller, N.P.; Hohn, T.M. Metabolic Pathway Gene Clusters in Filamentous Fungi. Fungal Genet. Biol. 1997, 21, 17–29. [Google Scholar] [CrossRef] [Green Version]
  44. Nothias, L.-F.; Petras, D.; Schmid, R.; Dührkop, K.; Rainer, J.; Sarvepalli, A.; Protsyuk, I.; Ernst, M.; Tsugawa, H.; Fleischauer, M.; et al. Feature-Based Molecular Networking in the GNPS Analysis Environment. Nat. Methods 2020, 17, 905–908. [Google Scholar] [CrossRef] [PubMed]
  45. Pluskal, T.; Castillo, S.; Villar-Briones, A.; Orešič, M. MZmine 2: Modular Framework for Processing, Visualizing, and Analyzing Mass Spectrometry-Based Molecular Profile Data. BMC Bioinform. 2010, 11, 395. [Google Scholar] [CrossRef] [PubMed] [Green Version]
  46. Zhao, J.; Liu, J.; Shen, Y.; Tan, Z.; Zhang, M.; Chen, R.; Zhao, J.; Zhang, D.; Yu, L.; Dai, J. Stachybotrysams A–E, Prenylated Isoindolinone Derivatives with Anti-HIV Activity from the Fungus Stachybotrys chartarum. Phytochem. Lett. 2017, 20, 289–294. [Google Scholar] [CrossRef]
  47. Chunyu, W.-X.; Ding, Z.-G.; Li, M.-G.; Zhao, J.-Y.; Gu, S.-J.; Gao, Y.; Wang, F.; Ding, J.-H.; Wen, M.-L. Stachartins A–E, Phenylspirodrimanes from the Tin Mine Tailings-Associated Fungus Stachybotrys chartarum. Helv. Chim. Acta 2016, 99, 583–587. [Google Scholar] [CrossRef]
  48. Feng, J.-M.; Li, M.; Zhao, J.-L.; Jia, X.-N.; Liu, J.-M.; Zhang, M.; Chen, R.-D.; Xie, K.-B.; Chen, D.-W.; Yu, H.-B.; et al. Three New Phenylspirodrimane Derivatives with Inhibitory Effect towards Potassium Channel Kv1.3 from the Fungus Stachybotrys chartarum. J. Asian Nat. Prod. Res. 2019, 21, 887–894. [Google Scholar]
  49. Yang, B.; Long, J.; Pang, X.; Lin, X.; Liao, S.; Wang, J.; Zhou, X.; Li, Y.; Liu, Y. Structurally Diverse Polyketides and Phenylspirodrimanes from the Soft Coral-Associated Fungus Stachybotrys chartarum SCSIO41201. J. Antibiot. 2021, 74, 190–198. [Google Scholar] [CrossRef]
  50. Dufies, M.; Grytsai, O.; Ronco, C.; Camara, O.; Ambrosetti, D.; Hagege, A.; Parola, J.; Mateo, L.; Ayrault, M.; Giuliano, S.; et al. New CXCR1/CXCR2 Inhibitors Represent an Effective Treatment for Kidney or Head and Neck Cancers Sensitive or Refractory to Reference Treatments. Theranostics 2019, 9, 5332–5346. [Google Scholar] [CrossRef]
  51. Wang, M.; Carver, J.J.; Phelan, V.V.; Sanchez, L.M.; Garg, N.; Peng, Y.; Nguyen, D.D.; Watrous, J.; Kapono, C.A.; Luzzatto-Knaan, T.; et al. Sharing and Community Curation of Mass Spectrometry Data with Global Natural Products Social Molecular Networking. Nat. Biotechnol. 2016, 34, 828–837. [Google Scholar] [CrossRef] [Green Version]
  52. Shannon, P.; Markiel, A.; Ozier, O.; Baliga, N.S.; Wang, J.T.; Ramage, D.; Amin, N.; Schwikowski, B.; Ideker, T. Cytoscape: A Software Environment for Integrated Models of Biomolecular Interaction Networks. Genome Res. 2003, 13, 2498–2504. [Google Scholar] [CrossRef] [PubMed]
  53. Frisch, M.J.; Trucks, G.W.; Schlegel, H.B.; Scuseria, G.E.; Robb, M.A.; Cheeseman, J.R.; Scalmani, G.; Barone, V.; Petersson, G.A.; Nakatsuji, H.; et al. Gaussian 16 Rev. C.01 2016; Gaussian Inc.: Wallingford, CT, USA, 2016. [Google Scholar]
  54. Gioanni, J.; Fischel, J.-L.; Lambert, J.-C.; Demard, F.; Mazeau, C.; Zanghellini, E.; Ettore, F.; Formento, P.; Chauvel, P.; Lalanne, C.-M.; et al. Two New Human Tumor Cell Lines Derived from Squamous Cell Carcinomas of the Tongue: Establishment, Characterization and Response to Cytotoxic Treatment. Eur. J. Cancer Clin. Oncol. 1988, 24, 1445–1455. [Google Scholar] [CrossRef]
  55. Hagege, A.; Saada-Bouzid, E.; Ambrosetti, D.; Rastoin, O.; Boyer, J.; He, X.; Rousset, J.; Montemagno, C.; Doyen, J.; Pedeutour, F.; et al. Targeting of C-MET and AXL by Cabozantinib Is a Potential Therapeutic Strategy for Patients with Head and Neck Cell Carcinoma. Cell Rep. Med. 2022, 3, 100659. [Google Scholar] [CrossRef] [PubMed]
  56. Dufies, M.; Giuliano, S.; Ambrosetti, D.; Claren, A.; Ndiaye, P.D.; Mastri, M.; Moghrabi, W.; Cooley, L.S.; Ettaiche, M.; Chamorey, E.; et al. Sunitinib Stimulates Expression of VEGFC by Tumor Cells and Promotes Lymphangiogenesis in Clear Cell Renal Cell Carcinomas. Cancer Res. 2017, 77, 1212–1226. [Google Scholar] [CrossRef] [PubMed] [Green Version]
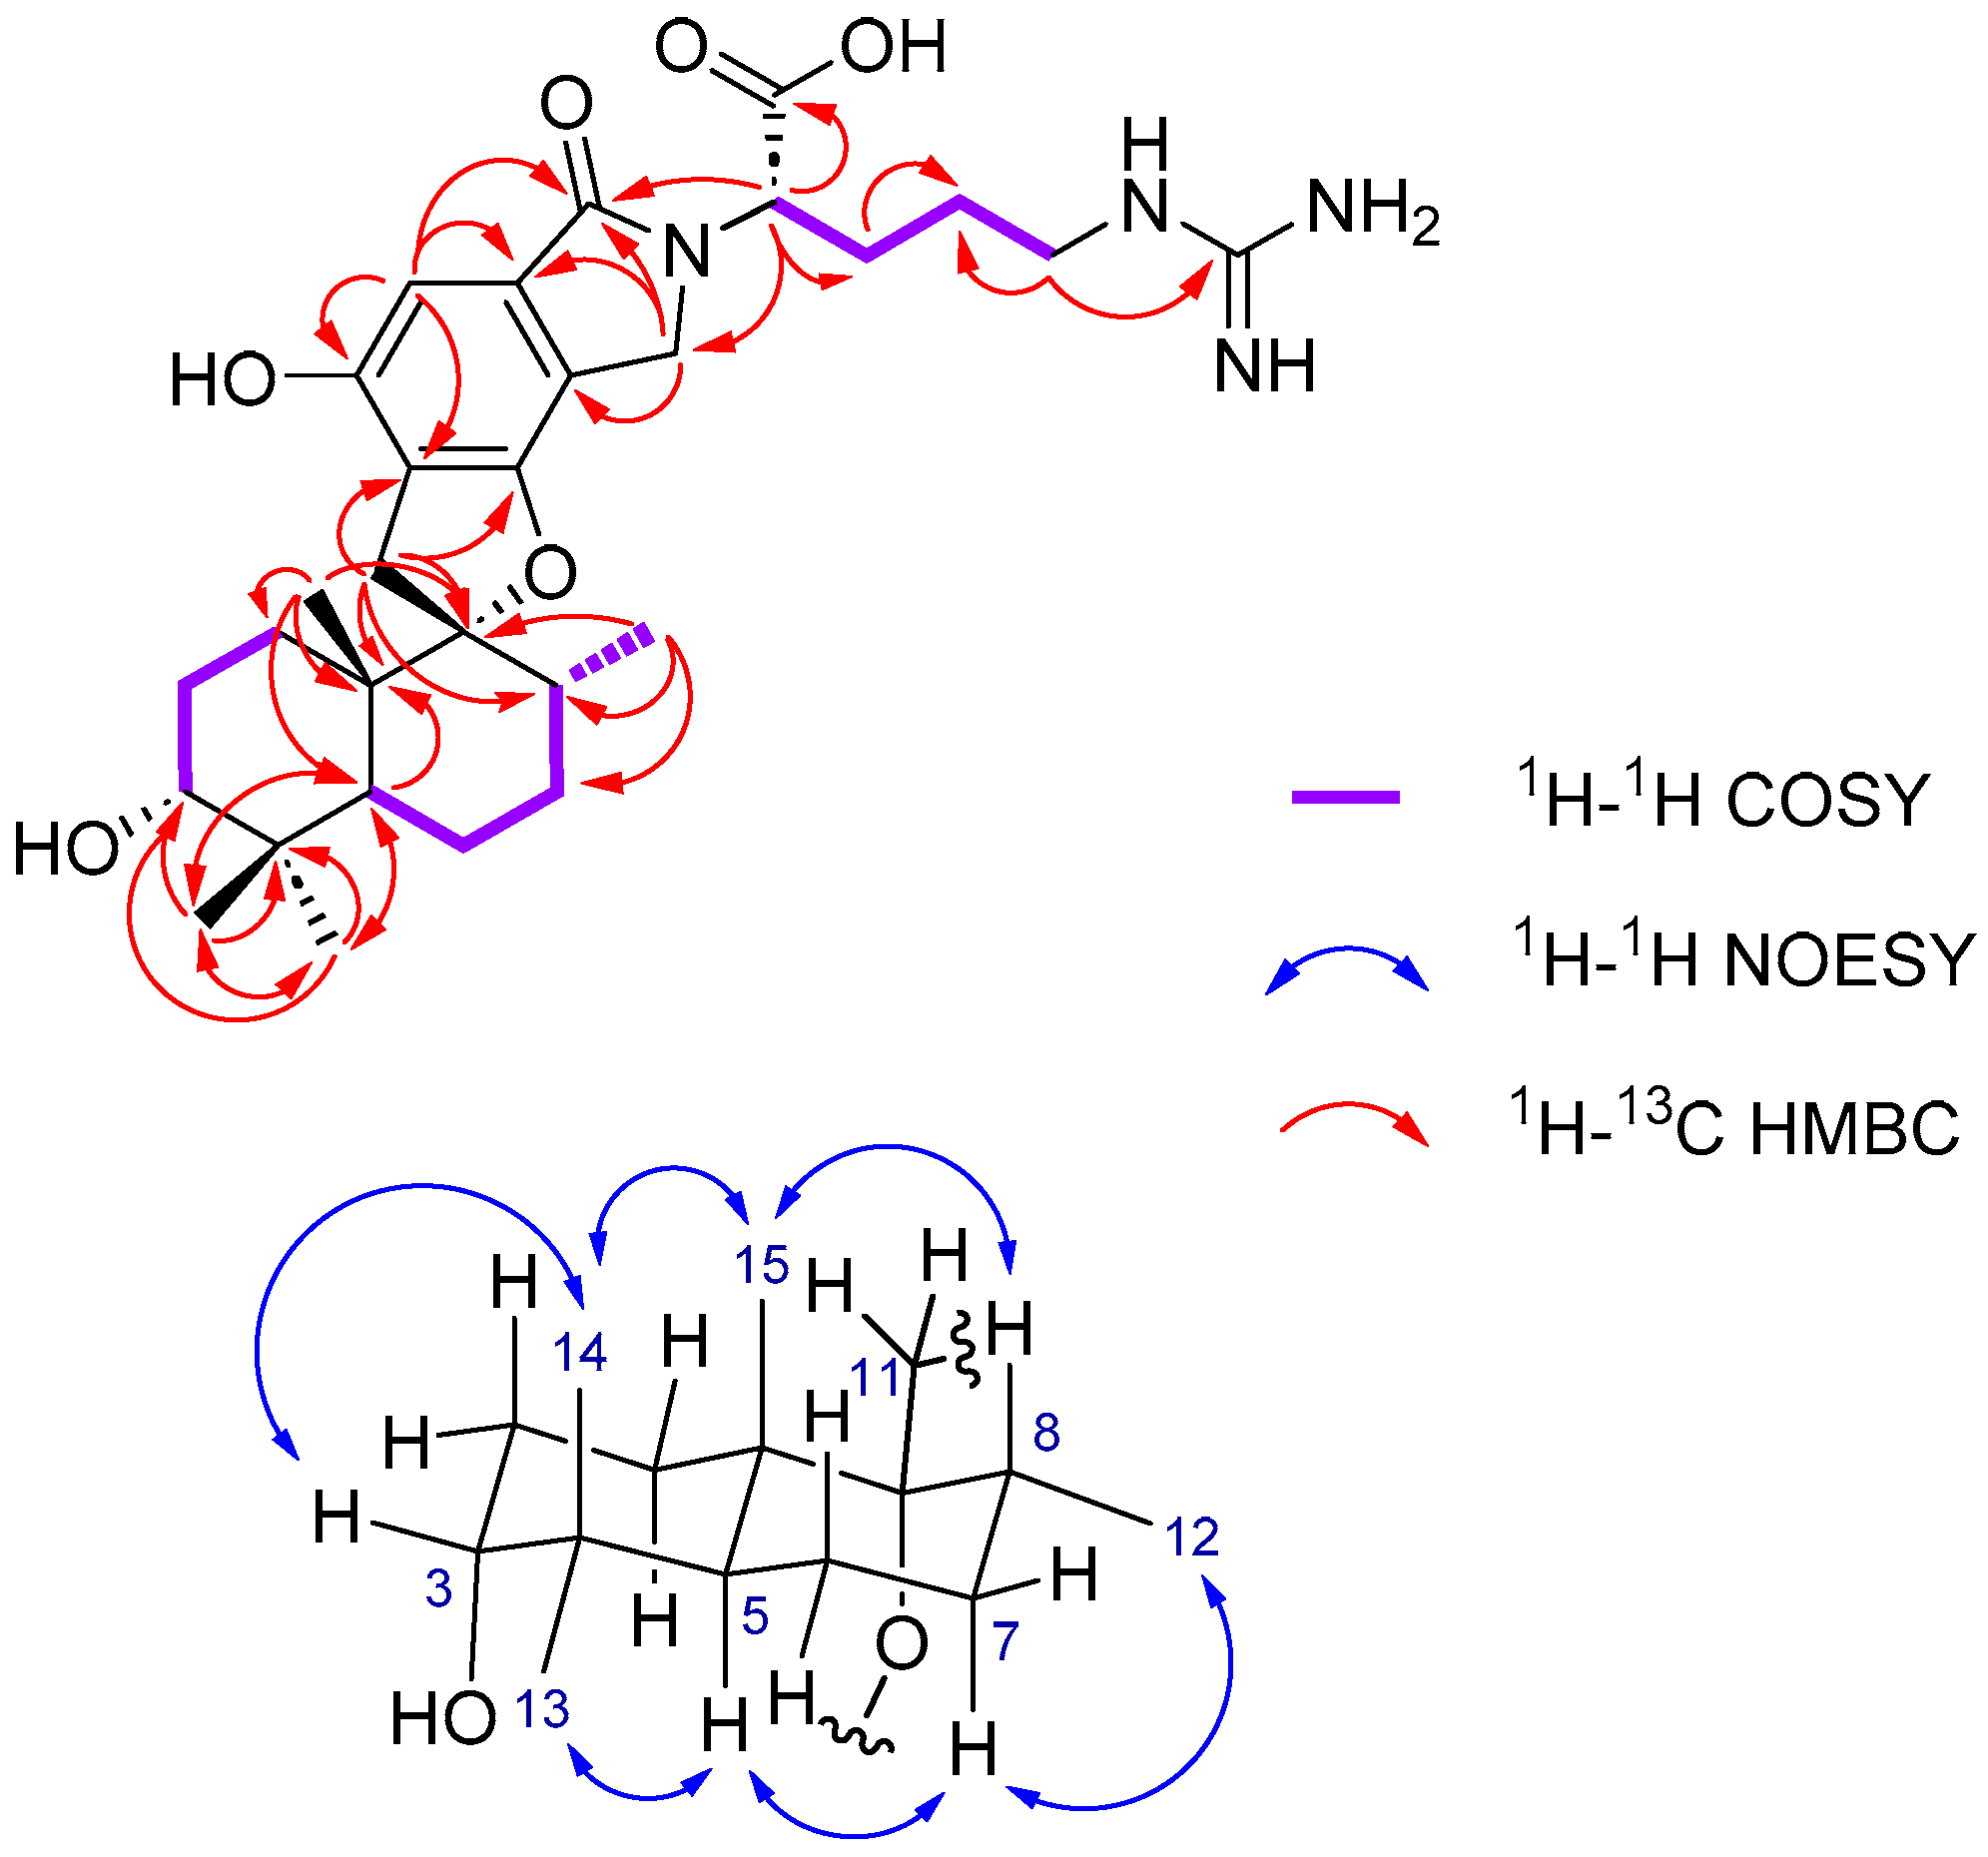
Figure 1. Chemical structure of the isolated compounds 110 (represented in their neutral form).
Marinedrugs 21 00135 g001aMarinedrugs 21 00135 g001b
Figure 2. Key 2D NMR correlations for stachybotrin J (1).
Marinedrugs 21 00135 g002
Figure 3. Experimental CD spectra for stachybotrin J (1), stachybocin G (2), and stachybotrin I (3) and Boltzmann-averaged TD-DFT calculated ECD spectra for 1a (2″S 3R, 5S, 8R, 9R, 10S), 1b (2″R, 3R, 5S, 8R, 9R, 10S), 2a (2″S, 10R, 10′R, 13R, 13′R, 14S, 14′S, 15S, 15′S, 18R, 18′R), 2b (2″R, 10R, 10′R, 13R, 13′R, 14S, 14′S, 15S, 15′S, 18R, 18′R), 3a (2″S, 3R, 5S, 8R, 9R, 10S), and 3b (2″R, 3R, 5S, 8R, 9R, 10S).
Marinedrugs 21 00135 g003
Figure 4. Key 2D NMR correlations for the connecting unit of the dimer stachybocin G (2).
Marinedrugs 21 00135 g004
Figure 5. Plausible biogenetic pathway of compounds 110 isolated from S. chartarum MUT 3308.
Marinedrugs 21 00135 g005
Figure 6. Feature-Based Molecular Network analysis of the crude solid culture extract and the liquid culture filtrate crude extract of S. chartarum MUT 3308 (common fragment number: 6; similarity score: 0.6). Nodes are shown as pie charts to reflect the relative abundance of each ion in each of the extracts. Node size represents the total sum of the precursor ion intensity in the MS1 scan. Edge thickness corresponds to relative cosine score similarity between nodes. The annotated cluster is enlarged. Isolated molecules are in blue, new molecules are in red, and proposed molecules in black or purple if several nodes could be matched to them.
Marinedrugs 21 00135 g006
Table 1. 1D and 2D NMR data (500/125 MHz, CD3OD) for stachybotrin J (1).
δC (ppm)/Mult.δH (ppm)/Mult./J(Hz)1H-1H COSY1H-13C HMBC
1α25.3, CH21.09, m1β, 2, 15-
1β1.90, m1α, 2, 15
222.1, CH21.56, m1α, 1β, 3-
376.3, CH3.33, s--
438.5, C---
541.3, CH2.15, m6α, 6β13, 14
6α26.1, CH1.90, m5, 7-
6β1.56, m
732.3, CH21.56, m6α, 6β-
838.6, CH1.90, m7, 12-
999.7, C---
1043.5, C---
11α33.0, CH3.24, d, 16.911β8, 9, 10, 1′, 6′
11β2.86, d, 16.911α
1216.0, CH30.74, d, 6.587, 8, 9
1329.0, CH30.98, s-3, 4, 5, 14
1423.0, CH30.89, s-3, 4, 5, 13
1516.6, CH31.06, s1α, 1β1, 5, 9, 10
1′118.7, C---
2′155.1, C---
3′102.1, CH6.69, s-1′, 2′, 4′, 7′
4′114.9, C---
5′135.1, C---
6′157.6, C---
7′171.7, C---
8′a45.9, CH4.74, d, 17.28′b4′, 5′, 7′
8′b4.29, d, 17.28′a
1″170.3, C---
2″57.6, CH4.76, m3″a, 3″b7′, 8′, 1″, 3″
3″a28.8, CH22.15, m2″, 4″4″
3″b1.90, m
4″27.2, CH21.56, m3″a, 3″b, 5″-
5″41.9, CH23.24, m4″4″, 6″
6″158.6, C---
Table 2. Antiproliferative activities (IC50 (µM)) of compounds 110 on human cancer cell lines.
IC50 (μM)
MoleculeMP41786786RCAL33CAL33RR
1>100100>10020 ± 4100 ± 7
2>10085 ± 7>10030 ± 4>100
3>100>100>10040 ± 497 ± 5
4>10020 ± 480 ± 640 ± 4100 ± 7
5<10.7 ± 0.10.8 ± 0.20.3 ± 0.10.6 ± 0.2
60.6 ± 0.11.5 ± 0.22.2 ± 0.30.6 ± 0.11.0 ± 0.2
70.4 ± 0.10.8 ± 0.22.2 ± 0.40.4 ± 0.10.7 ± 0.2
850 ± 5>10074 ± 55 ± 597 ± 5
9>10060 ± 6>10030 ± 369 ± 6
10>10030 ± 675 ± 535 ± 497 ± 6
cisplatin---1.5 ± 0.3>10 ± 1
sunitinib-2.5 ± 0.5>10 ± 1--
Disclaimer/Publisher’s Note: The statements, opinions and data contained in all publications are solely those of the individual author(s) and contributor(s) and not of MDPI and/or the editor(s). MDPI and/or the editor(s) disclaim responsibility for any injury to people or property resulting from any ideas, methods, instructions or products referred to in the content.

