
Structural Characterization of Maitotoxins Produced by Toxic Gambierdiscus Species

 , ,
, ,  , , and
Abstract
:
1. Introduction
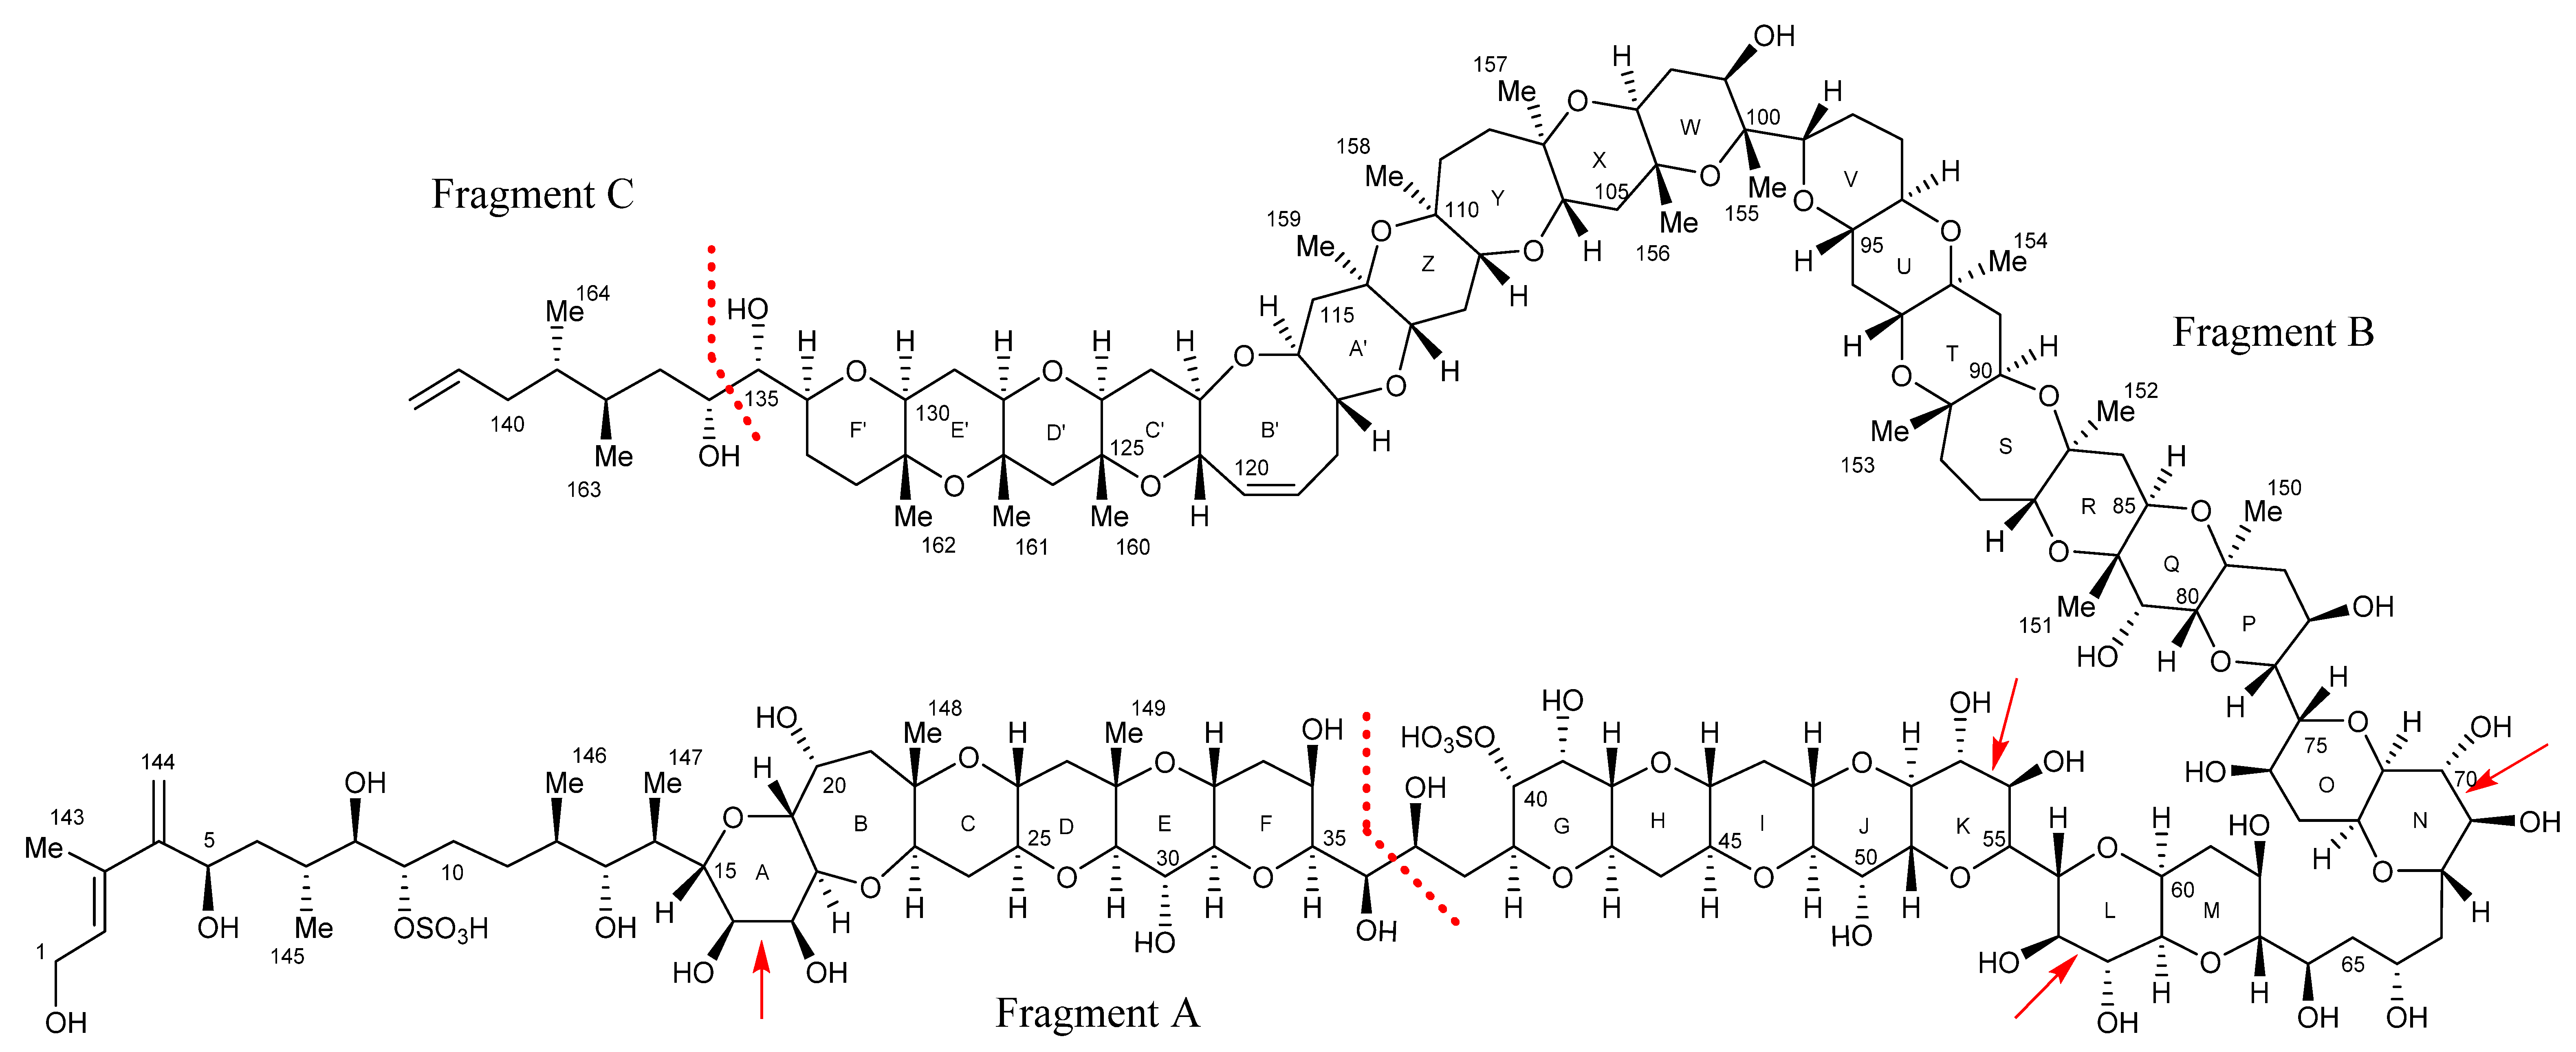
2. Results
2.1. Purification of Maitotoxins
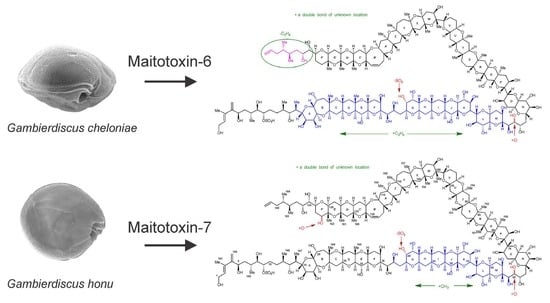
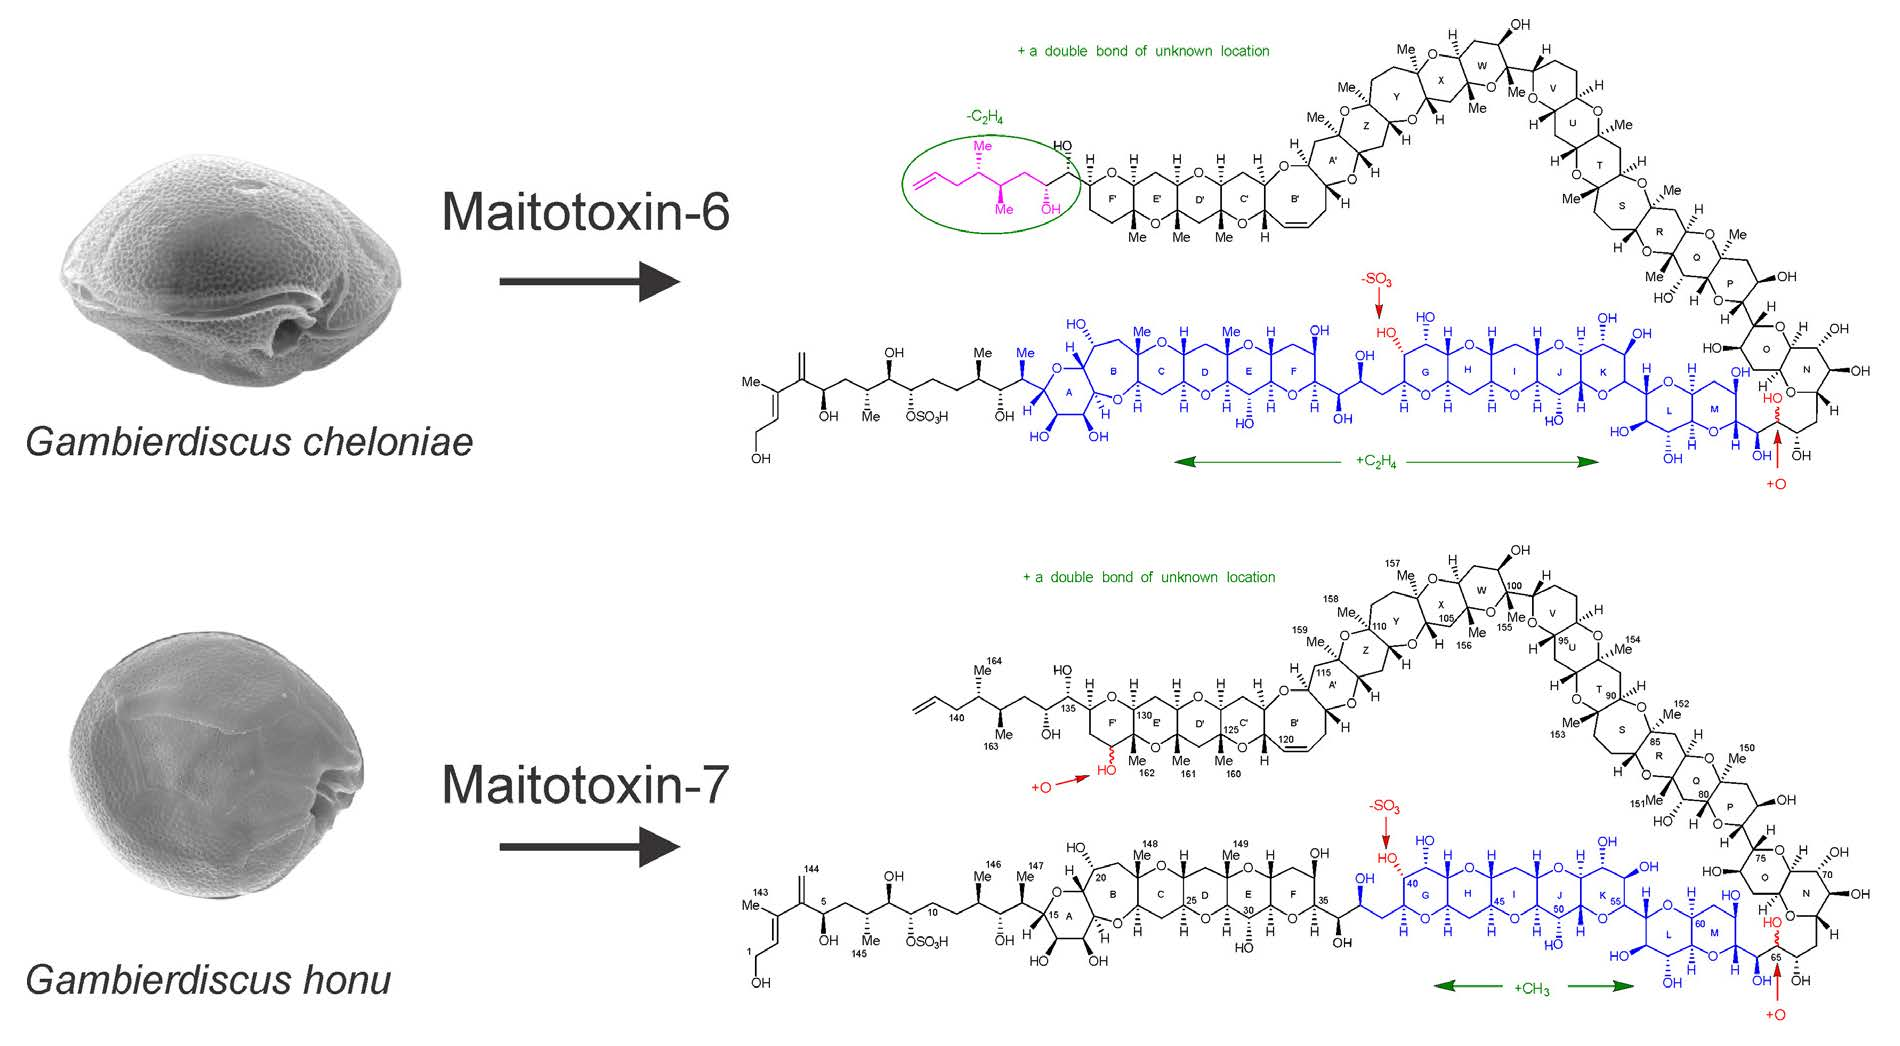
2.1.1. Maitotoxin-6
2.1.2. Maitotoxin-7
2.2. Liquid Chromatography–Mass Spectrometer Analysis of Intact Maitotoxins
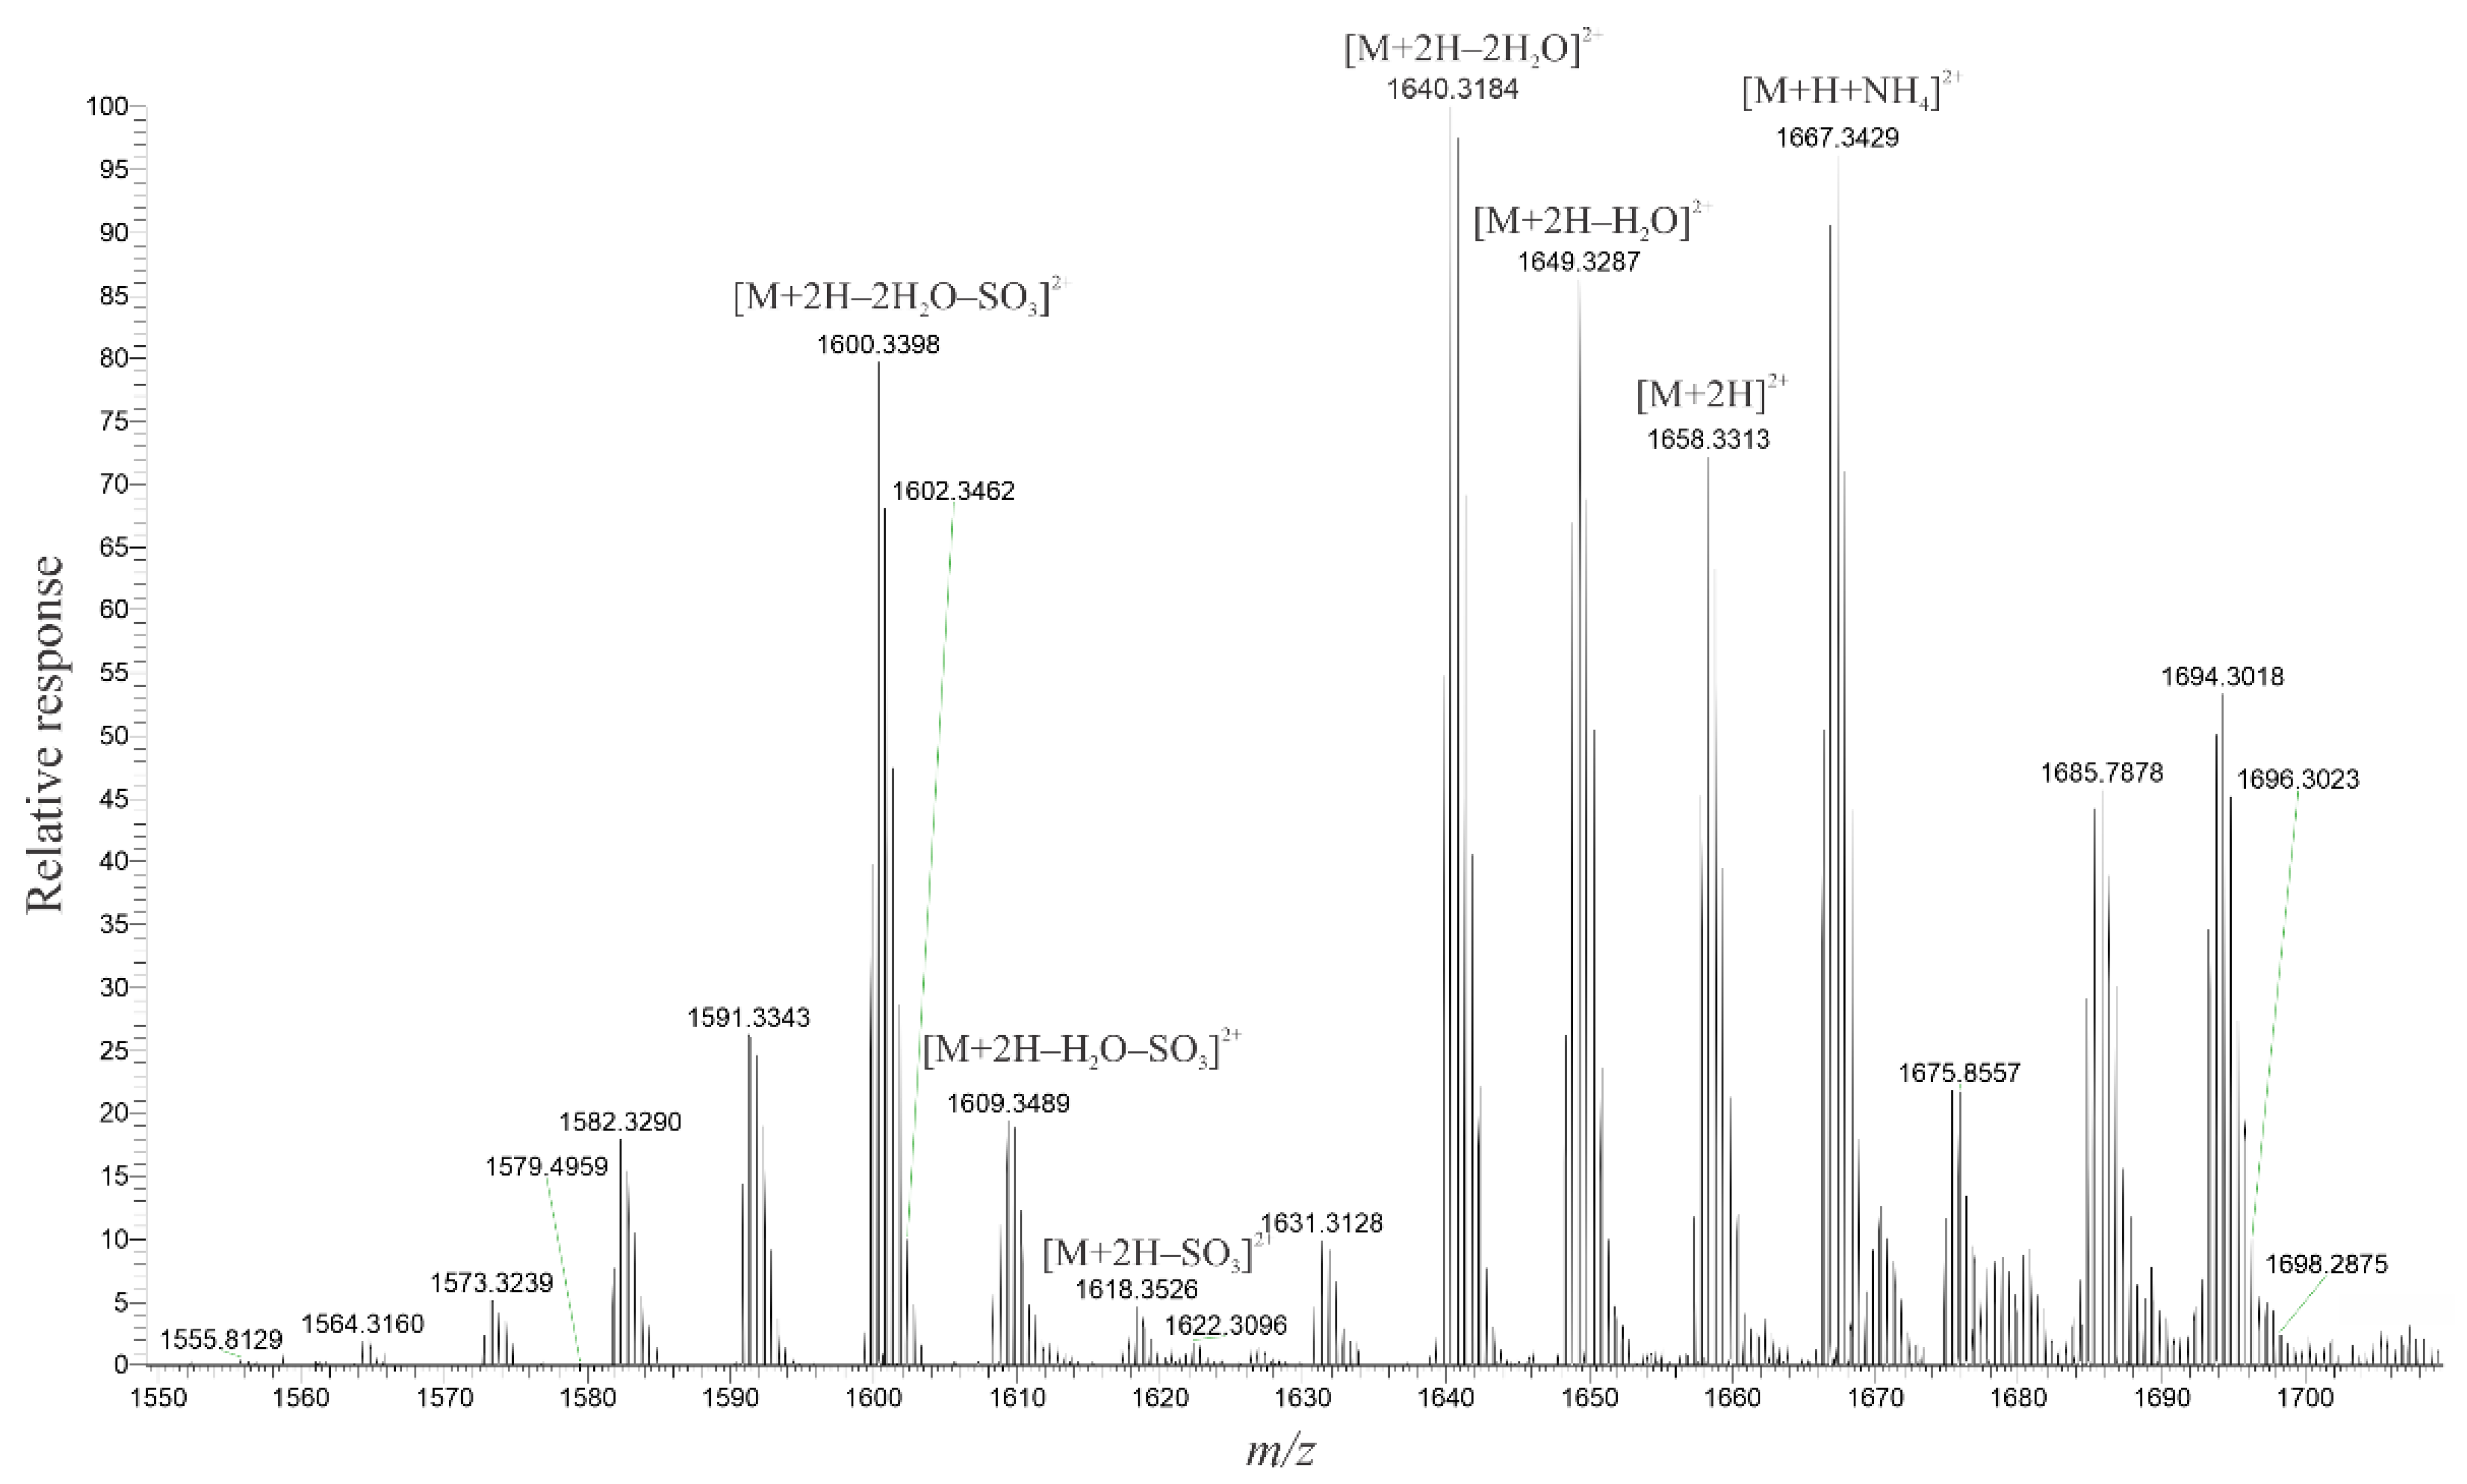
2.3. High-Resolution Mass Spectrometer Analysis of Intact Maitotoxins
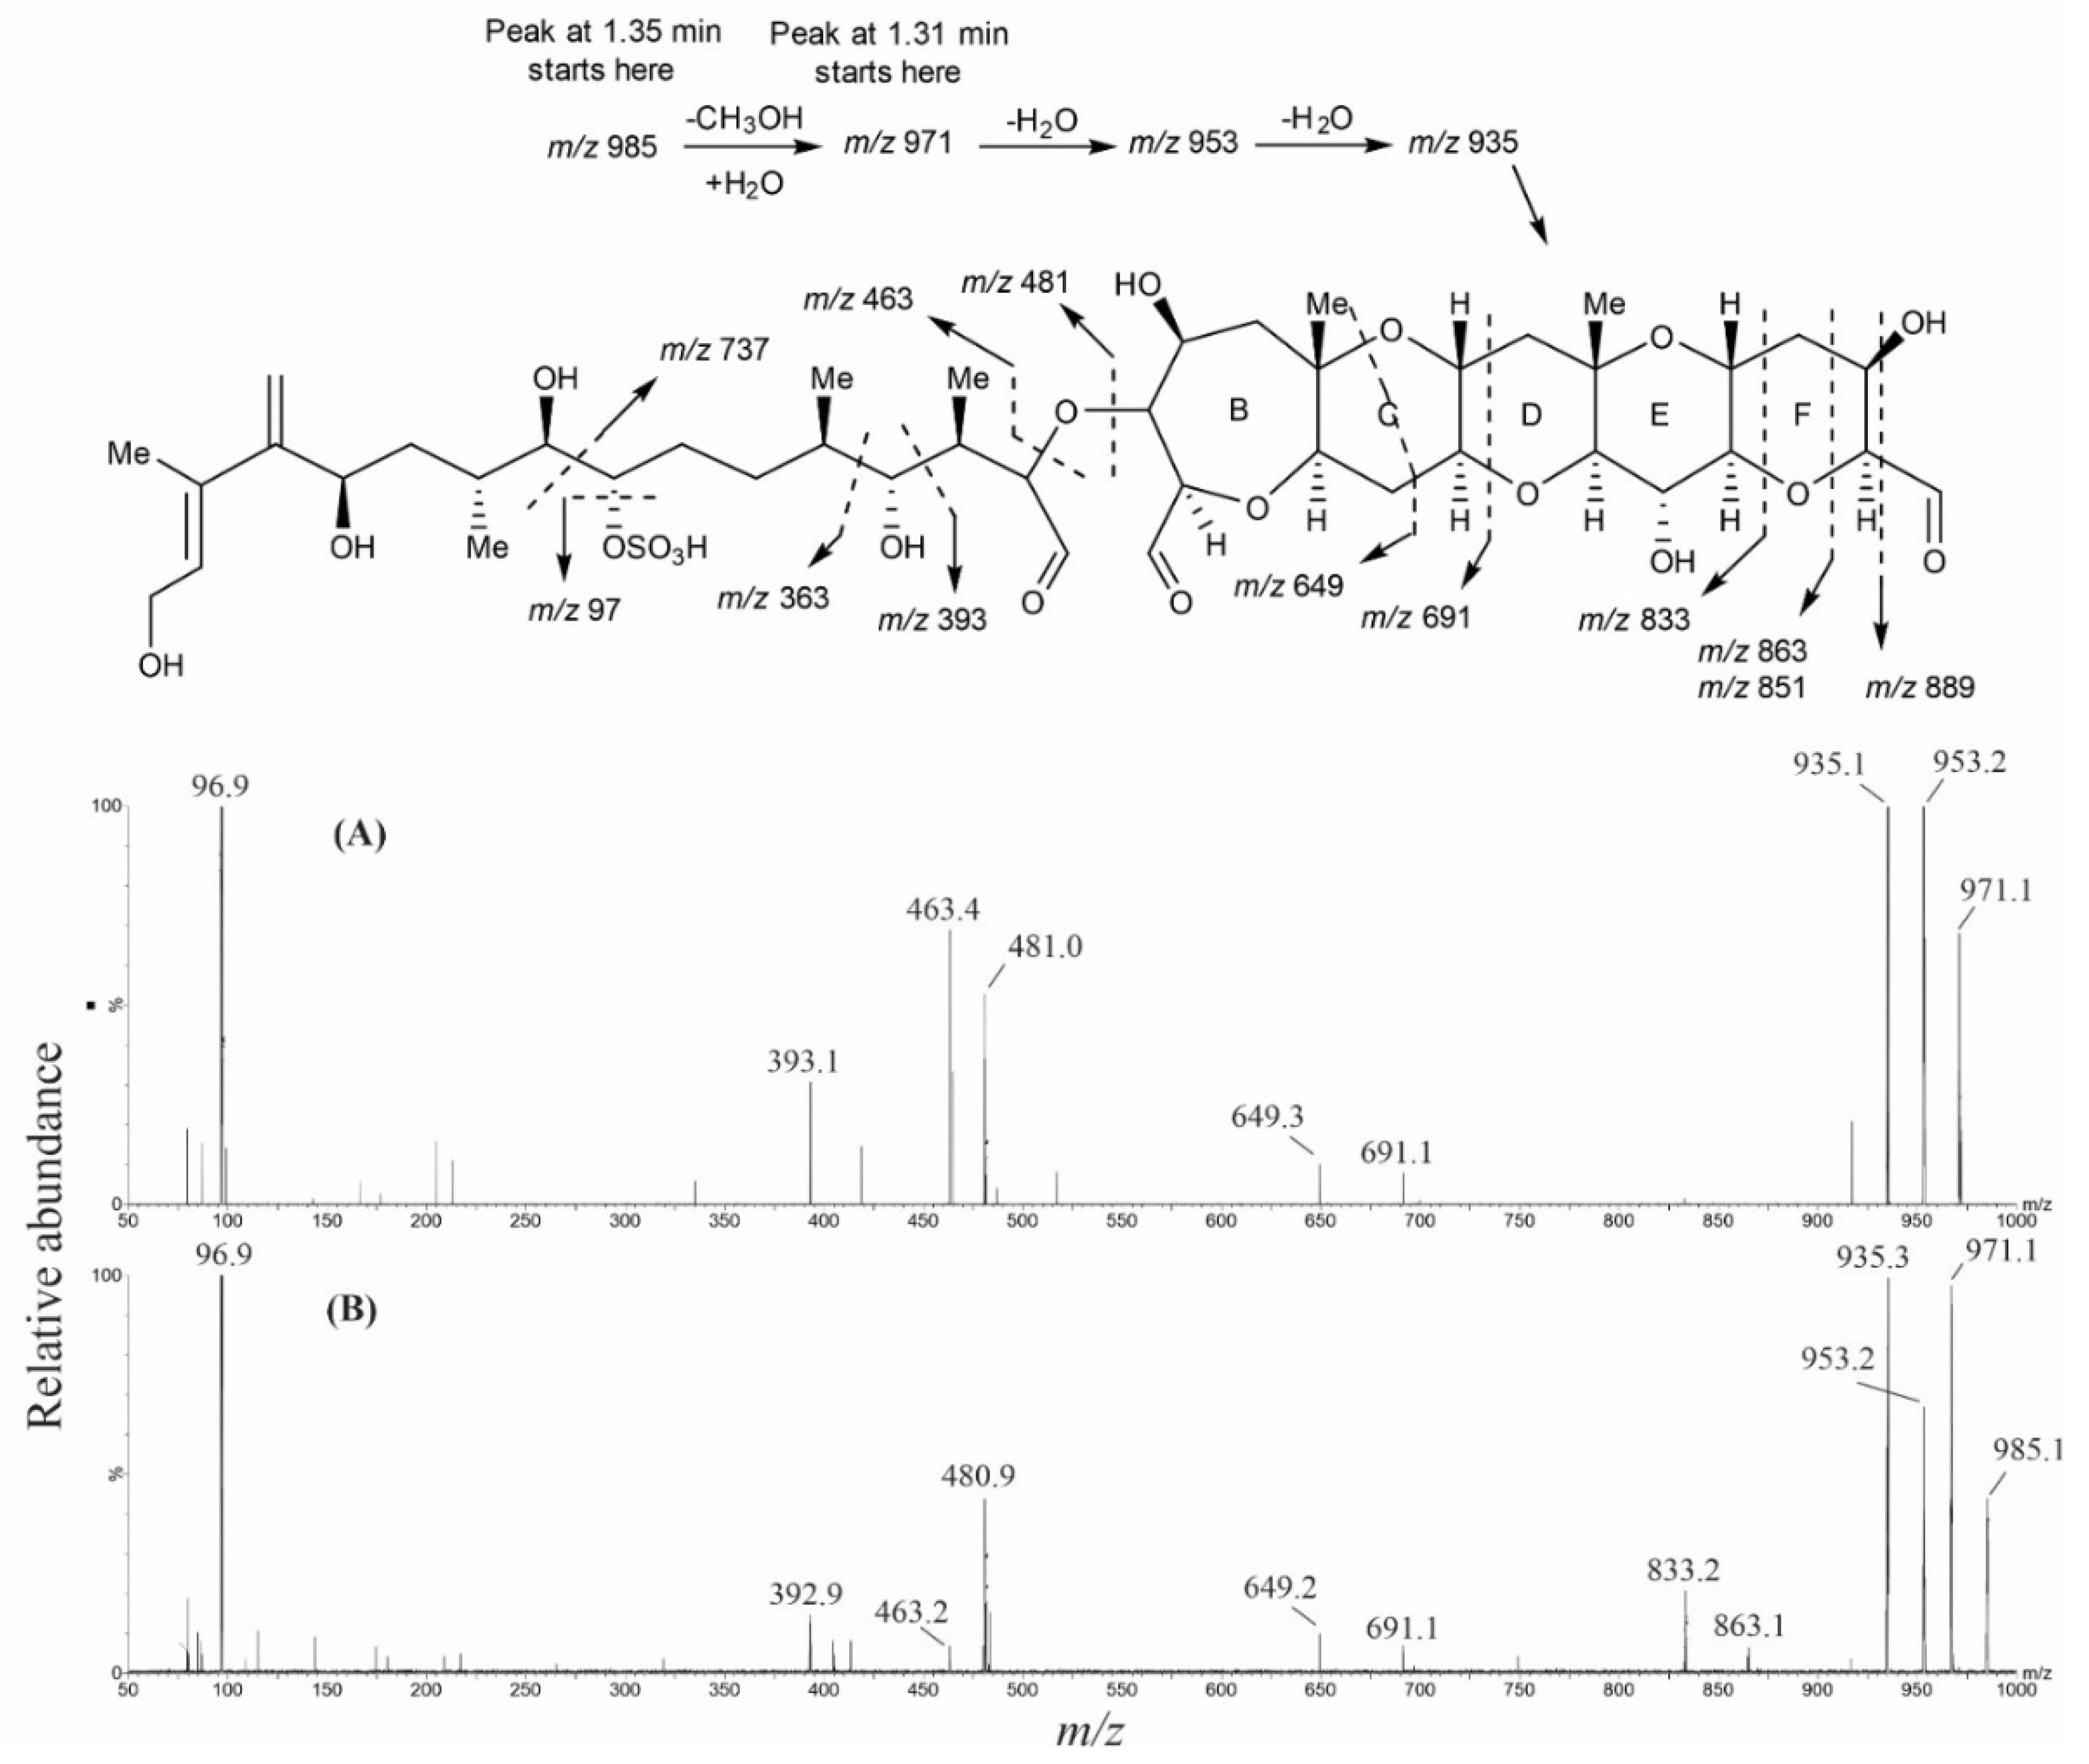
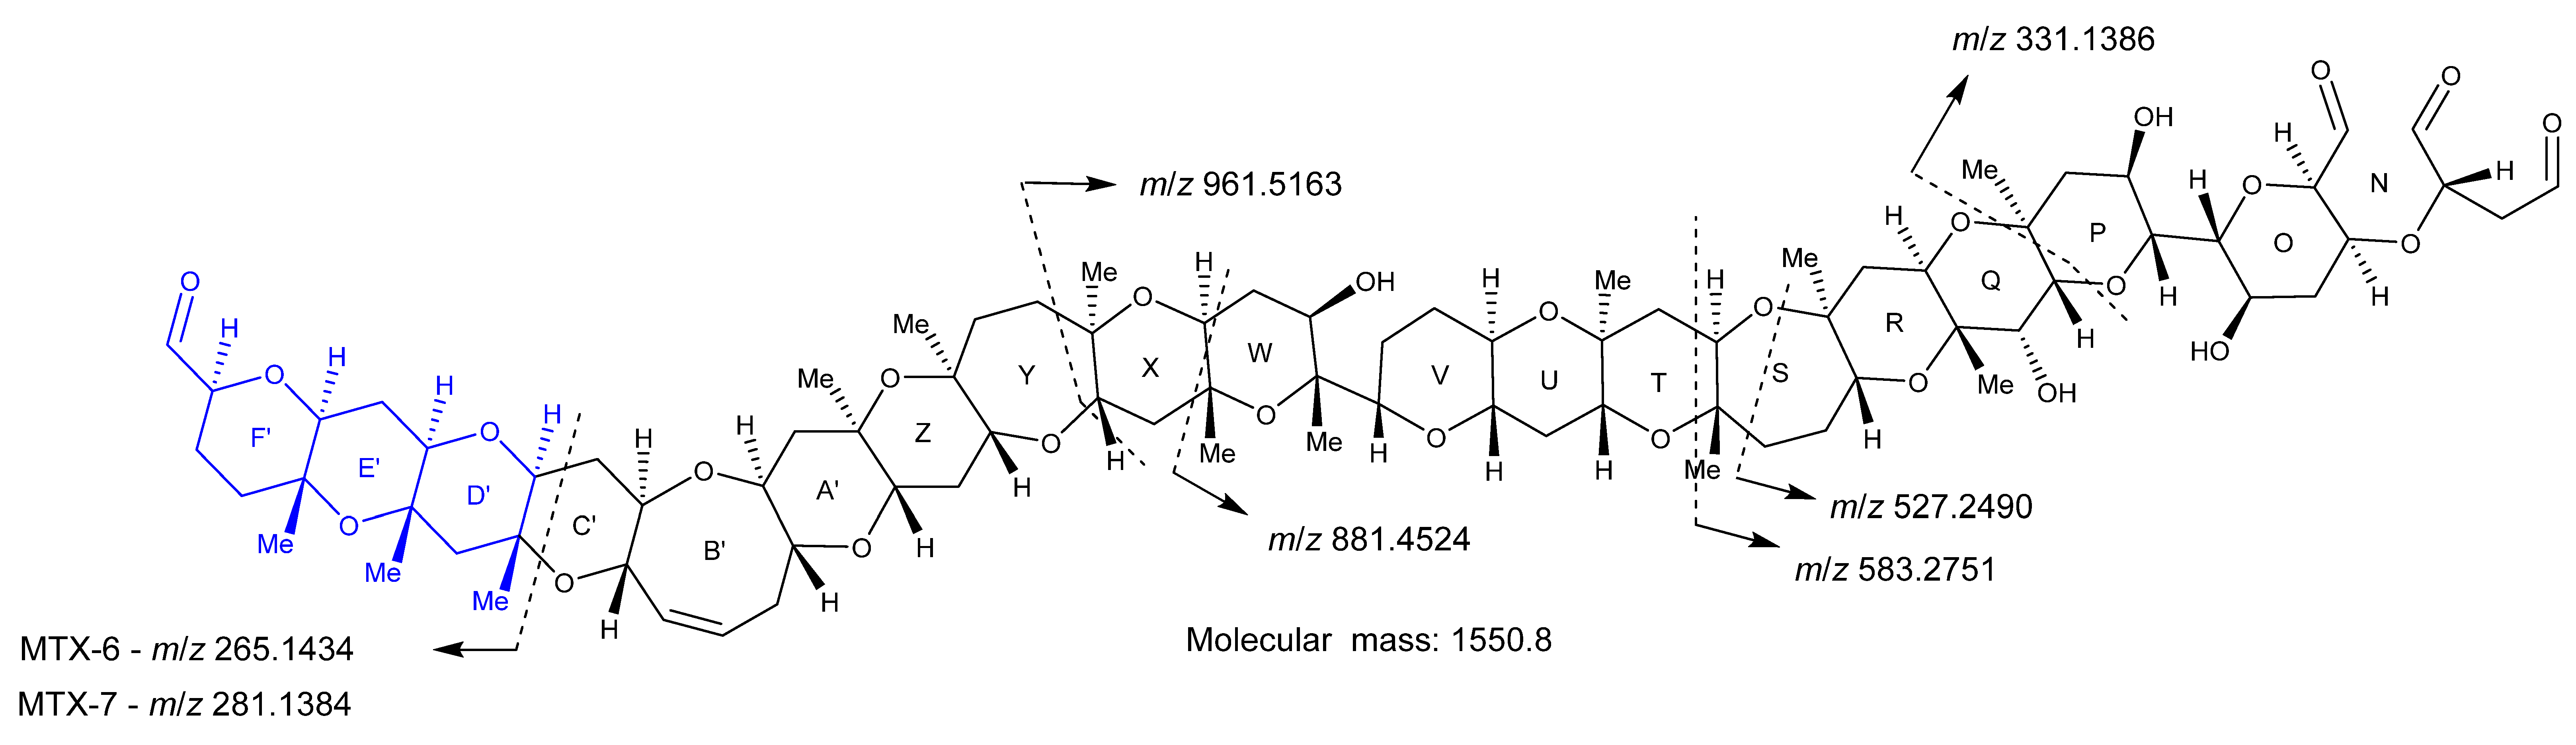
2.4. Oxidative Cleavage
2.5. Reduction of the Oxidative Cleavage Products
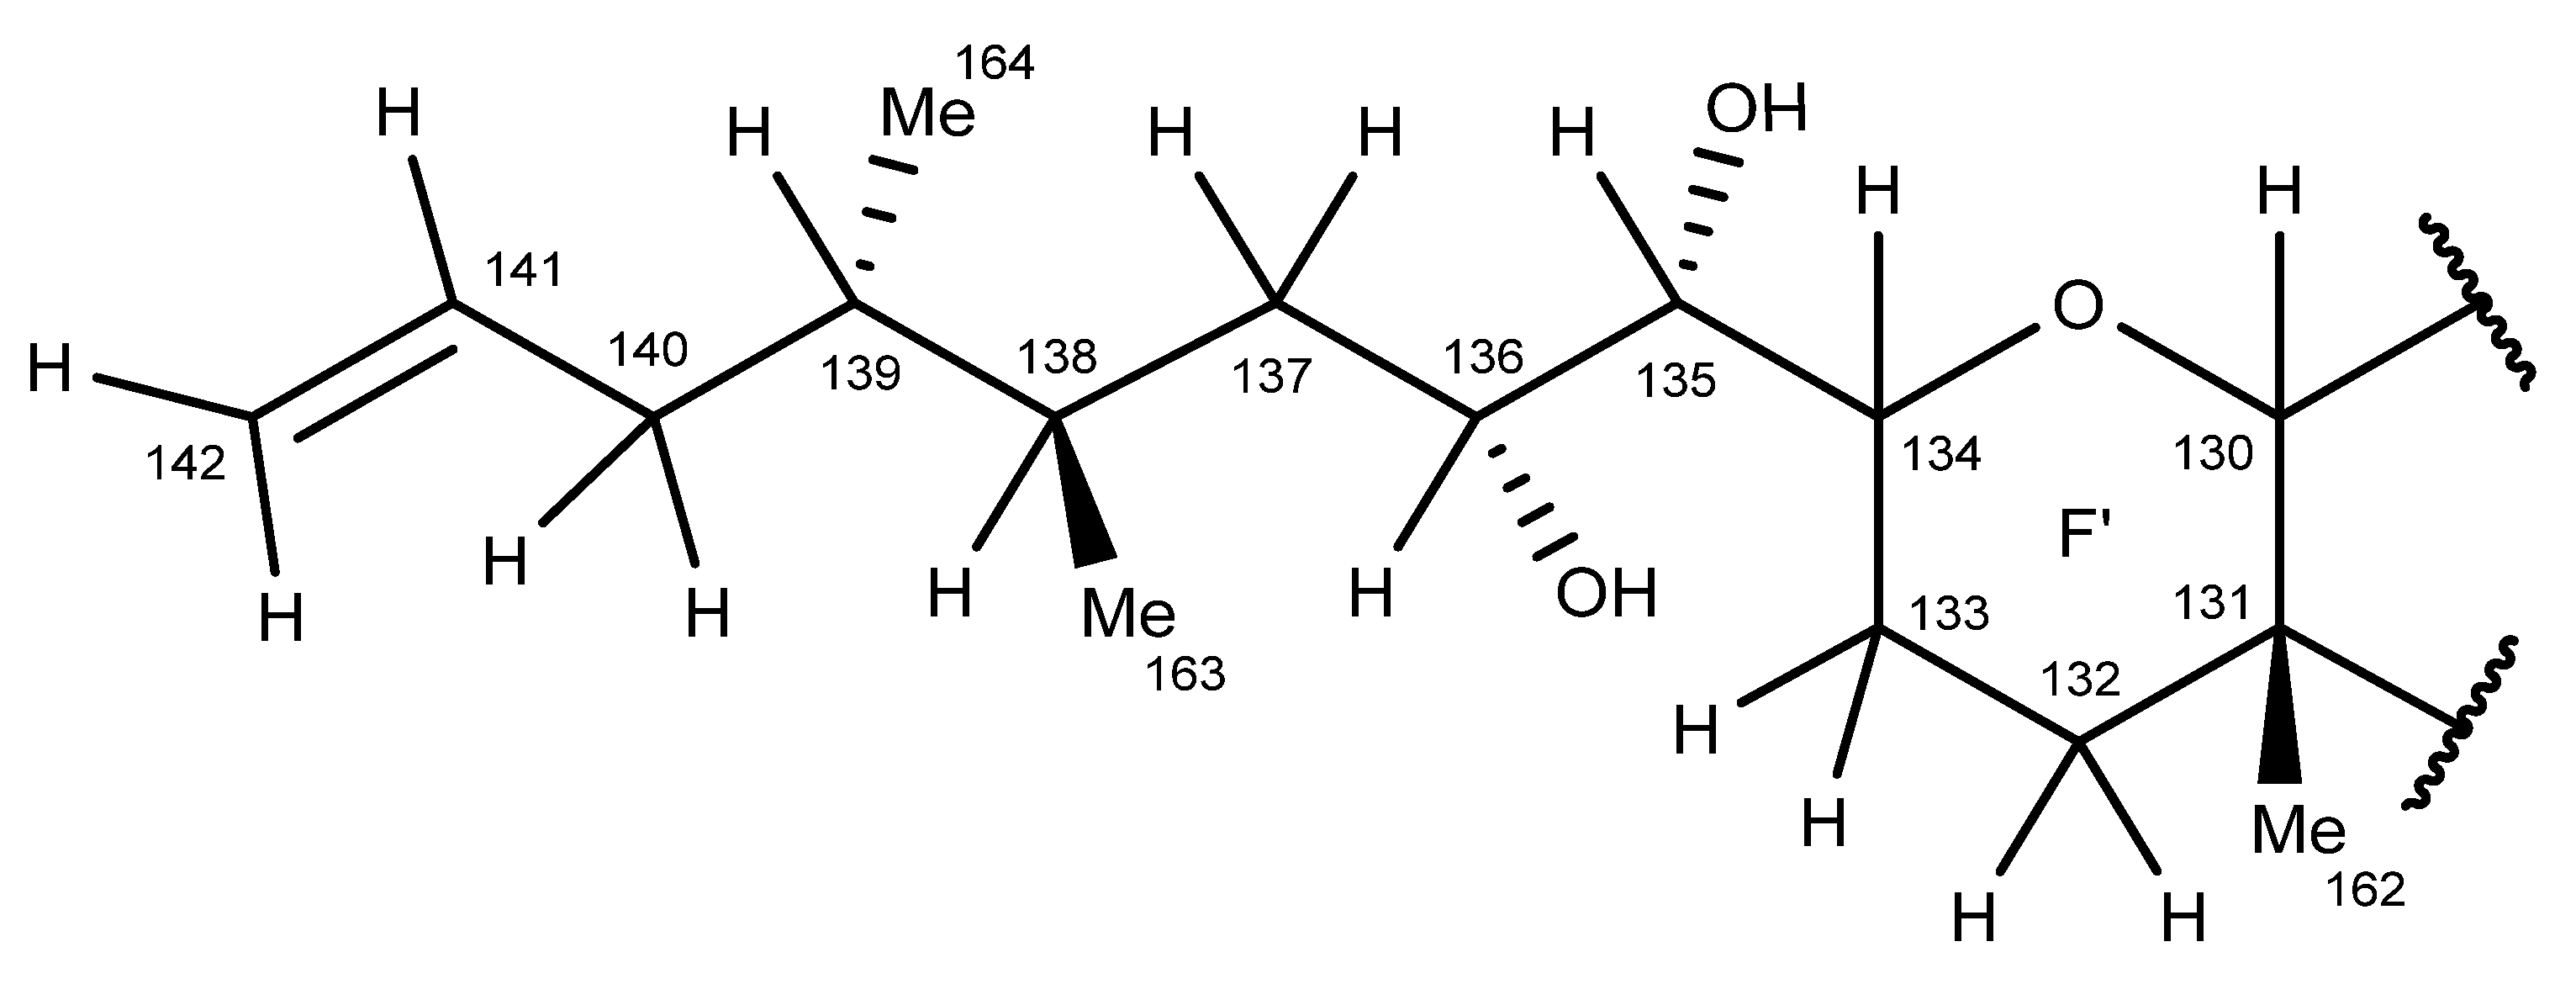
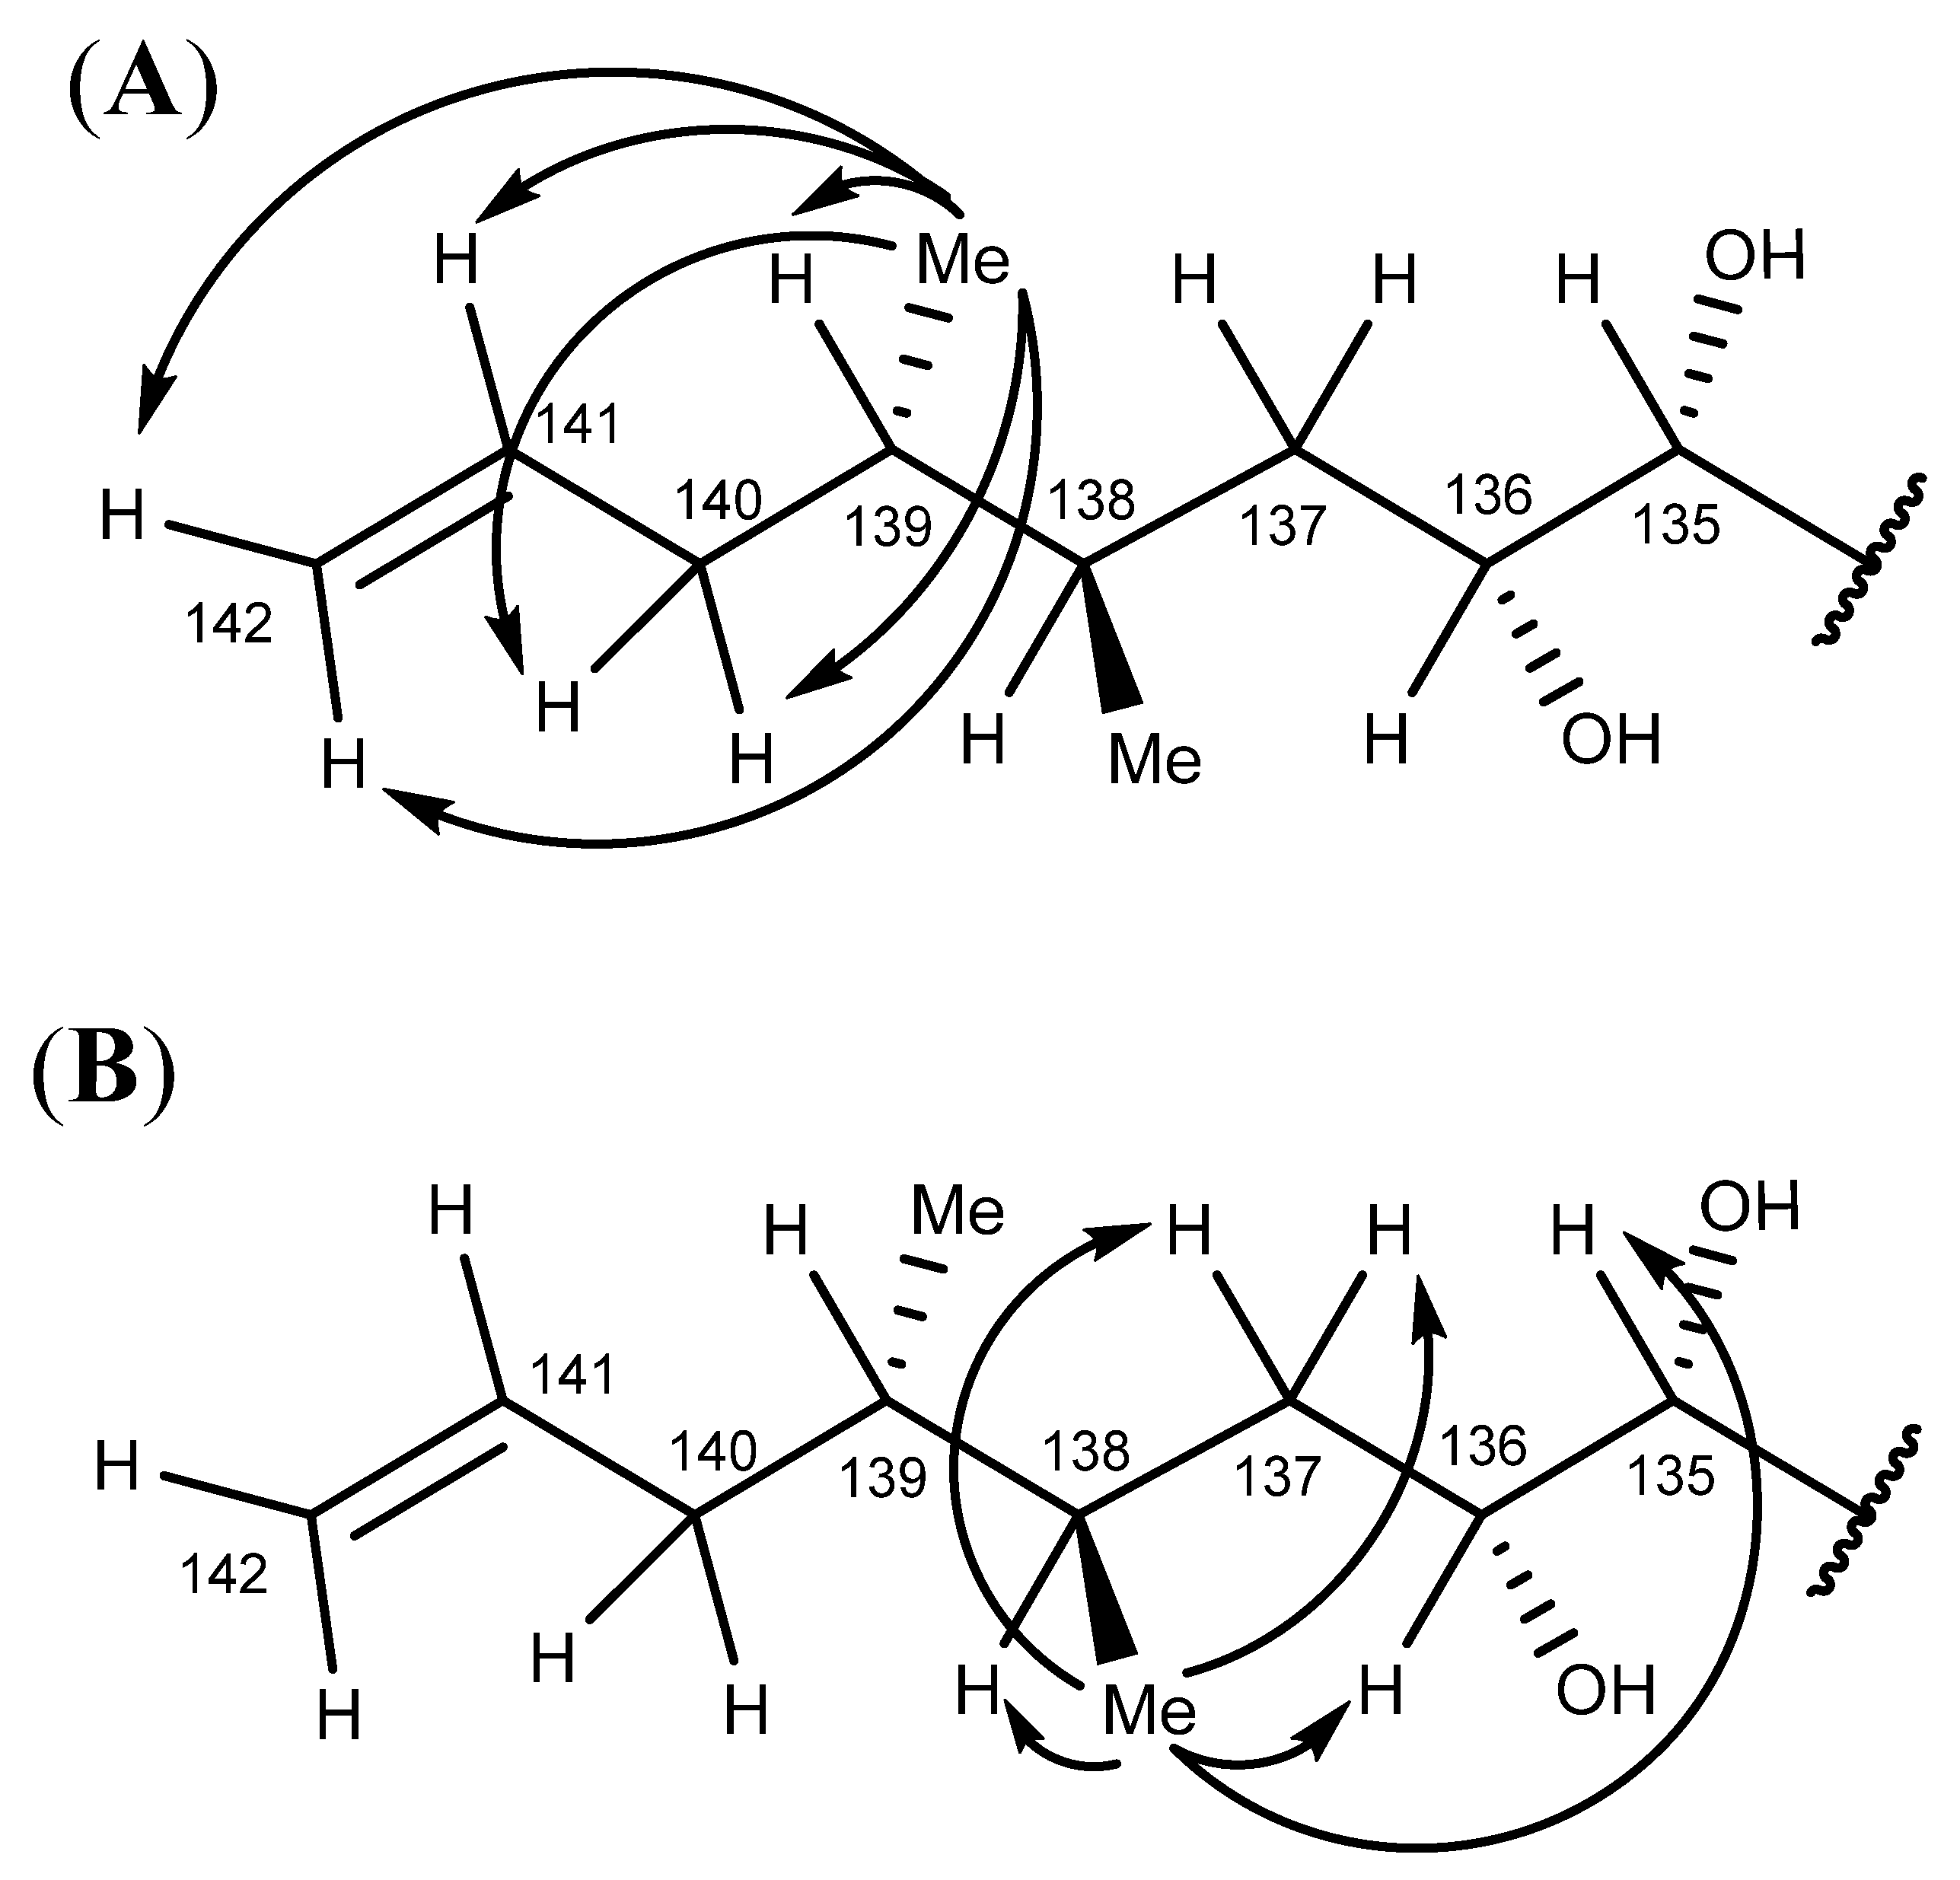
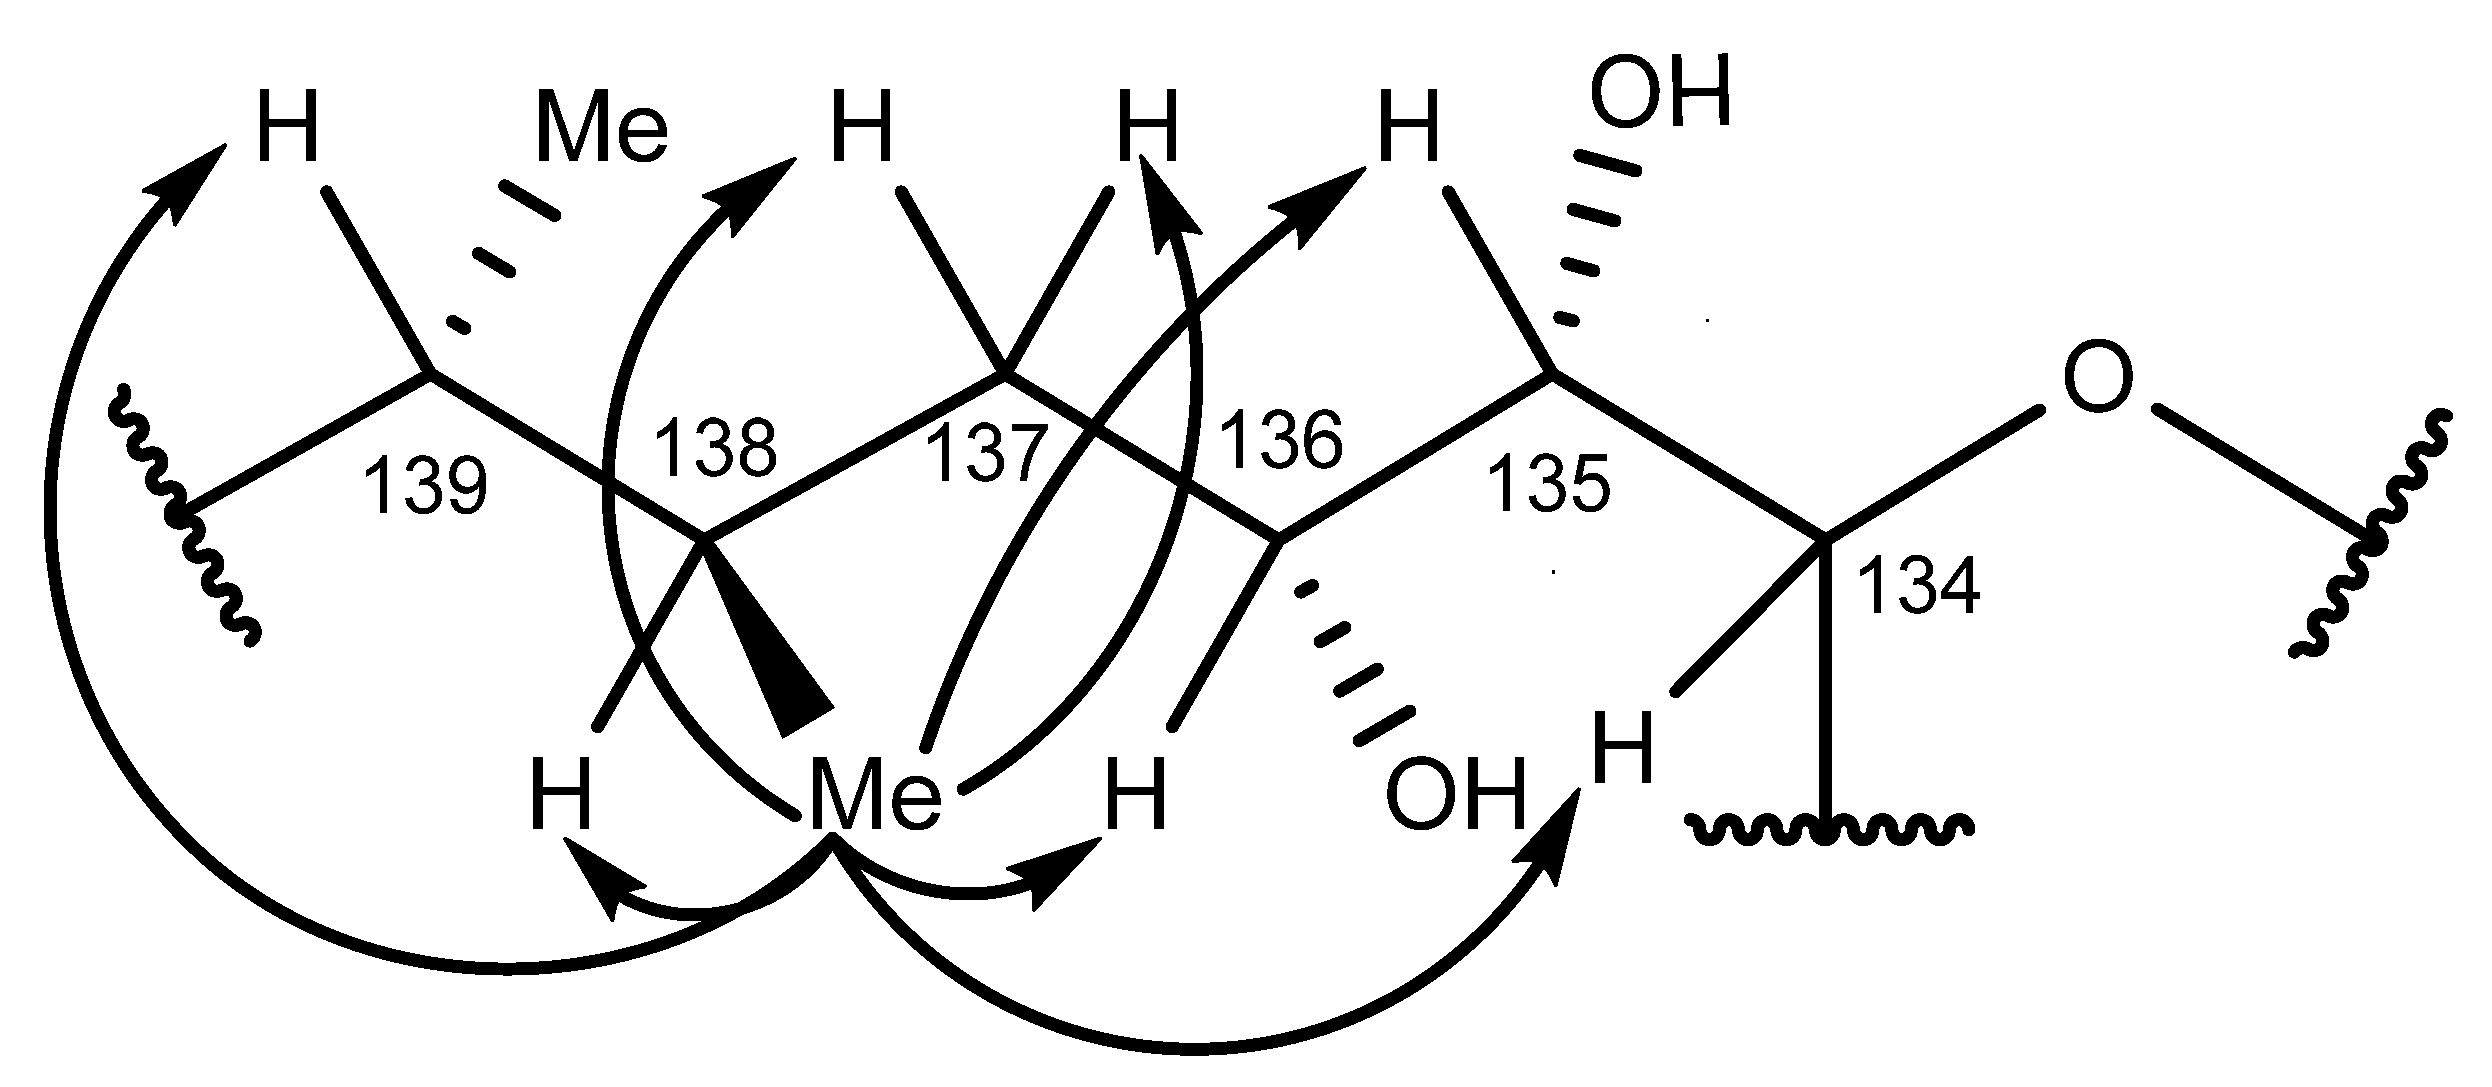
2.6. Nuclear Magnetic Resonance Spectroscopy of Maitotoxin-7
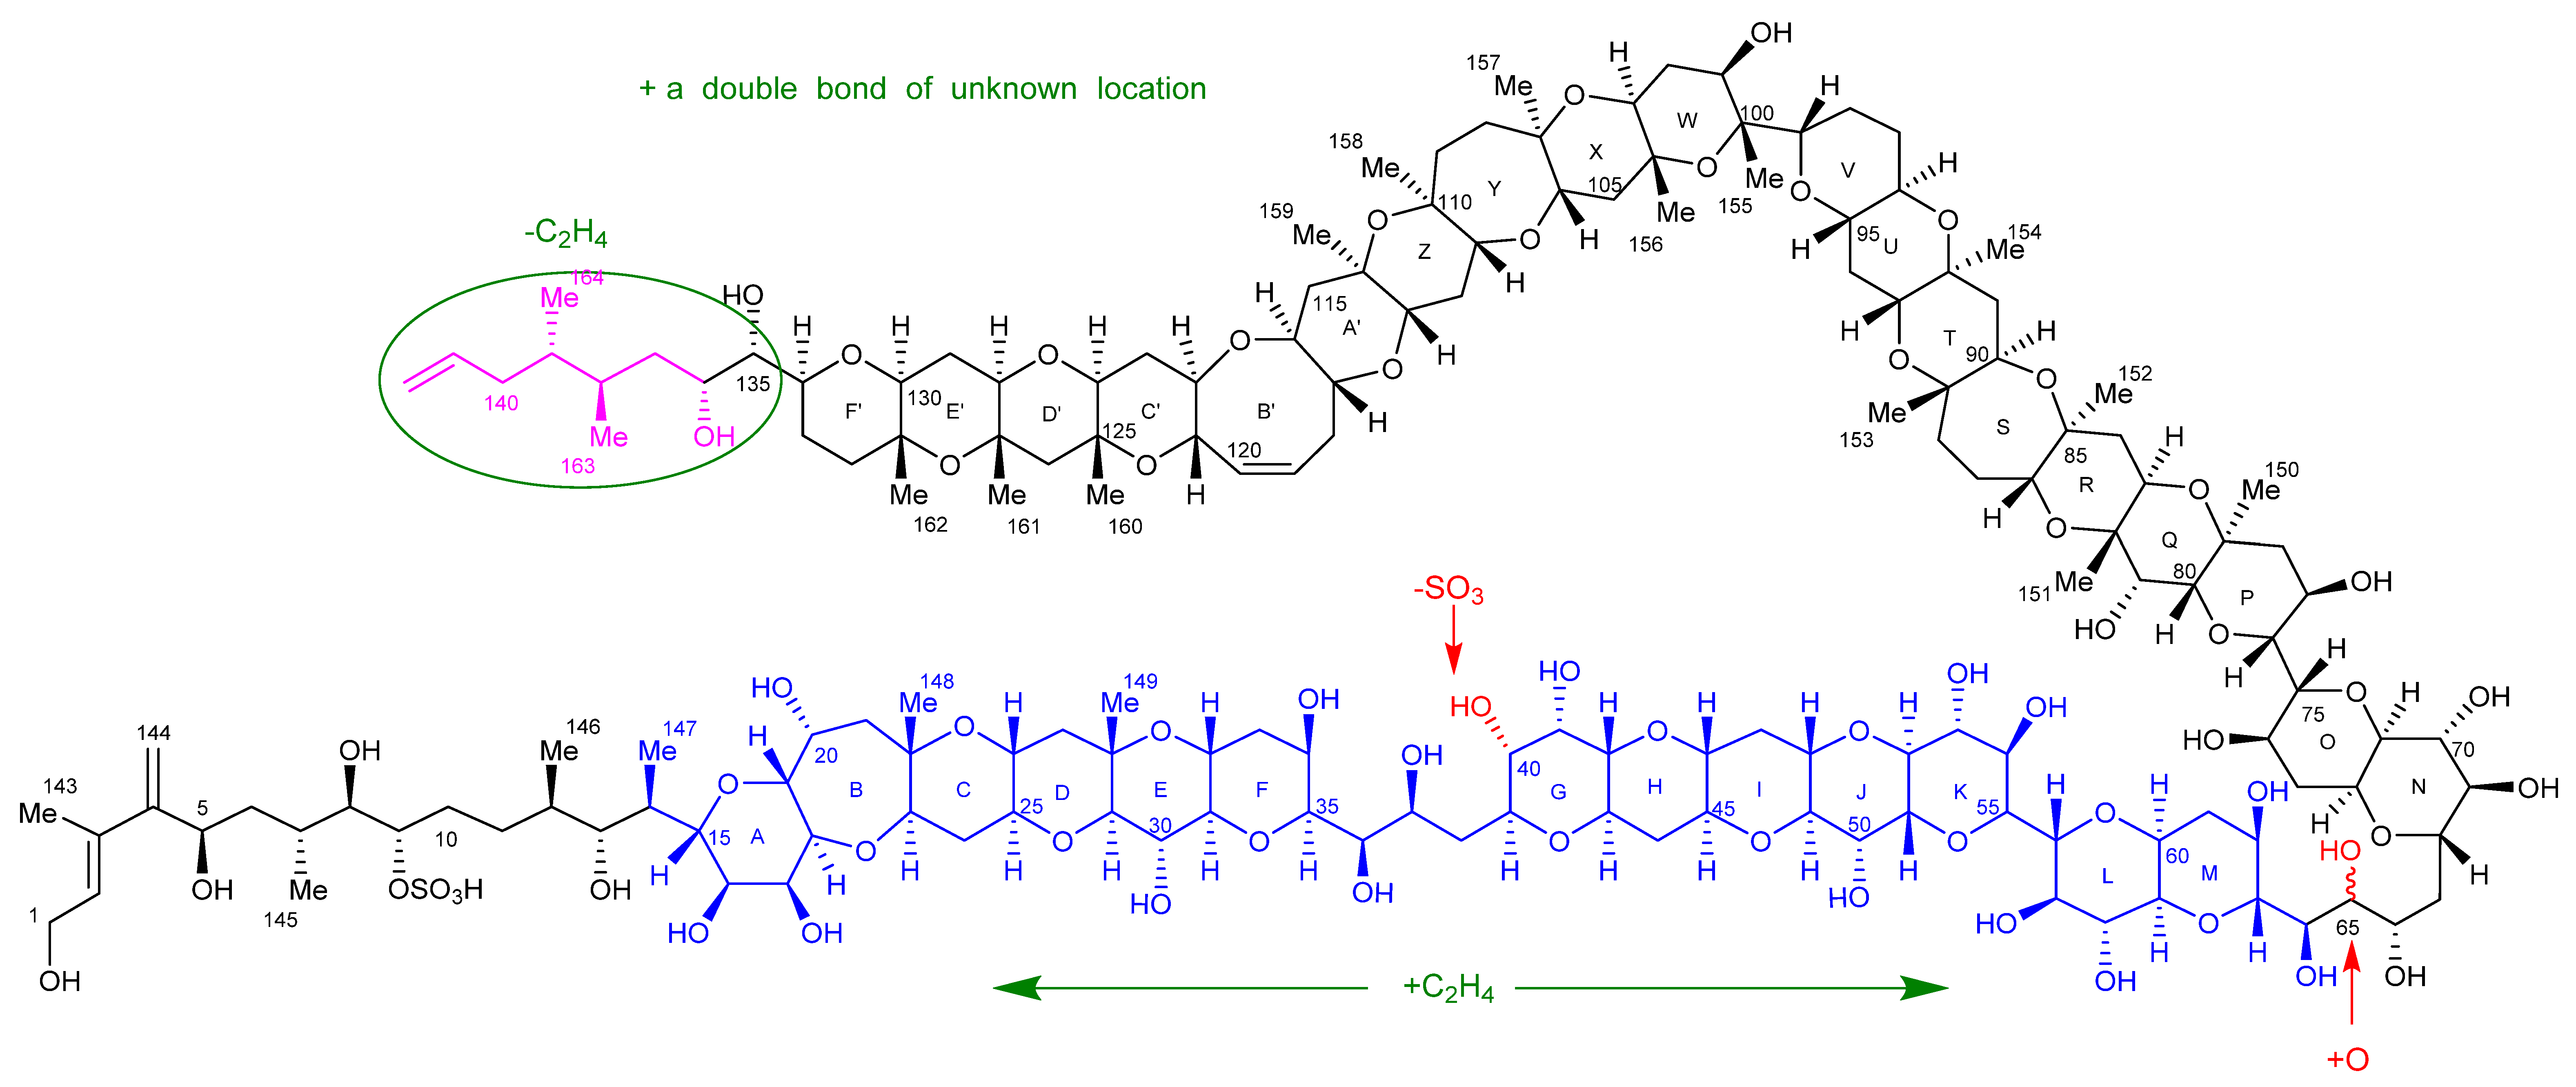
2.7. Maitotoxin-7 Proposed Structure
2.8. Nuclear Magnetic Resonance of Maitotoxin-6
2.9. Maitotoxin-6 Proposed Structure Nuclear Magnetic Resonance of Maitotoxin-6
2.10. Acute Toxicity
3. Discussion
4. Materials and Methods
4.1. Culturing
4.2. Extraction
4.3. Isolation of Maitotoxin-6
4.4. Isolation of Maitotoxin-7
4.5. Liquid Chromatography–Mass Spectrometry
4.5.1. Chemical Modification Experiments
Oxidative Cleavage
Reduction
Chromatographic Parameters
4.6. High-Resolution Mass Spectrometry
Oxidative Cleavage
4.7. Nuclear Magnetic Resonance Spectrometry
4.8. Mouse Bioassay
4.8.1. Animals
4.8.2. Acute Toxicity by Intraperitoneal Injection
4.8.3. Acute Toxicity by Oral Administration
5. Conclusions
Supplementary Materials
Author Contributions
Funding
Institutional Review Board Statement
Acknowledgments
Conflicts of Interest
References
- Food and Agriculture Organisation of the United Nations. Application of Risk Assessment in the Fish Industry; 0429-9345; FAO Fisheries Technical Paper 442; FAO: Rome, Italy, 2014; p. 221. [Google Scholar]
- Friedman, M.A.; Fernandez, M.; Backer, L.C.; Dickey, R.W.; Bernstein, J.; Schrank, K.; Kibler, S.; Stephan, W.; Gribble, M.O.; Bienfang, P.; et al. An updated review of ciguatera fish poisoning: Clinical, epidemiological, environmental, and public health management. Mar. Drugs 2017, 15, 72. [Google Scholar] [CrossRef] [PubMed]
- Roué, M.; Darius, H.T.; Picot, S.; Ung, A.; Viallon, J.; Gaertner-Mazouni, N.; Sibat, M.; Amzil, Z.; Chinain, M. Evidence of the bioaccumulation of ciguatoxins in giant clams (Tridacna maxima) exposed to Gambierdiscus spp. cells. Harmful Algae 2016, 57, 78–87. [Google Scholar] [CrossRef] [PubMed] [Green Version]
- Kelly, A.M.; Kohler, C.C.; Tindall, D.R. Are crustaceans linked to the ciguatera food chain? Environ. Biol. Fishes 1992, 33, 275–286. [Google Scholar] [CrossRef]
- Silva, M.; Rodriguez, I.; Barreiro, A.; Kaufmann, M.; Neto, A.I.; Hassouani, M.; Sabour, B.; Alfonso, A.; Botana, L.M.; Vasconcelos, V. First report of ciguatoxins in two starfish species: Ophidiaster ophidianus and Marthasterias glacialis. Toxins 2015, 7, 3740–3757. [Google Scholar] [CrossRef] [Green Version]
- Darius, H.T.; Roué, M.; Sibat, M.; Viallon, J.; Gatti, C.M.I.; Vandersea, M.W.; Tester, P.A.; Litaker, R.W.; Amzil, Z.; Hess, P.; et al. Toxicological investigations on the sea urchin Tripneustes gratilla (Toxopneustidae, Echinoid) from Anaho Bay (Nuku Hiva, French Polynesia): Evidence for the presence of Pacific ciguatoxins. Mar. Drugs 2018, 16, 122. [Google Scholar] [CrossRef] [Green Version]
- Gatti, C.M.i.; Lonati, D.; Darius, H.T.; Zancan, A.; Roué, M.; Schicchi, A.; Locatelli, C.A.; Chinain, M. Tectus niloticus (Tegulidae, Gastropod) as a novel vector of ciguatera poisoning: Clinical characterization and follow-up of a mass poisoning event in Nuku Hiva Island (French Polynesia). Toxins 2018, 10, 102. [Google Scholar] [CrossRef] [PubMed] [Green Version]
- Mak, Y.L.; Wai, T.-C.; Murphy, M.B.; Chan, W.H.; Wu, J.J.; Lam, J.C.W.; Chan, L.L.; Lam, P.K.S. Pacific ciguatoxins in food web components of coral reef systems in the Republic of Kiribati. Environ. Sci. Technol. 2013, 47, 14070–14079. [Google Scholar] [CrossRef]
- Rongo, T.; van Woesik, R. Ciguatera poisoning in Rarotonga, southern Cook Islands. Harmful Algae 2011, 10, 345–355. [Google Scholar] [CrossRef]
- Botana, L.M. Toxicology of Seafood Toxins: A Critical Review; CRC Press: Boston, MA, USA, 2014; pp. 100–196. [Google Scholar]
- Bagnis, R.; Chanteau, S.; Chungue, E.; Hurtel, J.M.; Yasumoto, T.; Inoue, A. Origins of ciguatera fish poisoning: A new dinoflagellate, Gambierdiscus toxicus Adachi and Fukuyo, definitively involved as a causal agent. Toxicon 1980, 18, 199–208. [Google Scholar] [CrossRef]
- Chinain, M.; Darius, H.T.; Ung, A.; Cruchet, P.; Wang, Z.; Ponton, D.; Laurent, D.; Pauillac, S. Growth and toxin production in the ciguatera-causing dinoflagellate Gambierdiscus polynesiensis (Dinophyceae) in culture. Toxicon 2010, 56, 739–750. [Google Scholar] [CrossRef]
- Rhodes, L.; Smith, K.; Harwood, T.; Selwood, A.; Argyle, P.; Bedford, C.; Munday, R. Gambierdiscus and Ostreopsis from New Zealand, the Kermadec Islands and the Cook Islands and the risk of ciguatera fish poisoning in New Zealand. In Proceedings of the 16th International Conference on Harmful Algae, Wellington, New Zealand, 27–31 October 2014; p. 72. [Google Scholar]
- Skinner, M.P.; Brewer, T.D.; Johnstone, R.; Fleming, L.E.; Lewis, R.J. Ciguatera fish poisoning in the Pacific Islands (1998 to 2008). PLoS ONE—Negl. Trop. Dis. 2011, 5, e1416. [Google Scholar] [CrossRef] [PubMed]
- Rhodes, L.L.; Smith, K.F.; Murray, J.S.; Nishimura, T.; Finch, S.C. Ciguatera fish poisoning: The risk from an Aotearoa/New Zealand perspective. Toxins 2020, 12, 50. [Google Scholar] [CrossRef] [PubMed] [Green Version]
- Chinain, M.; Gatti, C.M.i.; Darius, H.T.; Quod, J.P.; Tester, P.A. Ciguatera poisonings: A global review of occurrences and trends. Harmful Algae 2021, 102, 101873. [Google Scholar] [CrossRef] [PubMed]
- Jeong, H.J.; Lim, A.S.; Jang, S.H.; Yih, W.H.; Kang, N.S.; Lee, S.Y.; Yoo, Y.D.; Kim, H.S. First report of the epiphytic dinoflagellate Gambierdiscus caribaeus in the temperate waters off Jeju Island, Korea: Morphology and molecular characterization. J. Eukaryot. Microbiol. 2012, 59, 637–650. [Google Scholar] [CrossRef]
- Nishimura, T.; Sato, S.; Tawong, W.; Sakanari, H.; Uehara, K.; Shah, M.M.R.; Suda, S.; Yasumoto, T.; Taira, Y.; Yamaguchi, H.; et al. Genetic diversity and distribution of the ciguatera-causing dinoflagellate Gambierdiscus spp. (Dinophyceae) in coastal areas of Japan. PLoS ONE 2013, 8, e60882. [Google Scholar] [CrossRef] [Green Version]
- Tester, P.A.; Vandersea, M.W.; Buckel, C.A.; Kibler, S.R.; Holland, W.C.; Davenport, E.D.; Clark, R.D.; Edwards, K.F.; Taylor, J.C.; Pluym, J.L.V.; et al. Gambierdiscus (Dinophyceae) species diversity in the Flower Garden Banks national marine sanctuary, Northern Gulf of Mexico, USA. Harmful Algae 2013, 29, 1–9. [Google Scholar] [CrossRef]
- Aligizaki, K.; Nikolaidis, G. Morphological identification of two tropical dinoflagellates of the genera Gambierdiscus and Sinophysis in the Mediterranean Sea. J. Biol. Res.-Thessalon. 2008, 9, 75–82. [Google Scholar]
- Food and Agriculture Organisation of the United Nations. Report of the Expert Meeting on Ciguatera Poisoning. Rome, 19–23 November 2018; FAO Food Safety and Quality No. 9; FAO: Rome, Italy, 2020; p. 156. [Google Scholar]
- Rhodes, L.; Harwood, T.; Smith, K.; Argyle, P.; Munday, R. Production of ciguatoxin and maitotoxin by strains of Gambierdiscus australes, G. pacificus and G. polynesiensis (Dinophyceae) isolated from Rarotonga, Cook Islands. Harmful Algae 2014, 39, 185–190. [Google Scholar] [CrossRef]
- Murata, M.; Naoki, H.; Iwashita, T.; Matsunaga, S.; Sasaki, M.; Yokoyama, A.; Yasumoto, T. Structure of maitotoxin. J. Am. Chem. Soc. 1993, 115, 2060–2062. [Google Scholar] [CrossRef]
- Pisapia, F.; Sibat, M.; Watanabe, R.; Roullier, C.; Suzuki, T.; Hess, P.; Herrenknecht, C. Characterization of maitotoxin-4 (MTX4) using electrospray positive mode ionization high-resolution mass spectrometry and UV spectroscopy. Rapid Commun. Mass Spectrom. 2020, 34, e8859. [Google Scholar] [CrossRef]
- Murray, J.S.; Finch, S.C.; Puddick, J.; Rhodes, L.L.; Harwood, D.T.; van Ginkel, R.; Prinsep, M.R. Acute toxicity of gambierone and quantitative analysis of gambierones produced by cohabitating benthic dinoflagellates. Toxins 2021, 13, 333. [Google Scholar] [CrossRef] [PubMed]
- Cuypers, E.; Abdel-Mottaleb, Y.; Kopljar, I.; Rainier, J.D.; Raes, A.L.; Snyders, D.J.; Tytgat, J. Gambierol, a toxin produced by the dinoflagellate Gambierdiscus toxicus, is a potent blocker of voltage-gated potassium channels. Toxicon 2008, 51, 974–983. [Google Scholar] [CrossRef] [PubMed] [Green Version]
- Watanabe, R.; Uchida, H.; Suzuki, T.; Matsushima, R.; Nagae, M.; Toyohara, Y.; Satake, M.; Oshima, Y.; Inoue, A.; Yasumoto, T. Gambieroxide, a novel epoxy polyether compound from the dinoflagellate Gambierdiscus toxicus GTP2 strain. Tetrahedron Lett. 2013, 69, 10299–10303. [Google Scholar] [CrossRef]
- Nagai, H.; Murata, M.; Torigoe, K.; Satake, M.; Yasumoto, T. Gambieric acids, new potent antifungal substances with unprecedented polyether structures from a marine dinoflagellate Gambierdiscus toxicus. J. Org. Chem. 1992, 57, 5448–5453. [Google Scholar] [CrossRef]
- Murray, J.S.; Rhodes, L.L.; Harwood, D.T. Ciguatera poisoning and confirmation of ciguatoxins in fish imported into New Zealand. N. Z. Med. J. 2021, 134, 100–104. [Google Scholar]
- Chinain, M.; Darius, H.T.; Ung, A.; Fouc, M.T.; Revel, T.; Cruchet, P.; Pauillac, S.; Laurent, D. Ciguatera risk management in French Polynesia: The case study of Raivavae Island (Australes Archipelago). Toxicon 2010, 56, 674–690. [Google Scholar] [CrossRef]
- Lewis, R.J.; Holmes, M.J.; Alewood, P.F.; Jones, A. Ionspray mass spectrometry of ciguatoxin-1, maitotoxin-2 and -3, and related marine polyether toxins. Nat. Toxins 1994, 2, 56–63. [Google Scholar] [CrossRef]
- Pisapia, F.; Sibat, M.; Herrenknecht, C.; Lhaute, K.; Gaiani, G.; Ferron, P.-J.; Fessard, V.; Fraga, S.; Nascimento, S.M.; Litaker, R.W. Maitotoxin-4, a novel MTX analog produced by Gambierdiscus excentricus. Mar. Drugs 2017, 15, 220. [Google Scholar] [CrossRef]
- Estevez, P.; Castro, D.; Leão-Martins, J.M.; Sibat, M.; Tudó, A.; Dickey, R.; Diogene, J.; Hess, P.; Gago-Martinez, A. Toxicity screening of a Gambierdiscus australes strain from the Western Mediterranean Sea and identification of a novel maitotoxin analogue. Mar. Drugs 2021, 19, 460. [Google Scholar] [CrossRef]
- Mazzola, E.P.; Deeds, J.R.; Stutts, W.L.; Ridge, C.D.; Dickey, R.W.; White, K.D.; Williamson, R.T.; Martin, G.E. Elucidation and partial NMR assignment of monosulfated maitotoxins from the Caribbean. Toxicon 2019, 164, 44–50. [Google Scholar] [CrossRef]
- Murray, J.S.; Selwood, A.I.; Harwood, D.T.; van Ginkel, R.; Puddick, J.; Rhodes, L.L.; Rise, F.; Wilkins, A.L. 44-Methylgambierone, a new gambierone analogue isolated from Gambierdiscus australes. Tetrahedron Lett. 2019, 60, 621–625. [Google Scholar] [CrossRef]
- Boente-Juncal, A.; Álvarez, M.; Antelo, Á.; Rodríguez, I.; Calabro, K.; Vale, C.; Thomas, O.P.; Botana, L.M. Structure elucidation and biological evaluation of maitotoxin-3, a homologue of gambierone, from Gambierdiscus belizeanus. Toxins 2019, 11, 79. [Google Scholar] [CrossRef] [Green Version]
- Yokoyama, A.; Murata, M.; Oshima, Y.; Iwashita, T.; Yasumoto, T. Some chemical properties of maitotoxin, a putative calcium channel agonist isolated from a marine dinoflagellate. J. Biochem. 1988, 104, 184–187. [Google Scholar] [CrossRef]
- Murata, M.; Iwashita, T.; Yokoyama, A.; Sasaki, M.; Yasumoto, T. Partial structures of maitotoxin, the most potent marine toxin from the dinoflagellate Gambierdiscus toxicus. J. Am. Chem. Soc. 1992, 114, 6594–6596. [Google Scholar] [CrossRef]
- Murata, M.; Naoki, H.; Matsunaga, S.; Satake, M.; Yasumoto, T. Structure and partial stereochemical assignments for maitotoxin, the most toxic and largest natural non-biopolymer. J. Am. Chem. Soc. 1994, 116, 7098–7107. [Google Scholar] [CrossRef]
- Nonomura, T.; Sasaki, M.; Matsumori, N.; Murata, M.; Tachibana, K.; Yasumoto, T. The complete structure of maitotoxin, Part II: Configuration of the C135–C142 side chain and absolute configuration of the entire molecule. Angew. Chem. Int. Ed. Engl. 1996, 35, 1675–1678. [Google Scholar] [CrossRef]
- Sasaki, M.; Matsumori, N.; Maruyama, T.; Nonomura, T.; Murata, M.; Tachibana, K.; Yasumoto, T. The complete structure of maitotoxin, Part I: Configuration of the C1–C14 side chain. Angew. Chem. Int. Ed. Engl. 1996, 35, 1672–1675. [Google Scholar] [CrossRef]
- Smith, K.F.; Rhodes, L.; Verma, A.; Curley, B.G.; Harwood, D.T.; Kohli, G.S.; Solomona, D.; Rongo, T.; Munday, R.; Murray, S.A. A new Gambierdiscus species (Dinophyceae) from Rarotonga, Cook Islands: Gambierdiscus cheloniae sp. nov. Harmful Algae 2016, 60, 45–56. [Google Scholar] [CrossRef]
- Rhodes, L.; Smith, K.F.; Verma, A.; Curley, B.G.; Harwood, D.T.; Murray, J.S.; Kohli, G.S.; Solomona, D.; Rongo, T.; Munday, R.; et al. A new species of Gambierdiscus (Dinophyceae) from the south-west Pacific: Gambierdiscus honu sp. nov. Harmful Algae 2017, 65, 61–70. [Google Scholar] [CrossRef]
- Munday, R.; Murray, J.S.; Rhodes, L.L.; Larsson, M.E.; Harwood, D.T. Ciguatoxins and maitotoxins in extracts of sixteen Gambierdiscus isolates and one Fukuyoa isolate from the south Pacific and their toxicity to mice by intraperitoneal and oral administration. Mar. Drugs 2017, 15, 208. [Google Scholar] [CrossRef] [Green Version]
- National Research Council Canada. Molecular Formula Calculator. Available online: https://metrology.shinyapps.io/molecular-formula-calculator/ (accessed on 1 June 2021).
- Sasaki, M.; Murata, M. Complete structure of maitotoxin. J. Synth. Org. Chem. Jpn. 1997, 55, 535–546. [Google Scholar] [CrossRef]
- Organisation for Economic Co-operation and Development. OECD Guideline for Testing of Chemicals 425. Acute Oral Toxicity: Up-and-Down-Procedure (UDP). Available online: http://www.epa.gov/oppfead1/harmonization/docs/E425guideline.pdf (accessed on 2 November 2007).
- Organisation for Economic Co-Operation and Development. OECD Guidance Document on the Recognition, Assessment and Use of Clinical Signs as Humane Endpoints for Experimental Animals Used in Safety Evaluation. Available online: https://www.aaalac.org/accreditation/RefResources/RR_HumaneEndpoints.pdf (accessed on 20 December 2000).
- Munday, R. Toxicology of Seafood Toxins: A Critical Review; CRC Press: Boston, MA, USA, 2014; p. 289. [Google Scholar]
- United States Environmental Protection Agency User Documentation for the AOT425StatPgm Program. 2002. Available online: http://www.oecd.org/dataoecd/19/57/1839830.pdf (accessed on 1 March 2022).
- Scheuer, P.J.; Takahashi, W.; Tsutsumi, J.; Yoshida, T. Ciguatoxin: Isolation and chemical nature. Science 1967, 155, 1267–1268. [Google Scholar] [CrossRef] [PubMed]


| C | H | O | S | |
|---|---|---|---|---|
| MTX-1 | 164 | 258 | 68 | 2 |
| MTX-6 | 164 | 256 | 66 | 1 |
| Net atom change a | - | −2 | −2 | −1 |
| Sulfite loss | −3 | −1 | ||
| One additional hydroxyl group | 1 | |||
| Double bond | −2 |
| C | H | O | S | |
|---|---|---|---|---|
| MTX-1 | 164 | 258 | 68 | 2 |
| MTX-7 | 165 | 258 | 67 | 1 |
| Net atom change a | 1 | - | −1 | −1 |
| Sulfite loss | −3 | −1 | ||
| Additional methyl group | 1 | 2 | ||
| Two additional hydroxyl groups | 2 | |||
| Double bond | −2 |
| MTX-1 | MTX-6 | MTX-7 | |
|---|---|---|---|
| Doubly-charged ions | 1690.8239 | 1657.8326 | 1655.8267 1672.8365 |
| Triply-charged ions | 1067.2311 1093.5519 | 1077.8365 |
Publisher’s Note: MDPI stays neutral with regard to jurisdictional claims in published maps and institutional affiliations. |
© 2022 by the authors. Licensee MDPI, Basel, Switzerland. This article is an open access article distributed under the terms and conditions of the Creative Commons Attribution (CC BY) license (https://creativecommons.org/licenses/by/4.0/).
Share and Cite
Murray, J.S.; Finch, S.C.; Mudge, E.M.; Wilkins, A.L.; Puddick, J.; Harwood, D.T.; Rhodes, L.L.; van Ginkel, R.; Rise, F.; Prinsep, M.R. Structural Characterization of Maitotoxins Produced by Toxic Gambierdiscus Species. Mar. Drugs 2022, 20, 453. https://doi.org/10.3390/md20070453
Murray JS, Finch SC, Mudge EM, Wilkins AL, Puddick J, Harwood DT, Rhodes LL, van Ginkel R, Rise F, Prinsep MR. Structural Characterization of Maitotoxins Produced by Toxic Gambierdiscus Species. Marine Drugs. 2022; 20(7):453. https://doi.org/10.3390/md20070453
Chicago/Turabian StyleMurray, J. Sam, Sarah C. Finch, Elizabeth M. Mudge, Alistair L. Wilkins, Jonathan Puddick, D. Tim Harwood, Lesley L. Rhodes, Roel van Ginkel, Frode Rise, and Michèle R. Prinsep. 2022. "Structural Characterization of Maitotoxins Produced by Toxic Gambierdiscus Species" Marine Drugs 20, no. 7: 453. https://doi.org/10.3390/md20070453