Updated Trends on the Biodiscovery of New Marine Natural Products from Invertebrates


Abstract
:
1. Introduction
2. Results
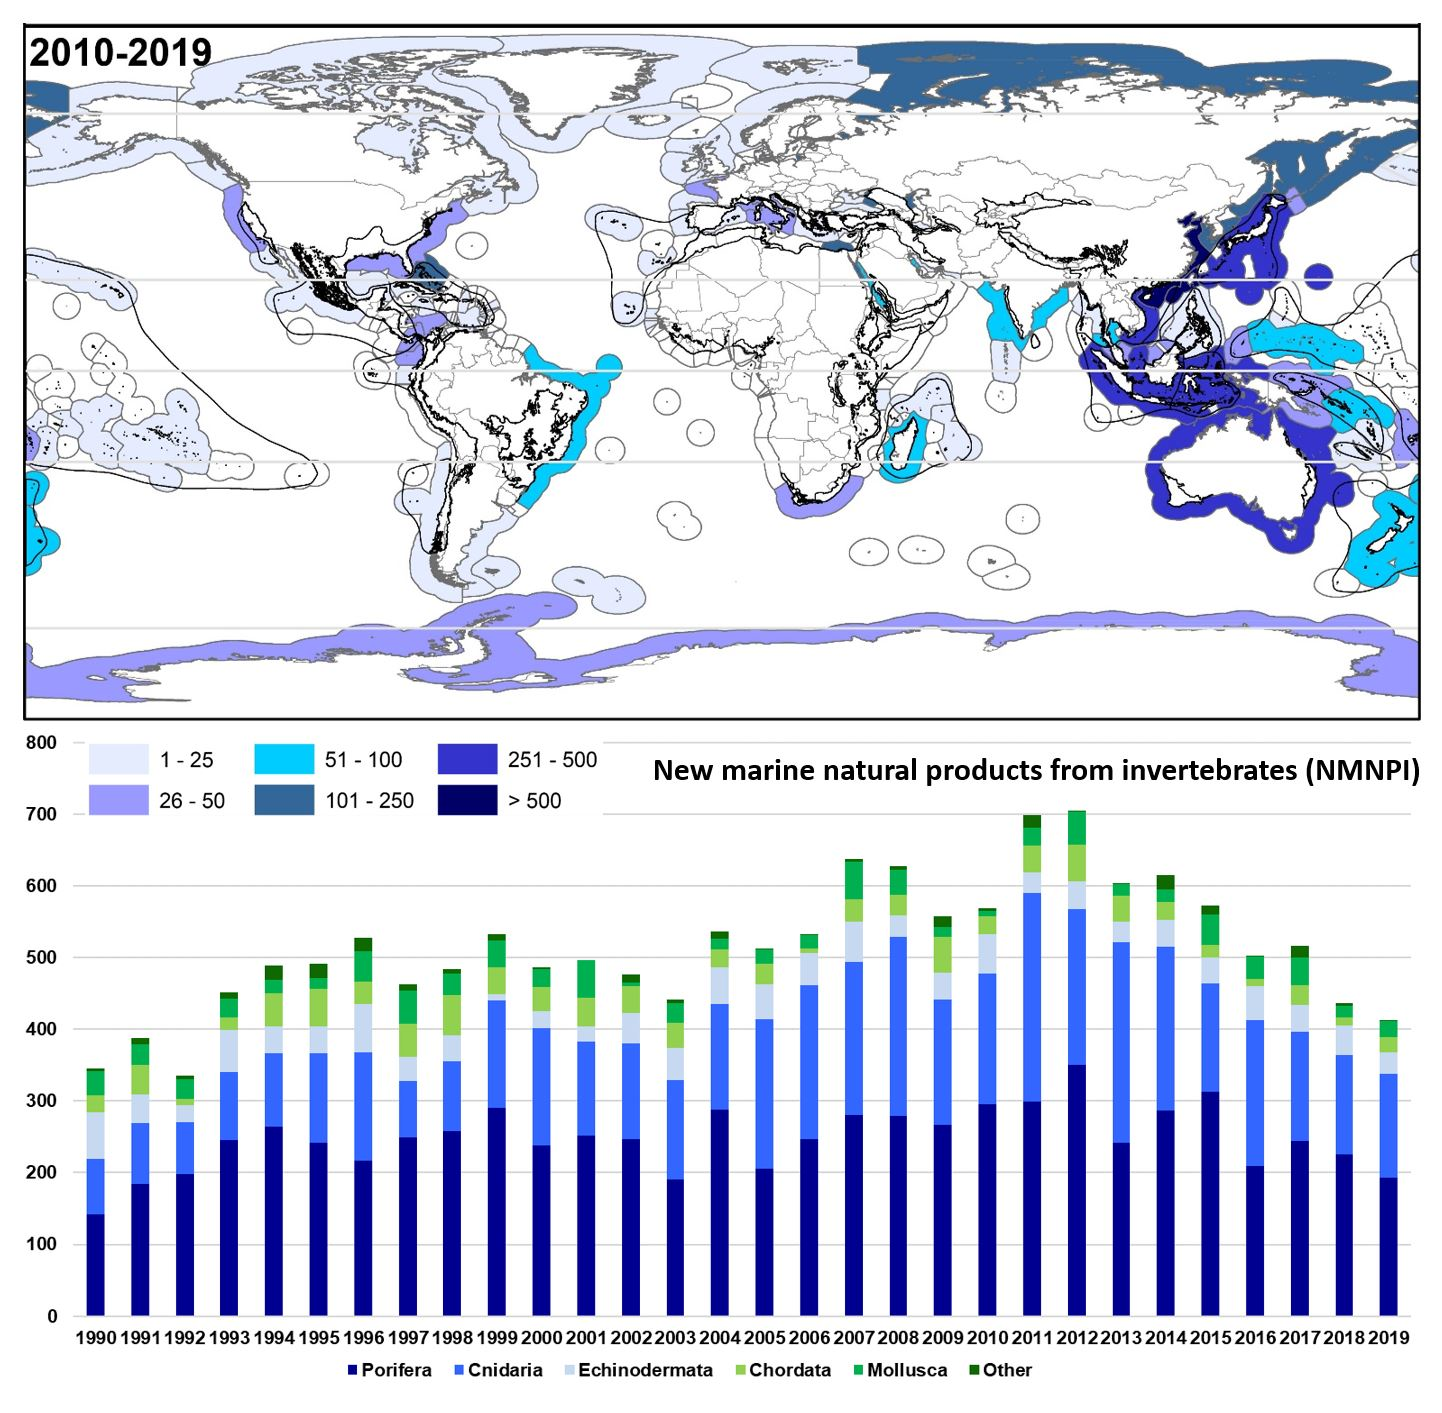
2.1. Taxonomical Trends
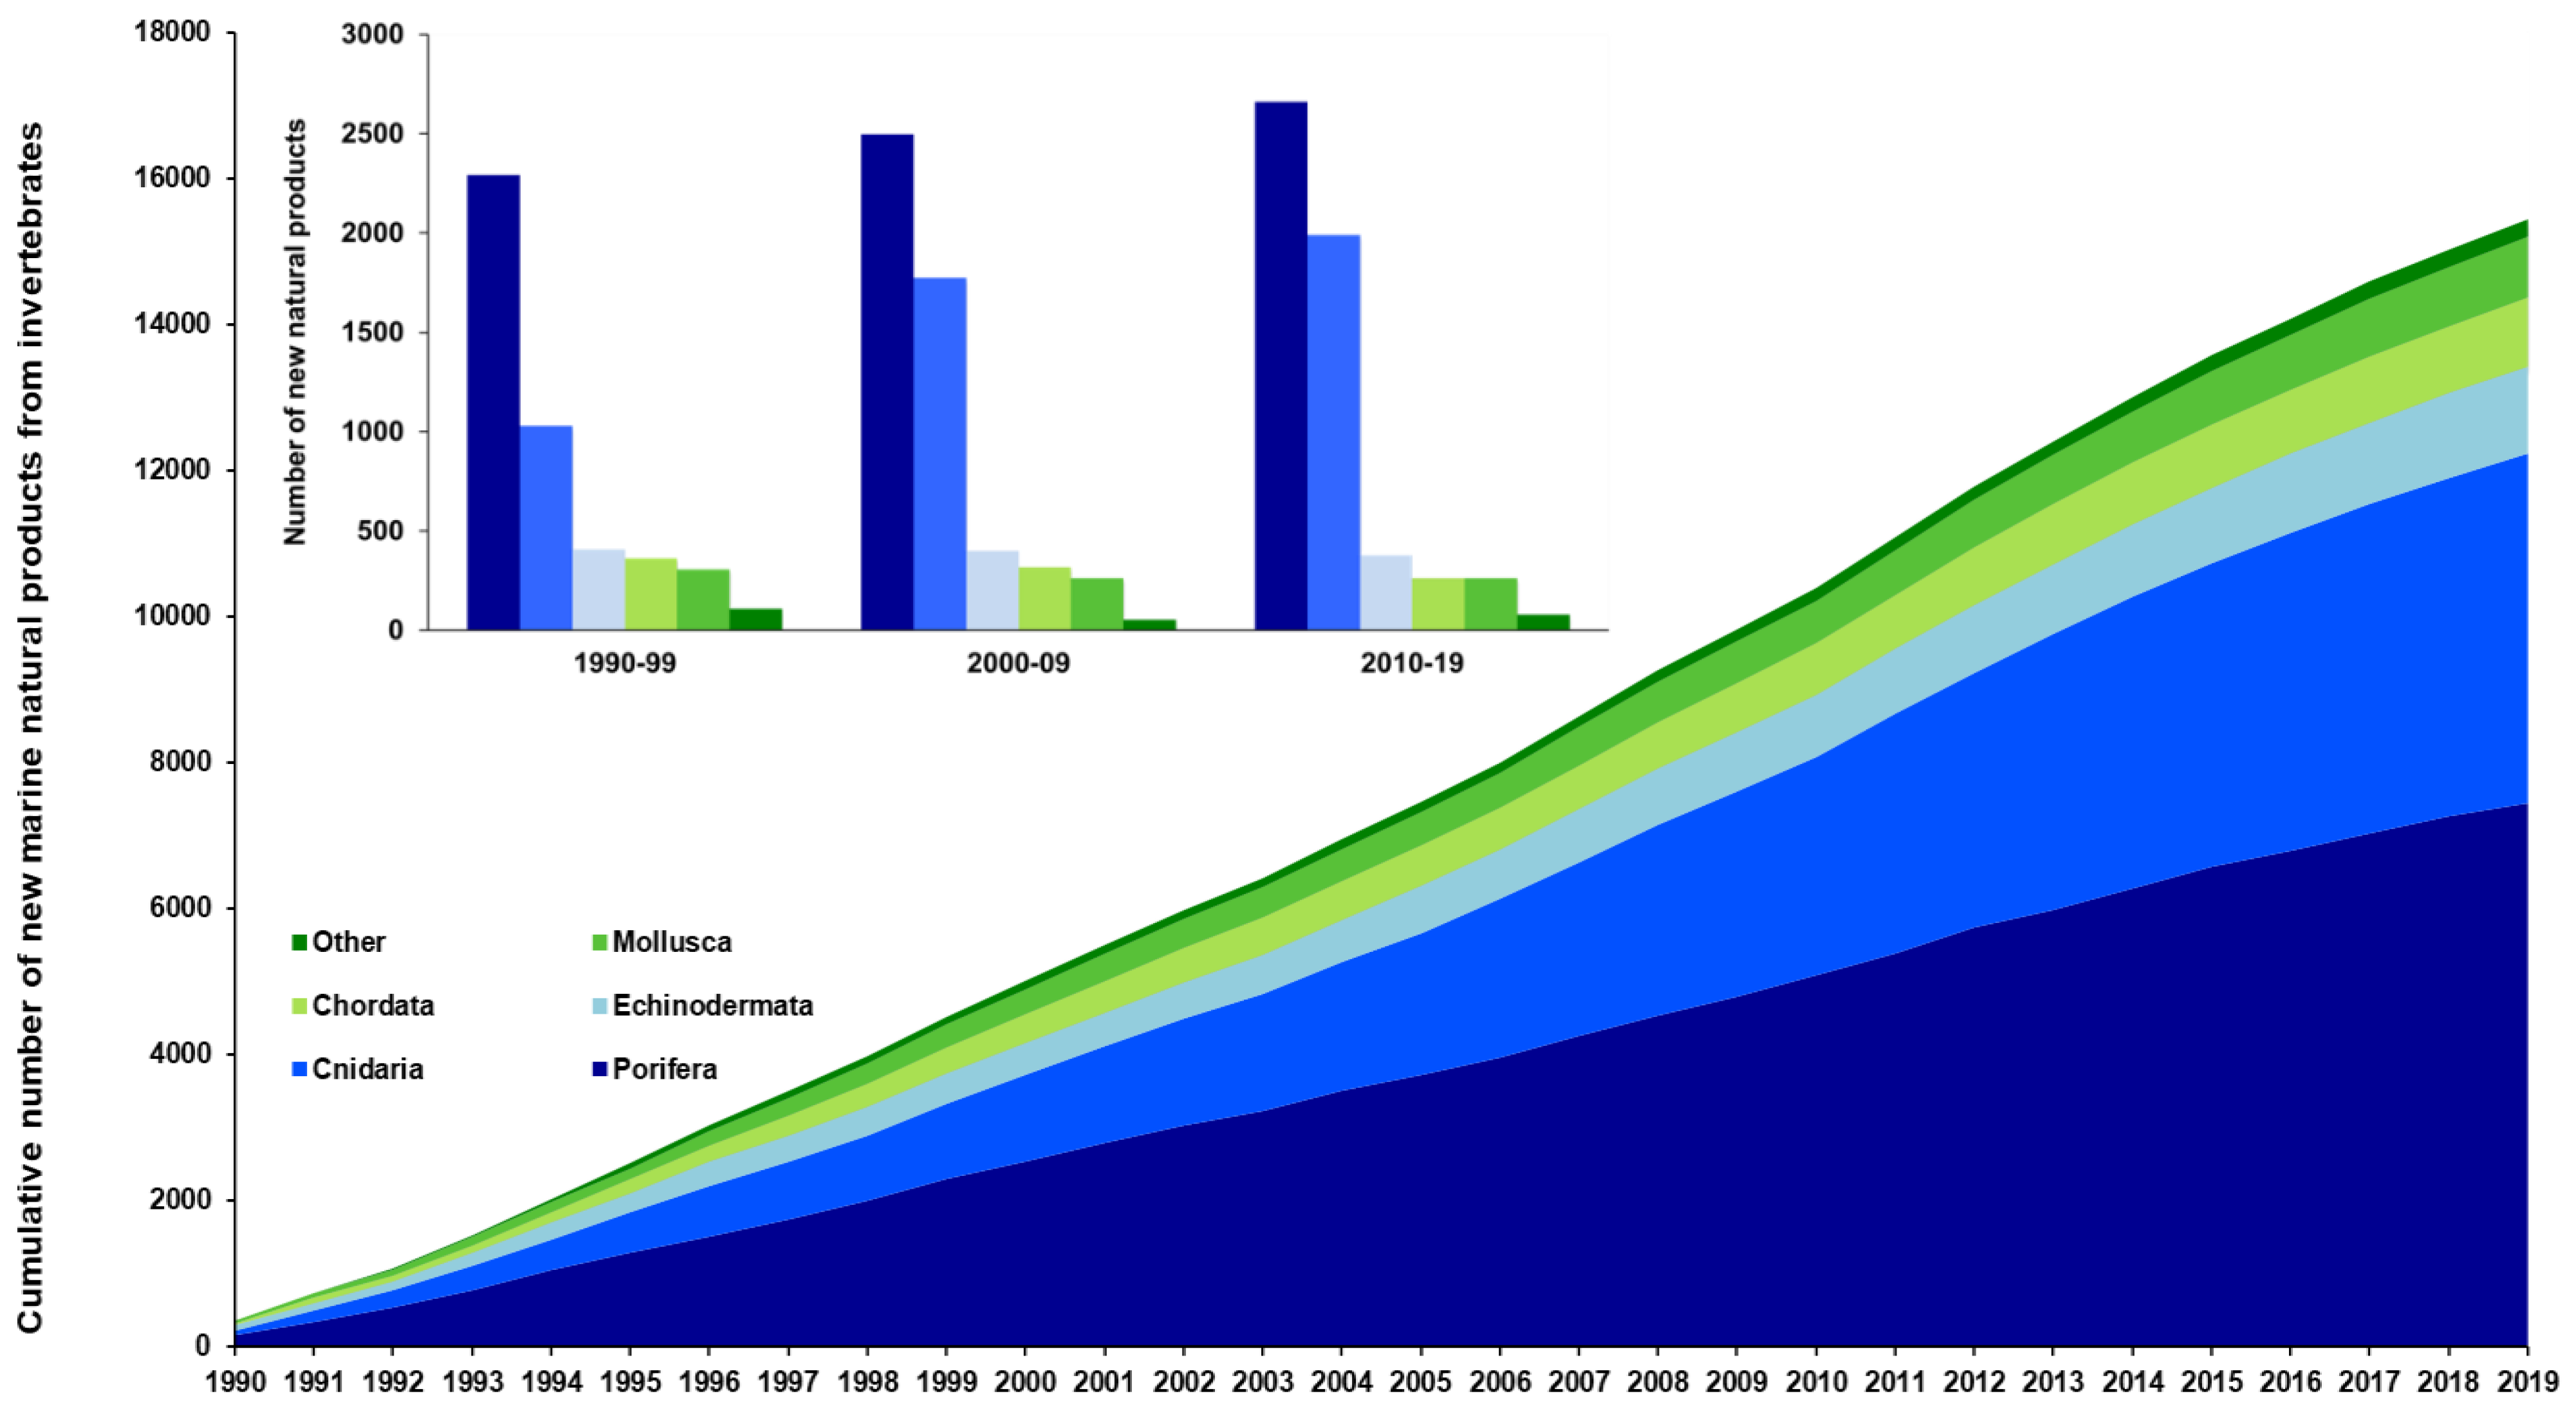
2.1.1. Porifera
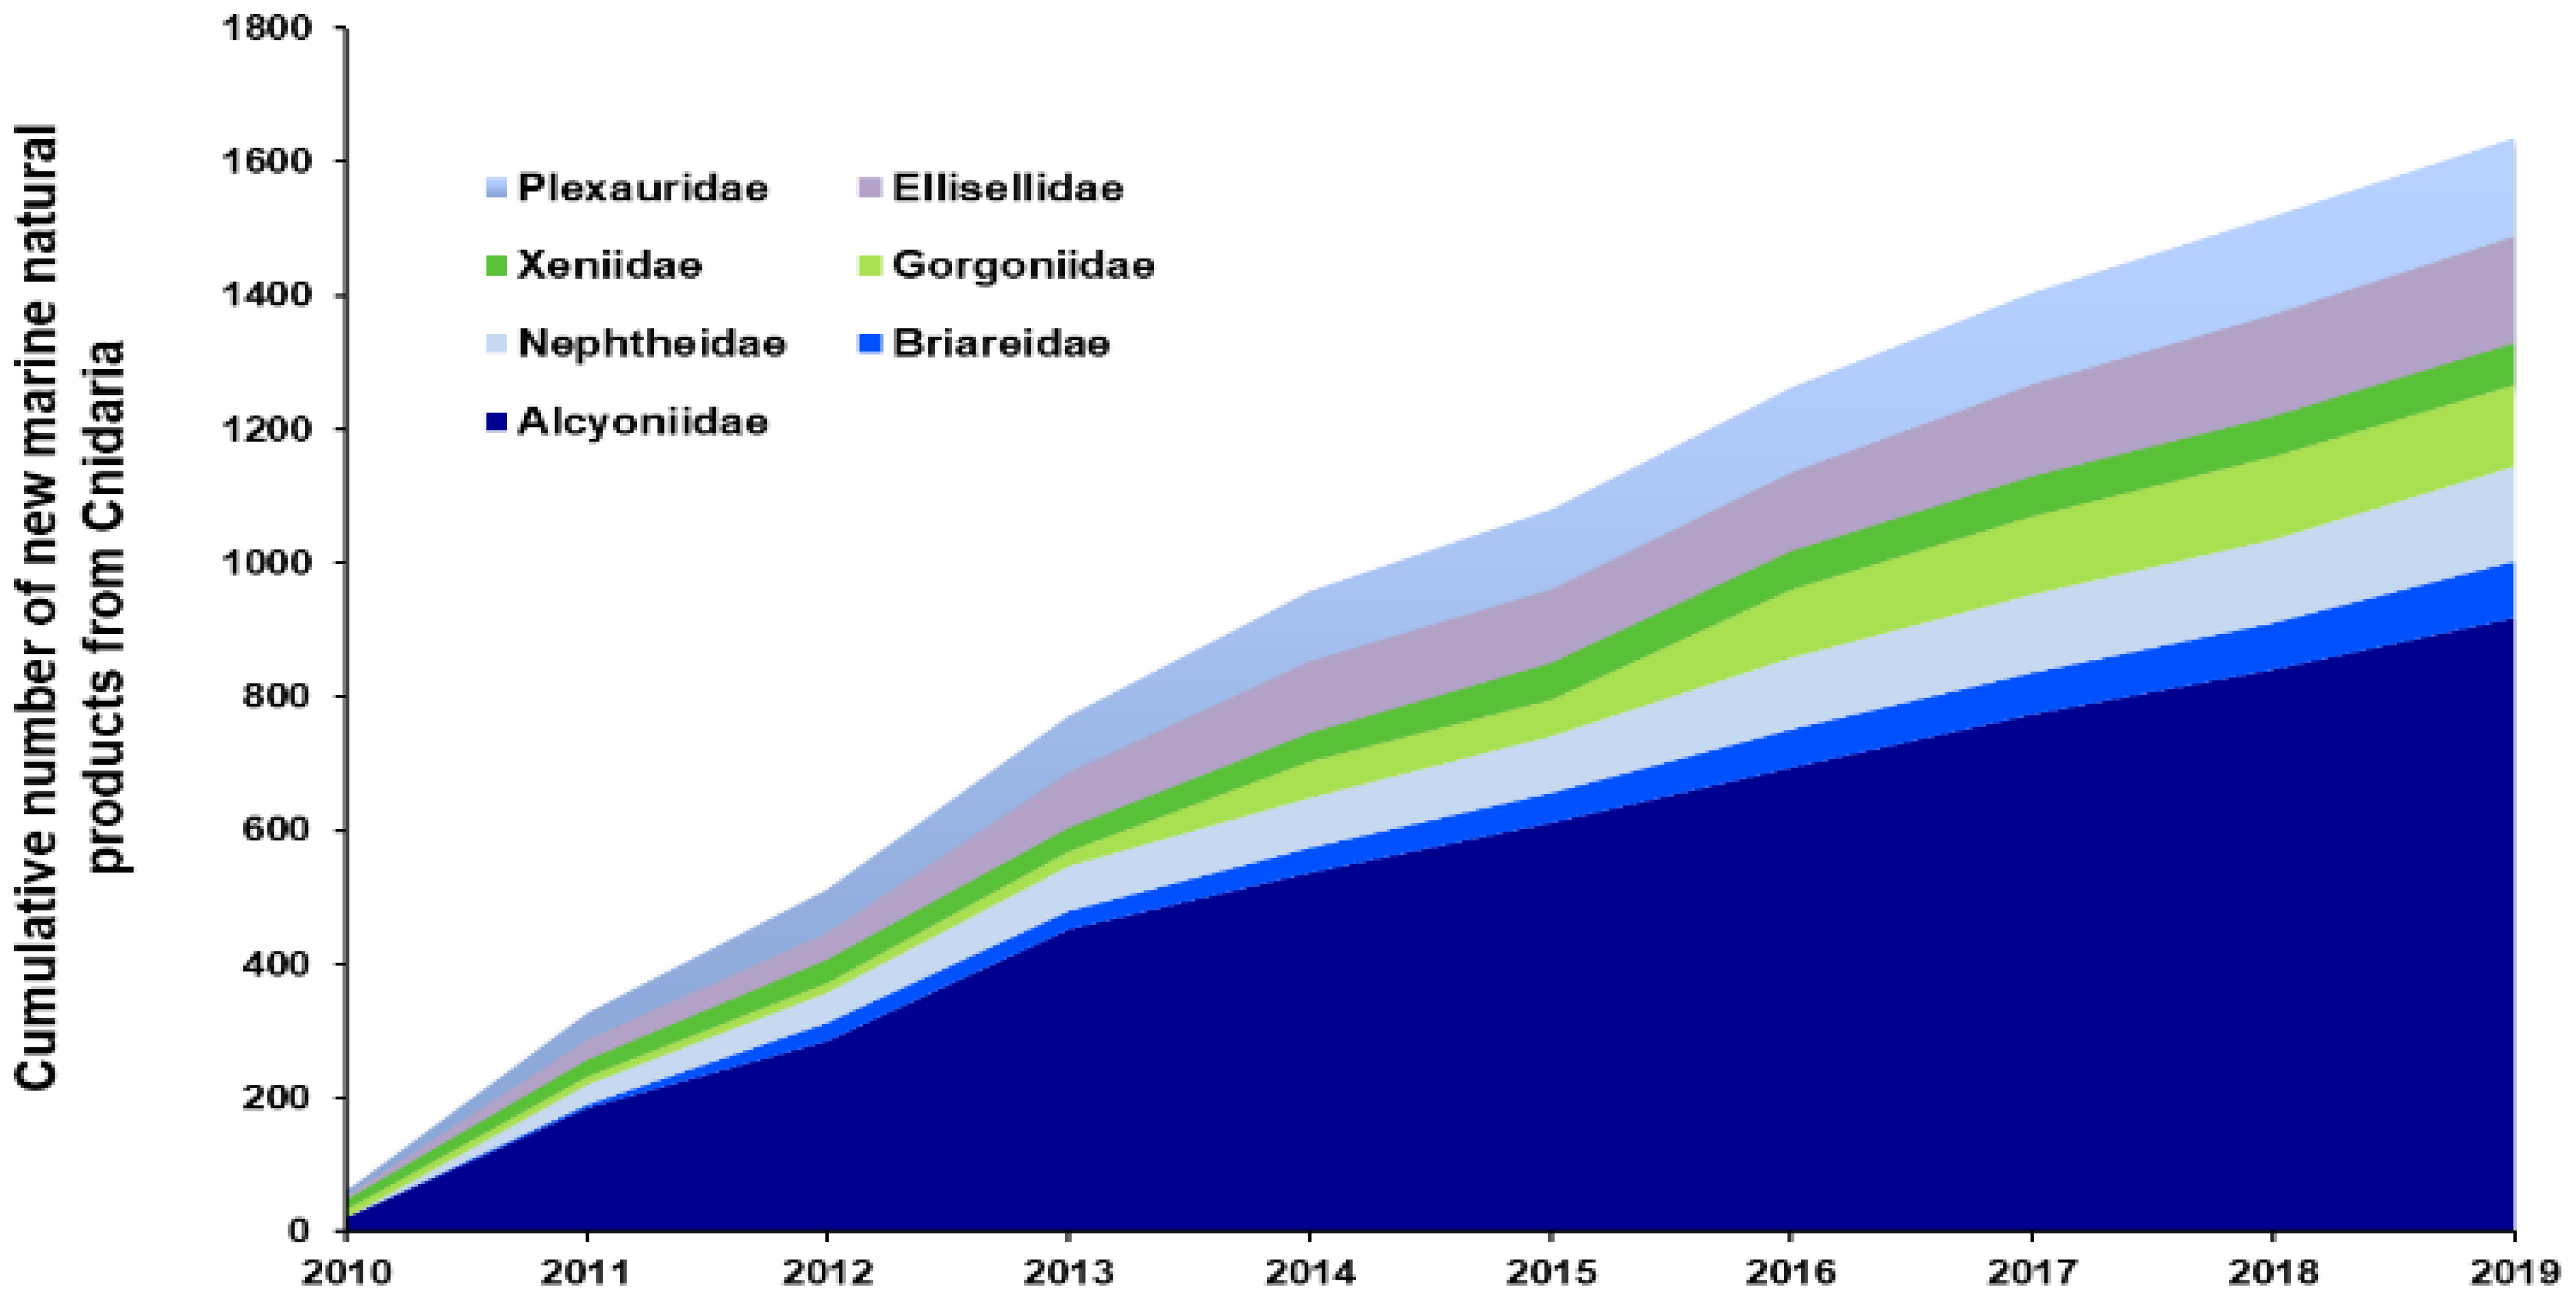
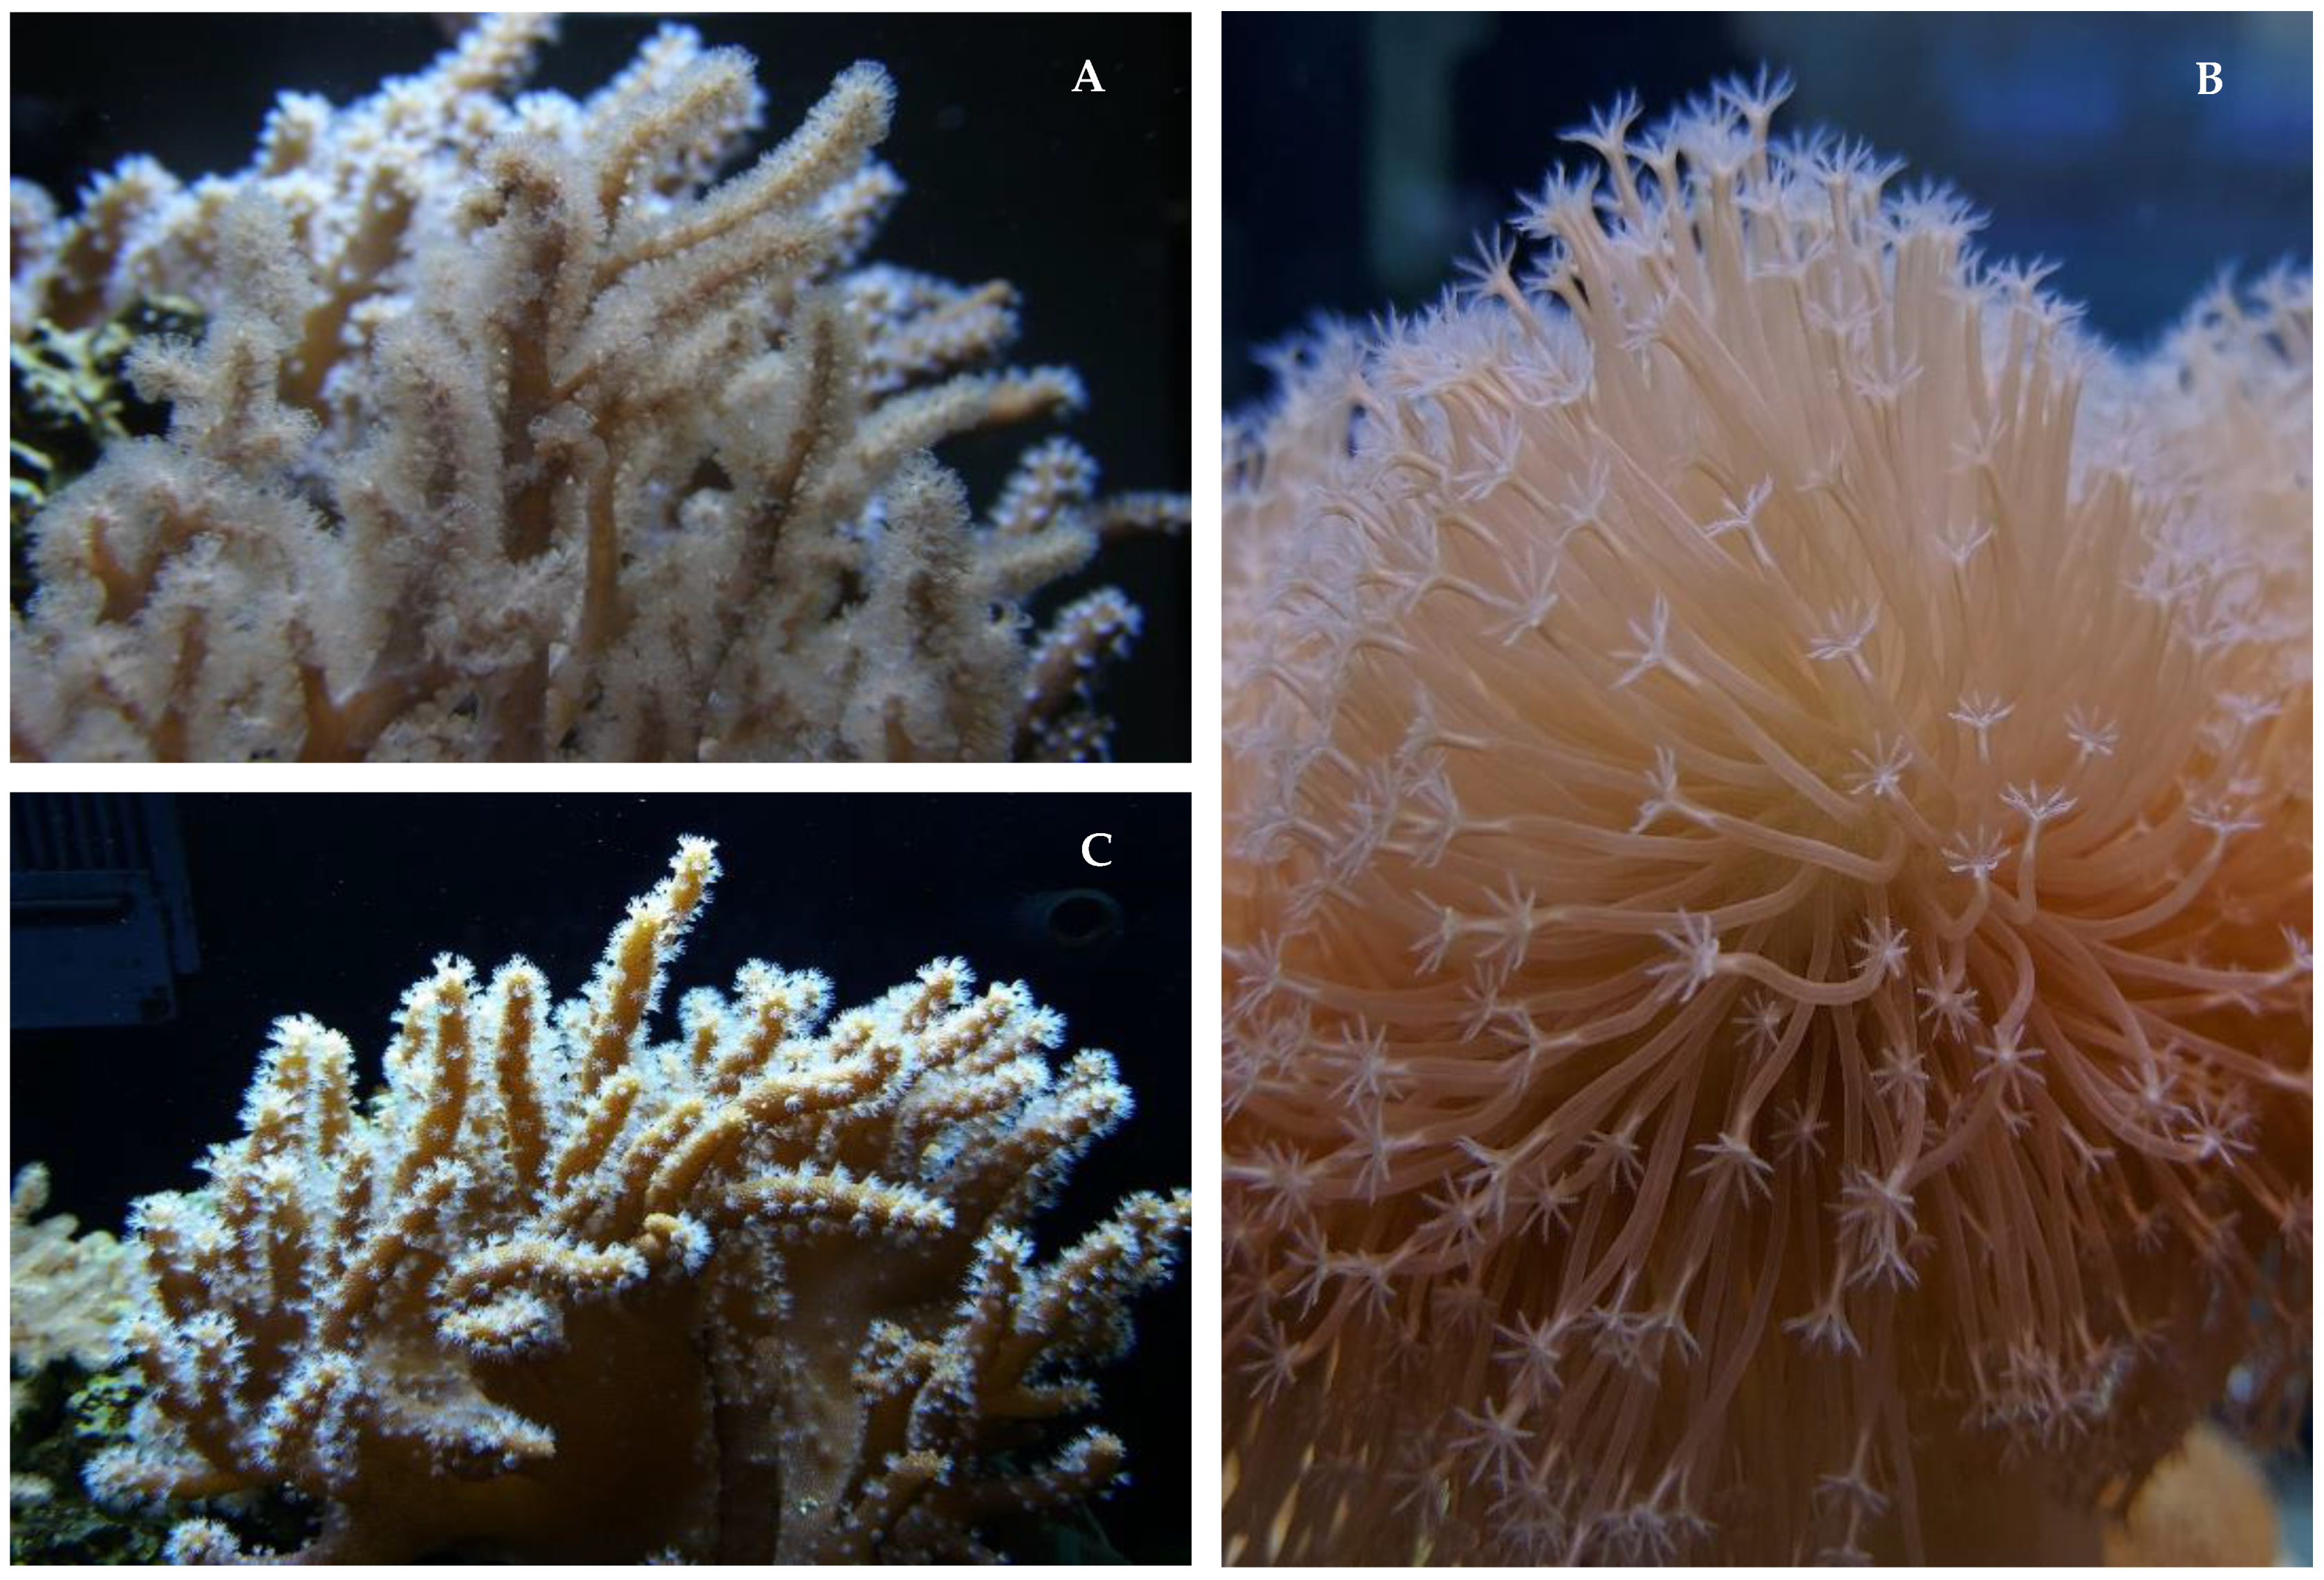
2.1.2. Cnidaria
2.1.3. Other Phyla
2.1.4. Bioprospecting Efforts and Natural Products Richness
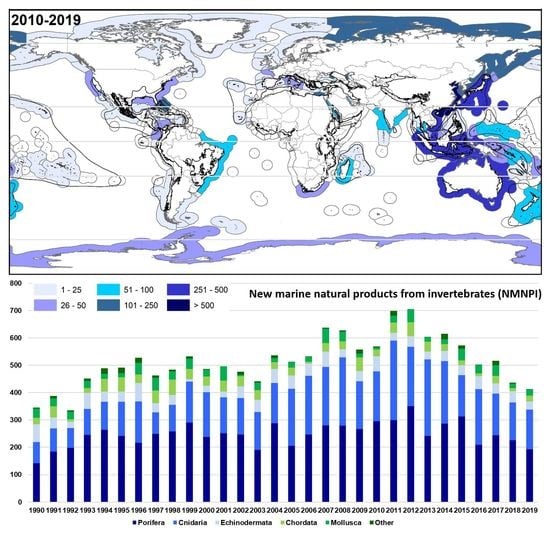
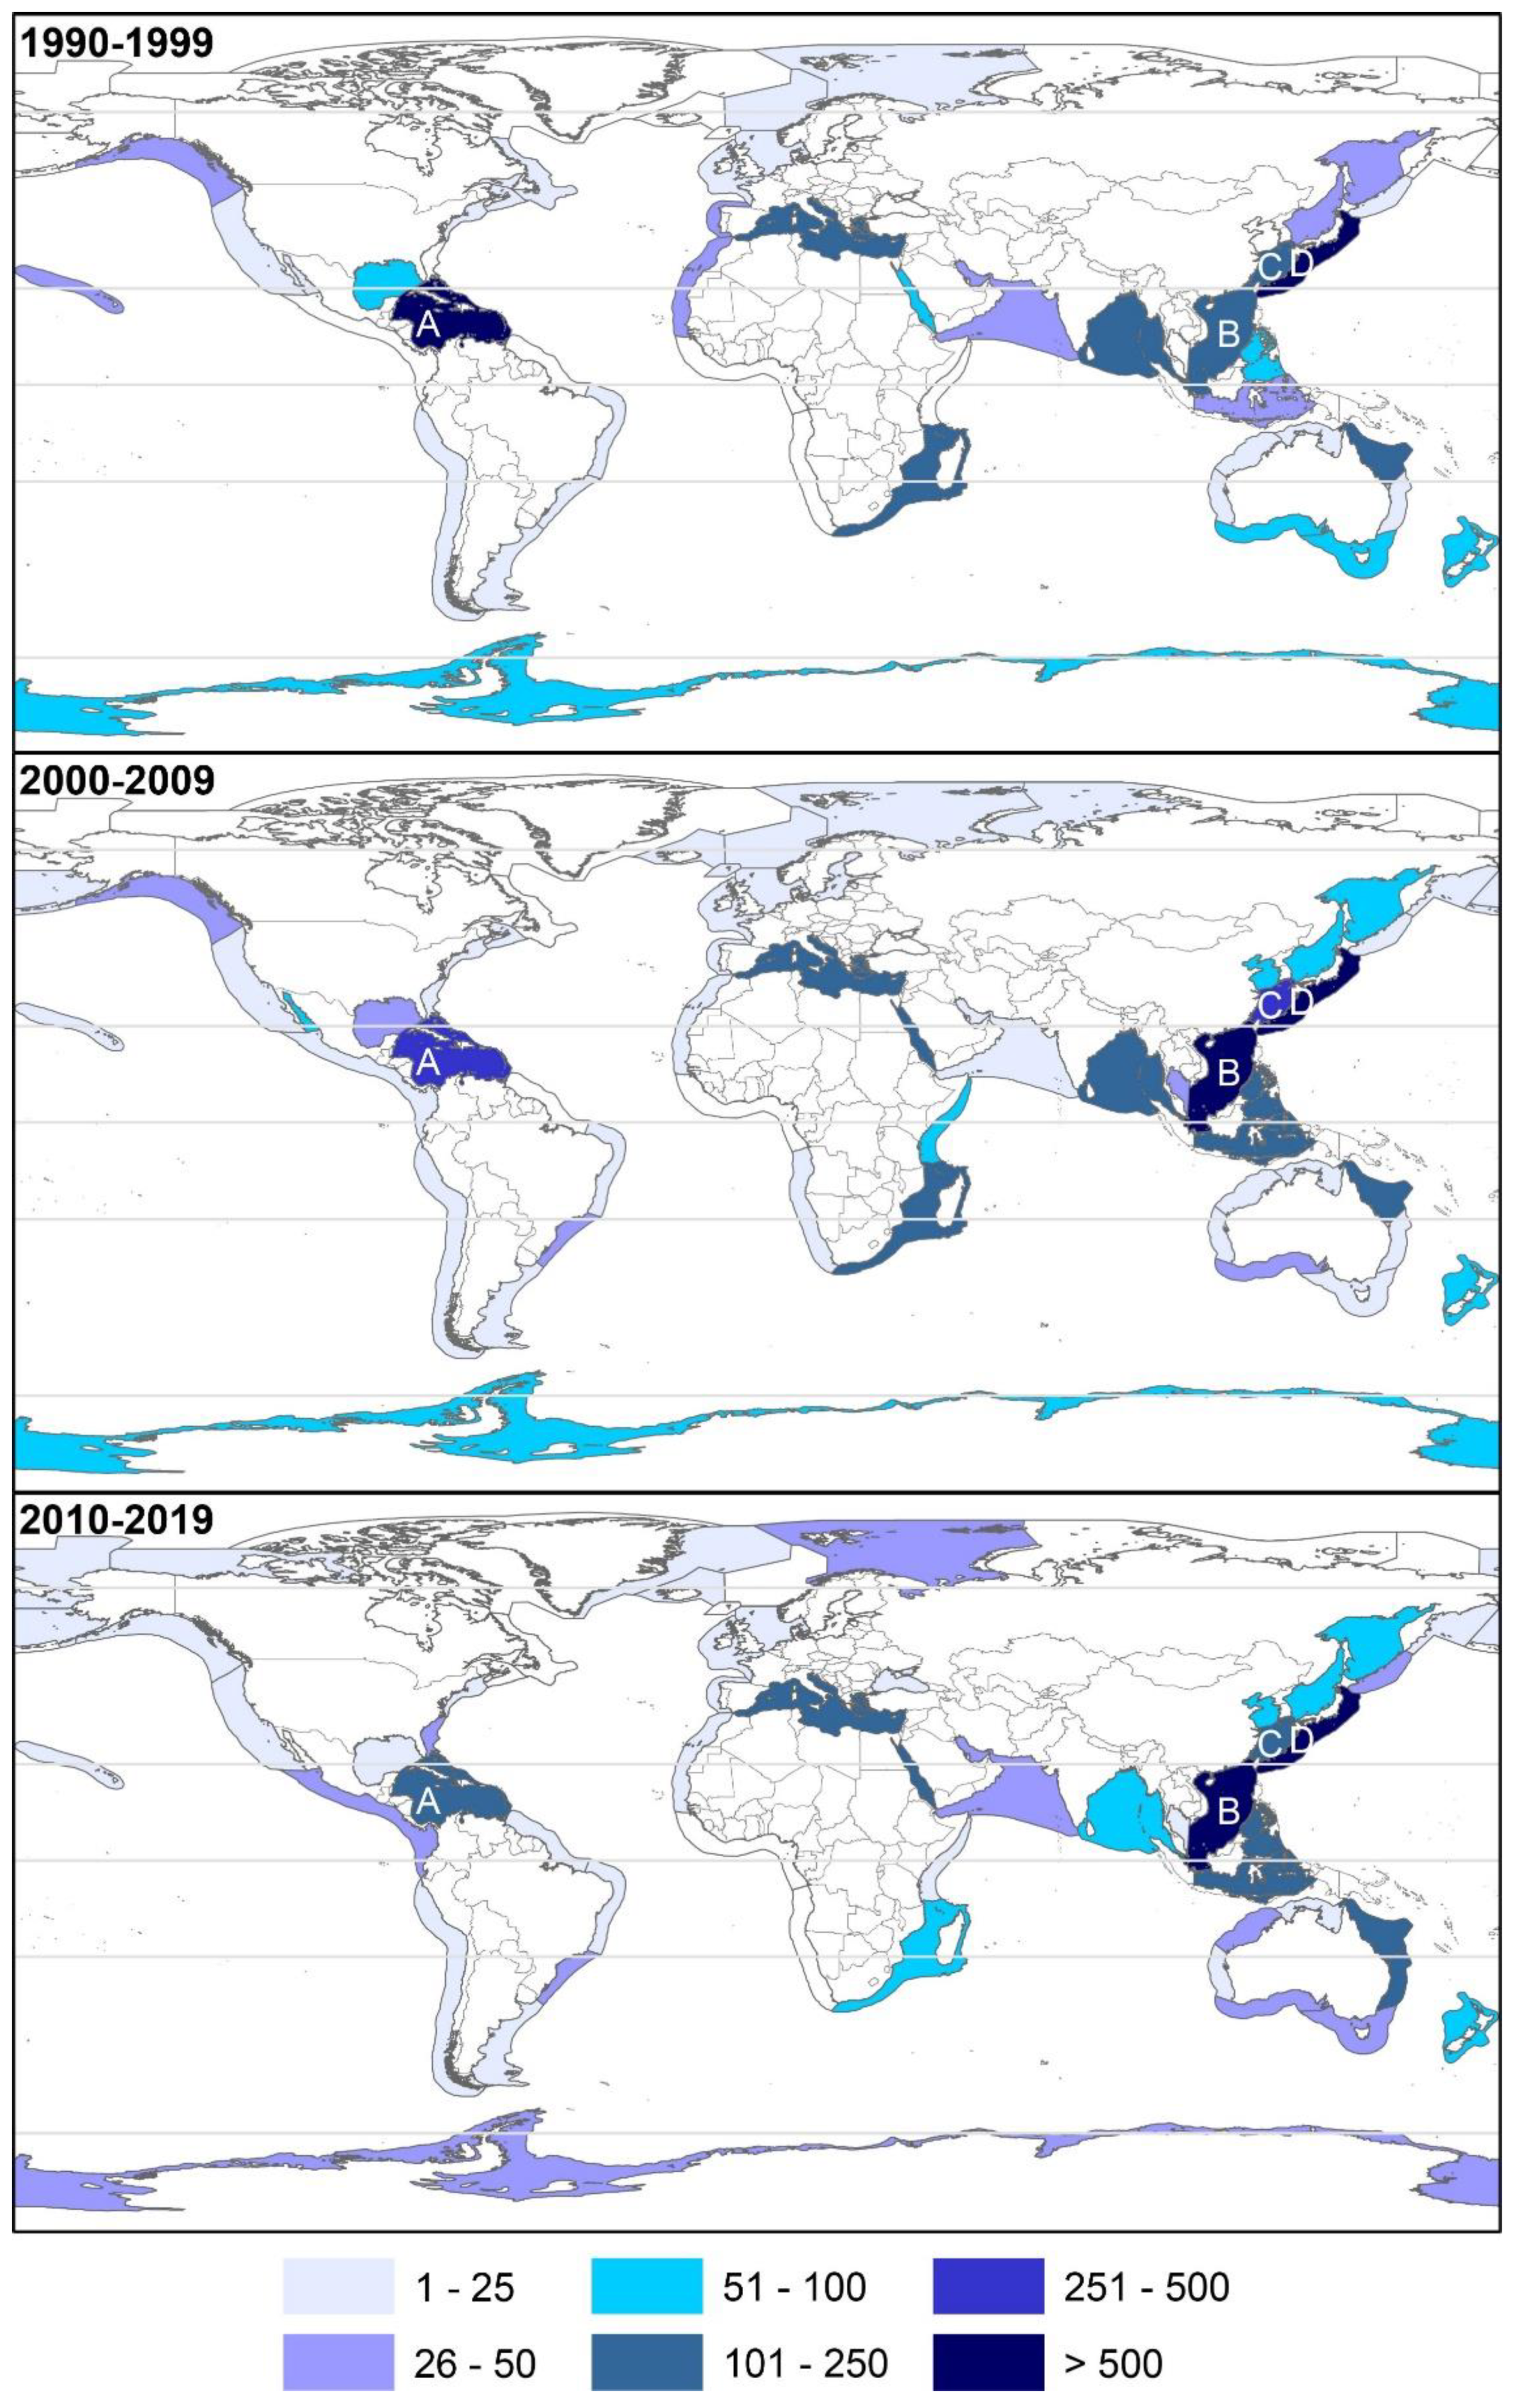
2.2. Geographical Trends
2.2.1. Latitudinal
2.2.2. Oceans and Continents
2.2.3. Country and Exclusive Economic Zones
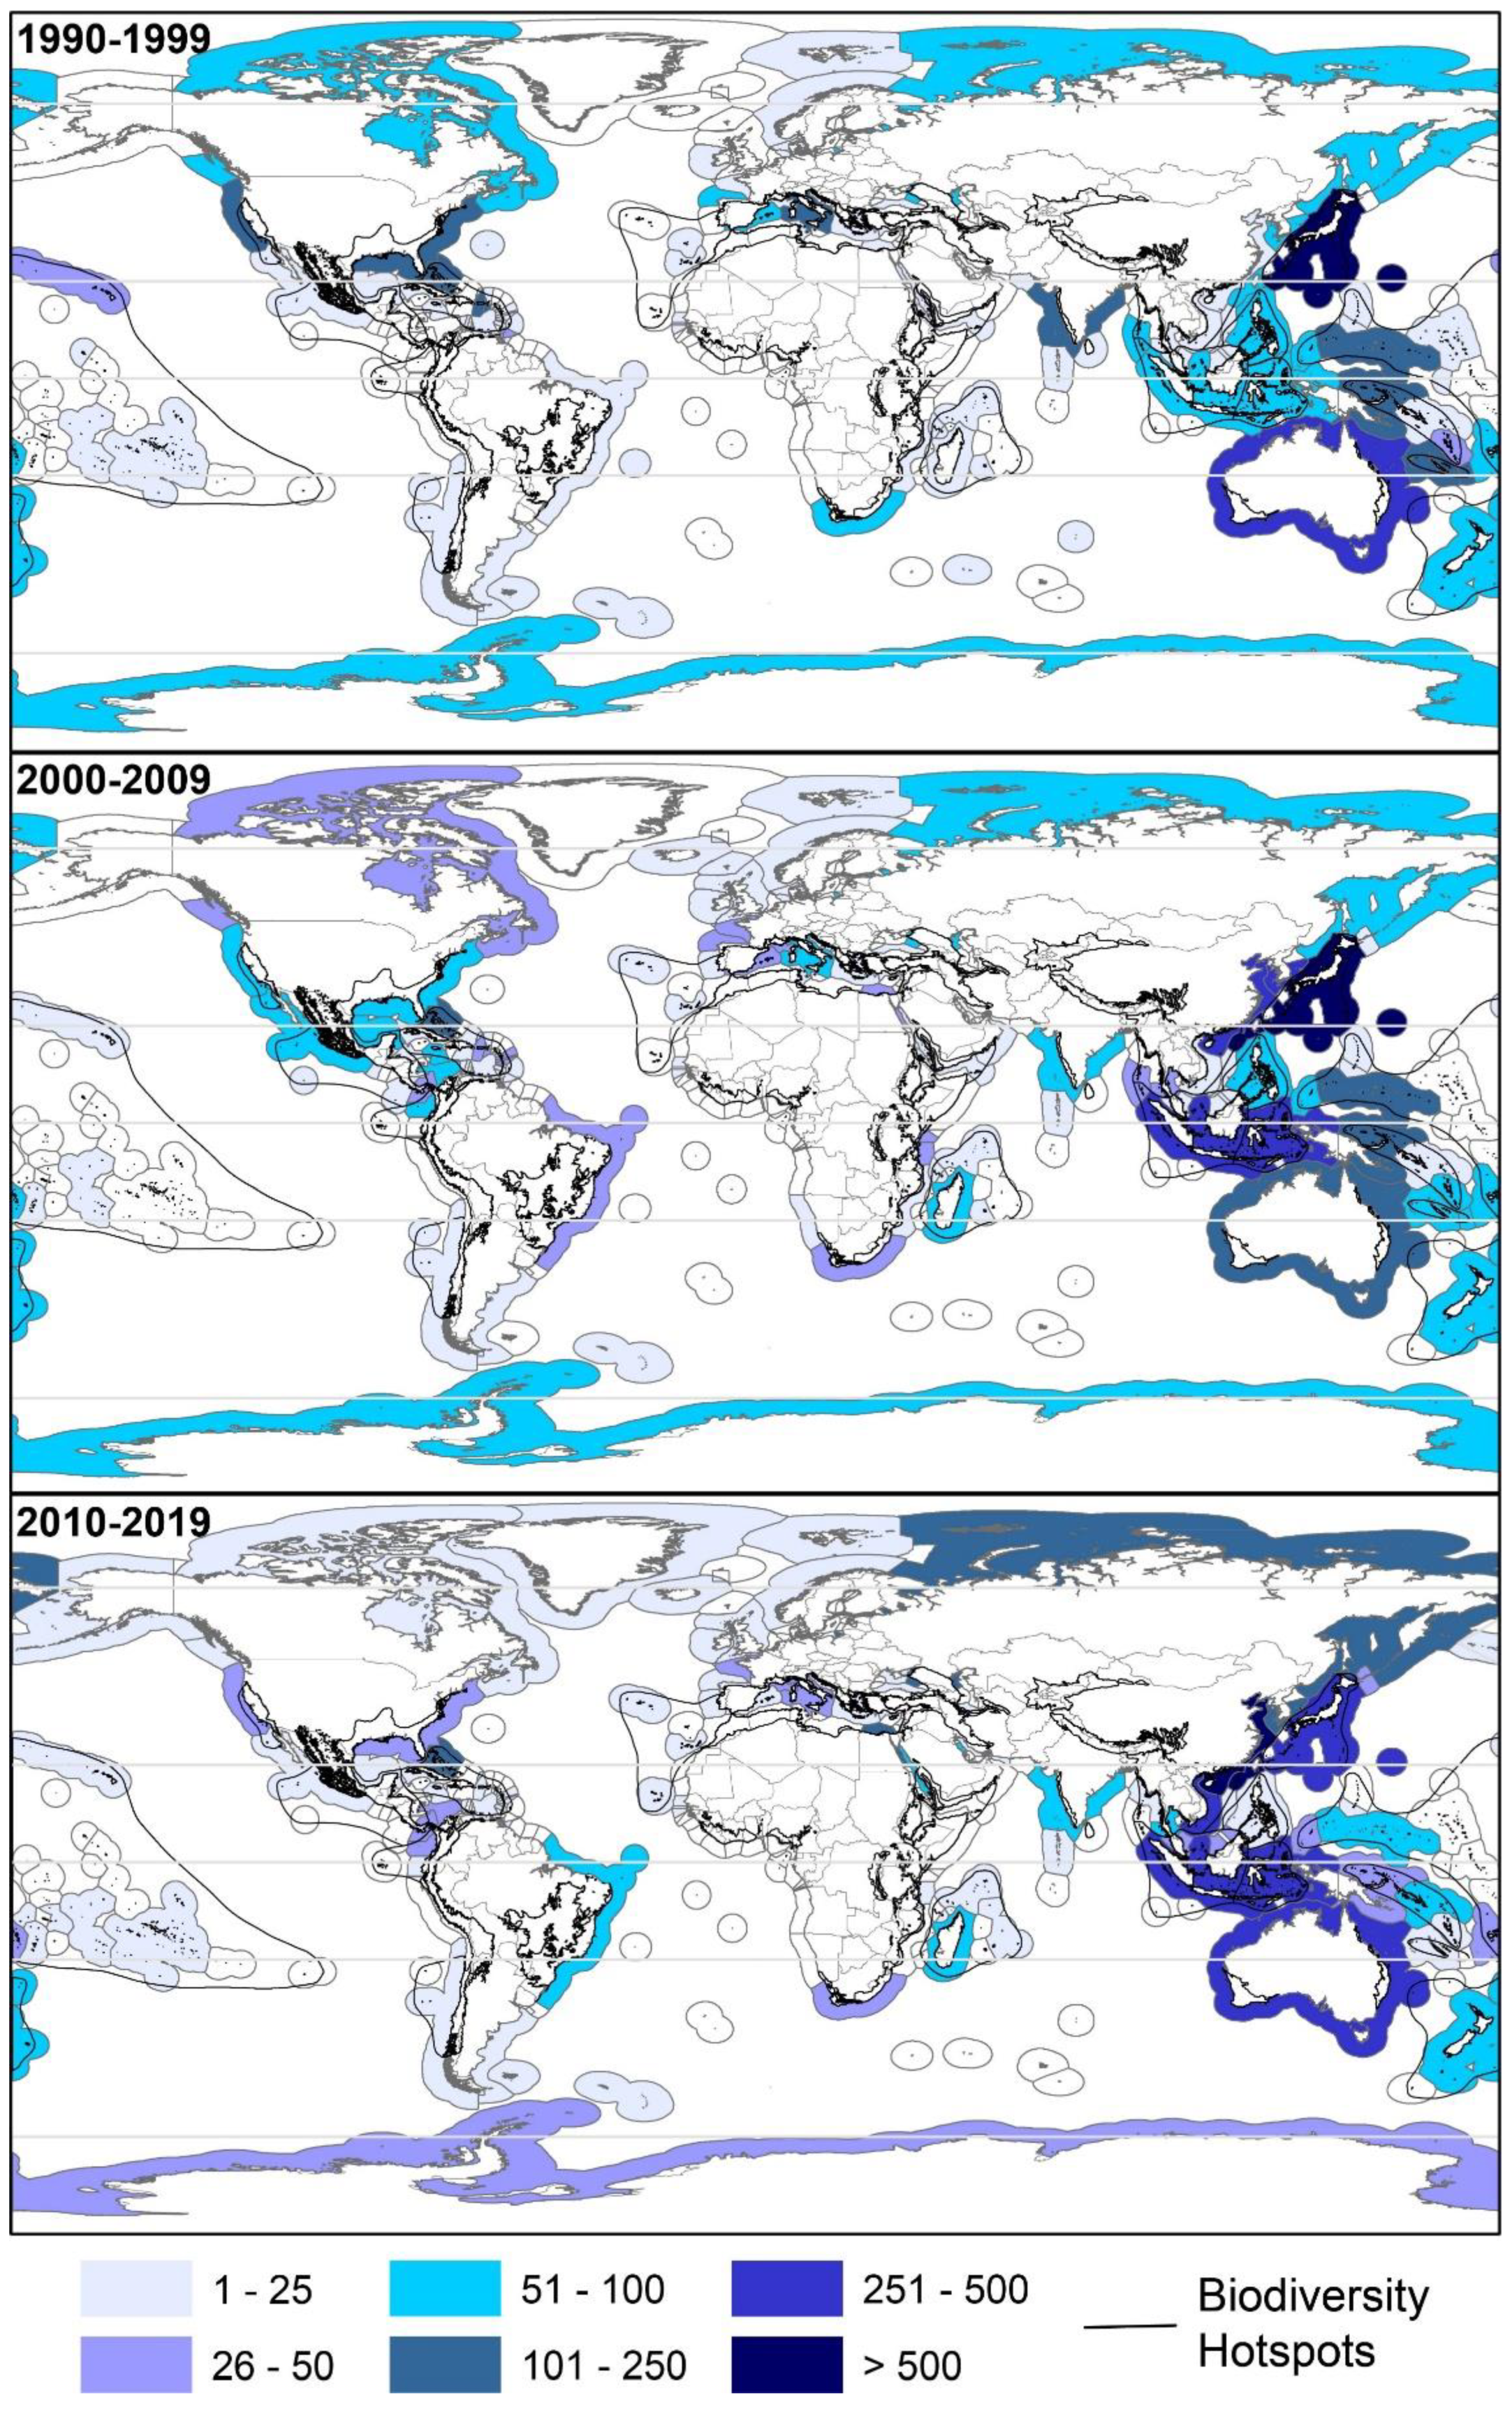
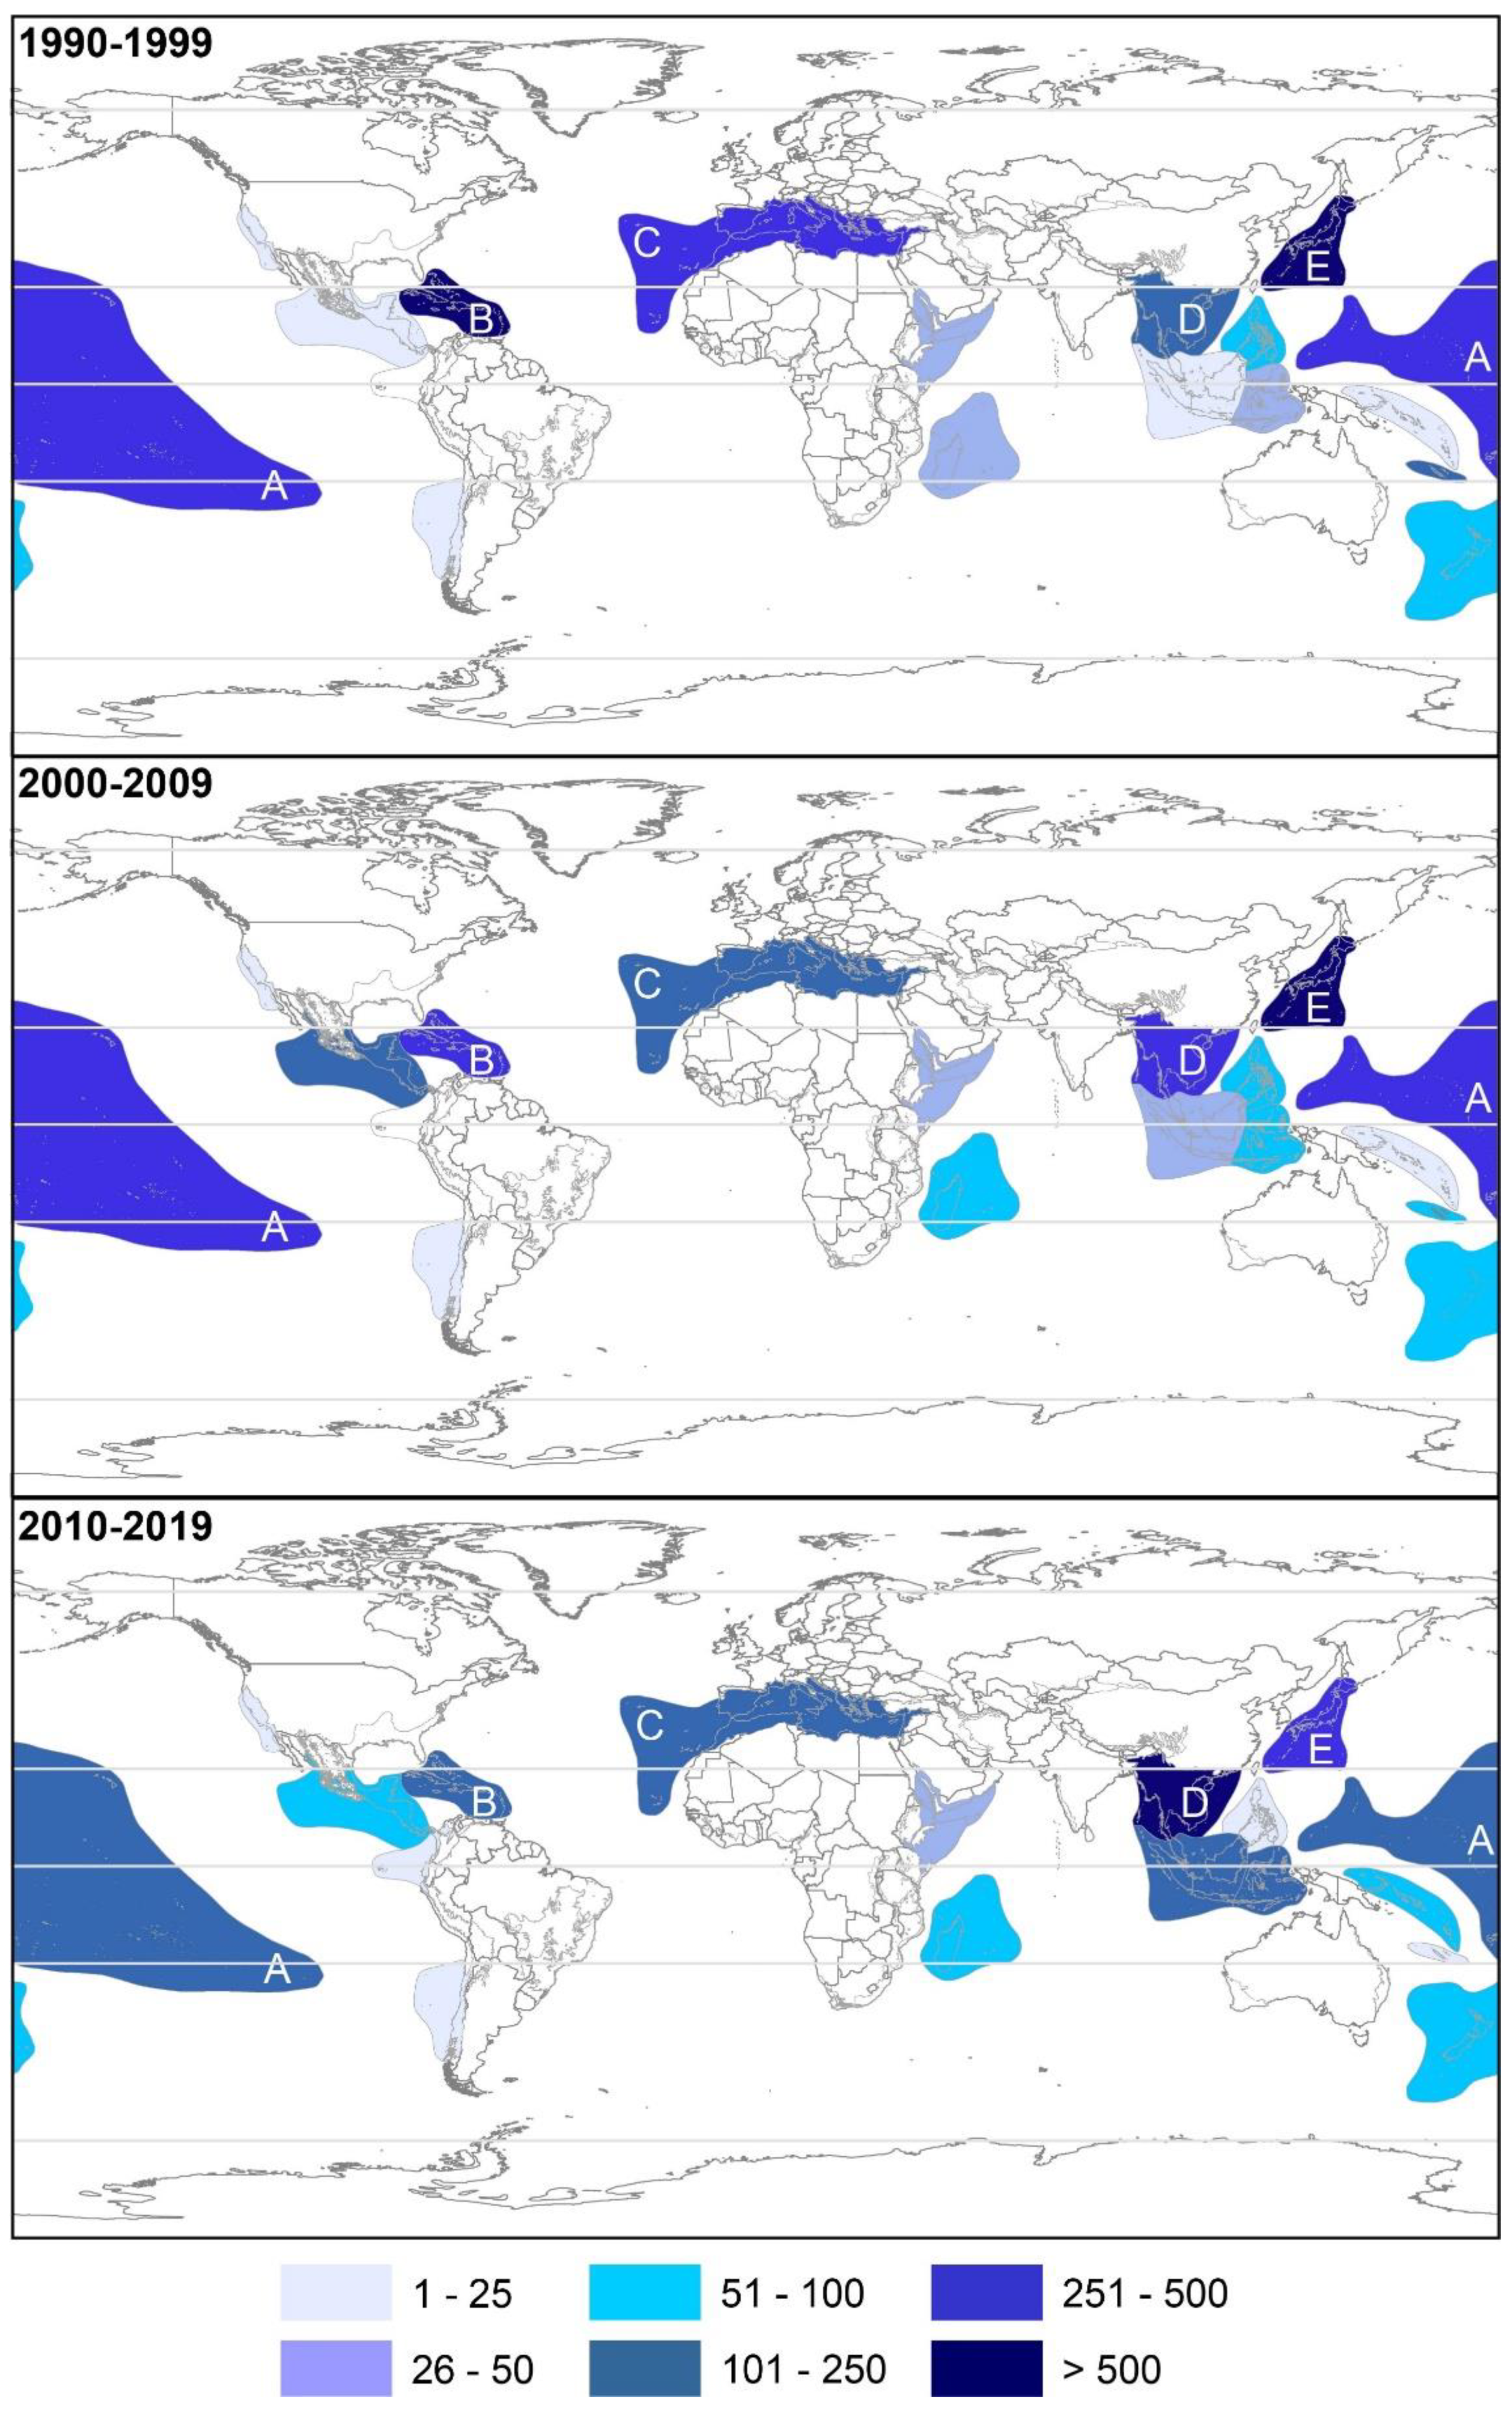
2.2.4. Biodiversity Hotspots and Large Marine Ecosystems
3. Discussion
4. Materials and Methods
5. Conclusions
Supplementary Materials
Author Contributions
Funding
Institutional Review Board Statement
Data Availability Statement
Acknowledgments
Conflicts of Interest
References
- Appeltans, W.; Ahyong, S.T.; Anderson, G.; Angel, M.V.; Artois, T.; Bailly, N.; Bamber, R.; Barber, A.; Bartsch, I.; Berta, A.; et al. The magnitude of global marine species diversity. Curr. Biol. 2012, 22, 2189–2202. [Google Scholar] [CrossRef] [PubMed] [Green Version]
- Carroll, A.R.; Copp, B.R.; Davis, R.A.; Keyzers, R.A.; Prinsep, M.R. Marine natural products. Nat. Prod. Rep. 2022, in press. [Google Scholar] [CrossRef] [PubMed]
- Calado, R.; Leal, M.C.; Gaspar, H.; Santos, S.; Marques, A.; Nunes, M.L.; Vieira, H. How to succeed in marketing marine natural products for nutraceutical, pharmaceutical and cosmeceutical markets. In Grand Challenges in Marine Biotechnology; Rampelotto, P.H., Trincone, A., Eds.; Springer International Publishing: Cham, Switzerland, 2018; pp. 317–403. [Google Scholar]
- Vieira, H.; Leal, M.C.; Calado, R. Fifty shades of blue: How blue biotechnology is shaping the bioeconomy. Trends Biotechnol. 2020, 38, 940–943. [Google Scholar] [CrossRef] [PubMed]
- Buck, M.; Hamilton, C. The Nagoya Protocol on Access to Genetic Resources and the Fair and Equitable Sharing of Benefits Arising from Their Utilization to the Convention on Biological Diversity. Rev. Eur. Comp. Int. Environ. Law 2011, 20, 47–61. [Google Scholar] [CrossRef]
- Leal, M.C.; Anaya-Rojas, J.M.; Munro, M.H.G.; Blunt, J.W.; Melian, C.J.; Calado, R.; Lurig, M.D. Fifty years of capacity building in the search for new marine natural products. Proc. Natl. Acad. Sci. USA 2020, 117, 24165–24172. [Google Scholar] [CrossRef]
- Leal, M.C.; Hilário, A.; Munro, M.H.G.; Blunt, J.W.; Calado, R. Natural products discovery needs improved taxonomic and geographic information. Nat. Prod. Rep. 2016, 33, 747–750. [Google Scholar] [CrossRef] [Green Version]
- Leal, M.C.; Munro, M.H.G.; Blunt, J.W.; Puga, J.; Jesus, B.; Calado, R.; Rosa, R.; Madeira, C. Biogeography and biodiscovery hotspots of macroalgal marine natural products. Nat. Prod. Rep. 2013, 30, 1380–1390. [Google Scholar] [CrossRef]
- Leal, M.C.; Puga, J.; Serodio, J.; Gomes, N.C.M.; Calado, R. Trends in the discovery of new marine natural products from invertebrates over the last two decades—Where and what are we bioprospecting? PLoS ONE 2012, 7, e30580. [Google Scholar] [CrossRef] [Green Version]
- Cardenas, P.; Perez, T.; Boury-Esnault, N. Sponge systematics facing new challenges. In Advances in Sponge Science: Phylogeny, Systematics, Ecology; Becerro, M.A., Uriz, M.J., Maldonado, M., Turon, X., Eds.; Elsevier: Amsterdam, The Netherlands, 2012; Volume 61, pp. 79–209. [Google Scholar]
- De Voogd, N.J.; Alvarez, B.; Boury-Esnault, N.; Carballo, J.L.; Cárdenas, P.; Díaz, M.-C.; Dohrmann, M.; Downey, R.; Hajdu, E.; Hooper, J.N.A.; et al. World Porifera Database. Available online: https://www.marinespecies.org/porifera (accessed on 2 April 2022).
- McFadden, C.S.; Van Ofwegen, L.P.; Beckman, E.J.; Benayahu, Y.; Alderslade, P. Molecular systematics of the speciose Indo-Pacific soft coral genus, Sinularia (Anthozoa: Octocorallia). Invertebr. Biol. 2009, 128, 303–323. [Google Scholar] [CrossRef]
- Quattrini, A.M.; Wu, T.; Soong, K.; Jeng, M.S.; Benayahu, Y.; McFadden, C.S. A next generation approach to species delimitation reveals the role of hybridization in a cryptic species complex of corals. BMC Evol. Biol. 2019, 19, 116. [Google Scholar] [CrossRef] [Green Version]
- Maloney, K.N.; Botts, R.T.; Davis, T.S.; Okada, B.K.; Maloney, E.M.; Leber, C.A.; Alvarado, O.; Brayton, C.; Caraballo-Rodriguez, A.M.; Chari, J.V.; et al. Cryptic species account for the seemingly idiosyncratic secondary metabolism of Sarcophyton glaucum specimens collected in Palau. J. Nat. Prod. 2020, 83, 693–705. [Google Scholar] [CrossRef] [PubMed]
- Horton, T.; Kroh, A.; Ahyong, S.; Bailly, N.; Boyko, C.B.; Brandão, S.N.; Gofas, S.; Hooper, J.N.A.; Hernandez, F.; Holovachov, O.; et al. World Register of Marine Species (WoRMS). In WoRMS Editorial Board; 2020; Available online: https://www.marinespecies.org/ (accessed on 2 April 2022).
- McCauley, D.J.; Pinsky, M.L.; Palumbi, S.R.; Estes, J.A.; Joyce, F.H.; Warner, R.R. Marine defaunation: Animal loss in the global ocean. Science 2015, 347, 1255641. [Google Scholar] [CrossRef] [PubMed] [Green Version]
- Hughes, T.P.; Anderson, K.D.; Connolly, S.R.; Heron, S.F.; Kerry, J.T.; Lough, J.M.; Baird, A.H.; Baum, J.K.; Berumen, M.L.; Bridge, T.C.; et al. Spatial and temporal patterns of mass bleaching of corals in the Anthropocene. Science 2018, 359, 80–83. [Google Scholar] [CrossRef] [PubMed] [Green Version]
- Riccaboni, M.; Verginer, L. The impact of the COVID-19 pandemic on scientific research in the life sciences. PLoS ONE 2022, 17, e0263001. [Google Scholar] [CrossRef]
- MarinLit—Dedicated to Marine Natural Products Research. Available online: https://marinlit.rsc.org/ (accessed on 3 April 2021).
- Pham, J.V.; Yilma, M.A.; Feliz, A.; Majid, M.T.; Maffetone, N.; Walker, J.R.; Kim, E.; Cho, H.J.; Reynolds, J.M.; Song, M.C.; et al. A review of the microbial production of bioactive natural products and biologics. Front. Microbiol. 2019, 10, 1404. [Google Scholar] [CrossRef] [Green Version]
- Indraningrat, A.A.G.; Smidt, H.; Sipkema, D. Bioprospecting Sponge-Associated Microbes for Antimicrobial Compounds. Mar. Drugs 2016, 14, 87. [Google Scholar] [CrossRef]
- Leal, M.C.; Calado, R.; Sheridan, C.; Alimonti, A.; Osinga, R. Coral aquaculture to support drug discovery. Trends Biotechnol. 2013, 31, 555–561. [Google Scholar] [CrossRef]
- Liu, X.J.; Teixeira, J.S.; Ner, S.; Ma, K.S.V.; Petronella, N.; Banerjee, S.; Ronholm, J. Exploring the potential of the microbiome as a marker of the geographic origin of fresh seafood. Front. Microbiol. 2020, 11, 696. [Google Scholar] [CrossRef]
- Wolfender, J.L.; Litaudon, M.; Touboul, D.; Queiroz, E.F. Innovative omics-based approaches for prioritisation and targeted isolation of natural products-new strategies for drug discovery. Nat. Prod. Rep. 2019, 36, 855–868. [Google Scholar] [CrossRef] [Green Version]
- Van Santen, J.A.; Kautsar, S.A.; Medema, M.H.; Linington, R.G. Microbial natural product databases: Moving forward in the multi-omics era. Nat. Prod. Rep. 2021, 38, 264–278. [Google Scholar] [CrossRef]
- Chandra Mohana, N.; Yashavantha Rao, H.C.; Rakshith, D.; Mithun, P.R.; Nuthan, B.R.; Satish, S. Omics based approach for biodiscovery of microbial natural products in antibiotic resistance era. J. Genet. Eng. Biotechnol. 2018, 16, 1–8. [Google Scholar] [CrossRef] [PubMed]
- Saldivar-Gonzalez, F.I.; Aldas-Bulos, V.D.; Medina-Franco, J.L.; Plisson, F. Natural product drug discovery in the artificial intelligence era. Chem. Sci. 2022, 13, 1526–1546. [Google Scholar] [CrossRef] [PubMed]


| Taxon | Common Name | NMNP | Decadal Variation (%) | ||||
|---|---|---|---|---|---|---|---|
| 1990s | 2000s | 2010s | 1990s 2000s | 1990s 2010s | 2000s 2010s | ||
| Phylum Cnidaria | 1031 | 1773 | 1989 | +72 | +93 | +12 | |
| Class Anthozoa | 1017 | 1758 | 1977 | +73 | +94 | +12 | |
| Sub-class Octocorallia | 963 | 1715 | 1901 | +78 | +97 | +11 | |
| Order Alcyonacea | 934 | 1694 | 1896 | +81 | +103 | +12 | |
| Family Alcyoniidae | Soft corals | 293 | 489 | 1001 | +67 | +242 | +105 |
| Family Ellisellidae | Sea fans | 29 | 97 | 160 | +234 | +452 | +65 |
| Family Gorgoniidae | Sea fans | 109 | 165 | 116 | +51 | +6 | −30 |
| Family Nephtheidae | Soft corals | 58 | 227 | 160 | +291 | +176 | −30 |
| Family Plexauridae | Sea fans | 97 | 99 | 157 | +2 | +62 | +59 |
| Phylum Porifera | Sponges | 2291 | 2496 | 2659 | +9 | +16 | +7 |
| Class Demospongiae | 2287 | 2492 | 2416 | +9 | +6 | −3 | |
| Sub-class Heteroscleromorpha | 1654 | 1755 | 1596 | +6 | −4 | −9 | |
| Order Agelasida | 85 | 56 | 122 | −34 | +44 | +118 | |
| Family Agelasidae | 77 | 55 | 118 | −29 | +53 | +115 | |
| Order Haplosclerida | 424 | 403 | 413 | −5 | −3 | +2 | |
| Family Petrosiidae | 209 | 209 | 239 | 0 | +14 | +14 | |
| Order Tetractinellida | NA | NA | 322 | NA | NA | NA | |
| Family Ancorinidae | 86 | 165 | 113 | +92 | +31 | −32 | |
| Family Theonellidae | 133 | 71 | 109 | −47 | −18 | +54 | |
| Sub-class Keratosa | 488 | 610 | 308 | +25 | −37 | −50 | |
| Order Dictyoceratida | 488 | 610 | 606 | +25 | +24 | −1 | |
| Family Thorectidae | 175 | 261 | 295 | +49 | +69 | +13 | |
| Order Homosclerophorida | 110 | 155 | 178 | +41 | +62 | +15 | |
| Family Plakinidae | 110 | 155 | 173 | +41 | +57 | +12 | |
| Taxon | Common Name | NMNP | Decadal Variation (%) | ||||
|---|---|---|---|---|---|---|---|
| 1990s | 2000s | 2010s | 1990s 2000s | 1990s 2010s | 2000s 2010s | ||
| Phylum Echinodermata | 409 | 400 | 379 | −2 | −7 | −5 | |
| Class Asteroidea | Sea stars | 293 | 236 | 164 | −19 | −44 | −31 |
| Order Valvatida | 106 | 138 | 115 | +30 | +8 | −17 | |
| Family Oreasteridae | 24 | 24 | 72 | 0 | +200 | +200 | |
| Class Holothuroidea | Sea cucumbers | 86 | 127 | 181 | +48 | +110 | +43 |
| Order Dendrochirotida | 55 | 53 | 129 | −4 | +135 | +143 | |
| Family Sclerodactylidae | 3 | 0 | 64 | −100 | +2033 | NA | |
| Family Cucumariidae | 48 | 46 | 32 | −4 | −33 | −30 | |
| Phylum Chordata | 361 | 317 | 262 | −12 | −27 | −17 | |
| Class Ascidiacea | Sea squirts | 361 | 317 | 262 | −12 | −27 | −17 |
| Order Aplousobranchia | 299 | 264 | 192 | −12 | −36 | −27 | |
| Family Didemnidae | 117 | 123 | 82 | +5 | −30 | −33 | |
| Family Polyclinidae | 49 | 63 | 53 | +29 | +8 | −16 | |
| Phylum Mollusca | 308 | 263 | 262 | −15 | −15 | −0 | |
| Class Gastropoda | 279 | 193 | 230 | −31 | −18 | +19 | |
| Order Nudibranchia | Sea slugs | 116 | 53 | 146 | −54 | +26 | +175 |
| Family Chromodorididae | 54 | 11 | 69 | −80 | +28 | +527 | |
| Phylum Annelida | Bristle worms | 22 | 7 | 4 | −68 | −82 | −43 |
| Phylum Bryozoa | Moss animals | 71 | 42 | 73 | −41 | +3 | +74 |
| Phylum Arthropoda | Crustaceans | 0 | 4 | 1 | - | - | - |
| Phylum Brachiopoda | 4 | 0 | 0 | - | - | - | |
| Phylum Hemichordata | 9 | 0 | 1 | - | - | - | |
| Phylum Platyhelmintes | Flatworms | 2 | 2 | 0 | - | - | - |
| EEZ | NMNPIs | Decadal Variation (%) | ||||
|---|---|---|---|---|---|---|
| 1990s | 2000s | 2010s | 1990s 2000s | 1990s 2010s | 2000s 2010s | |
| Antarctica | 97 | 80 | 49 | −18 | −49 | −39 |
| Australia | 441 | 248 | 392 | −44 | −11 | +58 |
| Bahamas | 167 | 125 | 122 | −25 | −27 | −2 |
| Brazil | 12 | 46 | 51 | +283 | +325 | +11 |
| China | 27 | 397 | 1390 | +1370 | +5048 | +250 |
| Colombia | 0 | 87 | 34 | NA | NA | −61 |
| Egypt | 12 | 41 | 139 | +242 | +1058 | +239 |
| Fiji | 63 | 60 | 40 | −5 | −37 | −33 |
| France | 16 | 31 | 44 | +94 | +175 | +42 |
| India | 147 | 87 | 57 | −41 | −61 | −34 |
| Indonesia | 59 | 286 | 349 | +385 | +492 | +22 |
| Italy | 114 | 80 | 42 | −30 | −63 | −48 |
| Japan | 977 | 717 | 409 | −27 | −58 | −43 |
| Madagascar | 1 | 57 | 65 | +5600 | +6400 | +14 |
| Malaysia | 3 | 9 | 36 | +200 | +1100 | +300 |
| Micronesia | 211 | 105 | 79 | −50 | −63 | −25 |
| New Zealand | 62 | 64 | 72 | +3 | +16 | +13 |
| Palau | 83 | 80 | 44 | −4 | −47 | −45 |
| Panama | 0 | 33 | 44 | NA | NA | +33 |
| Papua New Guinea | 104 | 124 | 28 | +19 | −73 | −77 |
| Russia | 55 | 87 | 123 | +58 | +124 | +41 |
| Saudi Arabia | 7 | 13 | 55 | +86 | +686 | +323 |
| Solomon Islands | 19 | 17 | 55 | −11 | +189 | +224 |
| South Africa | 99 | 41 | 27 | −59 | −73 | −34 |
| South Korea | 77 | 350 | 172 | +355 | +123 | −51 |
| Taiwan | 54 | 684 | 792 | +1167 | +1367 | +16 |
| Thailand | 5 | 38 | 71 | +660 | +1320 | +87 |
| USA | 106 | 63 | 33 | −41 | −69 | −48 |
| Vietnam | 1 | 22 | 336 | +2100 | +33,500 | +1427 |
Publisher’s Note: MDPI stays neutral with regard to jurisdictional claims in published maps and institutional affiliations. |
© 2022 by the authors. Licensee MDPI, Basel, Switzerland. This article is an open access article distributed under the terms and conditions of the Creative Commons Attribution (CC BY) license (https://creativecommons.org/licenses/by/4.0/).
Share and Cite
Calado, R.; Mamede, R.; Cruz, S.; Leal, M.C. Updated Trends on the Biodiscovery of New Marine Natural Products from Invertebrates. Mar. Drugs 2022, 20, 389. https://doi.org/10.3390/md20060389
Calado R, Mamede R, Cruz S, Leal MC. Updated Trends on the Biodiscovery of New Marine Natural Products from Invertebrates. Marine Drugs. 2022; 20(6):389. https://doi.org/10.3390/md20060389
Chicago/Turabian StyleCalado, Ricardo, Renato Mamede, Sónia Cruz, and Miguel C. Leal. 2022. "Updated Trends on the Biodiscovery of New Marine Natural Products from Invertebrates" Marine Drugs 20, no. 6: 389. https://doi.org/10.3390/md20060389