Article

Thallusin Quantification in Marine Bacteria and Algae Cultures

1
Institute of Inorganic and Analytical Chemistry, Friedrich Schiller University Jena, Lessingstr. 8, D-07743 Jena, Germany
2
Institute of Organic Chemistry and Macromolecular Chemistry, Friedrich Schiller University Jena, Humboldtstr. 10, D-07743 Jena, Germany
*
Author to whom correspondence should be addressed.
Mar. Drugs 2022, 20(11), 690; https://doi.org/10.3390/md20110690
Submission received: 4 October 2022 / Revised: 25 October 2022 / Accepted: 27 October 2022 / Published: 1 November 2022
(This article belongs to the Special Issue Marine Natural Products from Bacteria)

Abstract

:
Thallusin, a highly biologically active, phytohormone-like and bacterial compound-inducing morphogenesis of the green tide-forming macroalga Ulva (Chlorophyta), was determined in bacteria and algae cultures. A sensitive and selective method was developed for quantification based on ultra-high-performance liquid chromatography coupled with electrospray ionization and a high-resolution mass spectrometer. Upon C18 solid phase extraction of the water samples, thallusin was derivatized with iodomethane to inhibit the formation of Fe–thallusin complexes interfering with the chromatographic separation. The concentration of thallusin was quantified during the relevant phases of the bacterial growth of Maribacter spp., ranging from 0.16 ± 0.01 amol cell−1 (at the peak of the exponential growth phase) to 0.86 ± 0.13 amol cell−1 (late stationary phase), indicating its accumulation in the growth medium. Finally, we directly determined the concentration of thallusin in algal culture to validate our approach for monitoring applications. Detection and quantification limits of 2.5 and 7.4 pmol L−1, respectively, were reached, which allow for quantifying ecologically relevant thallusin concentrations. Our approach will enable the surveying of thallusin in culture and in nature and will thus contribute to the chemical monitoring of aquaculture.

1. Introduction

The cosmopolitan green macroalga Ulva spp. (Ulvales, Chlorophyta) requires specifically associated bacteria that release algal growth- and morphogenesis-promoting factors (AGMPFs) [1,2]. Without such symbioses, Ulva develops into an undifferentiated callus under axenic conditions [1]. Because Ulva is commercially valuable as a source of, for example, bioactive compounds, food, and biofuel [3], beneficial algal–bacterial interactions that promote growth are of particular interest [4]. To identify such AGMPFs, a model system of Ulva compressa L. (cultivar Ulva mutabilis Føyn, recently reclassified [5]) was designed with a microbiome consisting of only two essential bacterial strains forming a tripartite community of U. compressa, Roseovarius sp. strain MS2, and Maribacter sp. strain MS6 [1]. Roseovarius sp. induces cell division in Ulva, while Maribacter sp. promotes primary rhizoid and cell wall formation. Like plant hormones, the Roseovarius-factor functionally resembles a cytokinin, while the Maribacter-factor acts auxin-like, contributing to the attachment of the algae [1,6].
Plant hormones (phytohormones) are naturally occurring small organic molecules and can be categorized into several substance classes: auxins, abscisic acid, brassinosteroids, cytokinins, ethylene, gibberellins, jasmonates, and salicylates. They are produced by plants but also by beneficial and pathogenic microorganisms (e.g., bacteria and microalgae) that can modulate plant growth, physiology, and immunity [7]. Phytohormone research is essential for advancing agricultural and marine science because many genes responsible for important agronomic traits, such as plant height, seed development, and yield, are phytohormone related [8].
Maribacter sp. releases the hormone-like compound thallusin, a terpenoid hybrid metabolite, which can functionally replace the bacterium [6]. With the half-maximal effective concentration (EC50) of 4.9 ± 0.1 pmol L−1 [9], thallusin is one of the most bioactive natural products which induces cell wall and rhizoid formation in U. compressa (“rhizoin”) [6,9] and thallus formation in Gayralia oxyspermum (“thallusin”) [10,11]. Thallusin is thus a versatile chemical regulator of plant development at low concentrations and reveals, like plant hormones [12,13], context-dependent, morphogenetic bioactivities [6,14,15] that need further investigation.
Thus, our study aimed to develop a method to determine thallusin concentration with a sufficiently low detection limit, to enable quantitative studies of Ulva development. A reliable quantification method for thallusin with high sensitivity and accuracy is crucial for studying the metabolic, transport, and molecular mechanisms of thallusin in marine macroalgae and, potentially, in terrestrial settings. While several modern methods exist for quantitative analysis of phytohormones in crude plant extracts that were reported [16,17,18,19], no protocols are available for thallusin. Certainly, extraction and purification protocols must be adapted for macroalgae samples [20,21,22,23]. A mass-spectrometry-based analysis is frequently influenced by the sample type (various matrices), the extraction procedure, and the experimental setup, including factors such as the chromatographic separation system and mass analyzer [24]. As such, a validated method is required to compare data generated in different laboratories and experimental setups using an appropriate internal standard.
In this contribution, we describe the development of a method for thallusin quantification in bacterial and algal growth media using an orbitrap high-resolution mass spectrometer. We studied laboratory-grown cultures of different Maribacter and Zobellia strains previously tested for thallusin production [6,25] and algal cultures. The analytical process features solid phase extraction, purification, iodomethane derivatization, and liquid chromatography–mass spectrometry (LC–MS) measurements. Notably, derivatization techniques are frequently employed in phytohormonal analysis to increase the stability and detectability of analytes [8].

2. Results

Thallusin and its 2:1 iron(III) complex can be detected in the bacterial culture medium and determined by LC-MS analysis, showing the characteristic pseudo molecular ions of [M + H]+ and [2M + Fe(III) − 2H]+, respectively (Figure 1) [5]. Thallusin eluted first at 5.21 min (m/z 458.2173) on a C18 RP silica column, directly followed by the Fe–thallusin complex (m/z 968.3388) at 5.75 min with broad tailing. Adding 0.1% (v/v) formic acid at the start of the preparation process resulted in decomplexation and improved the peak shape, but, unfortunately, it led to a 200-fold decrease in peak intensity. Notably, retention times, peak areas, and heights for metal complexes are often pH dependent; the lower the pH, the smaller the peak areas and heights. Scavenging the iron ions by using a ligand exchange reaction with ethylenediaminetetraacetic acid remained equally unsuccessful. Furthermore, thallusin and its Fe complex interfere with each other in chromatographic separations on C18 reversed-phase columns (Figure 1A,B). Likely, a major fraction of thallusin occurs metal bound in the environment, but its Fe(III)-complex is not kinetically stable on HPLC, as indicated by its peculiar HPLC elution profile indicating exchange. Therefore, derivatization by methylation of the carboxyl groups was investigated to suppress metal ion complexation.

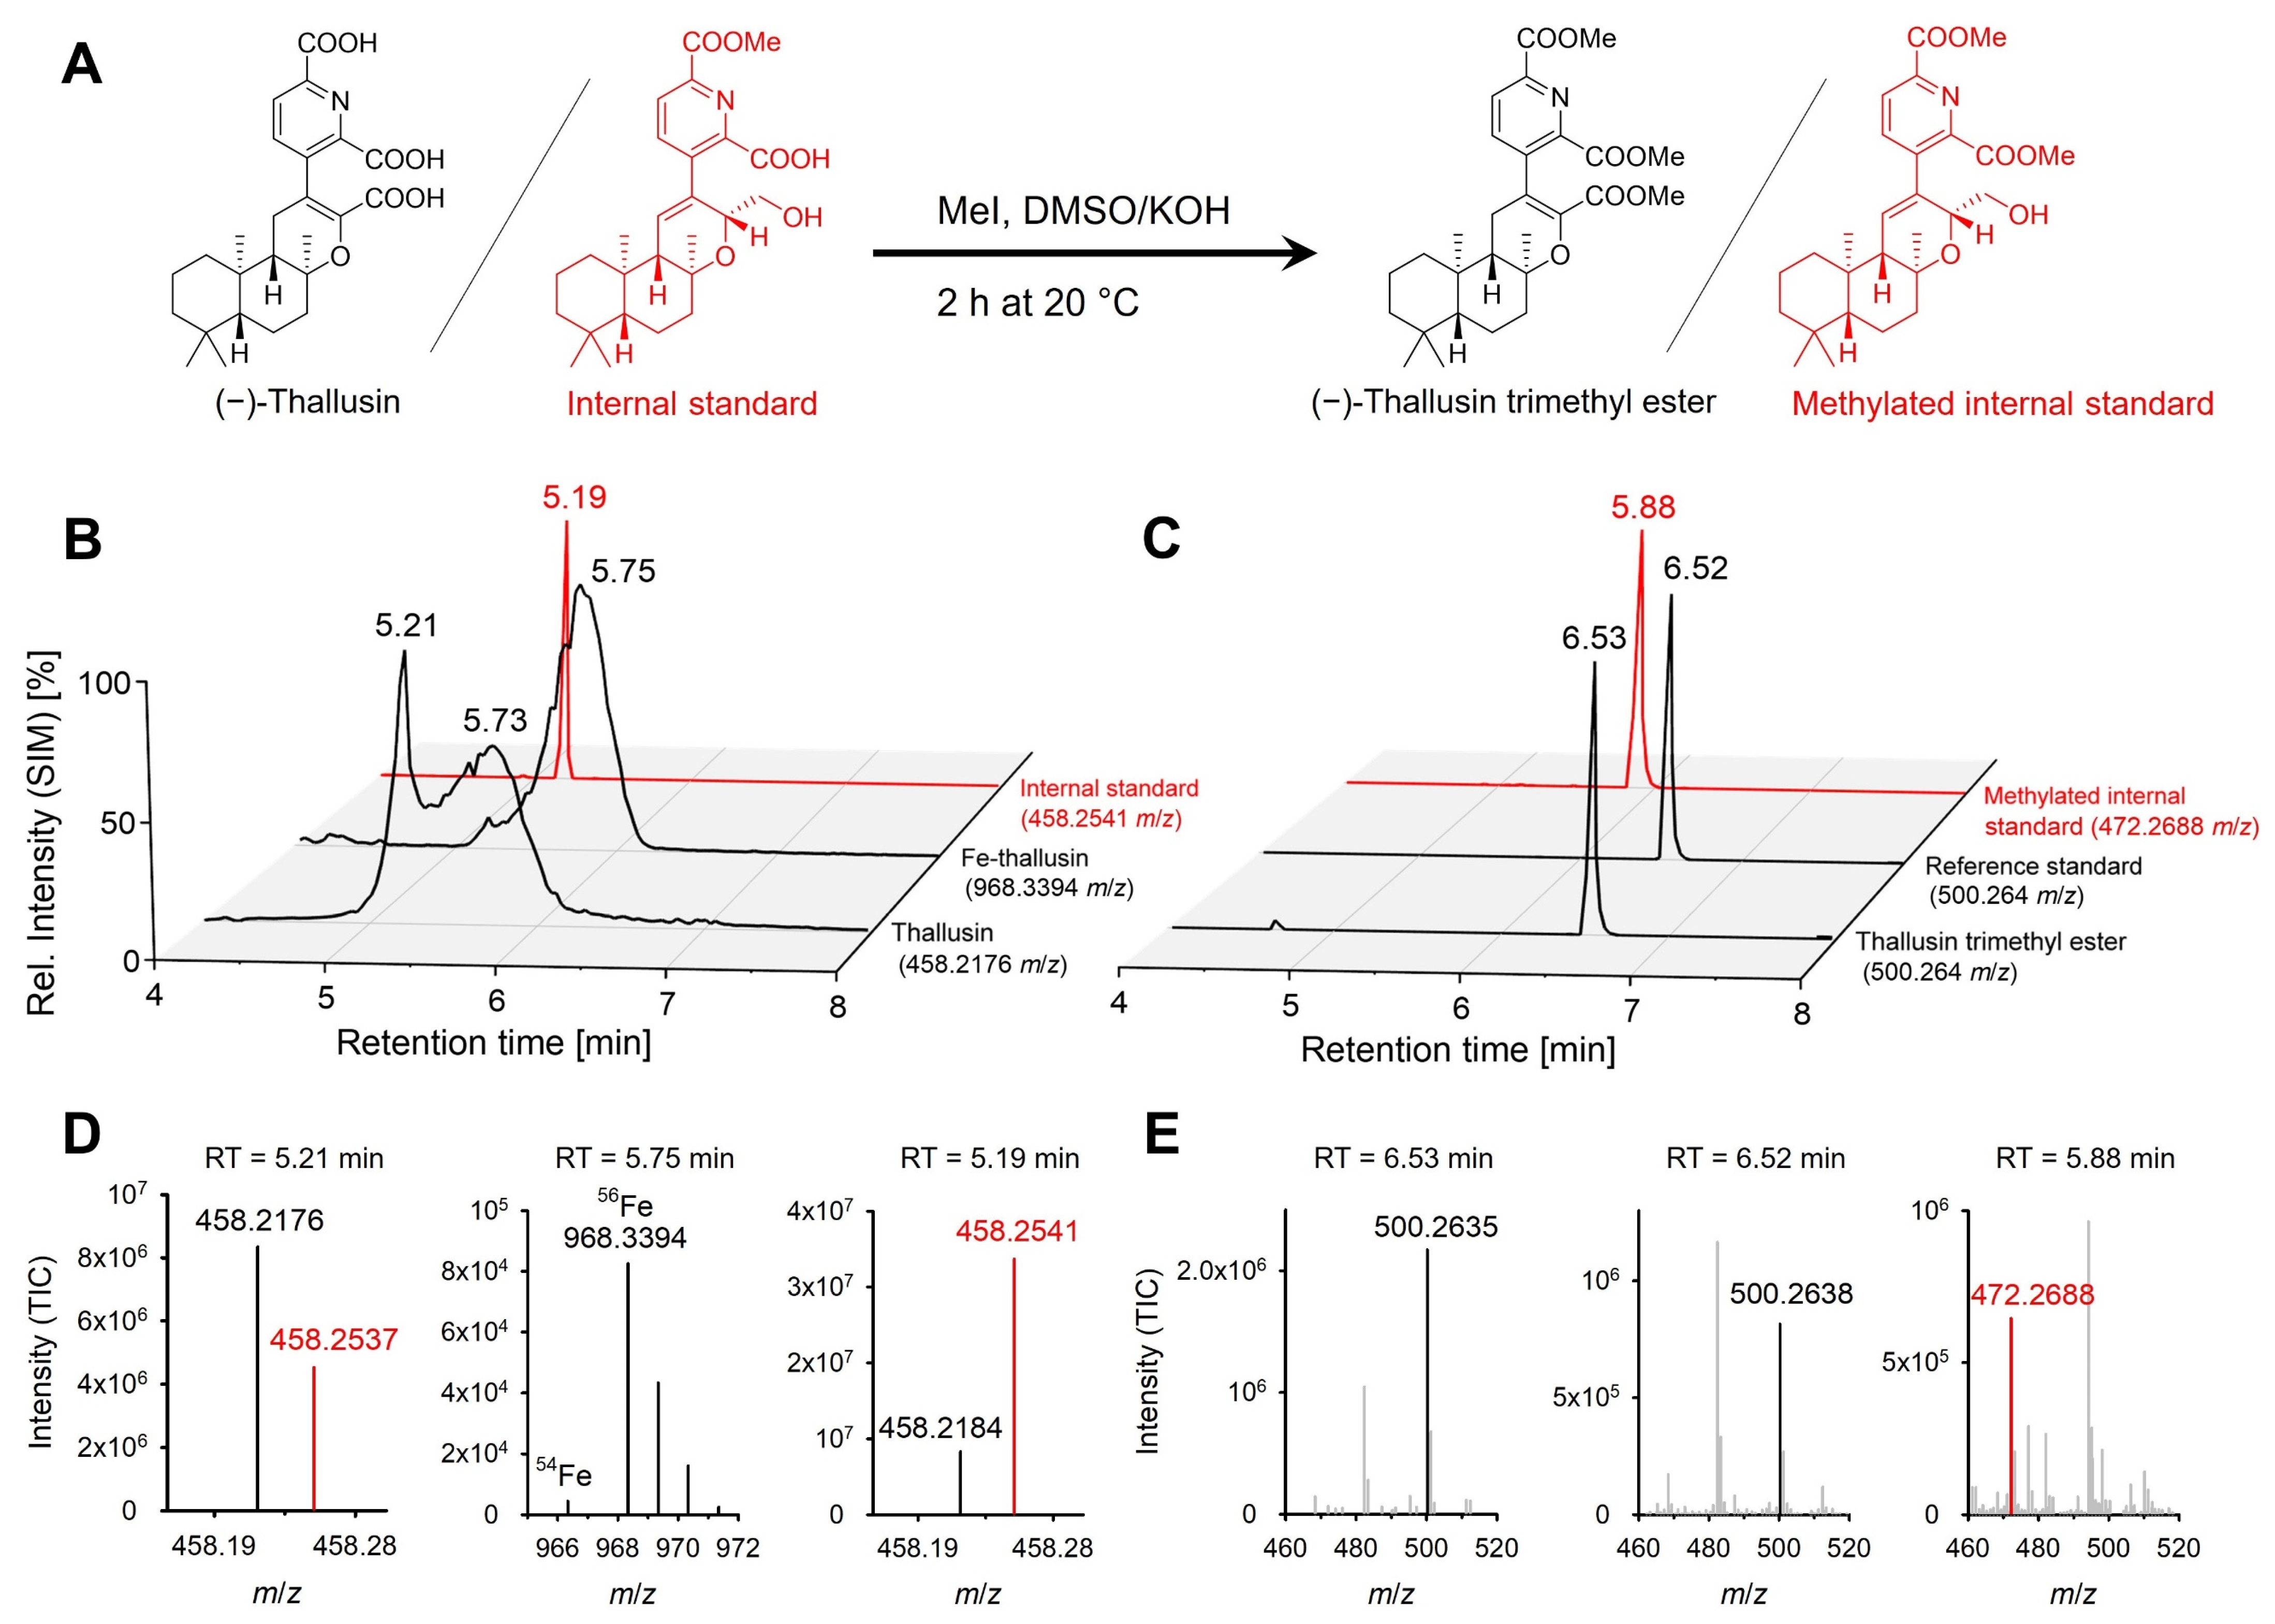
2.1. Method Development

Methylation of the carboxyl groups of thallusin was achieved by treatment with iodomethane and potassium hydroxide in DMSO at 20 °C to give methyl esters in high yield (>99%) (Figure 1A). The thallusin trimethyl ester showed increased peak sharpness, improving the detection limit and calibration capability (Figure 1B,C). The peak was identified by comparing the associated retention time and the mass spectrum with those of a synthetic reference standard of thallusin trimethyl ester (Figure 1B–E) [9]. The added internal standard became methylated as well, thus providing evidence of successful derivatization in the analytical procedure. To estimate the methylation yield, we searched for the fully unmethylated thallusin in the total ion chromatogram (TIC). However, unmethylated thallusin and mono- (m/z 472.2330 [M + H]+) were not detected. The ratio of the peak areas of the double-methylated thallusin (m/z 486.2486 [M + H]+) to the triple (fully)-methylated thallusin (m/z 500.2643 [M + H]+) was 1.69 ± 0.35%; this implies that approximately 98% of the thallusin was fully methylated, close to the 99% yield obtained by Avilia-Zárraga and Martinez (2001) for derivatization of a variety of carboxylic acids by iodomethane [26].
The calibration was performed over the entire analytical process for the working range from 0.2 to 2.0 and 2.0 to 10.0 µmol L−1 (Figure 2A,B). The limit of detection (LOD) and limit of quantification (LOQ) were 0.0756 and 0.2217 µmol L−1, respectively (Table 1); these values constitute adequate detection limits to quantify thallusin in the region of the effective concentration (EC90 = 7.6 pmol L−1 [6]) in water samples. When 0.75 L of the growth medium was concentrated by solid phase extraction and the final sample volume of eluent was 25 µL, LOD and LOQ values of 2.5 and 7.4 pmol L−1, respectively, were obtained while accounting for a concentration factor of 30,000. The total error of the analytical procedure sr was 0.8%, indicating an accurate measurement. In order to normalize the thallusin concentration per cell, photometric optical density measurements were correlated with the number of cells counted by flow cytometry (Figure 2C). The calibrations enabled measuring thallusin concentrations in the bacterial cultures at various stages of their growth and in the laboratory-grown Ulva cultures.

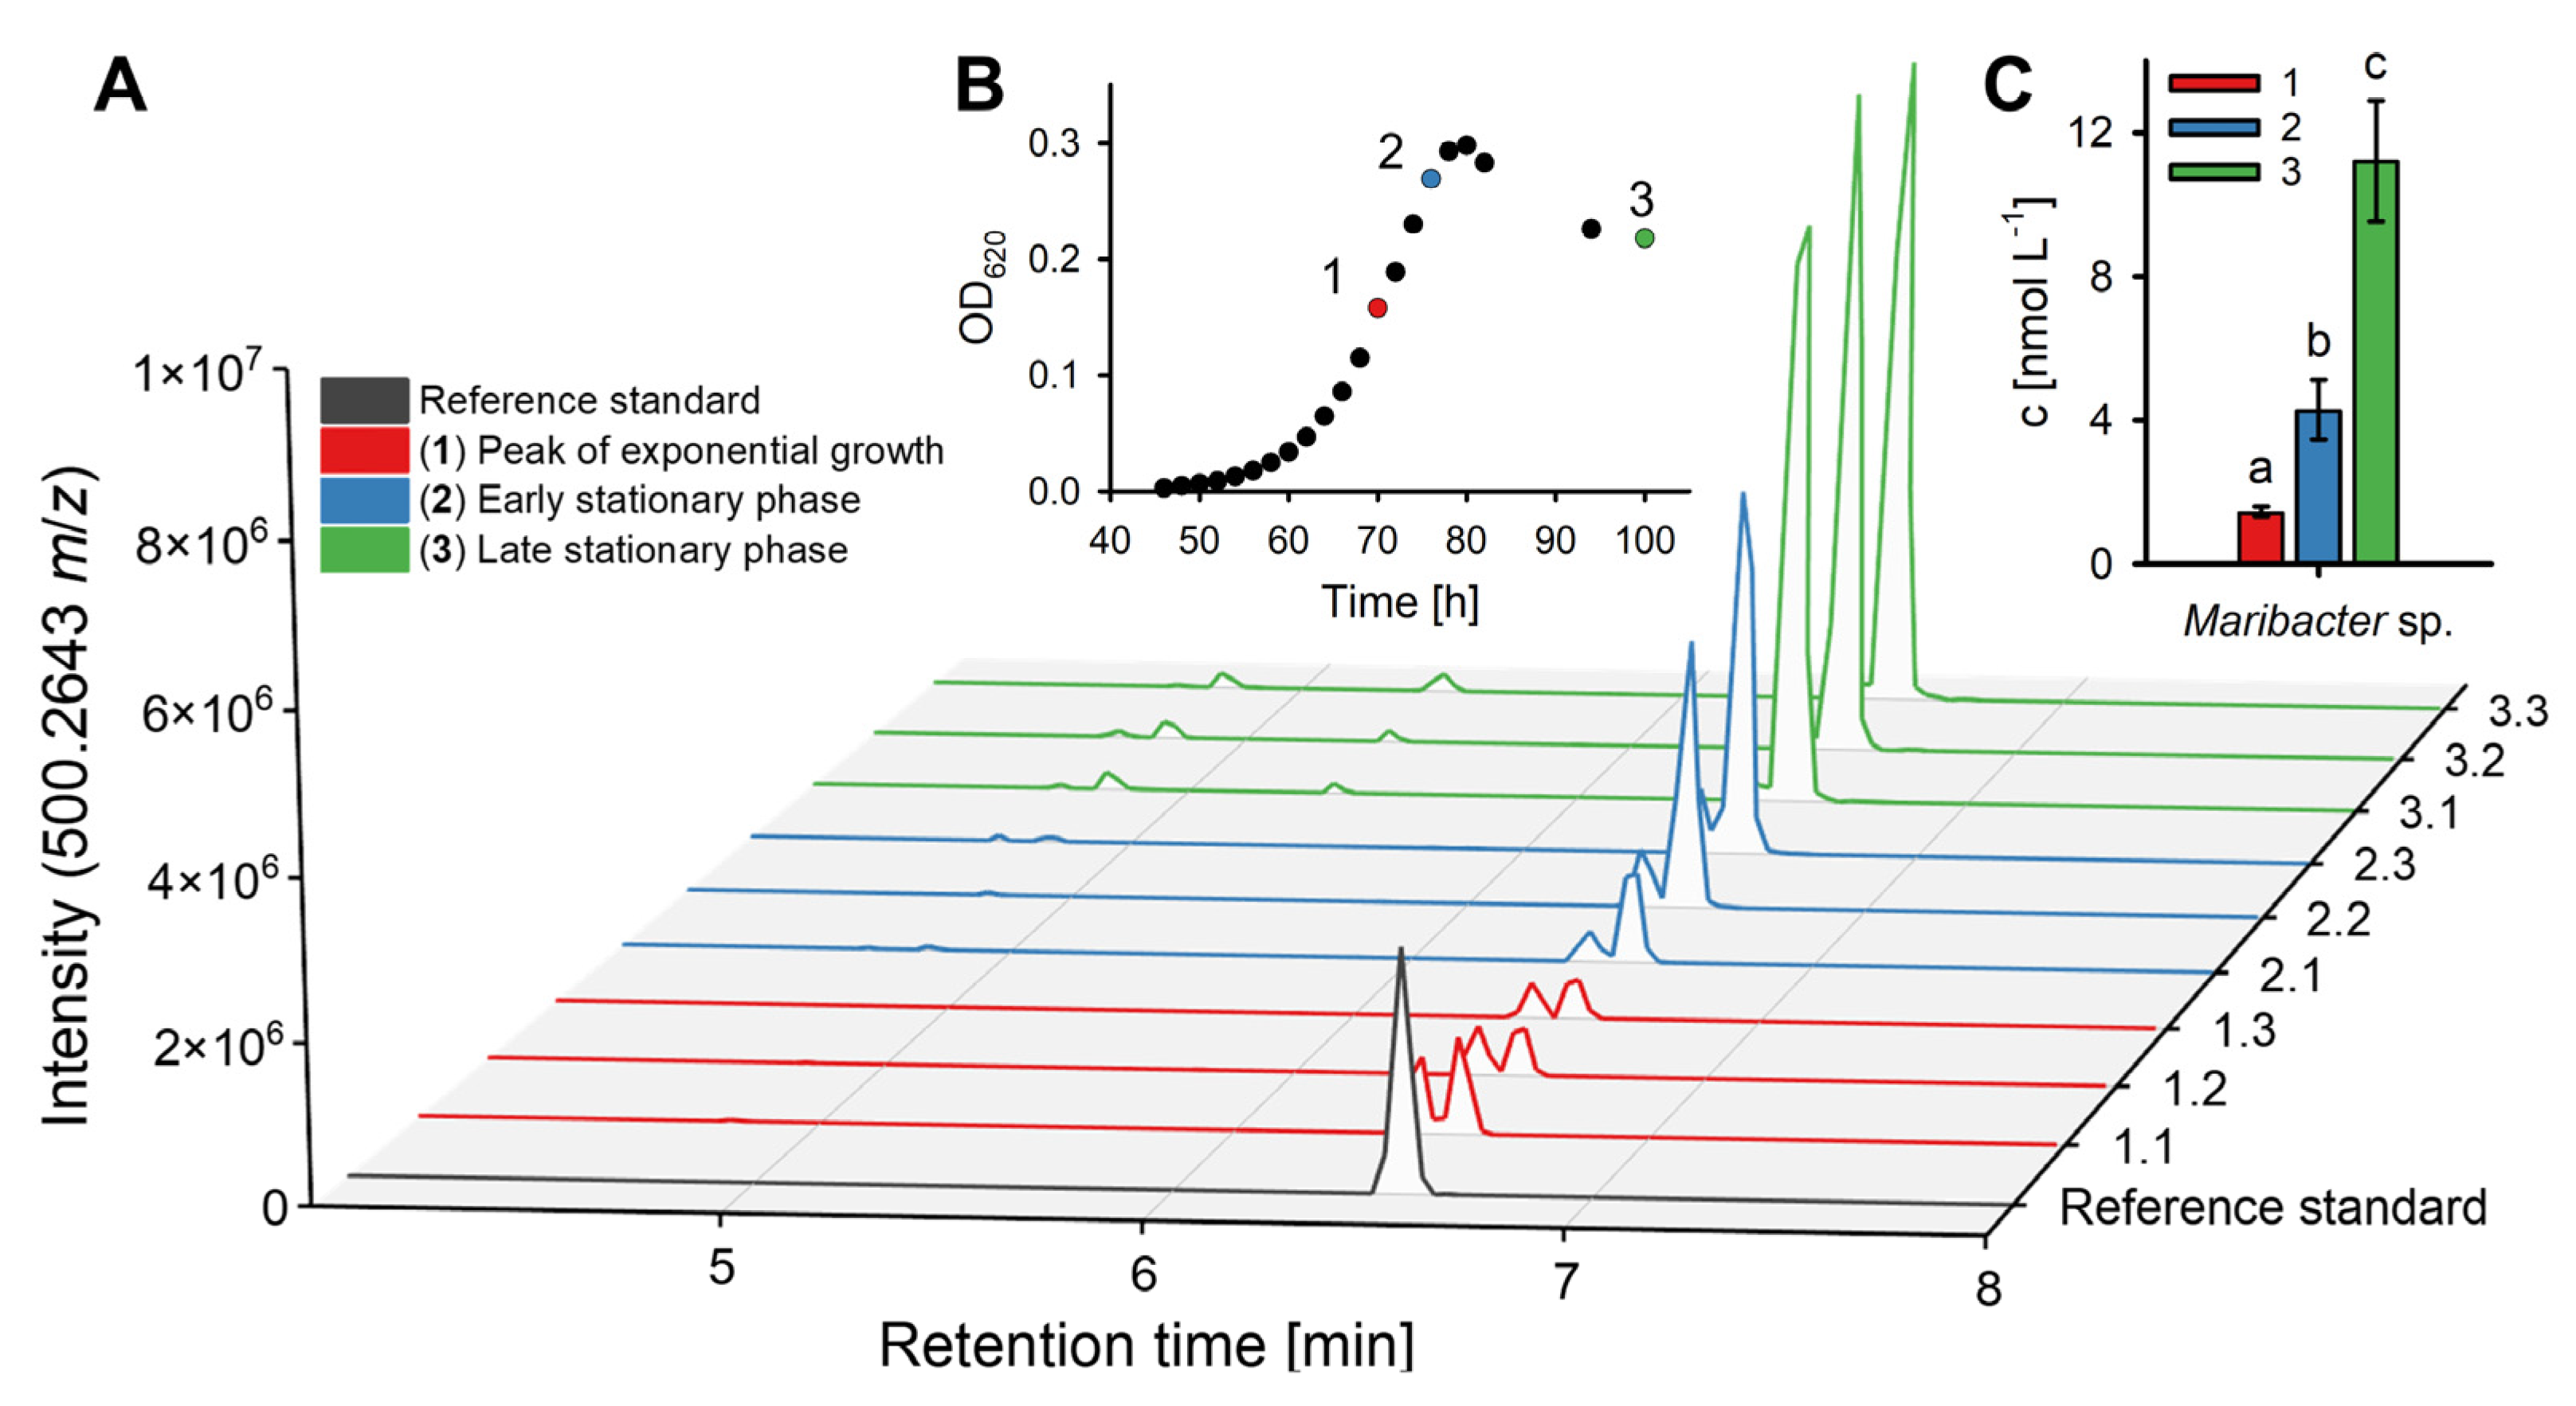
2.2. Quantification of Thallusin in Bacterial Cultures

Data for the bacterial growth curves were recorded up to 24 h after reaching the stationary phase (Figure 3A–G). Maribacter spp. and Zobellia spp. were grown on the HaHa_100 medium (DSMZ 1566), which is preferred for these genera over the Marine Broth medium [21,22]. The growth of the investigated strains varied only slightly between different species. Maribacter ulvicola grew the fastest and reached the stationary phase after 50 h with an OD620 of 0.31, while Maribacter chungangensis grew the slowest, reaching its stationary phase after 82 h with an OD620 of 0.23 (growth rate μ = 0.158 ± 0.004 h−1). Maribacter sp. MS6 (max. OD620 = 0.30, μ = 0.160 ± 0.002 h−1), Zobellia galactanivorans (max. OD620 = 0.28), and M. ulvicola (max. OD620 = 0.31) yielded the highest optical densities. The growth rates (μ) between the bacteria varied significantly (one-way ANOVA, p < 0.05), with the highest value obtained for Maribacter sedimenticola (μ = 0.204 ± 0.003 h−1; Figure 3H).
To quantify thallusin, samples were collected at three different growth phases. Overall, the thallusin concentration increased with the cell density and accumulated in the bacterial growth media (Figure 4).

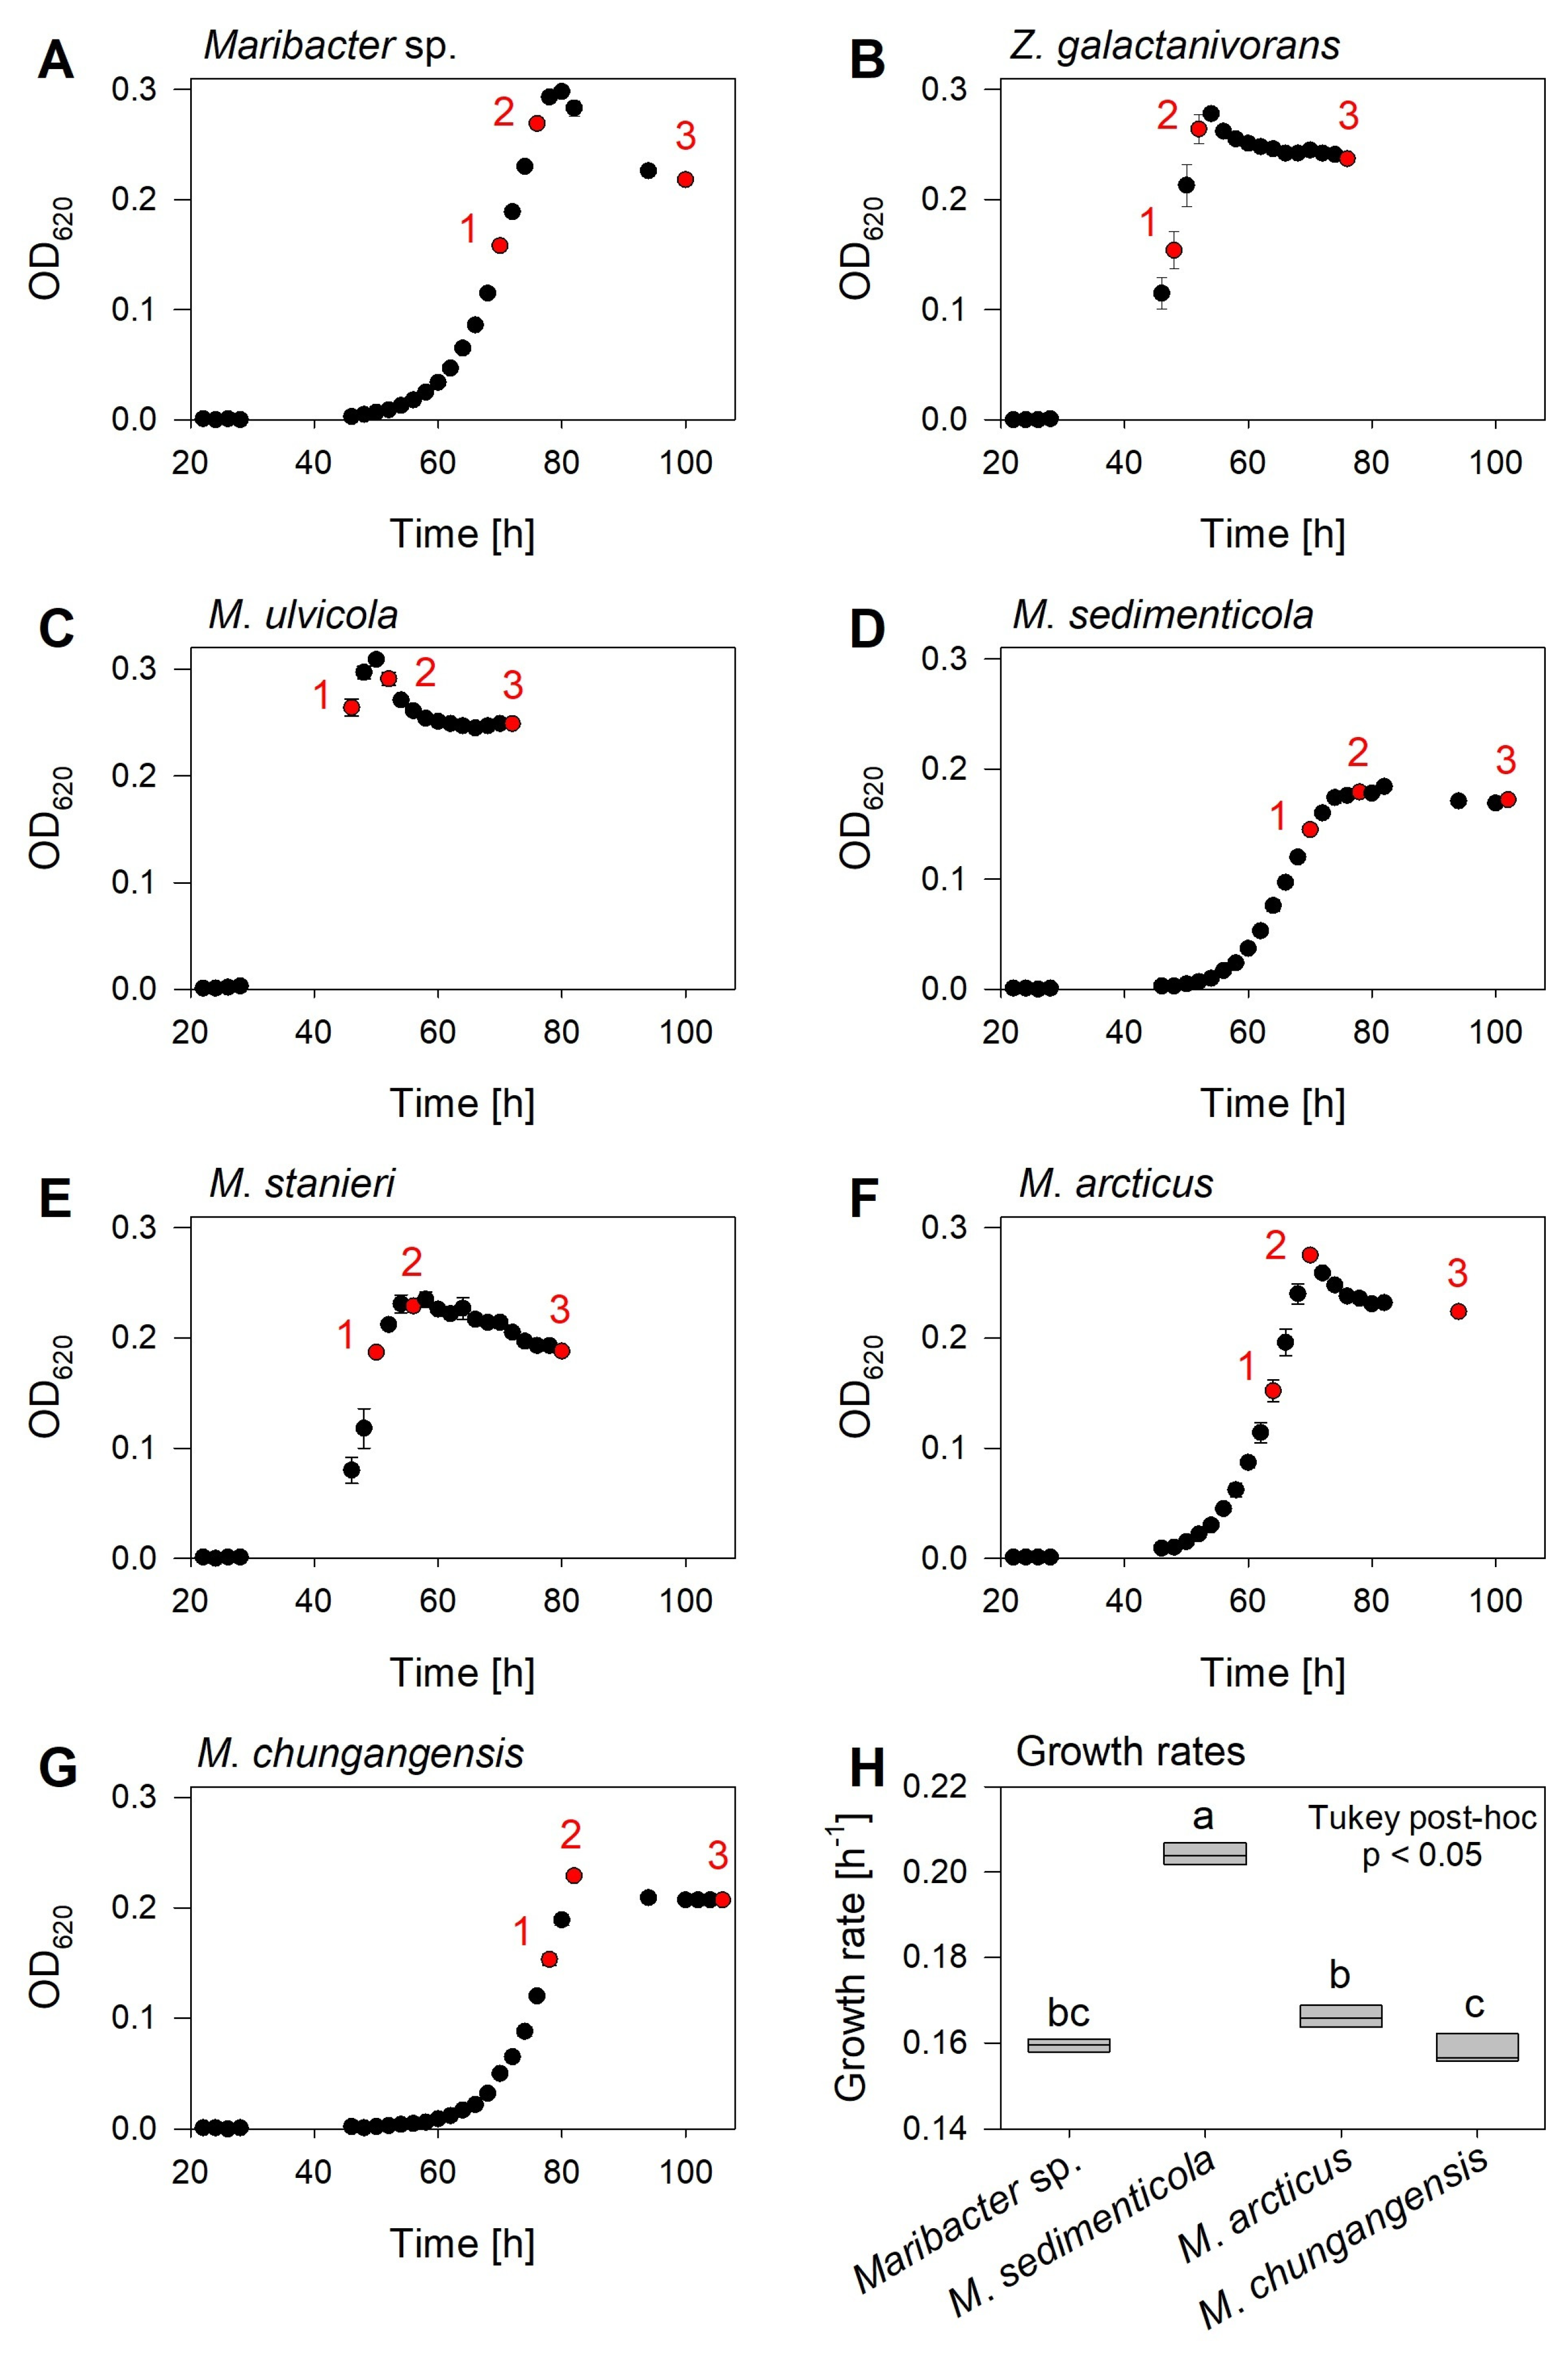
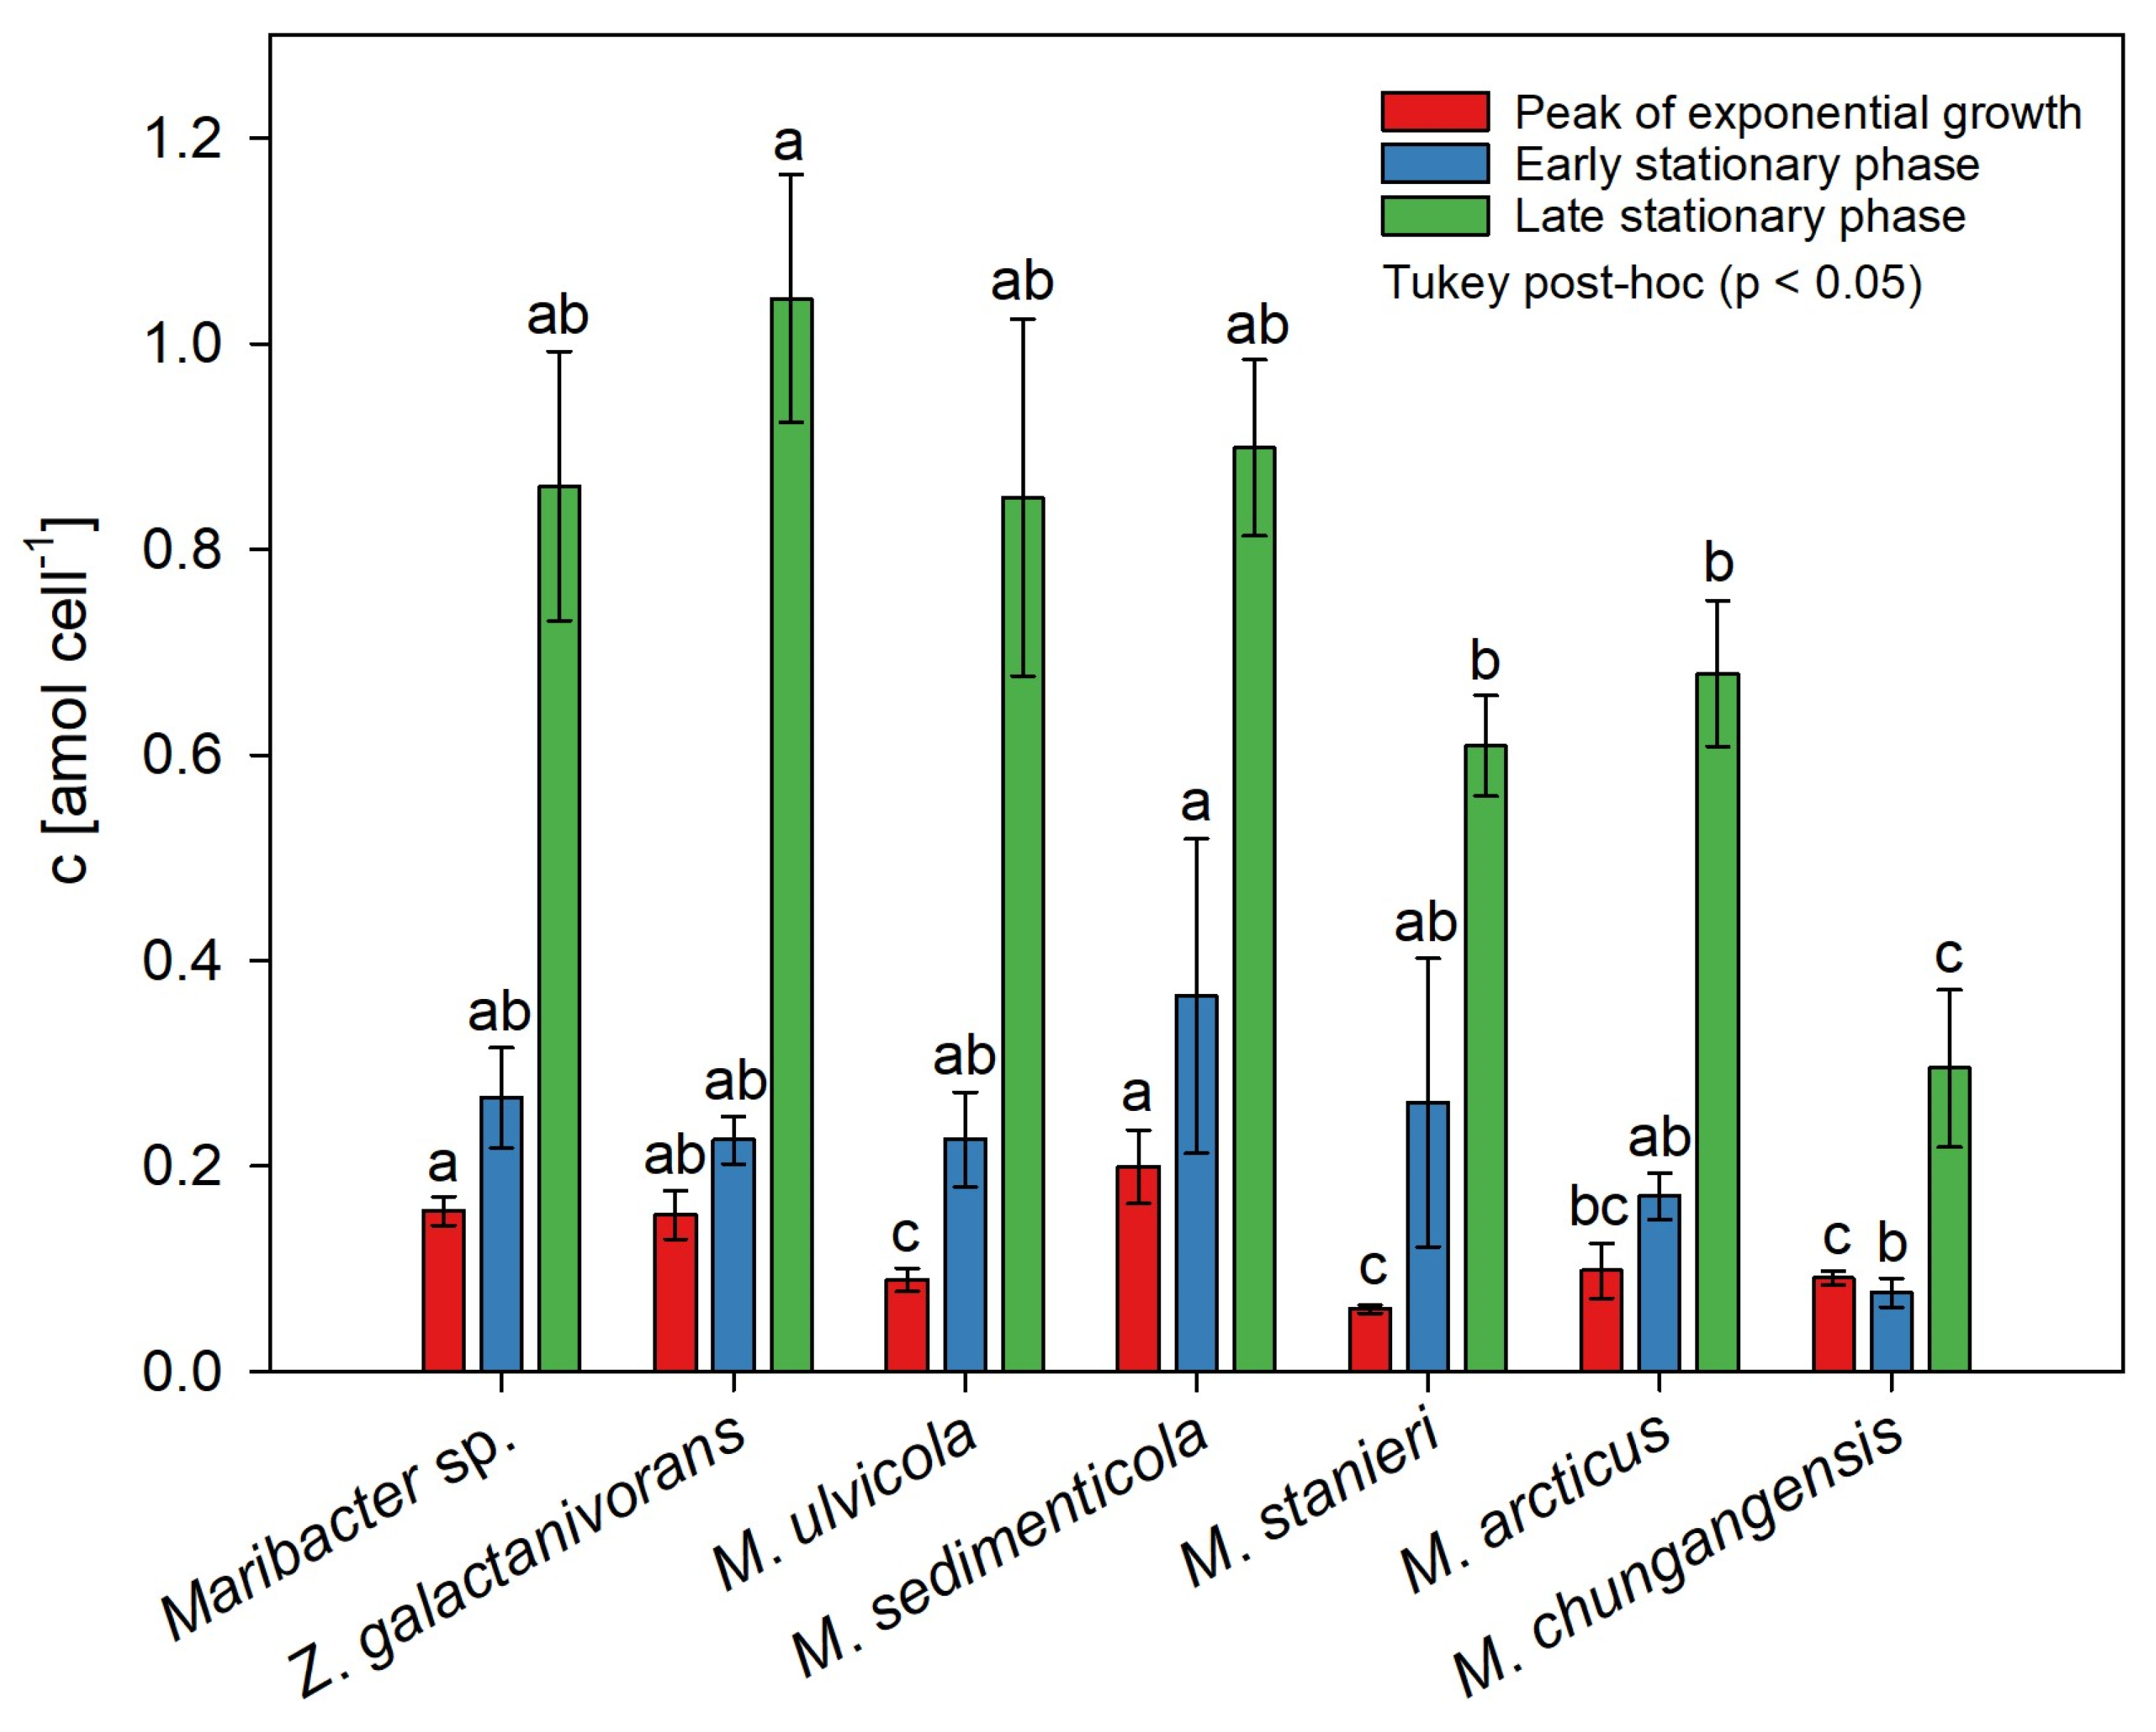
2.3. Species-Dependent Production of Thallusin

After normalization to the bacterial cell count, the thallusin concentration in the media followed a similar pattern of changes for all the tested bacteria strains, with some minor differences (compare Table 2 with Figure 5). Exemplarily, the production of thallusin in Maribacter’s growth medium follows the subsequent pattern: After 70 h of incubation, the supernatant of Maribacter sp. comprised 1.5 ± 0.1 nmol L−1 (0.16 ± 0.01 amol cell−1) thallusin at the peak of the exponential growth phase. After a further 6 h, the thallusin concentration increased significantly to 4.3 ± 0.8 nmol L−1 (0.27 ± 0.05 amol cell−1, p < 0.005, t-test, n = 3) before peaking at 11.2 ± 1.7 nmol L−1 (0.86 ± 0.13 amol cell−1, p < 0.005, t-test, n = 3) during the late stationary phase.
Overall, the supernatants of the strains Maribacter sp. MS6, M. ulvicola, M. sedimenticola, and Zobellia contained the most thallusin normalized per cell 24 h after reaching the stationary phase, with a thallusin concentration range of 9.2–14.8 nmol L−1 (Table 2), equivalent to approximately 0.8–1.0 amol cell−1 (Figure 5; one-way ANOVA, Tukey post-hoc test, p < 0.05). This indicates that thallusin accumulated in the medium, in agreement with previous measurements of the biological activity of Maribacter sp. MS6 [6,27].

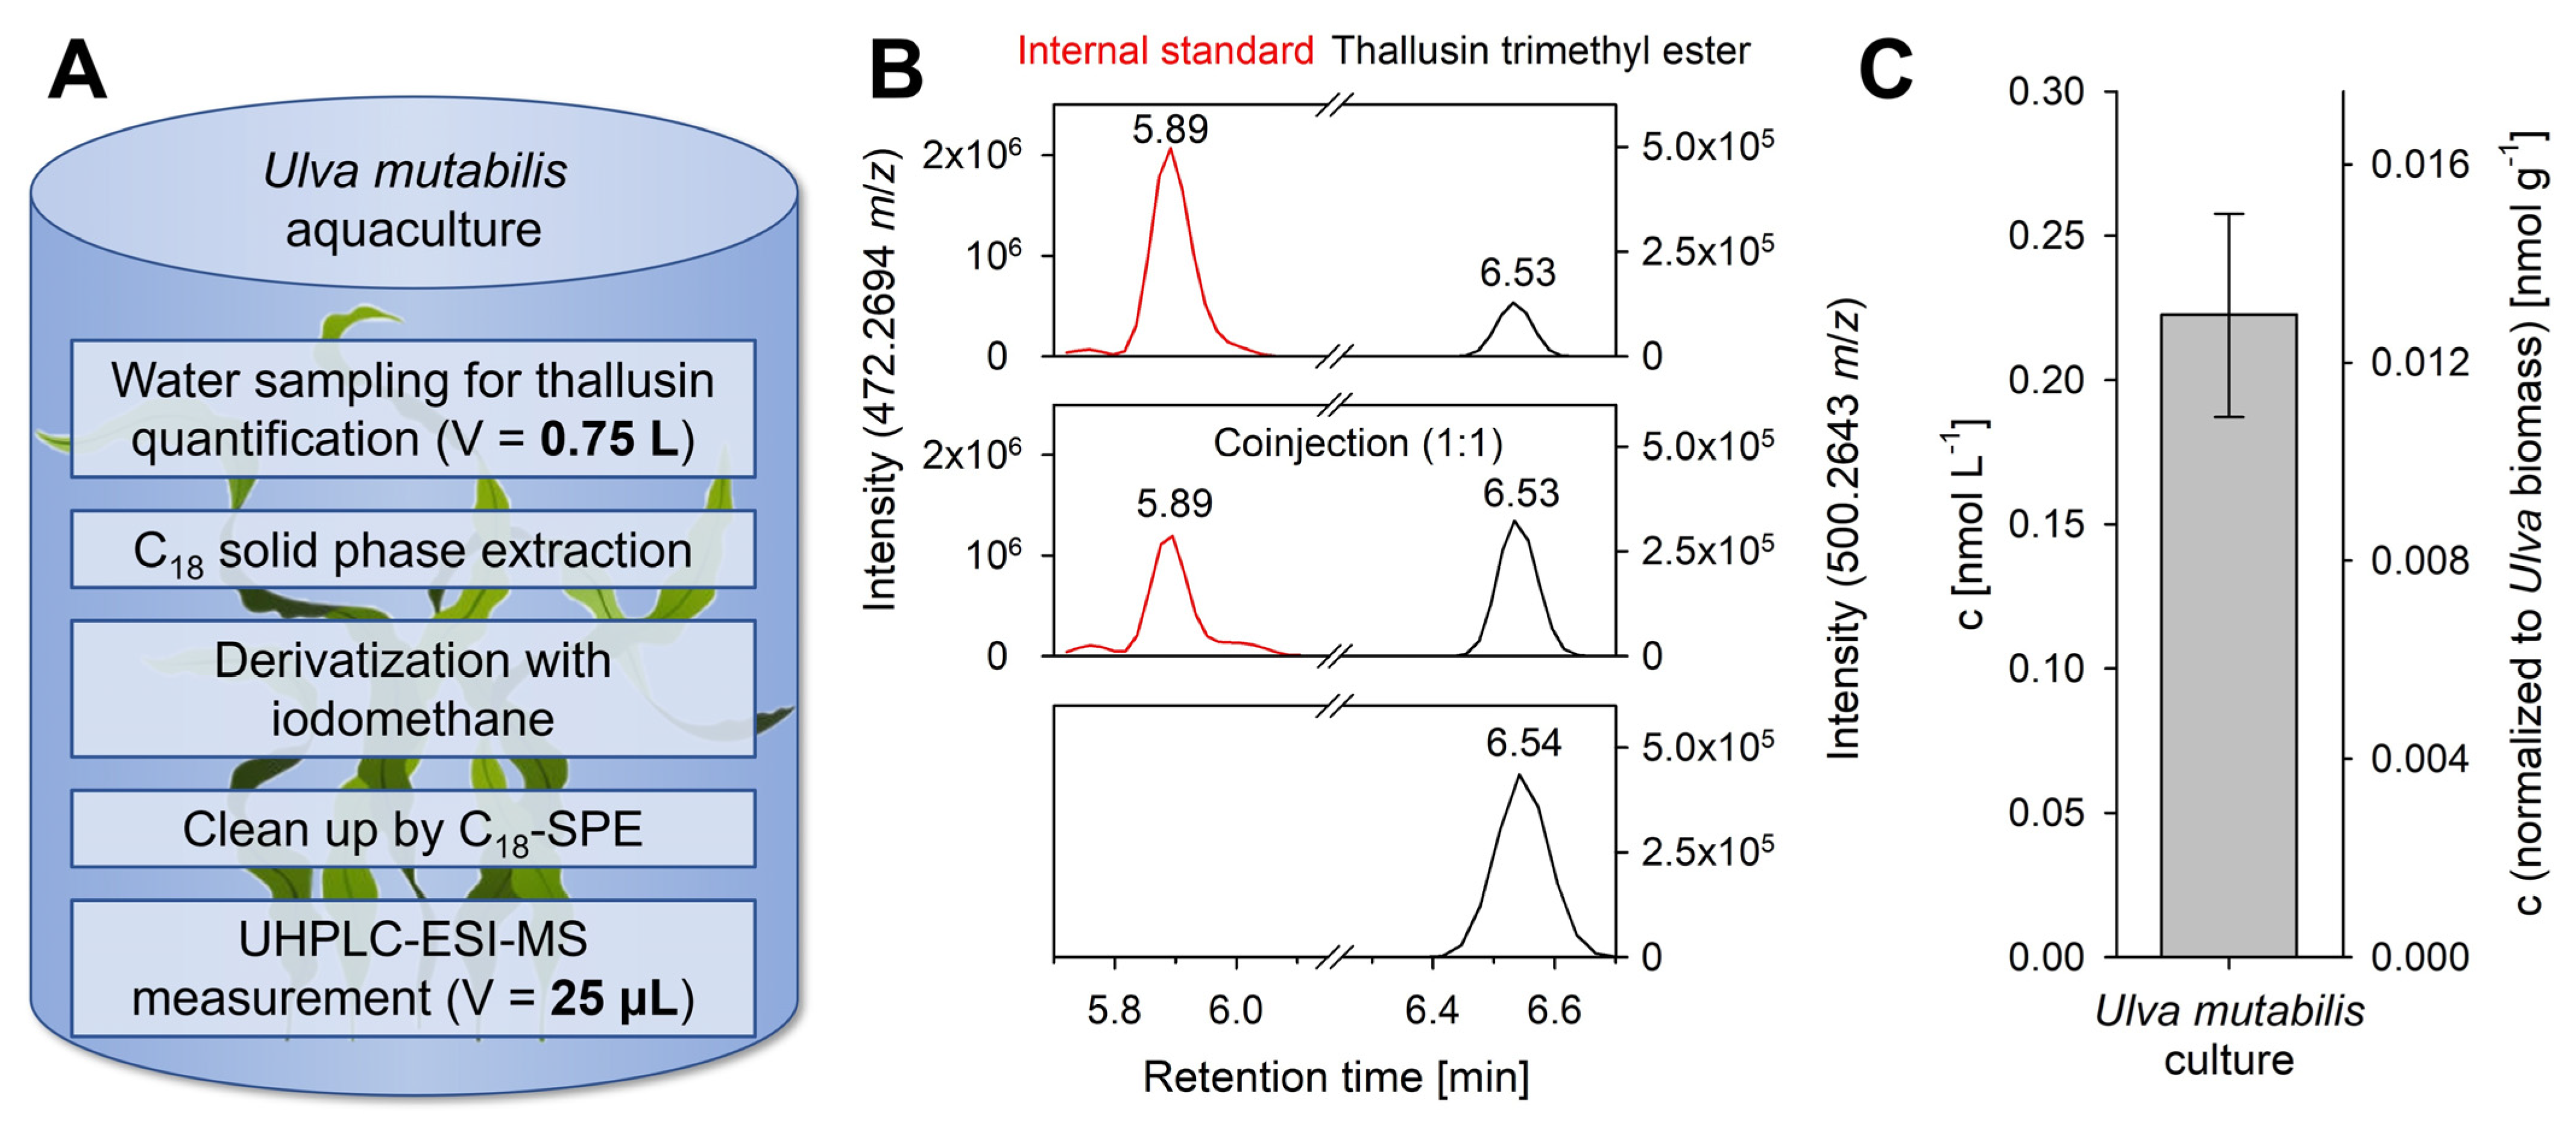
2.4. Quantification of Thallusin in Algal Cultures

Using our approach, we set out to detect thallusin in the chemosphere of Ulva in culture. A co-injection experiment allowed for the identification of the peak of the thallusin trimethyl ester by comparison with the synthetic standard (Figure 6). The thallusin concentration in the pooled stationary culture of a closed cultivation system (U. compressa, three months old, 17.2 g L−1 fresh weight biomass) was 0.22 ± 0.04 nmol L−1, implying that under the selected laboratory conditions, the actual thallusin concentration in the algal culture was approximately 30-times higher than the EC90 = 7.6 pmol L−1 [9], indicating strong oversaturation.

3. Discussion

Methylation of thallusin was promoted by potassium hydroxide in methyl sulfoxide and iodomethane to produce the corresponding methyl ester for quantifying thallusin in bacterial and algal cultures using an orbitrap mass spectrometer (Figure 1, Table 1). The validated method was shown to be accurate with an sr < 0.8% and a sufficient LOD. As of now, 0.75 L of the medium is required to quantify thallusin levels as low as the EC90 value in Ulva’s culture (Figure 6). In fact, methylation by iodomethane has frequently been applied in analytics with good yields [28], for example, in quantifying steroidal saponins from switchgrass [29]. Other standard esterification methods use diazomethane or methanol [16], but these were not pursued due to high reagent toxicity or required harsh reaction conditions. Previously, Matsuo et al. (2005) used only trimethylsilyl diazomethane for the derivatization of thallusin preparatively [10].
Thallusin induces the development of basal rhizoids and healthy cell wall formation [6,9] in U. compressa, but also possesses distinguishable context-dependent functions as known for hormones in Plantae [6,30]. For plant hormone profiling, our approach should be thus included in the workflow for the qualitative and quantitative analysis of phytohormones in marine bacteria [31,32] and algae [20,33,34]. Notably, already established methods for the purification and analysis of phytohormones from culture supernatants are particularly suitable for this purpose because they are based on solid phase extractions (SPEs) starting with an Oasis® HLB-sorbent SPE [35,36,37]. We confirmed that thallusin can be extracted by this sorbent as well (data not shown). However, we preferred the C18 SPE for thallusin analysis because it involved the extraction of fewer substances, resulting in a less structured matrix and less electrospray ion suppression than upon HLB SPE. Similarly, the bacterial growth medium HaHa_100 contributes to less background interference in the solid phase extraction, reducing ionization suppression and improving the analytical procedure and LOD. The maximum optical density of the bacterial cultures differed between the two artificial media; the growth of Maribacter sp. MS6 on the media led to a maximum optical density (OD620) of 1.78 in marine broth medium but only 0.30 in HaHa_100 (Figure 3) comparable to previously published values [38].
Quantification of thallusin in growth media will help to address whether production is dependent on amino acids and less affected by carbon and nitrogen sources, as demonstrated by the indoleacetic acid (auxin) production of epiphytic bacteria on the red alga Pyropia yezoensis [39]. Land-plant-associated bacteria generally produce auxin, promoting cell division in root cells, similar to thallusin [40]. Ahmed and Hasnain (2010) detected elevated concentrations of auxin—86 μg L−1 (0.49 mmol L−1)—in a Bacillus flexus culture shortly after the start of the stationary phase (48 h) [41], 107-times higher than the thallusin concentrations at the same time point in the bacterial cultures. Similarly, Ali et al. (2008) determined auxin concentrations of 0.6 μg L−1 (3.4 μmol L−1, in Bacillus sp.) to 8.22 μg L−1 (46.9 μmol L−1, in Pseudomonas sp.) during the stationary phase by gas chromatography–mass spectrometry (GC–MS) analysis [42]; these are still 103- to 104-times higher than the measured concentrations of thallusin and its EC50 value (4.9 ± 0.1 pmol L−1) [9]. Therefore, the strong contrast between the high biological activity of thallusin and its comparatively low production yields is striking. For large-scale purification Maribacter sp., M. ulvicola, and Z. galactanivorans, the bacteria with the highest thallusin yields in this study and efficient growth performance in the HaHa_100 medium, are preferred if synthetic thallusin should be unavailable.
Because of its plant growth-promoting capabilities, the controlled use of algal biomass as biofertilizers may lessen the environmental impact of aquaculture’s excessive use of chemical fertilizers [43]. Thallusin has the potential to make a significant contribution here. The monitoring and quantification of thallusin are, thus, crucial for a deeper understanding of algae growth in complex communities and in natura. It should also be instrumental in studying the dynamic exchange of thallusin precursors and the active substance between algae and bacteria. As thallusin contributes to algal growth promotion, it may be used as an effective non-gene disruptive strategy for sustainable algal biorefineries [44] and a modulator of production rates of secondary metabolites [45,46].

4. Materials and Methods

4.1. Bacterial Strains and Cultivation Conditions

Bacteria isolated from Ulva [1] and type strains [47,48,49] (Table 2) were cultivated in a HaHa_100 medium at 20 ± 1 °C [50]. These bacteria have recently been identified as thallusin producers exhibiting typical rhizoid and cell wall formation-inducing activity [6,51].

4.2. Chemicals, Standards, and Materials

Methanol (MeOH, HPLC grade) and potassium hydroxide (KOH, p.a.) used for sample preparation were purchased from VWR International (Darmstadt, Germany). Dimethyl sulfoxide (DMSO) and marine broth medium were purchased from Carl Roth GmbH + Co., KG (Karlsruhe, Germany). Iodomethane was obtained from Sigma-Aldrich (Steinheim, Germany). Water (H2O) for the SPE was purified using a MicroPure system (J.W.T. GmbH, Jena, Germany). Thallusin and a derivative, used as internal standard, were chemically synthesized [9] and dissolved in HPLC grade MeOH to form 2.0 mmol L−1 stock solutions. The internal standard is a monomethylated (−)-thallusin derivative with a switched double bond and one reduced carboxylic acid (Figure 1A). The C18 SPE cartridges were purchased from Waters Corporation (Milford, MA, USA). All the solvents used for the sample analysis were of UHPLC grade (CHEMSOLUTE®) and were purchased from Th. Geyer GmbH & Co., KG (Renningen, Germany). Formic acid (≥99%) was purchased from Thermo Fisher Scientific (Rockford, IL, USA).

4.3. Monitoring of Bacterial Growth

The bacteria were incubated in 200 mL of a HaHa_100 medium [50,52] or marine broth [51] on an orbital shaker (230 V Euro Plug, Standard 5000, VWR). Spectrophotometric measurements were taken every 2 h at a wavelength of 620 nm using a UV-Vis spectrophotometer (Genesys 10S UV-Vis Spectrophotometer, Thermo Scientific, Waltham, MA, USA). To compute cell density, a calibration against the optical density was performed. Nine dilution steps were carried out in triplicate for M. ulvicola (the bacterial culture with the highest optical density) at the end of the exponential growth phase and at the peak of its optical density. The diluted bacterial samples were first analyzed with the UV-Vis spectrophotometer and directly after that with a flow cytometer (BD Accuri C6, Heidelberg, Germany) through the measurement of the forward-scattered light (50 μL, 35 μL min−1, threshold FSC-H 80,000) [53].

4.4. Sample Preparation

Samples were collected during three stages of bacterial growth to determine the thallusin concentration in the bacterial cultures. The growth medium was harvested at the peak of exponential growth (OD620 = 0.15), at the early (OD620 = 0.25) stationary phase, and a third sample was taken 24 h later during the late stationary phase. Subsequently, 50 mL aliquots of the cultures were centrifuged (9,500 rpm, 15 min, 10 °C) for sampling. The culture supernatants were then filtered sterile (pore size = 0.22 µm) and loaded onto a C18 reversed-phase SPE cartridge (Waters Corporation, Milford, MA, USA).
U. compressa L. (cultivar Ulva mutabilis Føyn (sl-G[mt+]; morphotype “slender”; locus typicus: Ria Formosa, Portugal [5]) was grown in stationary culture [25]. On average, the cultures were three months old and contained a fresh wet weight of 97.9 g of Ulva and 5.7 L of supernatant (17.2 g L−1). The culture supernatants were combined, filtered twice (using paper and cellulose nitrate filters, 0.45 µm), and subsequently divided into three 1.76 L fractions.

4.5. Solid Phase Extraction

The C18 cartridge was preconditioned with 5 mL MeOH and equilibrated with 10 mL MicroPure water. The culture supernatant was then loaded onto the cartridge. The C18 cartridge matrix was washed with 10 mL MicroPure water and then with 4 mL of 25% (v/v) MeOH. Subsequently, 4 mL of 75% MeOH was used allowing thallusin to elute from the matrix. The solvent of the eluates was evaporated with nitrogen (Biotage-TurboVap® LV, Uppsala, Sweden), and the eluates were either directly derivatized with iodomethane or dissolved in 100 µL of 75% MeOH. The analyte solution was filtered (PVDF, 0.22 m, 4 mm, Millex®-GV), transferred to UHPLC-MS vials, and stored at −20 °C until measurement.

4.6. Derivatization of Thallusin

Thallusin was derivatized by permethylation by using iodomethane, according to the protocol of Avila-Zárraga and Martínez (2001) [26], with modifications. In brief, the dried residue of the eluates was dissolved in 150 µL of a DMSO/KOH solution (0.89 mol L−1), prepared by dissolving 1 g of powdered KOH (17.8 mmol) in 20 mL of DMSO with constant stirring for 30 min at 20 ± 1 °C. Iodomethane (30 µL) was then added to these sample solutions, and the mixtures were stirred for 2 h at 20 ± 1 °C. To inactivate the iodomethane, 50 µL formic acid was added to the derivatized sample, and stirring was continued for 1 h at 20 ± 1 °C. The sample mixtures were then diluted in 50 mL water and again extracted for clean-up using the C18 SPE protocol (see Section 4.5).

4.7. Ultra-High-Performance Liquid Chromatography (UHPLC) Coupled with Electrospray Ionization (ESI) High-Resolution Mass Spectrometry (HRMS) Measurements

An UltiMate HPG-3400 RS binary pump was used to perform the measurements involving UHPLC coupled with high-resolution Orbitrap MS (Thermo Fisher Scientific, Germany). The Kinetex® C−18 RP chromatography column (50 × 2.1 mm; 1.7 µm; 100 Å; Phenomenex, Aschaffenburg, Germany) was kept at 25 °C within the TCC-3200 column compartment. Eluent A contained 2% acetonitrile and 0.1% (v/v) formic acid in H2O. Neat Acetonitrile with 0.1% (v/v) formic acid was used as eluent B. The initial conditions were as follows: 0.2 min, 0% B, flow rate of 0.4 mL min−1; 8.0 min, 100% B, flow rate of 0.675 mL min−1; 8.0–12.0 min, 100% B, flow rate of 0.675 mL min−1; 12.0–12.3 min, 0% B, flow rate of 0.4 mL min−1; and 12.3–15.0 min, 0% B, flow rate of 0.4 mL min−1. Under temperature-controlled conditions at 10 °C, the samples were injected using the WPS-3000 autosampler with a 25 µL injection syringe.
Mass spectra were collected using a Thermo Fisher Scientific Q ExactiveTM hybrid quadrupole-Orbitrap mass spectrometer coupled to a heated ESI source. For the analysis of thallusin, the internal standard, and the methyl ester of thallusin, targeted selected ion monitoring (tSIM) was used in the positive ionization mode with the following instrument parameters: [M + H]+ (m/z 458.2173 ± 0.25), [M + H]+ (m/z 472.2694 ± 0.25), [M + H]+ (m/z 500.2643 ± 0.25), and [2M + Fe(III) − 2H]+ (m/z 968.3388 ± 0.25); resolution, 70,000; AGC target, 2 × 10⁵; maximum IT, 200 ms; and the acquisition time frame, 4.0–8.0 min. The parameters of a simultaneous full scan were set to m/z = 100–1000; resolution 70,000; AGC target, 3 × 10⁶; and maximum IT, 200 ms. Further, the sheath gas flow rate was set to 60; auxiliary gas flow rate, 20; sweep gas flow rate, 5; spray voltage, 3.0 kV; capillary temperature, 360 °C; S-lens RF level, 50; and the auxiliary gas heater temperature, 400 °C.

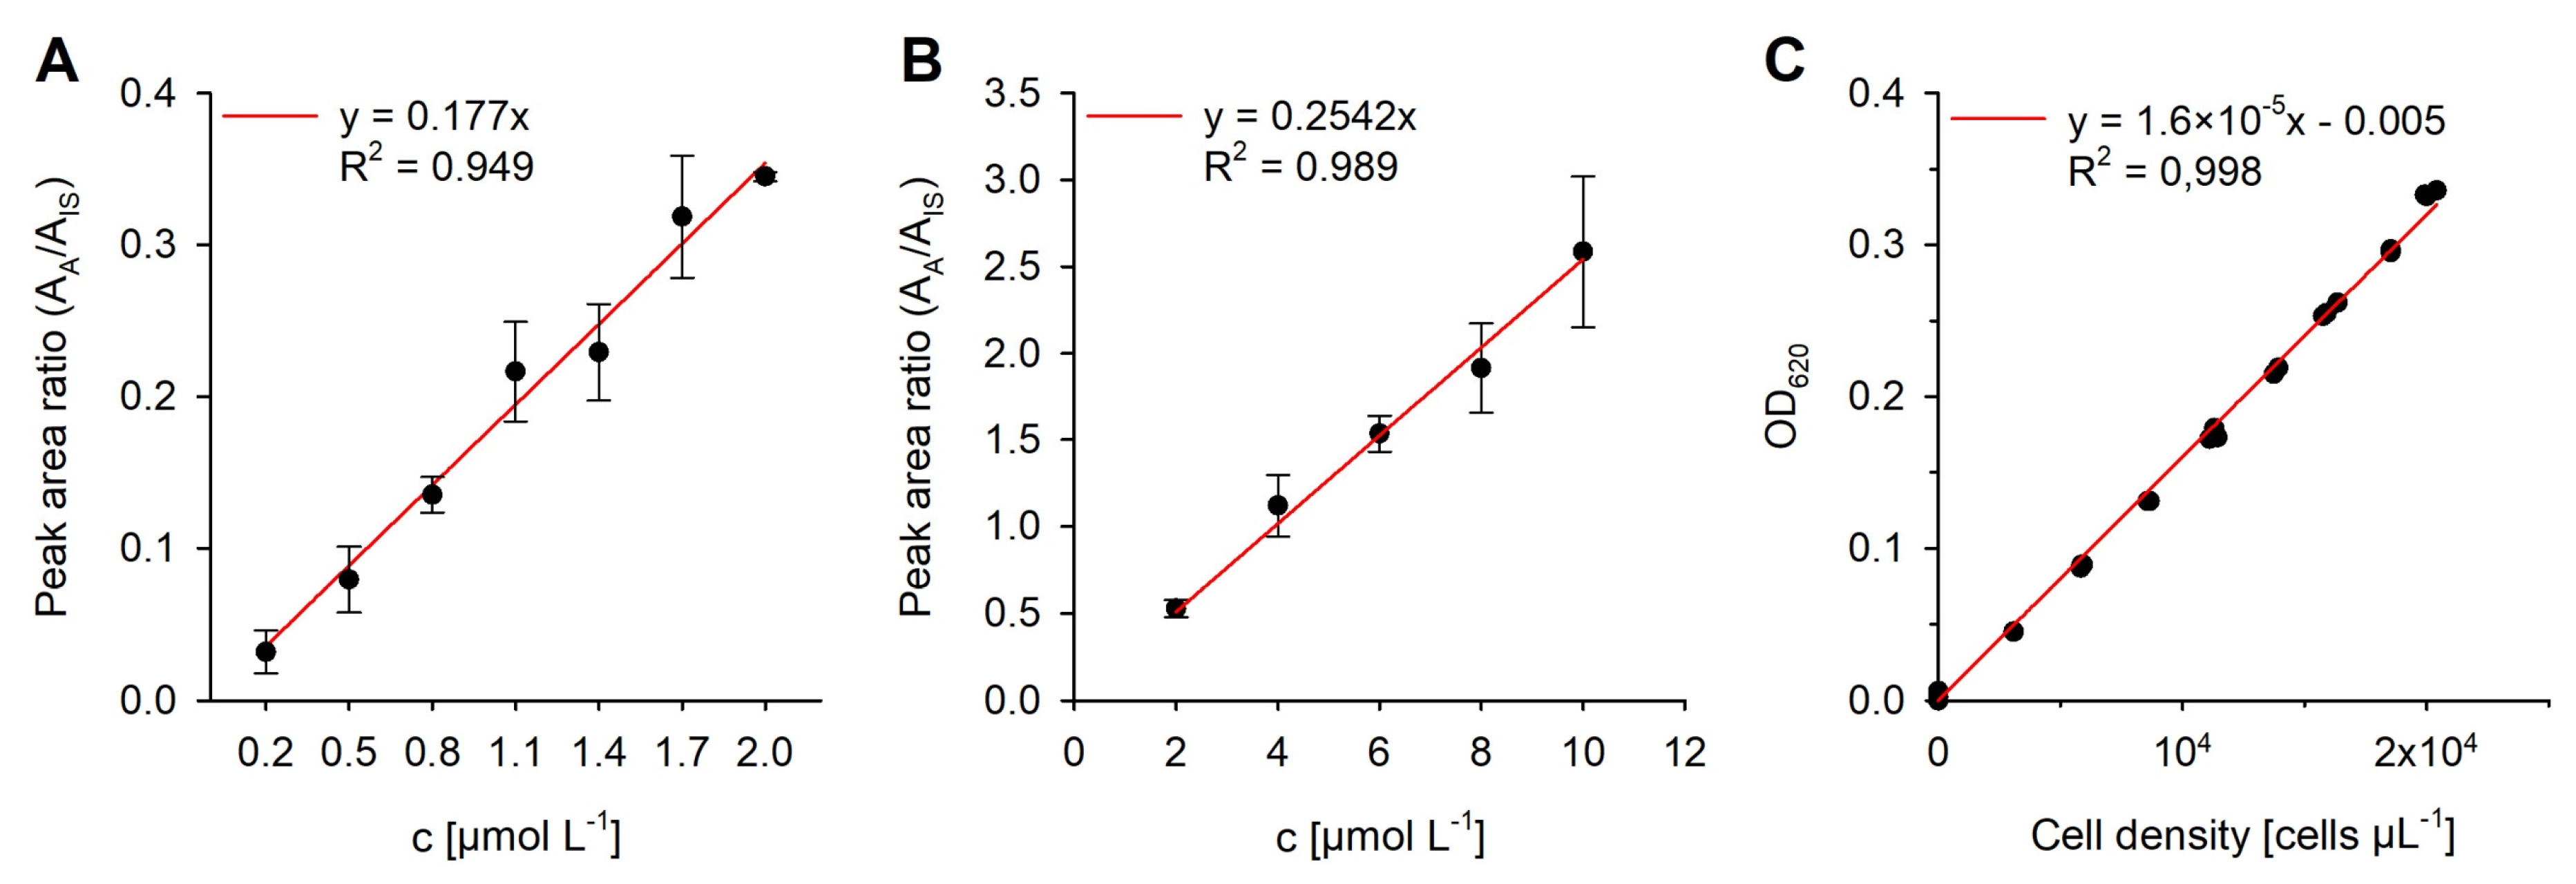
4.8. Calibration and Statistical Analysis

An external calibration curve with 5-7 calibration standards was generated in triplicate to measure the concentration of thallusin [54]. The linear regression model was calculated, plotted, and validated with SigmaPlot v.14.5 (Systat, Germany). The parameters for the calibration procedure (sx,o, syx, sr, LOD, and LOQ) were determined according to DIN 32645. The lack-of-fit test proved linearity from the analysis of variance [55]. The test value F = 1.033 was smaller than the critical value Fone-side = 2.958, with P = 95%, dfLOF (lack of fit) = 5, and dfPE (pure experimental error) = 14.

5. Conclusions

We developed a simple, quantitative LC–HRMS method for determining the algal growth- and morphogenesis-promoting factor thallusin. Due to its high affinity to iron, the derivatization of the carboxyl groups of thallusin is essential to obtain symmetrical peaks for the analyte and efficient chromatographic separation of the analyte. The use of iodomethane for derivatization is highly effective and operationally simple. To handle matrix effects, calibration was performed throughout the entire analytical procedure. Our advanced method for the quantitative analysis of the morphogen thallusin can, thus, be used to broadly monitor thallusin in the mutualistic relationship between Ulva and its associated bacteria in culture as well as in natura. It may thereby contribute to a better understanding of the maintenance of sustainable aquacultures. The method is currently being expanded toward detecting thallusin in relevant bacterial and algal culture settings and should also be useful for green tide monitoring. Chemically, our study suggests that traces of other carboxylic-acid-containing metabolites released into the water may be equally quantified by implementing a similar workflow.

Author Contributions

Conceptualization, T.W. and J.F.U.; data curation, T.W.; formal analysis, J.F.U. and T.W.; funding acquisition, H.-D.A. and T.W.; investigation, J.F.U.; methodology, J.F.U., M.S.G., P.W. and S.D.; resources, H.-D.A. and T.W.; supervision, H.-D.A. and T.W.; validation, J.F.U., H.-D.A. and T.W.; visualization, J.F.U.; writing—original draft preparation, J.F.U. and T.W.; writing—review and editing, J.F.U., M.S.G., P.W., S.D., H.-D.A. and T.W. All authors have read and agreed to the published version of the manuscript.

Funding

This work was funded by the Deutsche Forschungsgemeinschaft (DFG, German Research Foundation), SFB 1127 ChemBioSys, project number 239748522 (subproject A01, granted to T.W. and H.-D.A.) and the European Commission (Marie Curie fellowship grant no. 796194 THALLMORPHAL, awarded to S.D.). Doctoral fellowships from the Konrad-Adenauer-Stiftung (awarded to J.F.U.) and the Deutsche Bundesstiftung Umwelt (awarded to P.W.) are gratefully acknowledged.

Institutional Review Board Statement

Not applicable.

Data Availability Statement

Not applicable.

Acknowledgments

Georg Pohnert (Friedrich Schiller University Jena) is acknowledged for helpful support and discussion during the preparation of this manuscript. This article is also based upon work from COST Action CA20106 “Tomorrow’s wheat of the sea’: Ulva, a model for an innovative mariculture”, supported by COST (European Cooperation in Science and Technology, www.cost.eu).

Conflicts of Interest

The authors declare no conflict of interest.

References

  1. Spoerner, M.; Wichard, T.; Bachhuber, T.; Stratmann, J.; Oertel, W. Growth and thallus morphogenesis of Ulva mutabilis (Chlorophyta) depends on a combination of two bacterial species excreting regulatory factors. J. Phycol. 2012, 48, 1433–1447. [Google Scholar] [CrossRef] [PubMed]
  2. Wichard, T. From model organism to application: Bacteria-induced growth and development of the green seaweed Ulva and the potential of microbe leveraging in algal aquaculture. Semin. Cell Dev. Biol. 2022, in press. [Google Scholar] [CrossRef] [PubMed]
  3. Dominguez, H.; Loret, E.P. Ulva lactuca, a source of troubles and potential riches. Mar. Drugs 2019, 17, 357. [Google Scholar] [CrossRef] [PubMed] [Green Version]
  4. Wichard, T. Exploring bacteria-induced growth and morphogenesis in the green macroalga order Ulvales (Chlorophyta). Front. Plant Sci. 2015, 6, 86. [Google Scholar] [CrossRef]
  5. Steinhagen, S.; Barco, A.; Wichard, T.; Weinberger, F. Conspecificity of the model organism Ulva mutabilis and Ulva compressa (Ulvophyceae, Chlorophyta). J. Phycol. 2019, 55, 25–36. [Google Scholar] [CrossRef] [Green Version]
  6. Alsufyani, T.; Califano, G.; Deicke, M.; Grueneberg, J.; Weiss, A.; Engelen, A.H.; Kwantes, M.; Mohr, J.F.; Ulrich, J.F.; Wichard, T. Macroalgal–bacterial interactions: Identification and role of thallusin in morphogenesis of the seaweed Ulva (Chlorophyta). J. Exp. Bot. 2020, 71, 3340–3349. [Google Scholar] [CrossRef]
  7. Akhtar, S.S.; Mekureyaw, M.F.; Pandey, C.; Roitsch, T. Role of cytokinins for interactions of plants with microbial pathogens and pest insects. Front. Plant Sci. 2019, 10, 1777. [Google Scholar] [CrossRef] [Green Version]
  8. Su, Y.; Xia, S.; Wang, R.; Xiao, L. Phytohormonal quantification based on biological principles. Horm. Metab. Signal. Plants 2017, 13, 431–470. [Google Scholar]
  9. Dhiman, S.; Ulrich, J.F.; Wienecke, P.; Wichard, T.; Arndt, H.-D. Stereoselective total synthesis of (−)-thallusin for bioactivity profiling. Angew. Chem. Int. Ed. 2022, 61, e202206746. [Google Scholar] [CrossRef]
  10. Matsuo, Y.; Imagawa, H.; Nishizawa, M.; Shizuri, Y. Isolation of an algal morphogenesis inducer from a marine bacterium. Science 2005, 307, 1598. [Google Scholar] [CrossRef]
  11. Yamamoto, H.; Takagi, Y.; Yamasaki, N.; Mitsuyama, T.; Kasai, Y.; Imagawa, H.; Kinoshita, Y.; Oka, N.; Hiraoka, M. Syntheses of thallusin analogues and their algal morphogenesis-inducing activities. Tetrahedron 2018, 74, 7173–7178. [Google Scholar] [CrossRef]
  12. Davies, P. Plant Hormones: Biosynthesis, Signal, Transduction, Action; Springer Science & Business Media Press: New York, NY, USA, 2004. [Google Scholar]
  13. Santner, A.; Calderon-Villalobos, L.I.A.; Estelle, M. Plant hormones are versatile chemical regulators of plant growth. Nat. Chem. Biol. 2009, 5, 301–307. [Google Scholar] [CrossRef] [PubMed]
  14. Bhalerao, R.P.; Bennett, M.J. The case for morphogens in plants. Nat. Cell Biol. 2003, 5, 939–943. [Google Scholar] [CrossRef] [PubMed]
  15. Paque, S.; Weijers, D. Q&A: Auxin: The plant molecule that influences almost anything. BMC Biol. 2016, 14, 67. [Google Scholar] [CrossRef] [Green Version]
  16. Pan, X.; Welti, R.; Wang, X. Quantitative analysis of major plant hormones in crude plant extracts by high-performance liquid chromatography-mass spectrometry. Nat. Protoc. 2010, 5, 986–992. [Google Scholar] [CrossRef] [PubMed]
  17. Schäfer, M.; Brütting, C.; Baldwin, I.T.; Kallenbach, M. High-throughput quantification of more than 100 primary- and secondary-metabolites, and phytohormones by a single solid-phase extraction based sample preparation with analysis by UHPLC–HESI–MS/MS. Plant Meth. 2016, 12, 30. [Google Scholar] [CrossRef] [PubMed] [Green Version]
  18. Müller, A.; Düchting, P.; Weiler, E.W. A multiplex GC-MS/MS technique for the sensitive and quantitative single-run analysis of acidic phytohormones and related compounds, and its application to Arabidopsis thaliana. Planta 2002, 216, 44–56. [Google Scholar] [CrossRef] [PubMed]
  19. Šimura, J.; Antoniadi, I.; Široká, J.; Tarkowská, D.; Strnad, M.; Ljung, K.; Novák, O. Plant hormonomics: Multiple phytohormone profiling by targeted metabolomics. Plant Physiol. 2018, 177, 476–489. [Google Scholar] [CrossRef] [Green Version]
  20. Tarakhovskaya, E.R.; Maslov, Y.I.; Shishova, M.F. Phytohormones in algae. Russ. J. Plant Physiol. 2007, 54, 163–170. [Google Scholar] [CrossRef]
  21. Yalçın, S.; Şükran Okudan, E.; Karakaş, Ö.; Önem, A.N.; Sözgen Başkan, K. Identification and quantification of some phytohormones in seaweeds using UPLC-MS/MS. J. Liq. Chromatogr. Relat. Technol. 2019, 42, 475–484. [Google Scholar] [CrossRef]
  22. Mikami, K.; Mori, I.C.; Matsuura, T.; Ikeda, Y.; Kojima, M.; Sakakibara, H.; Hirayama, T. Comprehensive quantification and genome survey reveal the presence of novel phytohormone action modes in red seaweeds. J. Appl. Phycol. 2016, 28, 2539–2548. [Google Scholar] [CrossRef]
  23. Mori, I.C.; Ikeda, Y.; Matsuura, T.; Hirayama, T.; Mikami, K. Phytohormones in red seaweeds: A technical review of methods for analysis and a consideration of genomic data. Bot. Mar. 2017, 60, 153–170. [Google Scholar] [CrossRef]
  24. Almeida Trapp, M.; De Souza, G.D.; Rodrigues-Filho, E.; Boland, W.; Mithöfer, A. Validated method for phytohormone quantification in plants. Front. Plant Sci. 2014, 5, 417. [Google Scholar] [CrossRef] [PubMed] [Green Version]
  25. Alsufyani, T.; Weiss, A.; Wichard, T. Time course exo-metabolomic profiling in the green marine macroalga Ulva (Chlorophyta) for identification of growth phase-dependent biomarkers. Mar. Drugs 2017, 15, 14. [Google Scholar] [CrossRef] [PubMed] [Green Version]
  26. Avila-Zárraga, J.G.; Martínez, R. Efficient methylation of carboxylic acids with potassium hydroxide/methyl sulfoxide and iodomethane. Synth. Commun. 2001, 31, 2177–2183. [Google Scholar] [CrossRef]
  27. Ghaderiardakani, F.; Califano, G.; Mohr, J.F.; Abreu, M.H.; Coates, J.C.; Wichard, T. Analysis of algal growth- and morphogenesis-promoting factors in an integrated multi-trophic aquaculture system for farming Ulva spp. Aquac. Environ. Interact. 2019, 11, 375–391. [Google Scholar] [CrossRef] [Green Version]
  28. Abrahim, A.; Hartman, R.; Ge, Z.; Mao, B.; Marcoux, J. Development of a derivatization method, coupled with reverse phase HPLC, for monitoring the formation of an enolate intermediate. J. Liq. Chromatogr. Relat. Technol. 2002, 25, 1049–1062. [Google Scholar] [CrossRef]
  29. Lee, S.T.; Mitchell, R.B.; Wang, Z.; Heiss, C.; Gardner, D.R.; Azadi, P. Isolation, characterization, and quantification of steroidal saponins in switchgrass (Panicum virgatum L.). J. Agric. Food Chem. 2009, 57, 2599–2604. [Google Scholar] [CrossRef]
  30. Kinoshita, Y.; Sato, Y.; Sakurai, T.; Yamasaki, T.; Yamamoto, H.; Hiraoka, M. Development of blade cells and rhizoid cells aseptically isolated from the multicellular leafy seaweed Gayralia oxysperma. Cytologia 2022, 87, 17–22. [Google Scholar] [CrossRef]
  31. Maruyama, A.; Maeda, M.; Simidu, U. Distribution and classification of marine bacteria with the ability of cytokinin and auxin production. Bull. Jap. Soc. Microb. Ecol. 1990, 5, 1–8. [Google Scholar] [CrossRef] [Green Version]
  32. Ashen, J.B.; Cohen, J.D.; Goff, L.J. GC-SIM-MS detection and quantification of free indole-3-acetic acid in bacterial galls on the marine alga Prionitis lanceolata (Rhodophyta). J. Phycol. 1999, 35, 493–500. [Google Scholar] [CrossRef]
  33. De Clerck, O.; Kao, S.-M.; Bogaert, K.A.; Blomme, J.; Foflonker, F.; Kwantes, M.; Vancaester, E.; Vanderstraeten, L.; Aydogdu, E.; Boesger, J.; et al. Insights into the Evolution of Multicellularity from the Sea Lettuce Genome. Curr. Biol. 2018, 28, 2921–2933.e2925. [Google Scholar] [CrossRef] [PubMed] [Green Version]
  34. Gupta, V.; Kumar, M.; Brahmbhatt, H.; Reddy, C.R.K.; Seth, A.; Jha, B. Simultaneous determination of different endogenetic plant growth regulators in common green seaweeds using dispersive liquid–liquid microextraction method. Plant Physiol. Biochem. 2011, 49, 1259–1263. [Google Scholar] [CrossRef] [PubMed]
  35. Matsuura, T.; Mori, I.C.; Ikeda, Y.; Hirayama, T.; Mikami, K. Comprehensive phytohormone quantification in the red alga Pyropia yezoensis by liquid chromatography–mass spectrometry. In Protocols for Macroalgae Research; Charrier, B., Wichard, T., Reddy, C., Eds.; CRC Press: Boca Raton, FL, USA, 2018. [Google Scholar]
  36. Yalçın, S.; Okudan, E.Ş.; Karakaş, Ö.; Önem, A.N. Determination of major phytohormones in fourteen different seaweeds utilizing SPE–LC–MS/MS. J. Chromatogr. Sci. 2019, 58, 98–108. [Google Scholar] [CrossRef]
  37. Kojima, M.; Kamada-Nobusada, T.; Komatsu, H.; Takei, K.; Kuroha, T.; Mizutani, M.; Ashikari, M.; Ueguchi-Tanaka, M.; Matsuoka, M.; Suzuki, K.; et al. Highly sensitive and high-throughput analysis of plant hormones using MS-probe modification and liquid chromatography–tandem mass spectrometry: An application for hormone profiling in Oryza sativa. Plant Cell Physiol. 2009, 50, 1201–1214. [Google Scholar] [CrossRef]
  38. Wolter, L.A.; Mitulla, M.; Kalem, J.; Daniel, R.; Simon, M.; Wietz, M. CAZymes in Maribacter dokdonensis 62–1 from the patagonian shelf: Genomics and physiology compared to related Flavobacteria and a co-occurring Alteromonas strain. Front. Microbiol. 2021, 12, 628055. [Google Scholar] [CrossRef]
  39. Matsuda, R.; Handayani, M.L.; Sasaki, H.; Takechi, K.; Takano, H.; Takio, S. Production of indoleacetic acid by strains of the epiphytic bacteria Neptunomonas spp. isolated from the red alga Pyropia yezoensis and the seagrass Zostera marina. Arch. Microbiol. 2018, 200, 255–265. [Google Scholar] [CrossRef]
  40. Zluhan-Martínez, E.; López-Ruíz, B.A.; García-Gómez, M.L.; García-Ponce, B.; de la Paz Sánchez, M.; Álvarez-Buylla, E.R.; Garay-Arroyo, A. Integrative roles of phytohormones on cell proliferation, elongation and differentiation in the Arabidopsis thaliana primary root. Front. Plant Sci. 2021, 12, 659155. [Google Scholar] [CrossRef]
  41. Ahmed, A.; Hasnain, S. Auxin-producing Bacillus sp.: Auxin quantification and effect on the growth of Solanum tuberosum. Pure Appl. Chem. 2010, 82, 313–319. [Google Scholar] [CrossRef]
  42. Ali, B.; Sabri, A.N.; Ljung, K.; Hasnain, S. Auxin production by plant associated bacteria: Impact on endogenous IAA content and growth of Triticum aestivum L. Lett. Appl. Microbiol. 2009, 48, 542–547. [Google Scholar] [CrossRef]
  43. Benítez García, I.; Dueñas Ledezma, A.K.; Martínez Montaño, E.; Salazar Leyva, J.A.; Carrera, E.; Osuna Ruiz, I. Identification and quantification of plant growth regulators and antioxidant compounds in aqueous extracts of Padina durvillaei and Ulva lactuca. Agronomy 2020, 10, 866. [Google Scholar] [CrossRef]
  44. Paliwal, C.; Jutur, P.P. Dynamic allocation of carbon flux triggered by task-specific chemicals is an effective non-gene disruptive strategy for sustainable and cost-effective algal biorefineries. Chem. Eng. J. 2021, 418, 129413. [Google Scholar] [CrossRef]
  45. Franz, A.K.; Danielewicz, M.A.; Wong, D.M.; Anderson, L.A.; Boothe, J.R. Phenotypic screening with oleaginous microalgae reveals modulators of lipid productivity. ACS Chem. Biol. 2013, 8, 1053–1062. [Google Scholar] [CrossRef] [PubMed]
  46. Polikovsky, M.; Califano, G.; Dunger, N.; Wichard, T.; Golberg, A. Engineering bacteria -seaweed symbioses for modulating the photosynthate content of Ulva (Chlorophyta): Significant for the feedstock of bioethanol production. Algal Res. 2020, 49, 101945. [Google Scholar] [CrossRef]
  47. Nedashkovskaya, O.I.; Kim, S.B.; Han, S.K.; Lysenko, A.M.; Rohde, M.; Rhee, M.-S.; Frolova, G.M.; Falsen, E.; Mikhailov, V.V.; Bae, K.S. Maribacter gen. nov., a new member of the family Flavobacteriaceae, isolated from marine habitats, containing the species Maribacter sedimenticola sp. nov., Maribacter aquivivus sp. nov., Maribacter orientalis sp. nov. and Maribacter ulvicola sp. nov. Int. J. Syst. Evol. 2004, 54, 1017–1023. [Google Scholar] [CrossRef]
  48. Barbeyron, T.; L’Haridon, S.; Corre, E.; Kloareg, B.; Potin, P. Zobellia galactanovorans gen. nov., sp. nov., a marine species of Flavobacteriaceae isolated from a red alga, and classification of [Cytophaga] uliginosa (ZoBell and Upham 1944) Reichenbach 1989 as Zobellia uliginosa gen. nov., comb. nov. Int. J. Syst. Evol. 2001, 51, 985–997. [Google Scholar] [CrossRef] [Green Version]
  49. Weerawongwiwat, V.; Kang, H.; Jung, M.Y.; Kim, W. Maribacter chungangensis sp. nov., isolated from a green seaweed, and emended descriptions of the genus Maribacter and Maribacter arcticus. Int. J. Syst. Evol. Microbiol. 2013, 63, 2553–2558. [Google Scholar] [CrossRef] [Green Version]
  50. Hahnke, R.L.; Harder, J. Phylogenetic diversity of Flavobacteria isolated from the North Sea on solid media. Syst. Appl. Microbiol. 2013, 36, 497–504. [Google Scholar] [CrossRef]
  51. Weiss, A.; Costa, R.; Wichard, T. Morphogenesis of Ulva mutabilis (Chlorophyta) induced by Maribacter species (Bacteroidetes, Flavobacteriaceae). Bot. Mar. 2017, 60, 197–206. [Google Scholar] [CrossRef]
  52. Hahnke, R.L.; Bennke, C.M.; Fuchs, B.M.; Mann, A.J.; Rhiel, E.; Teeling, H.; Amann, R.; Harder, J. Dilution cultivation of marine heterotrophic bacteria abundant after a spring phytoplankton bloom in the North Sea. Environ. Microbiol. 2015, 17, 3515–3526. [Google Scholar] [CrossRef]
  53. Nahor, O.; Morales-Reyes, C.F.; Califano, G.; Wichard, T.; Golberg, A.; Israel, Á. Flow cytometric measurements as a proxy for sporulation intensity in the cultured macroalga Ulva (Chlorophyta). Bot. Mar. 2021, 64, 83–92. [Google Scholar] [CrossRef]
  54. Deicke, M.; Bellenger, J.P.; Wichard, T. Direct quantification of bacterial molybdenum and iron metallophores with ultra-high-performance liquid chromatography coupled to time-of-flight mass spectrometry. J. Chromatogr. A 2013, 1298, 50–60. [Google Scholar] [CrossRef] [PubMed]
  55. Reichenbächer, M.; Einax, J.W. The lack-of-fit test by ANOVA. In Challenges in Analytical Quality Assurance; Springer: Berlin/Heidelberg, Germany, 2011; pp. 136–138. [Google Scholar]
Figure 1. Method development for thallusin analysis and quantification by derivatization with iodomethane. (A) Derivatization of thallusin and the internal standard (red). (B) The synthetic thallusin standard (0.1 mmol L−1) and the internal standard (0.1 mmol L−1) were analyzed by UHPLC-ESI-HRMS using the single ion mode (SIM) (thallusin: m/z 458.2176; internal standard: m/z 458.2541) combined with C18 SPE. At 5.19 min, the internal standard was eluted, while the thallusin standard was eluted with a strong tailing after 5.21 min—the Fe–thallusin complex (m/z 968.3394) decomposed through in-source fragmentation. (C) Chromatograms after derivatization with iodomethane. The fully methylated thallusin trimethyl ester (m/z 500.264) and the synthetic reference standard were eluted at 6.53 min. The internal standard was eluted at 5.88 min due to methylation (m/z 472.2688). (D) Mass spectra (TIC) of the chromatograms are shown in (B). Left: Mass spectrum of the peak at 5.21 min—thallusin (black, m/z 458.2176) and the internal standard (red, m/z 458.2537) were detected at 5.21 min. Middle: 54Fe/56Fe thallusin isotope signature at 5.75 min. Right: Measured internal standard (red, m/z 458.2541) at 5.19 min. Thallusin (black, m/z 458.2184) was also already detectable at 5.19 min. (E) Mass spectra (TIC) of the chromatograms are shown in (C). Left: Mass spectrum of the peak at 6.53 min for the thallusin trimethyl ester (black, m/z 500.2635). Middle: Mass spectrum of the reference standard (black, m/z 500.2638) at 6.52 min. Right: Mass spectrum of the methylated internal standard (red, m/z 472.2688) at 5.88 min.
Marinedrugs 20 00690 g001
Figure 2. Calibration function. (A,B) Linear regression functions for the mass spectrometry data of the thallusin trimethyl ester were obtained by derivatization with iodomethane for two different working ranges. The peak area ratio of the analyte and internal standard were plotted against the concentration of the calibration standard (n = 3). The error bars represent the mean ± standard deviation. (C) For normalizing the thallusin concentration to cell number, photometric measurements of the optical density were correlated with the number of cells counted via flow cytometry.
Marinedrugs 20 00690 g002
Figure 3. Growth curve and rates of the investigated bacterial strains. (AG) The Maribacter and Zobellia strains were cultivated in a HaHa_100 growth medium for five days. During the different phases of growth, indicated by 1, 2, and 3, the growth medium was harvested to quantify the thallusin released (n = 3). (H) The growth rates (µ) of selected strains were determined. A one-way ANOVA determined significant differences with a Tukey post-hoc test (p < 0.05); the different letters on top of the boxplots indicate statistically significant differences. The error bars represent the mean ± standard deviation.
Marinedrugs 20 00690 g003
Figure 4. Growth-curve-derived quantification and reproducibility of biological replicates. (A) The UHPLC–MS chromatograms after C18 SPE were obtained from 50 mL of the Maribacter sp. MS6 supernatants, which were subsequently derivatized with iodomethane at different phases of bacterial growth (1–3). (B) Growth curve of Maribacter sp. with sampling points 1–3. (C) Quantification of thallusin in the culture medium during the bacterial growth phases 1–3 (n = 3), determined by external calibration (see also Table 2). The error bars represent the mean ± standard deviation (n = 3). A one-way ANOVA determined significant differences with a Tukey post-hoc test (p < 0.05); the different letters indicate statistically significant differences.
Marinedrugs 20 00690 g004
Figure 5. Quantification of thallusin in the growth medium normalized to the cell number for seven bacterial strains. The different letters indicate statistically significant differences in the thallusin concentration between the bacteria during a given growth phase (one-way ANOVA, Tukey post-hoc test, p < 0.05). The error bars represent the mean ± standard deviation (n = 3).
Marinedrugs 20 00690 g005
Figure 6. Application: Determination of thallusin in Ulva aquaculture. (A) Summary of the analytical procedure. (B) Algal culture: the trimethyl ester (top chromatogram) of thallusin was detected at 6.53 min by comparison with the reference standard (bottom) and by co-injection (center). (C) The quantification indicated a 30-fold higher concentration of thallusin than its EC90 value. The error bar represents the mean ± standard deviation (n = 3).
Marinedrugs 20 00690 g006
Table 1. Selected calibration parameters for the quantification of thallusin.
ParameterValue
Intercept, a00
Slope, a10.177
Calibration error, sy,x0.008
Analytical standard deviation, sx,00.047 µmol L−1
Critical measured value, yc0.013
Relative standard deviation, sr0.758%
Number of calibration standards, nc7
Limit of detection (LOD) 10.0756 µmol L−1
Limit of quantification (LOQ) 10.2217 µmol L−1
1 Upon processing of 0.75 L algal culture medium, the LOD and LOQ are 2.5 and 7.4 pmol L−1, respectively.
Table 2. Thallusin concentration (nmol L−1) in the growth media during three growth phases of various bacteria. Strain names or collection numbers are given.
Thallusin Concentration [nmol L−1]
NameStrainNCBI/GenBank Accession NumberOD620 = 0.15OD620 = 0.25Late
Stationary Phase
Maribacter
sp.
MS6EU3599111.46 ± 0.144.29 ± 0.8311.21 ± 1.68
Maribacter
arcticus
DSMZ 23546TAY7717620.89 ± 0.312.82 ± 0.379.08 ± 0.95
Maribacter
chungangensis
CCUG 61948TJN0365500.82 ± 0.081.05 ± 0.193.64 ± 0.96
Maribacter
sedimenticola
DSMZ 19840TAY2716231.71 ± 0.343.87 ± 1.609.18 ± 0.90
Maribacter
stanieri
DSMZ 19891TEU2466910.67 ± 0.043.59 ± 1.986.79 ± 0.45
Maribacter
ulvicola
DSMZ 15366TAY2716261.41 ± 0.153.96 ± 0.8712.67 ± 2.58
Zobellia
galactanivorans
DsijTGCA_
000973105
1.38 ± 0.223.57 ± 0.5014.81 ± 1.77
Publisher’s Note: MDPI stays neutral with regard to jurisdictional claims in published maps and institutional affiliations.

