
Comorbidity Profile and Predictors of Obstructive Sleep Apnea Severity and Mortality in Non-Obese Obstructive Sleep Apnea Patients

Abstract
:1. Introduction
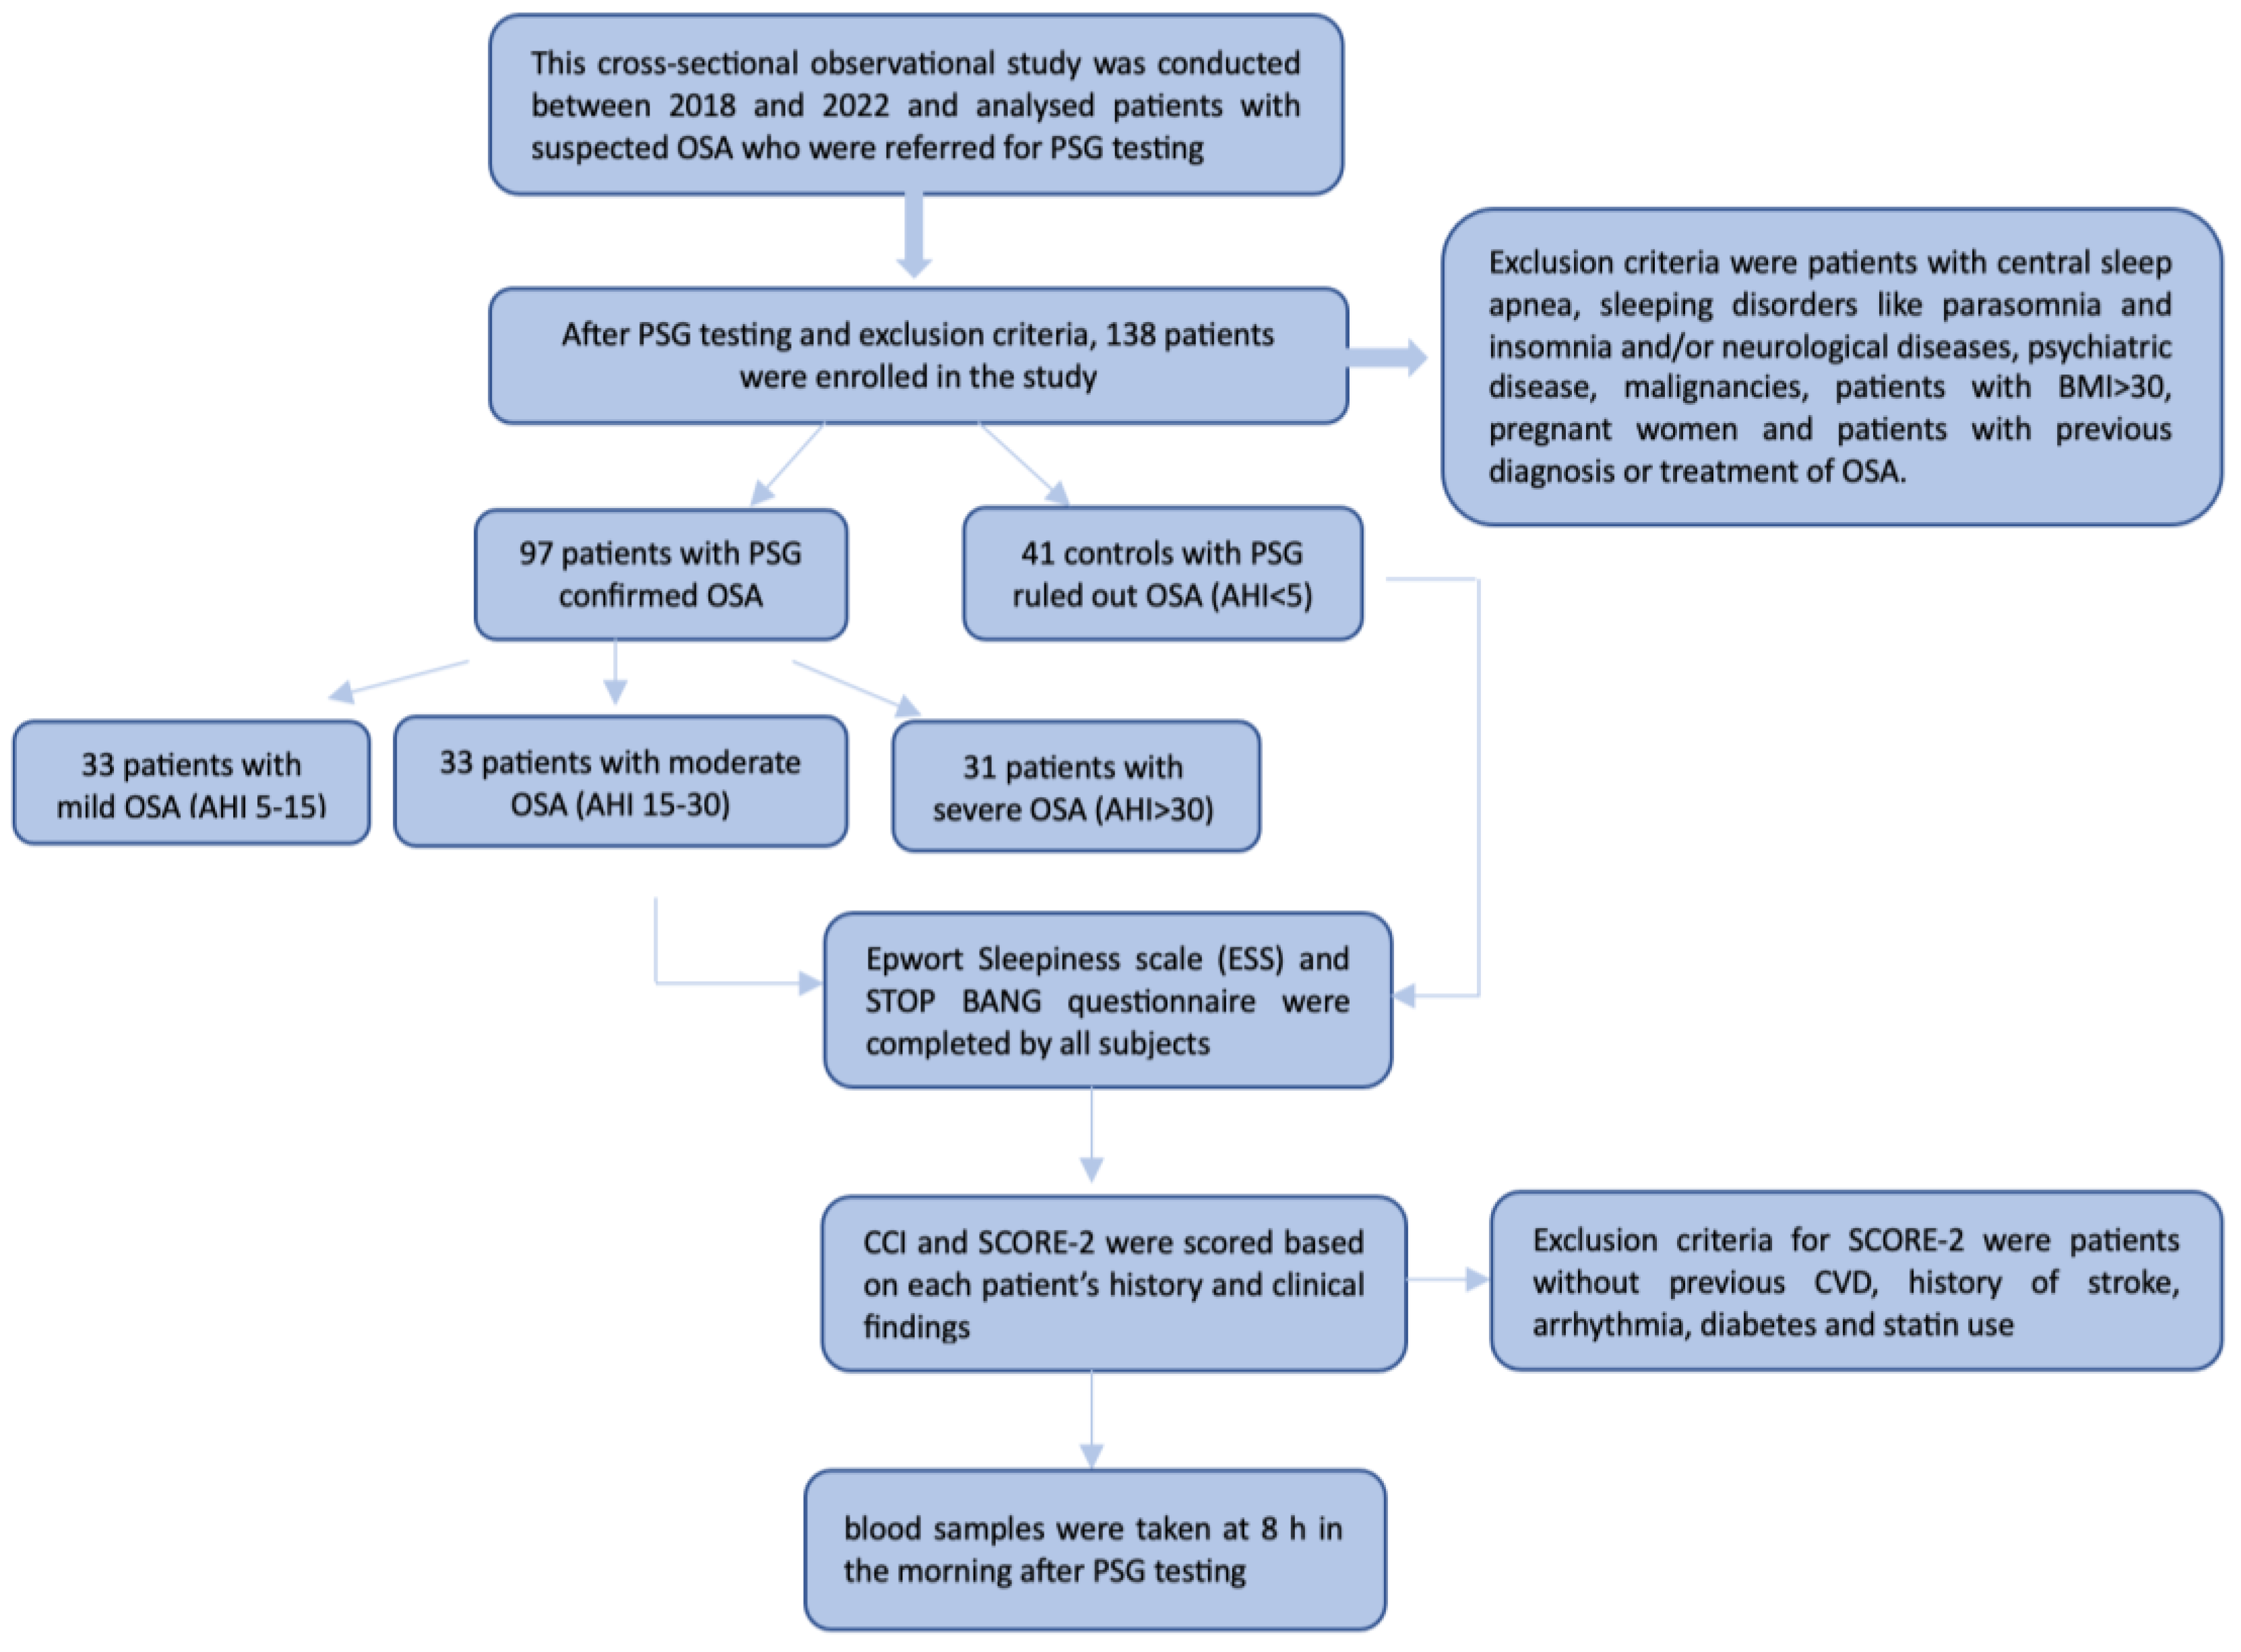
2. Material and Methods
2.1. Cardiovascular Risk Assessment
2.2. Polysomnography Assessment
2.3. Laboratory Analysis
2.4. Statistical Analysis
3. Results
4. Discussion
5. Conclusions
Author Contributions
Funding
Institutional Review Board Statement
Informed Consent Statement
Data Availability Statement
Conflicts of Interest
References
- Kopitović, I. Respiratorni Poremećaji Tokom Spavanja [Sleep Breathing Disorders]; Novi Sad, Medicinski fakultet: Novi Sad, Serbia, 2011; 51p. (In Serbian) [Google Scholar]
- Jovančević, D.M.; Kopitović, I.; Miličić, D.; Pavlović-Popović, Z. Dijagnostika respiratornih poremećaja tokom spavanja [Diagnostics of Sleep Breathing Disorders]. Pneumon 2013, 50, 4–13. (In Serbian) [Google Scholar]
- Drager, L.F.; Bortolotto, L.A.; Figueiredo, A.C.; Silva, B.C.; Krieger, E.M.; Lorenzi-Filho, G. Obstructive sleep apnea, hypertension, and their interaction on arterial stiffness and heart remodelling. Chest 2007, 131, 1379–1386. [Google Scholar] [CrossRef] [PubMed]
- Lavie, L. Oxidative Stress—A Unifying Paradigm in Obstructive Sleep Apnea and Comorbidities. Prog. Cardiovasc. Dis. 2009, 51, 303–312. [Google Scholar] [CrossRef]
- Suzuki, Y.J.; Jain, V.; Park, A.M.; Day, R.M. Oxidative Stress and Oxidant Signaling in Obstructive Sleep Apnea and Associated Cardiovascular Diseases. Free Radic. Biol. Med. 2006, 40, 1683–1692. [Google Scholar] [CrossRef] [PubMed]
- Lam, J.C.; Yan, C.S.; Lai, A.Y.; Tam, S.; Fong, D.Y.; Lam, B.; Ip, M.S. Determinants of Daytime Blood Pressure in Relation to Obstructive Sleep Apnea in Men. Lung 2009, 187, 291–298. [Google Scholar] [CrossRef]
- Punjabi, N.M. The Epidemiology of Adult Obstructive Sleep Apnea. Proc. Am. Thorac. Soc. 2008, 5, 136–143. [Google Scholar] [CrossRef]
- Tufik, S.; Santos-Silva, R.; Taddei, J.A.; Bittencourt, L.R.A. Obstructive sleep apnea syndrome in the Sao Paulo Epidemiologic Sleep Study. Sleep Med. 2010, 11, 441–446. [Google Scholar] [CrossRef]
- McNicholas, W.T. Obstructive Sleep Apnoea and Comorbidity—An Overview of the Association and Impact of Continuous Positive Airway Pressure Therapy. Expert Rev. Respir. Med. 2019, 13, 251–261. [Google Scholar] [CrossRef]
- Punjabi, N.M.; Caffo, B.S.; Goodwin, J.L.; Gottlieb, D.J.; Newman, A.B.; O’Connor, G.T.; Rapoport, D.M.; Redline, S.; Resnick, H.E.; Robbins, J.A.; et al. Sleep-disordered breathing and mortality: A prospective cohort study. PLoS Med. 2009, 6, e1000132. [Google Scholar] [CrossRef]
- Javaheri, S.; Barbe, F.; Campos-Rodriguez, F.; Dempsey, J.A.; Khayat, R.; Javaheri, S.; Malhotra, A.; Martinez-Garcia, M.A.; Mehra, R.; Pack, A.I.; et al. Sleep Apnea: Types, Mechanisms, and Clinical Cardiovascular Consequences. J. Am. Coll. Cardiol 2017, 69, 841–858. [Google Scholar] [CrossRef]
- Kopitovic, I.; Trajanovic, N.; Prodic, S.; Drvenica, M.J.; Ilic, M.; Kuruc, V.; Kojicic, M. The Serbian version of the Epworth Sleepiness Scale. Sleep Breath 2011, 15, 775–780. [Google Scholar] [CrossRef] [PubMed]
- Örnek, T.; Koçak, E.; Koçak, G.; Bakırtaş, H.; Atmaca, H.; Can, M.; Bayraktaroğlu, T.; Altın, R. Insulin Resistance and Serum Leptin Levels in Men with Obstructive Sleep Apnea Syndrome. Electron J. Gen. Med. 2011, 8, 273–279. [Google Scholar] [CrossRef]
- Cizza, G.; Piaggi, P.; Lucassen, E.A.; de Jonge, L.; Walter, M.; Mattingly, M.S.; Kalish, H.; Csako, G.; Rother, K.I. Obstructive Sleep Apnea Is a Predictor of Abnormal Glucose Metabolism in Chronically Sleep Deprived Obese Adults. PLoS ONE 2013, 8, e65400. [Google Scholar] [CrossRef]
- Lee, R.; McNicholas, W.T. Obstructive Sleep Apnea in Chronic Obstructive Pulmonary Disease Patients. Curr. Opin. Pulm. Med. 2011, 17, 79–83. [Google Scholar] [CrossRef] [PubMed]
- McNicholas, W.T.; Verbraecken, J.; Marin, J.M. Sleep Disorders in COPD: The Forgotten Dimension. Eur. Respir. Rev. 2013, 22, 365–375. [Google Scholar] [CrossRef]
- Durgan, D.J.; Bryan, R.M. Cerebrovascular Consequences of Obstructive Sleep Apnea. J. Am. Heart. Assoc. 2012, 1, e000091. [Google Scholar] [CrossRef] [PubMed]
- Chen, Y.H.; Keller, J.K.; Kang, J.H.; Hsieh, H.J.; Lin, H.C. Obstructive sleep apnea and the subsequent risk of depressive disorder: A population-based follow-up study. J. Clin. Sleep Med. 2013, 9, 417–423. [Google Scholar] [CrossRef] [PubMed]
- Kendzerska, T.; Gershon, A.S.; Hawker, G.; Leung, R.S.; Tomlinson, G. Obstructive Sleep Apnea and Risk of Cardiovascular Events and All-Cause Mortality: A Decade-Long Historical Cohort Study. PLoS Med. 2014, 11, e1001599. [Google Scholar] [CrossRef]
- Jennum, P.; Kjellberg, J. Health, Social and Economical Consequences of Sleep-Disordered Breathing: A Controlled National Study. Thorax 2011, 66, 560–566. [Google Scholar] [CrossRef]
- Hopps, E.; Canino, B.; Calandrino, V.; Montana, M.; Lo Presti, R.; Caimi, G. Lipid peroxidation and protein oxidation are related to the severity of OSAS. Eur. Rev. Med. Pharmacol. Sci. 2014, 18, 3773–3778. [Google Scholar] [PubMed]
- Charlson, M.E.; Pompei, P.; Ales, K.L.; MacKenzie, C. Ronald. A New Method of Classifying Prognostic Comorbidity in Longitudinal Studies: Development and Validation. J. Chronic Dis. 1987, 40, 373–383. [Google Scholar] [CrossRef] [PubMed]
- Charlson, M.; Szatrowski, T.P.; Peterson, J.; Gold, J. Validation of a Combined Comorbidity Index. J. Clin. Epidemiol. 1994, 47, 1245–1251. [Google Scholar] [CrossRef] [PubMed]
- SCORE2 working group and ESC Cardiovascular risk collaboration. SCORE2 risk prediction algorithms: New models to estimate 10-year risk of cardiovascular disease in Europe. Eur. Heart. J. 2021, 42, 2439–2454. [Google Scholar] [CrossRef] [PubMed]
- Iber, C.; Ancoli-Israel, S.; Chesson, A.L.; Quan, S.F. The AASM Manual for the Scoring of Sleep and Associated Events: Rules, Therminology and Technical Specification, Version 3; Darien, I.L., Ed.; American Academy of Sleep: Darien, IL, USA, 2023. [Google Scholar]
- Hirshkowitz, M.; Kryger, M. Monitoring techniques for Evaluating Suspected Sleep-Related Breathing and cardiovascular Disorders. In Principles and Practice of Sleep Medicine, 7th ed.; Kryger, M.H., Roth, T., Dement, W.C., Eds.; Elsevier: Philadelphia, PA, USA, 2022. [Google Scholar]
- Matthews, D.R.; Hosker, J.P.; Rudenski, A.S.; Naylor, B.A.; Treacher, D.F.; Turner, R.C. Homeostasis Model Assessment: Insulin Resistance and beta-cell Function from Fasting Plasma Glucose and Insulin Concentrations in Man. Diabetologia 1985, 28, 412–419. [Google Scholar] [CrossRef] [PubMed]
- Wolk, R.; Shamsuzzaman, A.S.M.; Somers, V.K. Obesity, Sleep Apnea, and Hypertension. Hypertension 2003, 42, 1067–1074. [Google Scholar] [CrossRef]
- McNicholas, W.T.; Bonsigore, M.R.; Management Committee of EU COST ACTION B26. Sleep Apnoea as an Independent Risk Factor for Cardiovascular Disease: Current Evidence, Basic Mechanisms and Research Priorities. Eur. Respir. J. 2007, 29, 156–178. [Google Scholar] [CrossRef]
- Azarbarzin, A.; Sands, S.A.; Stone, K.L.; Taranto-Montemurro, L.; Messineo, L.; Terrill, P.I.; Ancoli-Israel, S.; Ensrud, K.; Purcell, S.; White, D.P.; et al. The Hypoxic Burden of Sleep Apnoea Predicts Cardiovascular Disease-Related Mortality: The Osteoporotic Fractures in Men Study and the Sleep Heart Health Study. Eur. Heart. J. 2018, 40, 1149–1157. [Google Scholar] [CrossRef]
- Somers, V.K.; White, D.P.; Amin, R.; Abraham, W.T.; Costa, F.; Culebras, A.; Daniels, S.; Floras, J.S.; Hunt, C.E.; Olson, L.J.; et al. American Heart Association Council for High Blood Pressure Research Professional Education Committee, Council on Clinical Cardiology; American Heart Association Stroke Council; American Heart Association Council on Cardiovascular Nursing; American College of Cardiology Foundation. Sleep apnea and cardiovascular disease: An American Heart Association/american College Of Cardiology Foundation Scientific Statement from the American Heart Association Council for High Blood Pressure Research Professional Education Committee, Council on Clinical Cardiology, Stroke Council, and Council On Cardiovascular Nursing. In collaboration with the National Heart, Lung, and Blood Institute National Center on Sleep Disorders Research (National Institutes of Health). Circulation 2008, 118, 1080–1111. [Google Scholar] [CrossRef]
- Bradley, T.D.; Floras, J.S. Obstructive Sleep Apnoea and Its Cardiovascular Consequences. Lancet 2009, 373, 82–93. [Google Scholar] [CrossRef]
- Lévy, P.; Kohler, M.; McNicholas, W.T.; Barbé, F.; McEvoy, R.D.; Somers, V.K.; Lavie, L.; Pépin, J.L. Obstructive sleep apnoea syndrome. Nat. Rev. Dis. Primers 2015, 1, 15015. [Google Scholar] [CrossRef]
- Jelic, S.; Padeletti, M.; Kawut, S.M.; Higgins, C.; Canfield, S.M.; Onat, D.; Colombo, P.C.; Basner, R.C.; Factor, P.; LeJemtel, T.H. Inflammation, Oxidative Stress, and Repair Capacity of the Vascular Endothelium in Obstructive Sleep Apnea. Circulation 2008, 117, 2270–2278. [Google Scholar] [CrossRef] [PubMed]
- Lavie, L. Oxidative stress in obstructive sleep apnea and intermittent hypoxia-revisited-the bad ugly and good: Implications to the heart and brain. Sleep Med. Rev. 2015, 20, 27–45. [Google Scholar] [CrossRef] [PubMed]
- Senaratna, C.V.; Perret, J.L.; Lodge, C.J.; Lowe, A.J.; Campbell, B.E.; Matheson, M.C.; Hamilton, G.S.; Dharmage, S.C. Prevalence of Obstructive Sleep Apnea in the General Population: A Systematic Review. Sleep Med. Rev. 2017, 34, 70–81. [Google Scholar] [CrossRef] [PubMed]
- Floras, J.S. Hypertension, sleep apnea, and atherosclerosis. Hypertension 2009, 53, 1–3. [Google Scholar] [CrossRef]
- Oldenburg, O.; Wellmann, B.; Buchholz, A.; Bitter, T.; Fox, H.; Thiem, U.; Horstkotte, D.; Wegscheider, K. Nocturnal Hypoxaemia Is Associated with Increased Mortality in Stable Heart Failure Patients. Eur. Heart. J. 2016, 37, 1695–1703. [Google Scholar] [CrossRef]
- Smagula, S.F.; Stone, K.L.; Redline, S.; Ancoli-Israel, S.; Barrett-Connor, E.; Lane, N.E.; Orwoll, E.S.; Cauley, J.A. Actigraphy- and Polysomnography-Measured Sleep Disturbances, Inflammation, and Mortality among Older Men. Psychosom Med. 2016, 78, 686–696. [Google Scholar] [CrossRef] [PubMed]
- Shivashankar, R.; Kondal, D.; Ali, M.K.; Gupta, R.; Pradeepa, R.; Mohan, V.; Kadir, M.M.; Narayan, K.M.V.; Tandon, N.; Prabhakaran, D.; et al. Associations of Sleep Duration and Disturbances with Hypertension in Metropolitan Cities of Delhi, Chennai, and Karachi in South Asia: Cross-Sectional Analysis of the CARRS Study. Sleep 2017, 40, zsx119. [Google Scholar] [CrossRef]
- Kayabekir, M.; Yağanoğlu, M. The relationship between snoring sounds and EEG signals on polysomnography. Sleep Breath. 2022, 26, 1219–1226. [Google Scholar] [CrossRef]
- Di Mauro, P.; Cocuzza, S.; Maniaci, A.; Ferlito, S.; Rasà, D.; Anzivino, R.; Vicini, C.; Iannella, G.; La Mantia, I. The Effect of Adenotonsillectomy on Children’s Behavior and Cognitive Performance with Obstructive Sleep Apnea Syndrome: State of the Art. Children 2021, 8, 921. [Google Scholar] [CrossRef]
- Ren, R.; Covassin, N.; Zhang, Y.; Lei, F.; Yang, L.; Zhou, J.; Tan, L.; Li, T.; Li, Y.; Shi, J.; et al. Interaction between Slow Wave Sleep and Obstructive Sleep Apnea in Prevalent Hypertension. Hypertension 2020, 75, 516–523. [Google Scholar] [CrossRef]
- Zhang, J.; Zhuang, Y.; Wan, N.; Tang, X.; Zhou, W.; Si, L.; Wang, Y.; Chen, B.; Cao, J. Slow-Wave Sleep Is Associated with Incident Hypertension in Patients with Obstructive Sleep Apnea: A Cross-Sectional Study. J. Int. Med. Res. 2020, 48, 030006052095468. [Google Scholar] [CrossRef] [PubMed]
- Hamilton, G.S.; Meredith, I.T.; Walker, A.M.; Solin, P. Obstructive Sleep Apnea Leads to Transient Uncoupling of Coronary Blood Flow and Myocardial Work in Humans. Sleep 2009, 32, 263–270. [Google Scholar] [CrossRef] [PubMed]
- Hamilton, G.S.; Solin, P.; Walker, A. Coronary Blood Flow Becomes Uncoupled from Myocardial Work during Obstructive Sleep Apnea in the Presence of Endothelial Dysfunction. Sleep 2008, 31, 809–816. [Google Scholar] [CrossRef]
- Gać, P.; Urbanik, D.; Macek, P.; Martynowicz, H.; Mazur, G.; Poręba, R. Coexistence of cardiovascular risk factors and obstructive sleep apnoea in polysomnography. Respir. Physiol. Neurobiol. 2022, 295, 103782. [Google Scholar] [CrossRef] [PubMed]
- Dudenbostel, T.; Calhoun, D.A. Resistant Hypertension, Obstructive Sleep Apnoea and Aldosterone. J. Hum. Hypertens. 2012, 26, 281–287. [Google Scholar] [CrossRef]
- Ahmad, M.; Makati, D.; Akbar, S. Review of and Updates on Hypertension in Obstructive Sleep Apnea. Int. J. Hypertens. 2017, 2017, 1848375. [Google Scholar] [CrossRef] [PubMed]
- Jin, Z.N.; Wei, Y.X. Meta-analysis of effects of obstructive sleep apnea on the renin-angiotensin-aldosterone system. J. Geriatr. Cardiol. 2016, 13, 333–343. [Google Scholar] [CrossRef]
- Stavaras, C.; Pastaka, C.; Papala, M.; Gravas, S.; Tzortzis, V.; Melekos, M.; Seitanidis, G.; Gourgoulianis, K.I. Sexual function in pre- and post-menopausal women with obstructive sleep apnea syndrome. Int. J. Impot. Res. 2012, 24, 228–233. [Google Scholar] [CrossRef]
- Milicic Stanic, B.; Ilincic, B.; Zeravica, R.; Milicic Ivanovski, D.; Cabarkapa, V.; Mijovic, R. The Importance of Correlation between Aldosterone and Parathyroid Hormone in Patients with Primary Hyperparathyroidism. Int. J. Endocrinol. 2022, 2022, 3804899. [Google Scholar] [CrossRef]
- Basoglu, O.K.; Tasbakan, M.S.; Kayikcioglu, M. Dyslipidemia prevalence in non-obese non-diabetic patients with obstructive sleep apnea: Does sex matter? J. Clin. Sleep Med. 2023. [Google Scholar] [CrossRef]
- Muraki, I.; Wada, H.; Tanigawa, T. Sleep Apnea and Type 2 Diabetes. J. Diabetes Investig. 2018, 9, 991–997. [Google Scholar] [CrossRef]
- Kendzerska, T.; Gershon, A.S.; Hawker, G.; Tomlinson, G.; Leung, R.S. Obstructive Sleep Apnea and Incident Diabetes. A Historical Cohort Study. Am. J. Respir. Crit. Care Med. 2014, 190, 218–225. [Google Scholar] [CrossRef] [PubMed]
- Appleton, S.L.; Vakulin, A.; McEvoy, R.D.; Wittert, G.A.; Martin, S.A.; Grant, J.F.; Taylor, A.W.; Antic, N.A.; Catcheside, P.G.; Adams, R.J. Nocturnal Hypoxemia and Severe Obstructive Sleep Apnea are Associated with Incident Type 2 Diabetes in a Population Cohort of Men. J. Clin. Sleep Med. 2015, 11, 609–614. [Google Scholar] [CrossRef] [PubMed]
- Yang, W.; Cai, X.; Hu, J.; Wen, W.; Mulalibieke, H.; Yao, X.; Yao, L.; Zhu, Q.; Hong, J.; Luo, Q.; et al. The Metabolic Score for Insulin Resistance (METS-IR) Predicts Cardiovascular Disease and Its Subtypes in Patients with Hypertension and Obstructive Sleep Apnea. Clin. Epidemiol 2023, 15, 177–189. [Google Scholar] [CrossRef]
- Ormazabal, V.; Nair, S.; Elfeky, O.; Aguayo, C.; Salomon, C.; Zuñiga, F.A. Association between Insulin Resistance and the Development of Cardiovascular Disease. Cardiovasc. Diabetol. 2018, 17, 122. [Google Scholar] [CrossRef]
- Savage, D.B.; Petersen, K.F.; Shulman, G.I. Disordered Lipid Metabolism and the Pathogenesis of Insulin Resistance. Physiol. Rev. 2007, 87, 507–520. [Google Scholar] [CrossRef] [PubMed]
- Marin, J.M.; Carrizo, S.J.; Vicente, E.; Agusti, A.G. Long-Term Cardiovascular Outcomes in Men with Obstructive Sleep Apnoea-Hypopnoea with or without Treatment with Continuous Positive Airway Pressure: An Observational Study. Lancet 2005, 365, 1046–1053. [Google Scholar] [CrossRef]
- Yan, X.; Wang, L.; Liang, C.; Zhang, H.; Zhao, Y.; Zhang, H.; Yu, H.; Di, J. Development and assessment of a risk prediction model for moderate-to-severe obstructive sleep apnea. Front. Neurosci. 2022, 16, 936946. [Google Scholar] [CrossRef]
- Ye, P.; Qin, H.; Zhan, X.; Wang, Z.; Liu, C.; Song, B.; Kong, Y.; Jia, X.; Qi, Y.; Ji, J.; et al. Diagnosis of Obstructive Sleep Apnea in Children Based on the XGBoost Algorithm Using Nocturnal Heart Rate and Blood Oxygen Feature. Am. J. Otolaryngol. 2023, 44, 103714. [Google Scholar] [CrossRef]
- Maniaci, A.; Riela, P.M.; Iannella, G.; Lechien, J.R.; La Mantia, I.; De Vincentiis, M.; Cammaroto, G.; Calvo-Henriquez, C.; Di Luca, M.; Chiesa Estomba, C.; et al. Machine Learning Identification of Obstructive Sleep Apnea Severity through the Patient Clinical Features: A Retrospective Study. Life 2023, 13, 702. [Google Scholar] [CrossRef] [PubMed]
- Xie, C.; Zhu, R.; Tian, Y.; Wang, K. Association of obstructive sleep apnoea with the risk of vascular outcomes and all-cause mortality: A meta-analysis. BMJ Open 2017, 7, e013983. [Google Scholar] [CrossRef]
- Jonas, D.E.; Amick, H.R.; Feltner, C.; Weber, R.P.; Arvanitis, M.; Stine, A.; Lux, L.; Middleton, J.C.; Voisin, C.; Harris, R.P. Screening for Obstructive Sleep Apnea in Adults: An Evidence Review for the U.S. Preventive Services Task Force; Rockville (MD), Agency for Healthcare Research and Quality (US): Rockville, MD, USA, 2017. [Google Scholar]
- Ruel, G.; Martin, S.A.; Lévesque, J.-F.; Wittert, G.A.; Adams, R.J.; Appleton, S.L.; Shi, Z.; Taylor, A.W. Association between Multimorbidity and Undiagnosed Obstructive Sleep Apnea Severity and Their Impact on Quality of Life in Men over 40 Years Old. Glob. Health Epidemiol. Genom. 2018, 3, e10. [Google Scholar] [CrossRef]
- Chiang, C.L.; Chen, Y.T.; Wang, K.L.; Su, V.Y.; Wu, L.A.; Perng, D.W.; Chang, S.C.; Chen, Y.M.; Chen, T.J.; Chou, K.T. Comorbidities and risk of mortality in patients with sleep apnea. Ann. Med. 2017, 49, 377–383. [Google Scholar] [CrossRef] [PubMed]
- Archontogeorgis, K.; Voulgaris, A.; Nena, E.; Strempela, M.; Karailidou, P.; Tzouvelekis, A.; Mouemin, T.; Xanthoudaki, M.; Steiropoulos, S.; Froudarakis, M.E.; et al. Cardiovascular Risk Assessment in a Cohort of Newly Diagnosed Patients with Obstructive Sleep Apnea Syndrome. Cardiol. Res. Pract. 2018, 2018, 6572785. [Google Scholar] [CrossRef] [PubMed]
- Chuang, H.-H.; Huang, C.-G.; Chuang, L.-P.; Huang, Y.-S.; Chen, N.-H.; Li, H.-Y.; Fang, T.-J.; Hsu, J.-F.; Lai, H.-C.; Chen, J.-Y.; et al. Relationships Among and Predictive Values of Obesity, Inflammation Markers, and Disease Severity in Pediatric Patients with Obstructive Sleep Apnea Before and After Adenotonsillectomy. J. Clin. Med. 2020, 9, 579. [Google Scholar] [CrossRef] [PubMed]


| Variables | Controls (n = 41) | Mild OSAS (n = 33) | Moderate OSAS (n = 33) | Severe OSAS (n = 31) | Total of the Study Population (n = 138) | p-Value |
|---|---|---|---|---|---|---|
| Gender n (%) | 0.004 | |||||
| Males | 20 (48.8) | 17 (51.5) | 22 (66.7) | 27 (87.1) | 86 (62.3) * | |
| Females | 21 (51.2) | 16 (48.5) | 11 (33.3) | 4 (12.9) | 52 (37.7) | |
| Age (years) | 37.88 ± 14.31 | 53.39 ± 15.01.1 | 54.82 ± 11.95 1 | 53.97 ± 11.52 1 | 49.25 ± 15.17 | <0.001 |
| Mallampati | <0.001 | |||||
| -1 | 24 (58.5) | 6 (18.2) | 3 (9.1) | 1 (3.2) | 34 (24.6) | |
| -2 | 9 (22.0) | 10 (30.3) | 11 (33.3) | 5 (16.1) | 35 (25.4) | |
| -3 | 8 (19.5) | 9 (27.3) | 10 (30.3) | 15 (48.4) | 42 (30.4) | |
| -4 | 0 (0) | 8 (24.2) | 9 (27.3) | 10 (32.3) | 27 (19.6) | |
| BMI num | 24.25 ± 2.98 | 26.18 ± 2.96 1,2 | 27.45 ± 2.60 1 | 28.10 ± 1.99 1 | 26.34 ± 3.06 | <0.001 |
| BMI cat n (%) | <0.001 | |||||
| BMI 18–25 | 27 (65.9) | 11 (33.3) | 7 (21.2) | 3 (9.7) | 48 (34.8) | |
| BMI 25–30 | 14 (34.1) | 22 (66.7) | 26 (78.8) | 28 (90.3) | 90 (65.2) | |
| Neck circumference (cm) | 35.78 ± 10.44 | 35.06 ± 3.29 2 | 36.91 ± 4.00 | 39.34 ± 3.24 | 36.68 ± 6.55 | 0.045 |
| WHR | 81.59 ± 9.44 | 91.30 ± 9.43 1,2 | 96.27 ± 11.87 1 | 101.90 ± 8.60 1 | 91.99 ± 12.45 | <0.001 |
| Systolic pressure | 115.12 ± 9.78 | 118.94 ± 13.96 | 121.67 ± 15.39 | 121.94 ± 12.82 | 119.13 ± 13.15 | 0.090 |
| Diastolic pressure | 71.34 ± 7.83 | 76.21 ± 9.27 | 77.27 ± 11.26 1 | 77.42 ± 9.74 1 | 75.29 ± 9.76 | 0.018 |
| Variables | Controls (n = 41) | Mild OSAS (n = 33) | Moderate OSAS (n = 33) | Severe OSAS (n = 31) | p-Value |
|---|---|---|---|---|---|
| Total sleep time (min) | 386.18 ± 70.86 | 287.43 ± 46.08 | 387.76 ± 51.49 | 379.06 ± 51.77 | 0.921 |
| Sleep efficiency (%) | 81.07 ± 13.27 | 85.13 ± 9.17 | 84.72 ± 7.37 | 81.24 ± 9.89 | 0.209 |
| Latency to sleep | 45.14 ± 49.27 | 26.26 ± 18.83 | 31.50 ± 31.62 | 41.23 ± 41.24 | 0.137 |
| REM (%) | 22.64 ± 7.83 | 22.79 ± 7.73 | 23.66 ± 6.20 | 21.10 ± 7.41 | 0.574 |
| NREM (%) | 77.36 ± 7.83 | 76.76 ± 7.96 | 76.34 ± 6.21 | 78.92 ± 7.39 | 0.530 |
| Slow wave sleep (%) Median (25th–75th perc) | 17.1 (8.9–26.9) | 12.6 (6.95–16.29) 1,2 | 9.9 (7.15–14.15) 1 | 4.6 (0–12.1) 1 | <0.001 |
| AHI (events/h) | 2.7 (1.8–4) | 9 (7–11.75) 1,2 | 22 (19.1–25.35) 1,2 | 46.3 (34.2–71.9) 1 | <0.001 |
| AHI REM (events/h) | 4.7 (2.7–7.1) | 17 (8.6–23.2) 1,2 | 28.7 (19.45–41.20) 1,2 | 54.3 (47.1–66.3) 1 | <0.001 |
| AHI NREM (events/h) | 2.1 (0.92–3.4) | 6.5 (4.52–8.2) 2 | 19.6 (15.17–25) 1,2 | 49.6 (39–83.6) 1 | <0.001 |
| Arousals index | 7.1 (3.55–10.6) 2,3 | 10.4 (6.1–15.55) 2,3 | 22.6 (15.35–26.2) 2 | 37.7 (28.3–70.4) 3 | <0.001 |
| SpO2 min. (%) | 91.32 ± 2.94 2,3 | 87.61 ± 3.53 2,3 | 82.97 ± 5.65 2 | 76.35 ± 10.83 3 | <0.001 |
| SpO2 ave. (%) | 95.50 ± 1.51 2,3 | 94.19 ± 1.80 2 | 93.20 ± 2.10 2 | 89.85 ± 5.09 | <0.001 |
| ODI (events/h) | 2.13 ± 1.70 2,3 | 7.73 ± 4.84 2,3 | 19.96 ± 7.97 2 | 50.74 ± 24.56 3 | <0.001 |
| ESS | 6 (3–9) | 10 (6–16) 1 | 9 (6–12) 1 | 9 (7–14) 1 | 0.008 |
| Stop Bang | 2 (1–4) | 4 (3–5) 1,2 | 4 (3–5) 1,2 | 5 (4–6) 1 | <0.001 |
| Variables | Controls (n = 41) | Mild OSAS (n = 33) | Moderate OSAS (n = 33) | Severe OSAS (n = 31) | p-Value |
|---|---|---|---|---|---|
| pO2 (kPa) | 11.75 ± 0.89 | 11.39 ± 1.35 | 11.17 ± 1.21 | 10.95 ± 1.18 1 | 0.026 |
| pCO2 (kPa) | 5.05 ± 0.38 | 5.06 ± 0.40 | 4.98 ± 0.36 | 4.86 ± 0.47 | 0.136 |
| pH value | 7.40 ± 0.03 | 7.40 ± 0.02 | 7.41 ± 0.03 1 | 7.41 ± 0.02 | 0.033 |
| SpO2 (%) | 96.73 ± 0.63 | 96.40 ± 1.12 | 96.15 ± 1.15 | 96.11 ± 0.99 1 | 0.027 |
| HCO3 (mmol/L) | 23.35 ± 1.75 | 23.57 ± 1.55 | 24.05 ± 1.81 | 23.29 ± 1.26 | 0.212 |
| Cholesterol (mmol/L) | 4.91 ± 1.05 | 5.15 ± 0.90 | 5.08 ± 1.00 | 5.29 ± 0.93 | 0.424 |
| HDL-C (mmol/L) | 1.55 ± 0.32 2 | 1.46 ± 0.35 2 | 1.37 ± 0.39 | 1.22 ± 0.33 | 0.001 |
| Triglycerides (mmol/L), (median, 25th–75th perc) | 1.0 (0.8–1.2) | 1.46 (1.06–1.73) 2 | 1.58 (1.06–2.07) 1 | 1.99 (1.24–2.88) 1 | <0.001 |
| LDL-C (mmol/L) | 2.89 ± 0.94 | 3.01 ± 0.79 | 2.84 ± 1.10 | 3.01 ± 1.07 | 0.849 |
| VLDL (mmol/L) | 0.03 ± 0.12 | 0.24 ± 0.36 | 0.46 ± 0.92 1 | 0.36 ± 0.47 | 0.005 |
| Glucose (mmol/L) | 5.3 (5.1–5.4) | 5.5 (5.1–5.95) 2 | 5.8 (5.4–6.2) 1 | 5.7 (5.4–6.5) 1 | <0.001 |
| Insulin (mIU/L) | 7.46 ± 3.28 | 8.01 ± 3.64 2 | 10.00 ± 5.78 | 11.12 ± 5.82 1 | 0.004 |
| HOMA index | 1.07 ± 0.49 | 1.19 ± 0.55 2 | 1.50 ± 0.87 | 1.67 ± 0.91 1 | 0.002 |
| Variables | Controls (n = 41) | Mild OSAS (n = 33) | Moderate OSAS (n = 33) | Severe OSAS (n = 31) | Total of the OSAS Patients | Total of the Study Population | p-Value |
|---|---|---|---|---|---|---|---|
| Hypertension | 5 (12.2; 3.6) * | 19 (57.6; 13.8) | 17 (51.5; 12.3) | 20 (64.5; 14.5) | 56 (40.6) | 61 (44.2) | <0.001 |
| Heart failure | 0 (0.0; 0.0) | 0 (0.0; 0.0) | 3 (9.1; 2.2) | 0 (0.0; 0.0) | 3 (2.2) | 3 (2.2) | 0.036 |
| Coronary disease | 0 (0.0; 0.0) | 1 (3.0; 0.7) | 1 (3.0; 0.7) | 1 (3.2; 0.7) | 3 (2.2) | 3 (2.2) | 0.700 |
| History of myocardial infarction | 1 (2.4. 0.7) | 1 (3.0; 0.7) | 1 (3.0. 0.7) | 1 (3.2; 0.7) | 3 (2.2) | 4 (2.9) | 1.000 |
| Diabetes mellitus | 0 (0.0; 0.0) | 1 (3.0; 0.7) | 4 (12.1; 2.9) | 5 (16.1; 3.6) | 10 (7.2) | 10 (7.2) | 0.015 |
| Hyperlipidemia | 13 (31.7; 9.4) | 20 (60.6; 14.5) | 28 (84.8; 20.3) | 26 (83.9; 18.8) | 74 (53.6) | 87 (63.0) | <0.001 |
| Hypothyroidism | 2 (4.9; 1.4) | 2 (6.1; 1.4) | 1 (3.0; 0.7) | 1 (3.2; 0.7) | 4 (2.9) | 6 (4.3) | 1.000 |
| Asthma | 6 (14.6; 4.3) | 8 (24.2; 5.8) | 2 (6.1; 1.4) | 5 (16.1; 3.6) | 15 (10.9) | 21 (15.2) | 0.239 |
| GERD | 5 (12.2; 3.6) | 8 (24.2; 5.8) | 8 (24.2; 5.8) | 5 (16.1; 3.6) | 21 (15.2) | 26 (18.8) | 0.478 |
| COPD | 2 (4.9; 1.4) | 2 (6.1; 1.4) | 1 (3.0; 0.7) | 1 (3.2; 0.7) | 4 (2.9) | 6 (4.3) | 1.000 |
| Allergic rhinitis | 13 (31.7; 9.4) | 9 (27.3; 6.5) | 5 (15.2; 3.6) | 7 (22.6; 5.1) | 21 (15.2) | 34 (24.6) | 0.414 |
| Deviation of the nasal septum | 8 (19.5; 5.8) | 9 (27.3; 6.5) | 7 (21.2; 5.1) | 13 (41.9; 9.4) | 29 (21.0) | 37 (26.8) | 0.156 |
| Smoking, n (%) | 11 (26.8; 8.0) | 9 (27.3; 6.5) | 10 (30.3; 7.2) | 10 (32.3; 7.2) | 29 (21.0) | 40 (29.0) | 0.390 |
| Snoring | <0.001 | ||||||
| -mild | 39 (95.1; 28.3) | 15 (45.5; 10.9) | 6 (18.2; 4.3) | 4 (12.9; 2.9) | 25 (18.1) | 64 (46.4) | |
| -moderate | 2 (4.9; 1.4) | 12 (36.4; 8.7) | 15 (45.5; 10.9) | 15 (48.4; 10.9) | 42 (30.4) | 44 (31.9) | |
| -loud | 0 (0.0; 0.0) | 6 (18.2; 4.3) | 12 (36.4; 8.7) | 12 (38.7; 8.7) | 30 (21.7) | 30 (21.7) |
| Variable | Controls (n = 36) | Mild OSAS (n = 24) | Moderate OSAS (n = 22) | Severe OSAS (n = 24) | p-Value |
|---|---|---|---|---|---|
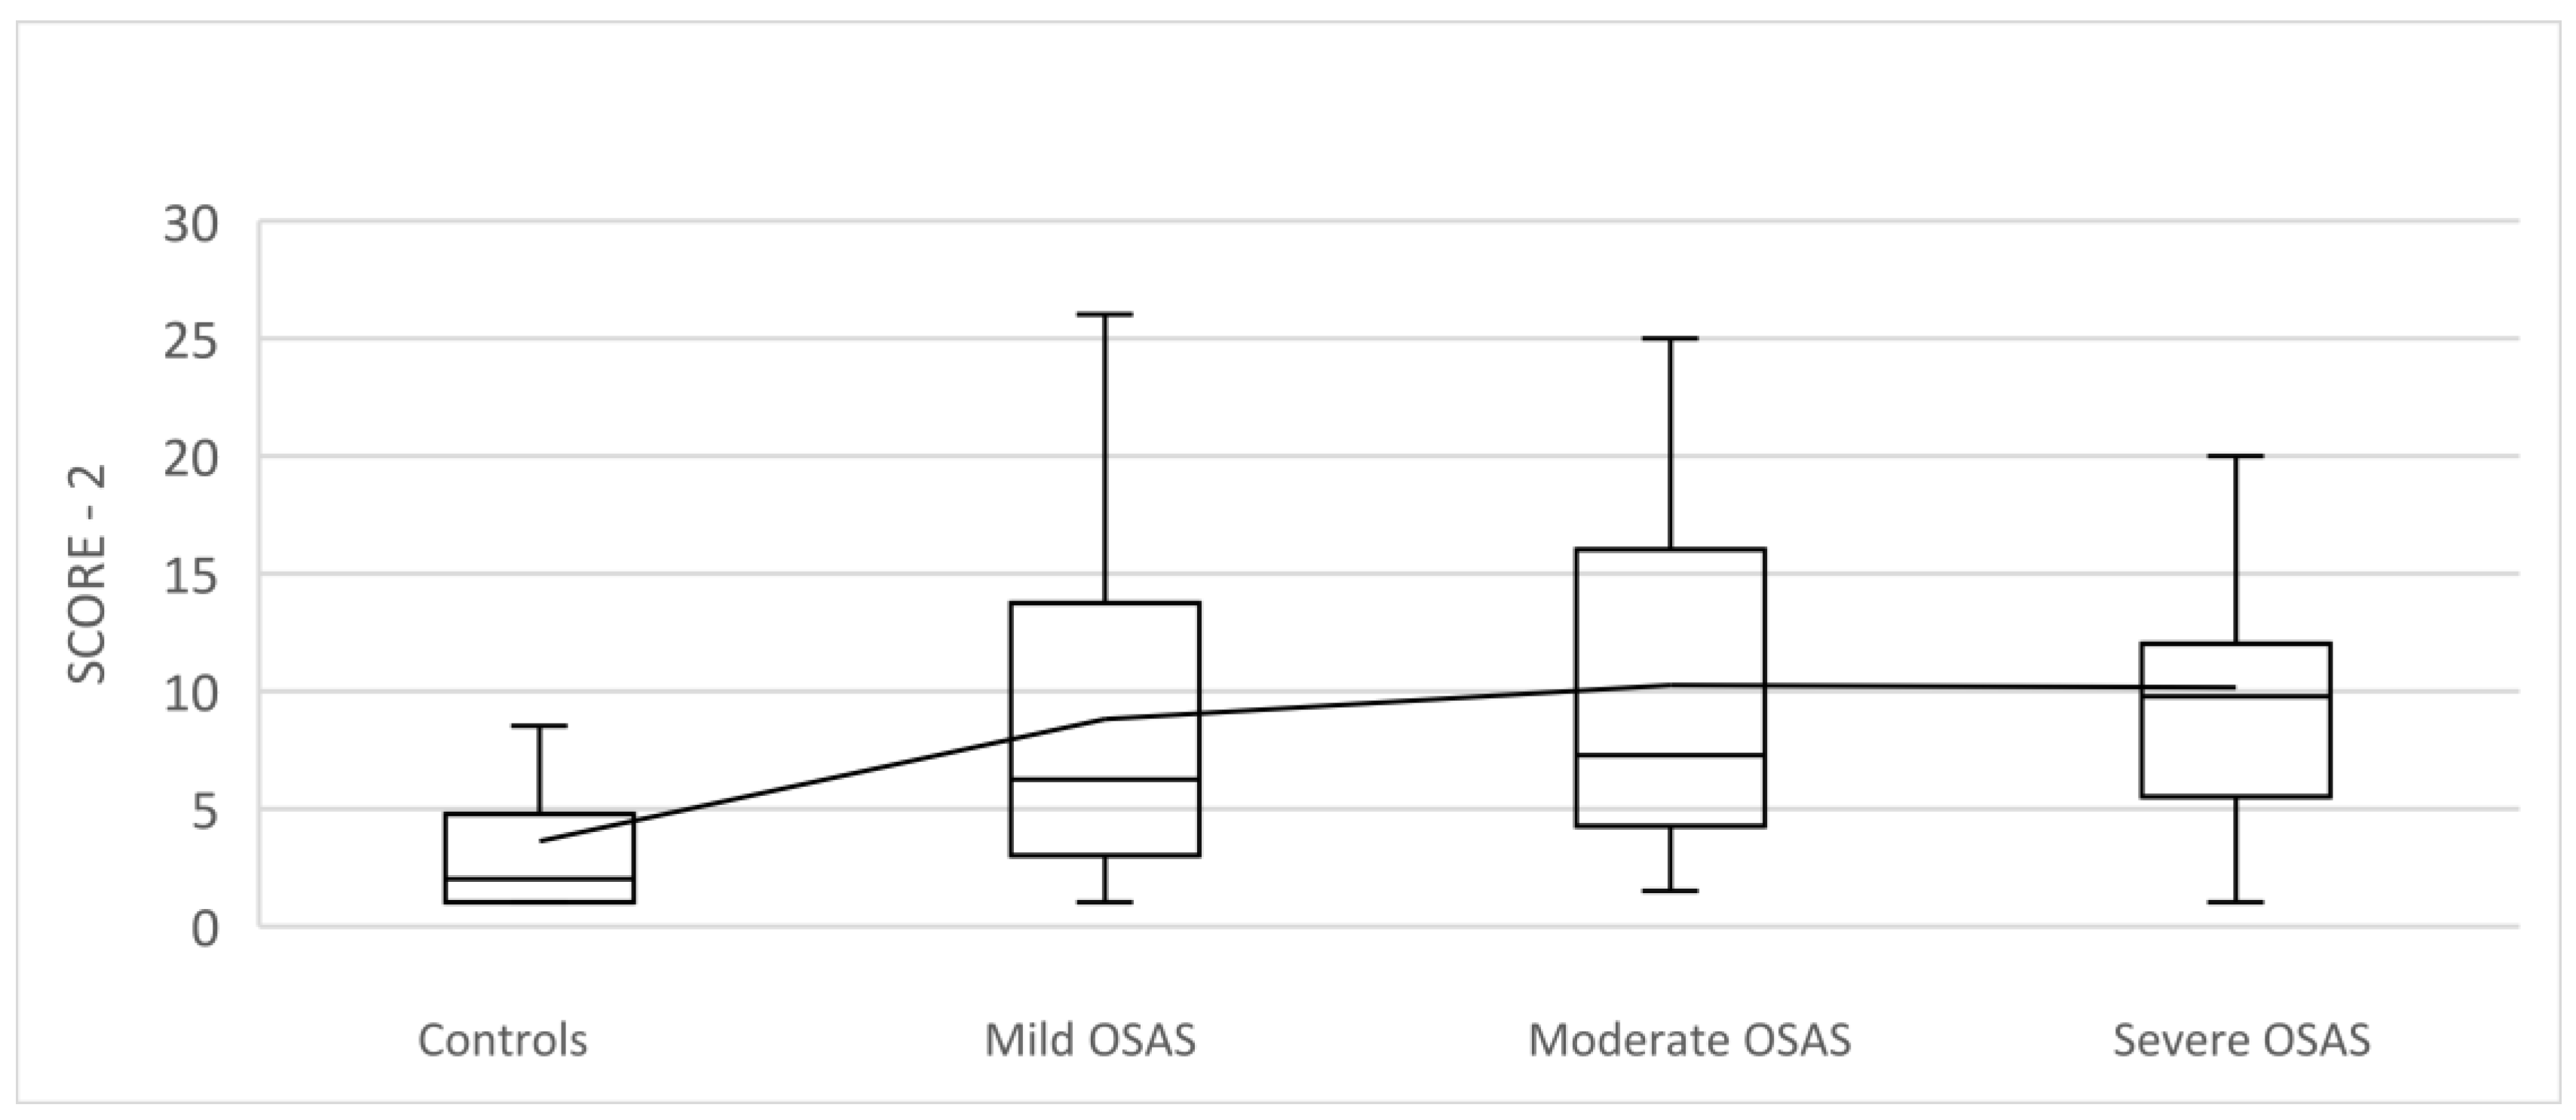
| SCORE-2 CV risk Median (25th–75th perc) | 2 (1–4.75) | 6.25 (3–13.75) 1 | 7.25 (4.25–16) 1 | 9.75 (5.5–12) 1 | <0.001 |
| Variables | Controls (n = 41) | Total of the OSAS Patients (n = 97) | p-Value |
|---|---|---|---|
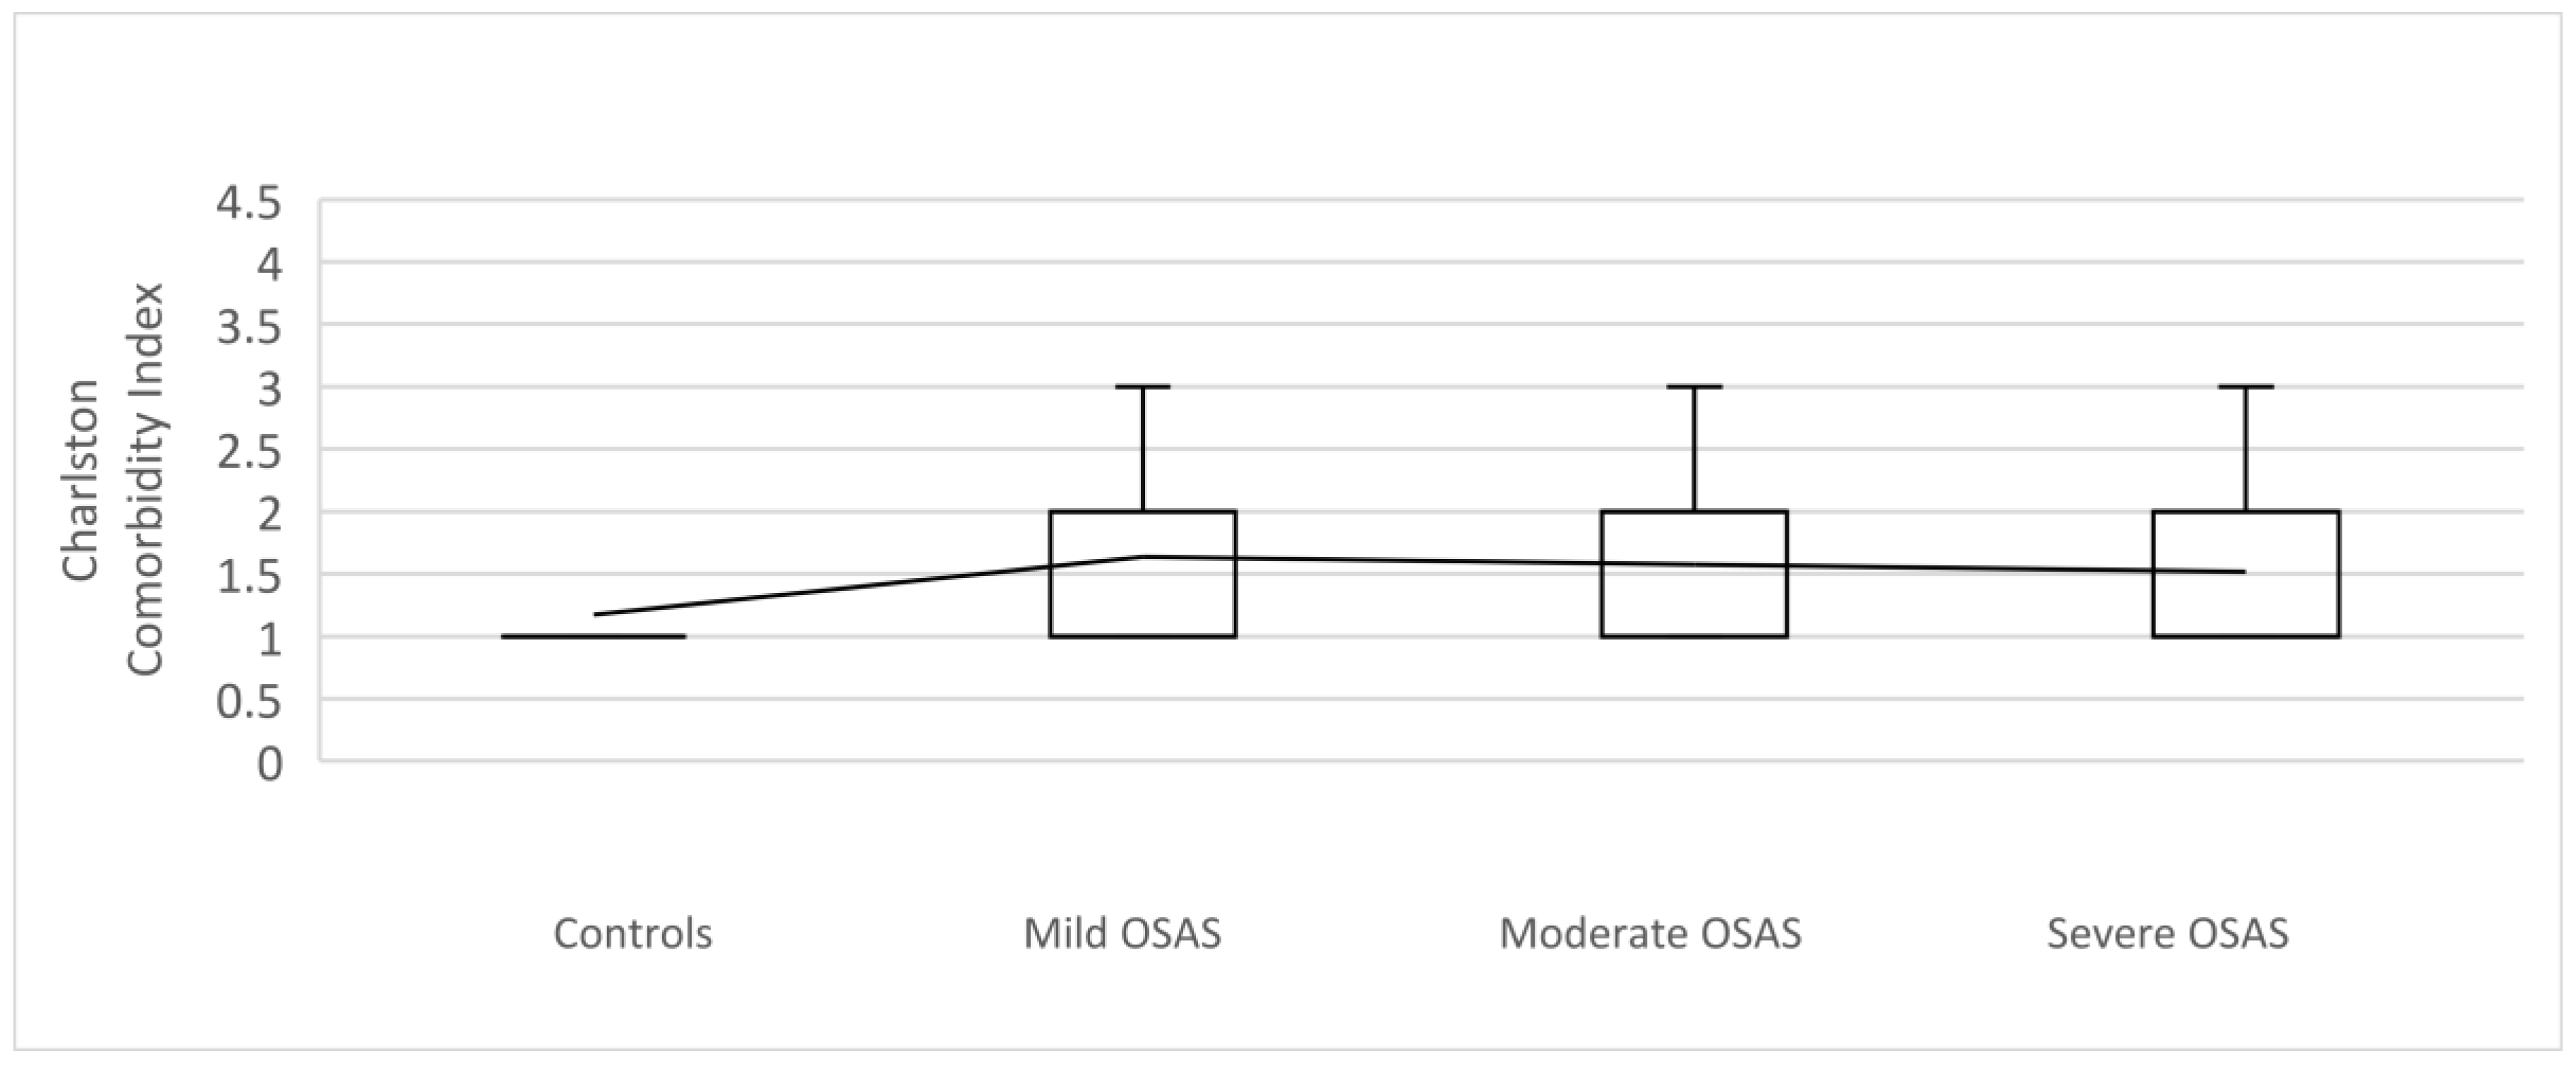
| Charlson Index n (%) | 0.001 | ||
| 0–1 | 35 (85.4; 25.4) * | 50 (51.5; 36.2) | |
| 2–3 | 5 (12.2; 3.6) | 38 (39.2; 27.5) | |
| ≥4 | 1 (2.4; 0.7) | 9 (9.3; 6.5) | |
| CCI 10-year survival Median (25th–75th perc) | 98 (96–98) | 96 (90–98) | <0.001 |
| SCORE2 | Charlson Comorbidity Index | |||
|---|---|---|---|---|
| Variable | r | p | r | p |
| Gender | 0.208 * | 0.033 | 0.197 * | 0.021 |
| Age | 0.817 ** | 0.000 | 0.751 ** | 0.000 |
| ESS | 0.182 | 0.061 | 0.171 * | 0.045 |
| Stop Bang | 0.470 ** | 0.000 | 0.410 ** | 0.000 |
| Mallampati | 0.363 ** | 0.000 | 0.257 ** | 0.002 |
| BMI | 0.284 ** | 0.003 | 0.133 | 0.119 |
| Waist circumference | 0.280 ** | 0.004 | 0.164 | 0.055 |
| snoring | 0.378 ** | 0.000 | 0.140 | 0.102 |
| Slow wave sleep | −0.258 ** | 0.008 | −0.186 * | 0.029 |
| AHI | 0.232 * | 0.017 | 0.039 | 0.650 |
| AHI REM | 0.328 ** | 0.001 | 0.181 * | 0.034 |
| AHI NREM | 0.207 * | 0.033 | 0.013 | 0.881 |
| SpO2 min | −0.247 * | 0.011 | −0.069 | 0.423 |
| SpO2 mean | −0.249 * | 0.010 | −0.064 | 0.458 |
| ODI | 0.235 * | 0.015 | 0.040 | 0.645 |
| Heart rate min | 0.212 * | 0.029 | 0.223 * | 0.009 |
| Heart rate max | −0.199 * | 0.041 | −0.248 | 0.003 |
| pO2 | −0.282 ** | 0.003 | −0.361 * | 0.000 |
| pCO2 | −0.242 * | 0.013 | −0.076 | 0.376 |
| pH value | 0.316 ** | 0.001 | 0.279 ** | 0.001 |
| SpO2 | −0.212 * | 0.029 | −0.342** | 0.000 |
| Mild OSAS | Moderate OSAS | Severe OSAS | |||||||
|---|---|---|---|---|---|---|---|---|---|
| Variables | B | SE | p | B | SE | p | B (SE) | SE | p |
| Gender | −1.639 | 1.150 | 0.154 | −3.136 | 1.296 | 0.016 | −3.796 | 1.412 | 0.007 |
| Age | 0.076 | 0.048 | 0.115 | 0.105 | 0.054 | 0.048 | 0.104 | 0.058 | 0.071 |
| Epworth | 0.102 | 0.079 | 0.198 | 0.056 | 0.091 | 0.543 | 0.043 | 0.100 | 0.667 |
| Stop Bang | −0.106 | 0.387 | 0.784 | −0.165 | 0.433 | 0.703 | 0.614 | 0.481 | 0.202 |
| Mallampati | 0.944 | 0.474 | 0.046 | 0.969 | 0.520 | 0.062 | 1.667 | 0.556 | 0.003 |
| BMI | −0.046 | 0.143 | 0.746 | 0.130 | 0.177 | 0.462 | 0.094 | 0.195 | 0.629 |
| Hypertension | 0.993 | 0.983 | 0.312 | 0.020 | 1.162 | 0.986 | −0.266 | 1.212 | 0.826 |
| Snoring | 3.221 | 1.071 | 0.003 | 3.992 | 1.111 | 0.000 | 4.112 | 1.132 | 0.000 |
| pO2 | 0.474 | 0.416 | 0.254 | 0.491 | 0.446 | 0.272 | 0.627 | 0.477 | 0.188 |
| pH | −3.589 | 18.272 | 0.844 | 31.693 | 20.402 | 0.120 | 16.445 | 21.298 | 0.440 |
| HDL-C | −1.019 | 1.544 | 0.509 | −0.797 | 1.723 | 0.644 | −2.450 | 1.891 | 0.195 |
| Triglycerides | 0.803 | 1.072 | 0.454 | 1.161 | 1.088 | 0.286 | 0.583 | 1.102 | 0.596 |
| HOMA index | −0.106 | 0.761 | 0.889 | 0.309 | 0.839 | 0.713 | 0.696 | 0.857 | 0.417 |
| SCORE2 | −0.085 | 0.093 | 0.358 | 0.068 | 0.098 | 0.487 | −0.039 | 0.103 | 0.704 |
Disclaimer/Publisher’s Note: The statements, opinions and data contained in all publications are solely those of the individual author(s) and contributor(s) and not of MDPI and/or the editor(s). MDPI and/or the editor(s) disclaim responsibility for any injury to people or property resulting from any ideas, methods, instructions or products referred to in the content. |
© 2023 by the authors. Licensee MDPI, Basel, Switzerland. This article is an open access article distributed under the terms and conditions of the Creative Commons Attribution (CC BY) license (https://creativecommons.org/licenses/by/4.0/).
Share and Cite
Milicic Ivanovski, D.; Milicic Stanic, B.; Kopitovic, I. Comorbidity Profile and Predictors of Obstructive Sleep Apnea Severity and Mortality in Non-Obese Obstructive Sleep Apnea Patients. Medicina 2023, 59, 873. https://doi.org/10.3390/medicina59050873
Milicic Ivanovski D, Milicic Stanic B, Kopitovic I. Comorbidity Profile and Predictors of Obstructive Sleep Apnea Severity and Mortality in Non-Obese Obstructive Sleep Apnea Patients. Medicina. 2023; 59(5):873. https://doi.org/10.3390/medicina59050873
Chicago/Turabian StyleMilicic Ivanovski, Dragana, Branka Milicic Stanic, and Ivan Kopitovic. 2023. "Comorbidity Profile and Predictors of Obstructive Sleep Apnea Severity and Mortality in Non-Obese Obstructive Sleep Apnea Patients" Medicina 59, no. 5: 873. https://doi.org/10.3390/medicina59050873