
Robust Identification of Differential Gene Expression Patterns from Multiple Transcriptomics Datasets for Early Diagnosis, Prognosis, and Therapies for Breast Cancer

 , , , ,
Abstract
:
1. Introduction
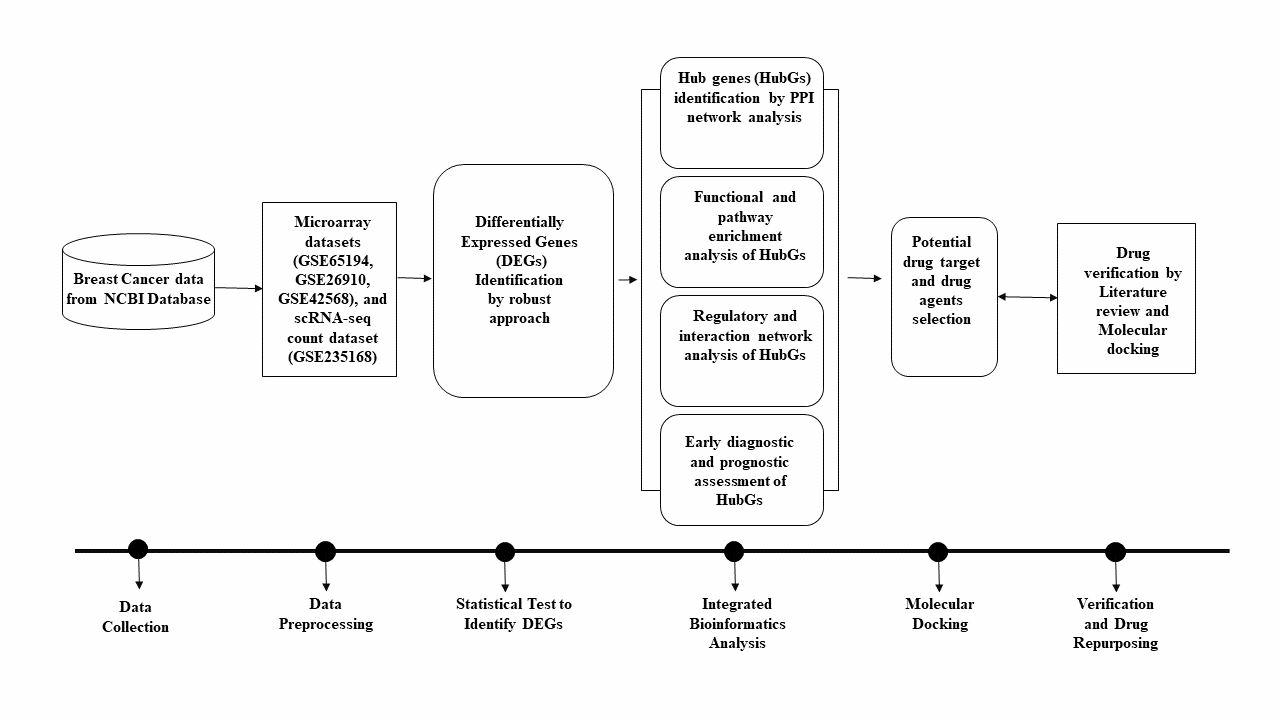
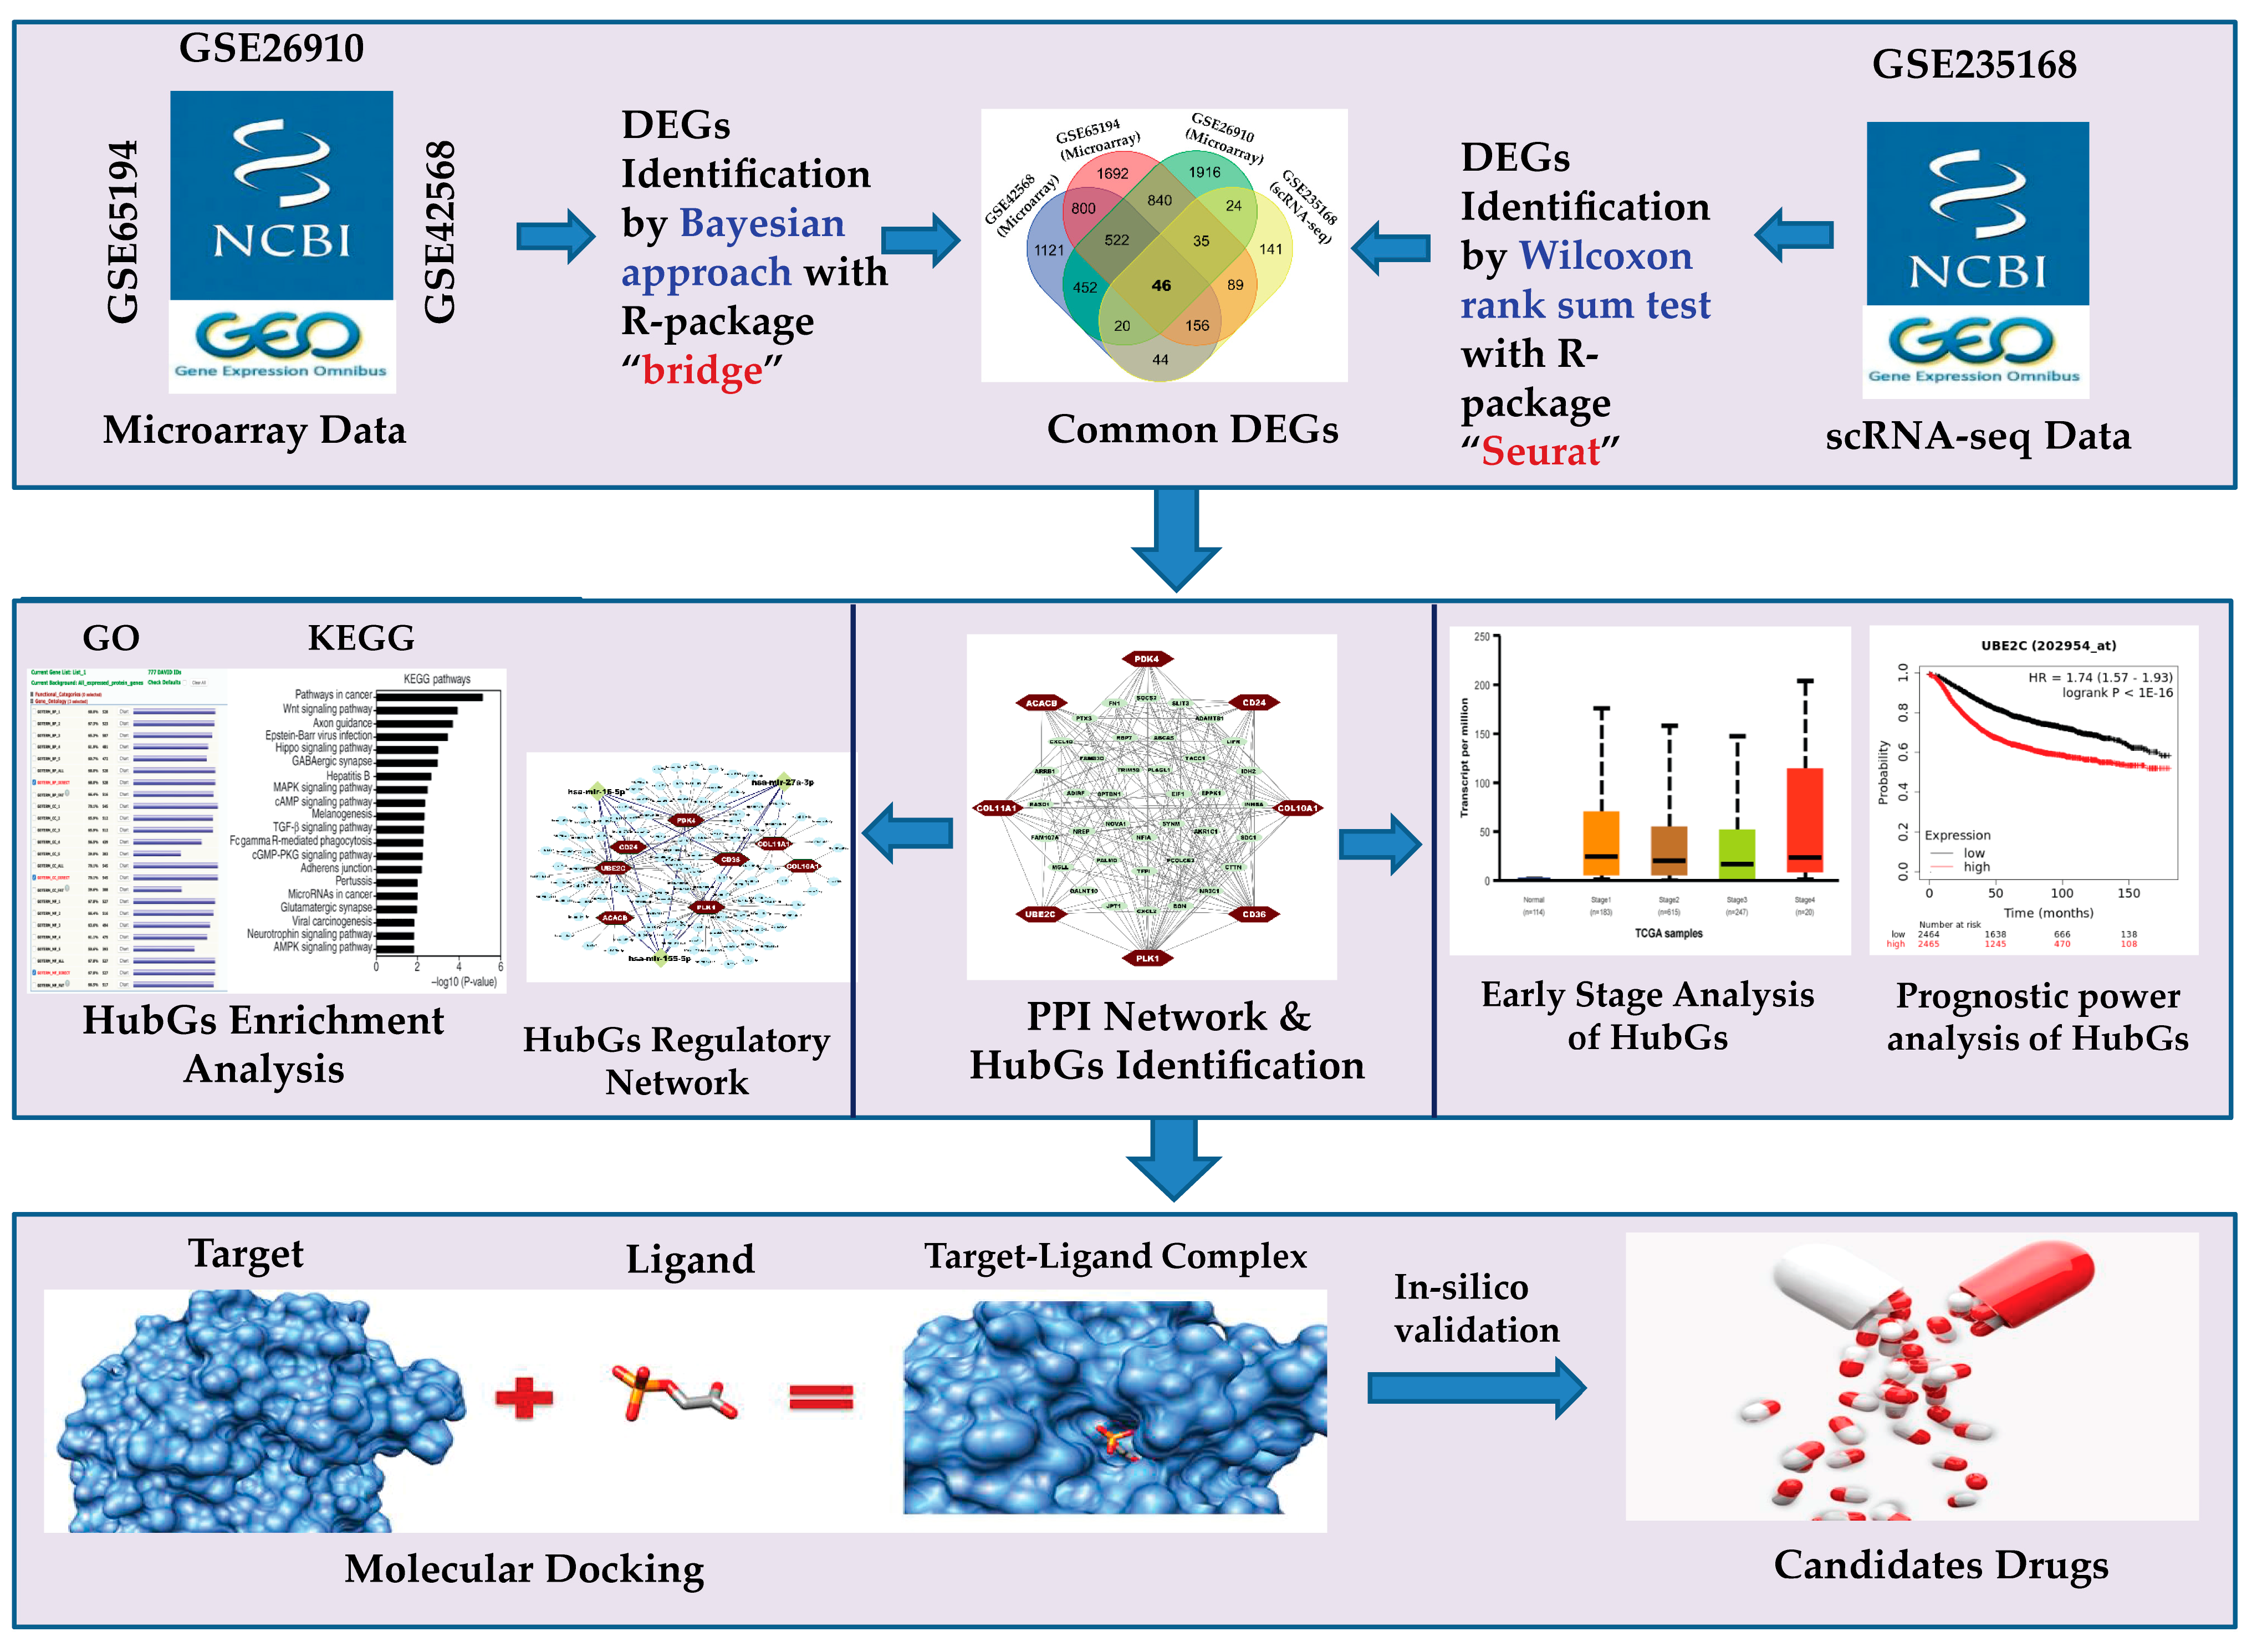
2. Materials and Methods
2.1. Data Collection
2.1.1. Microarray Data Collection
2.1.2. The scRNA-seq Count Data Collection and Pre-Processing
2.1.3. Collection of Meta-Drug Agents
2.2. Identification of DEGs from Microarray Data
2.3. Identification of DEGs from scRNA-seq Count Data
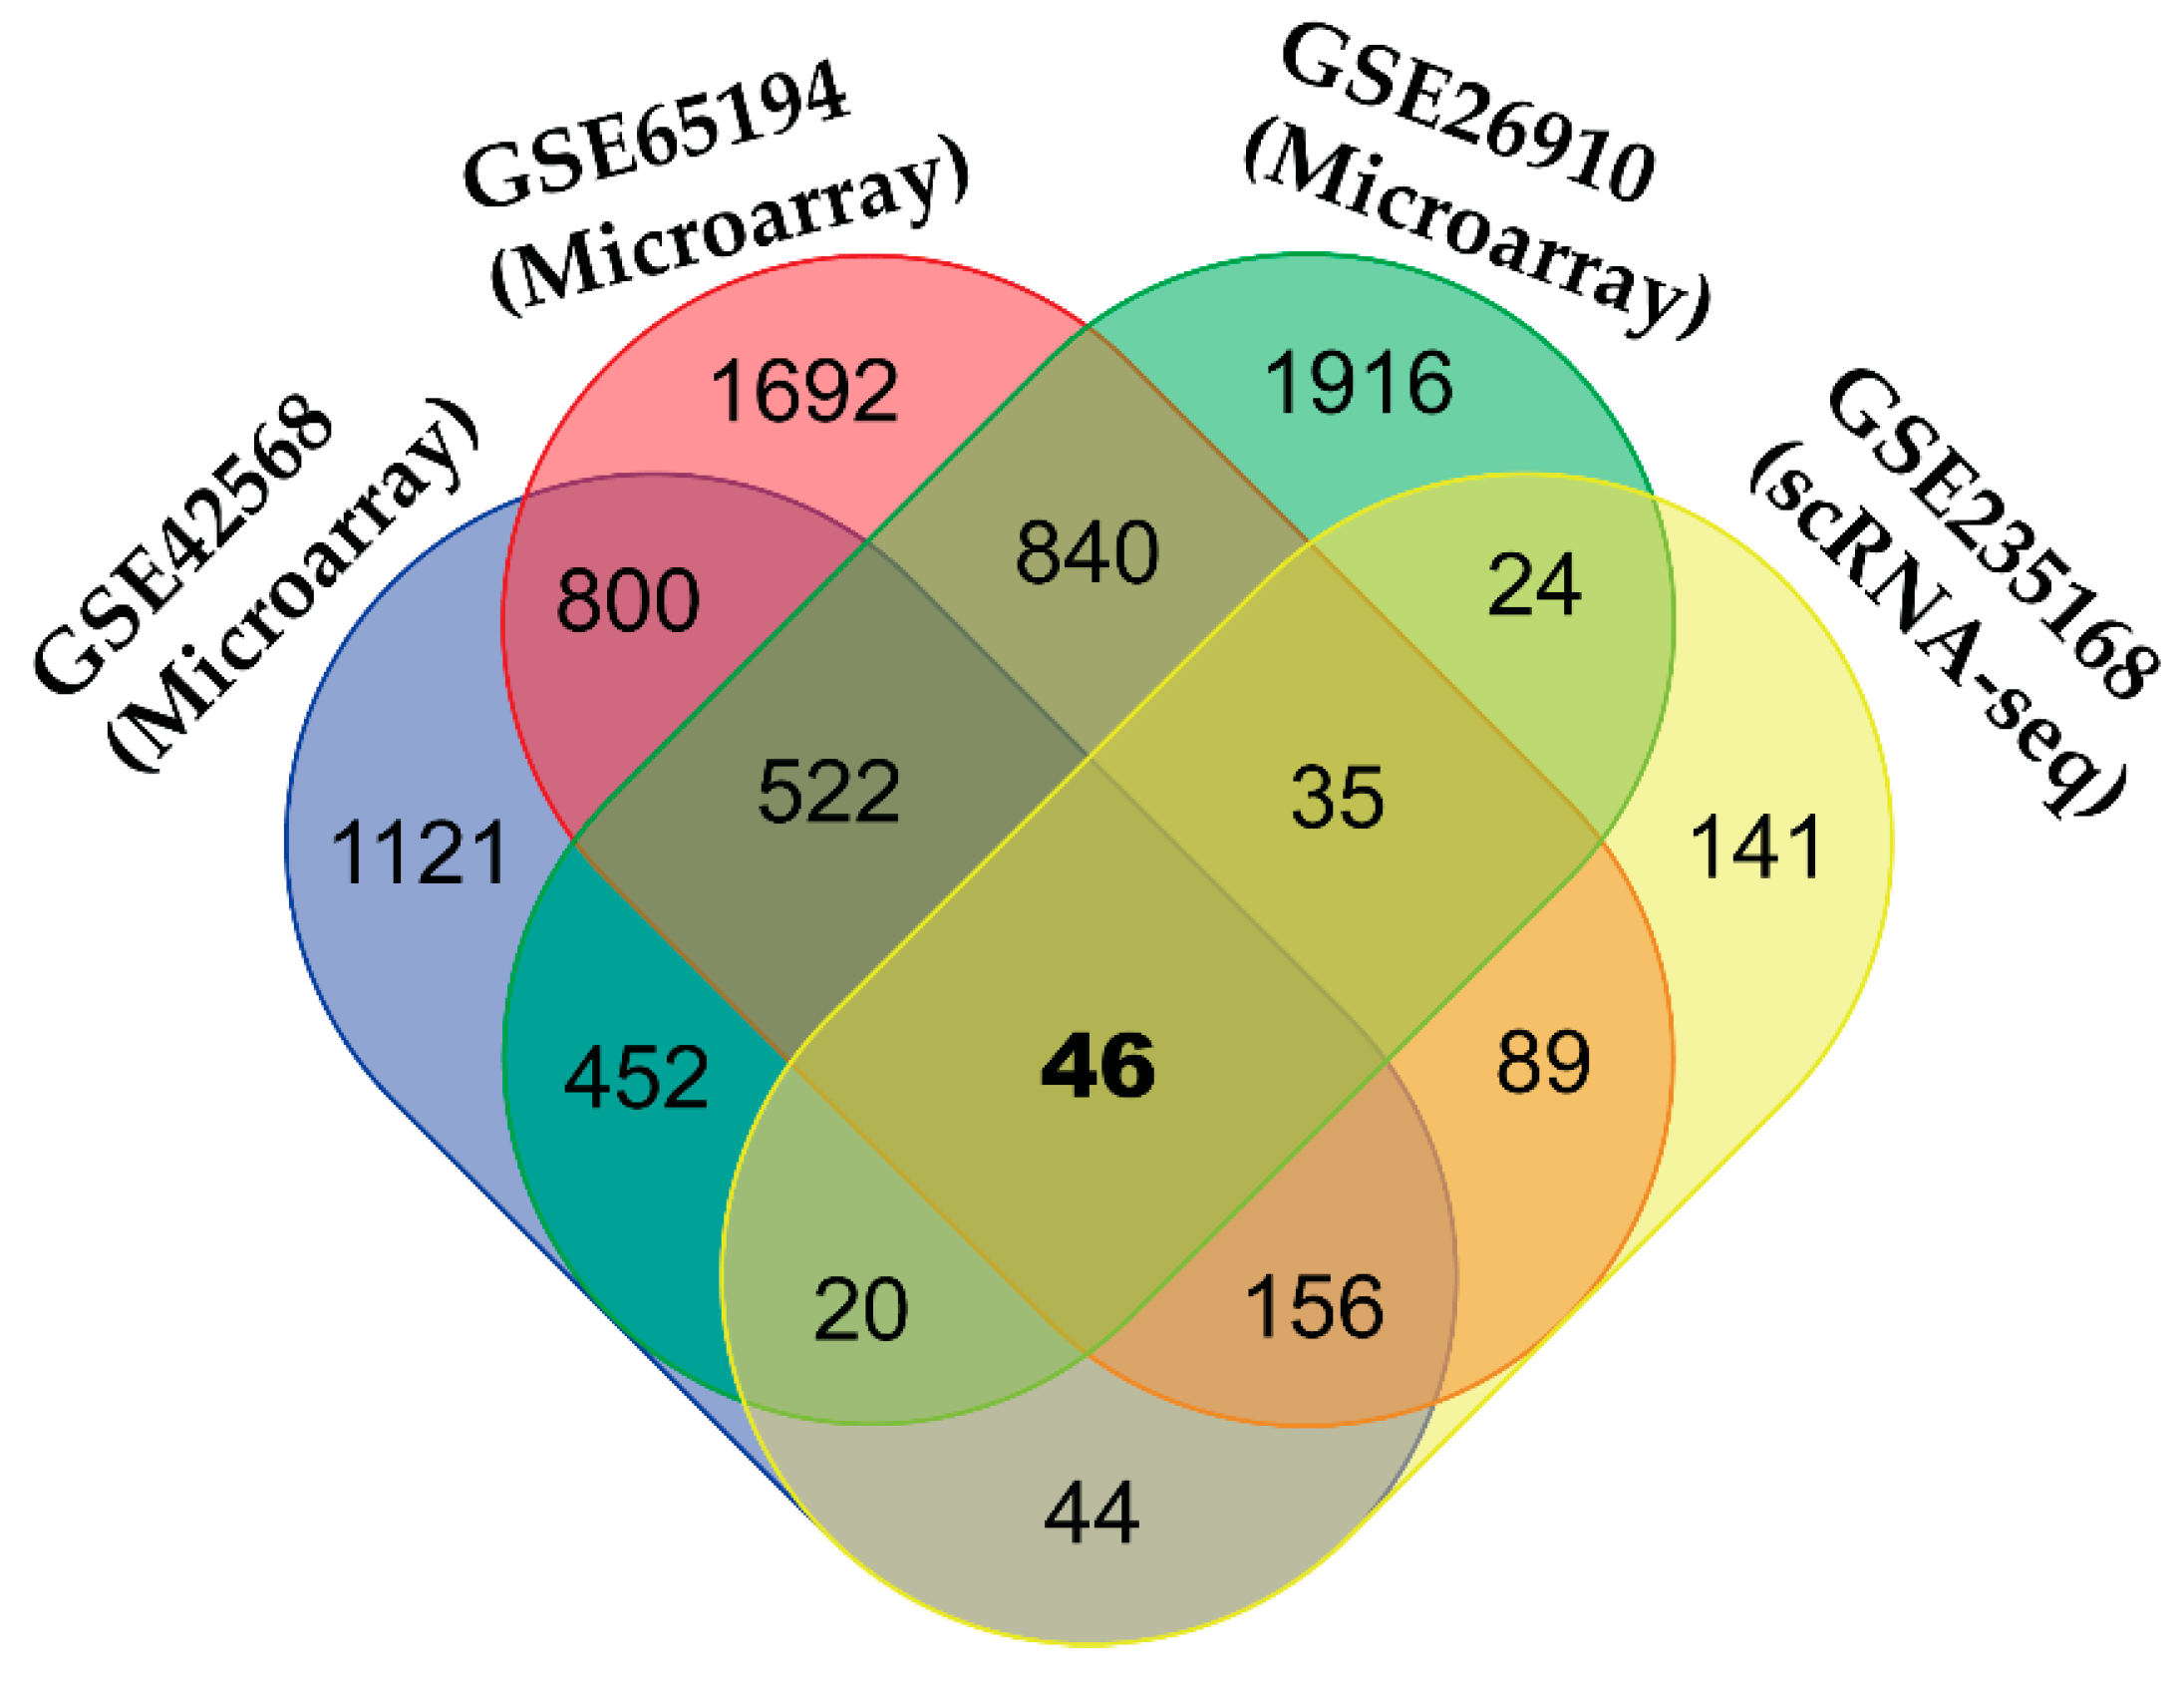
2.4. Identification of Common DEGs (cDEGs)
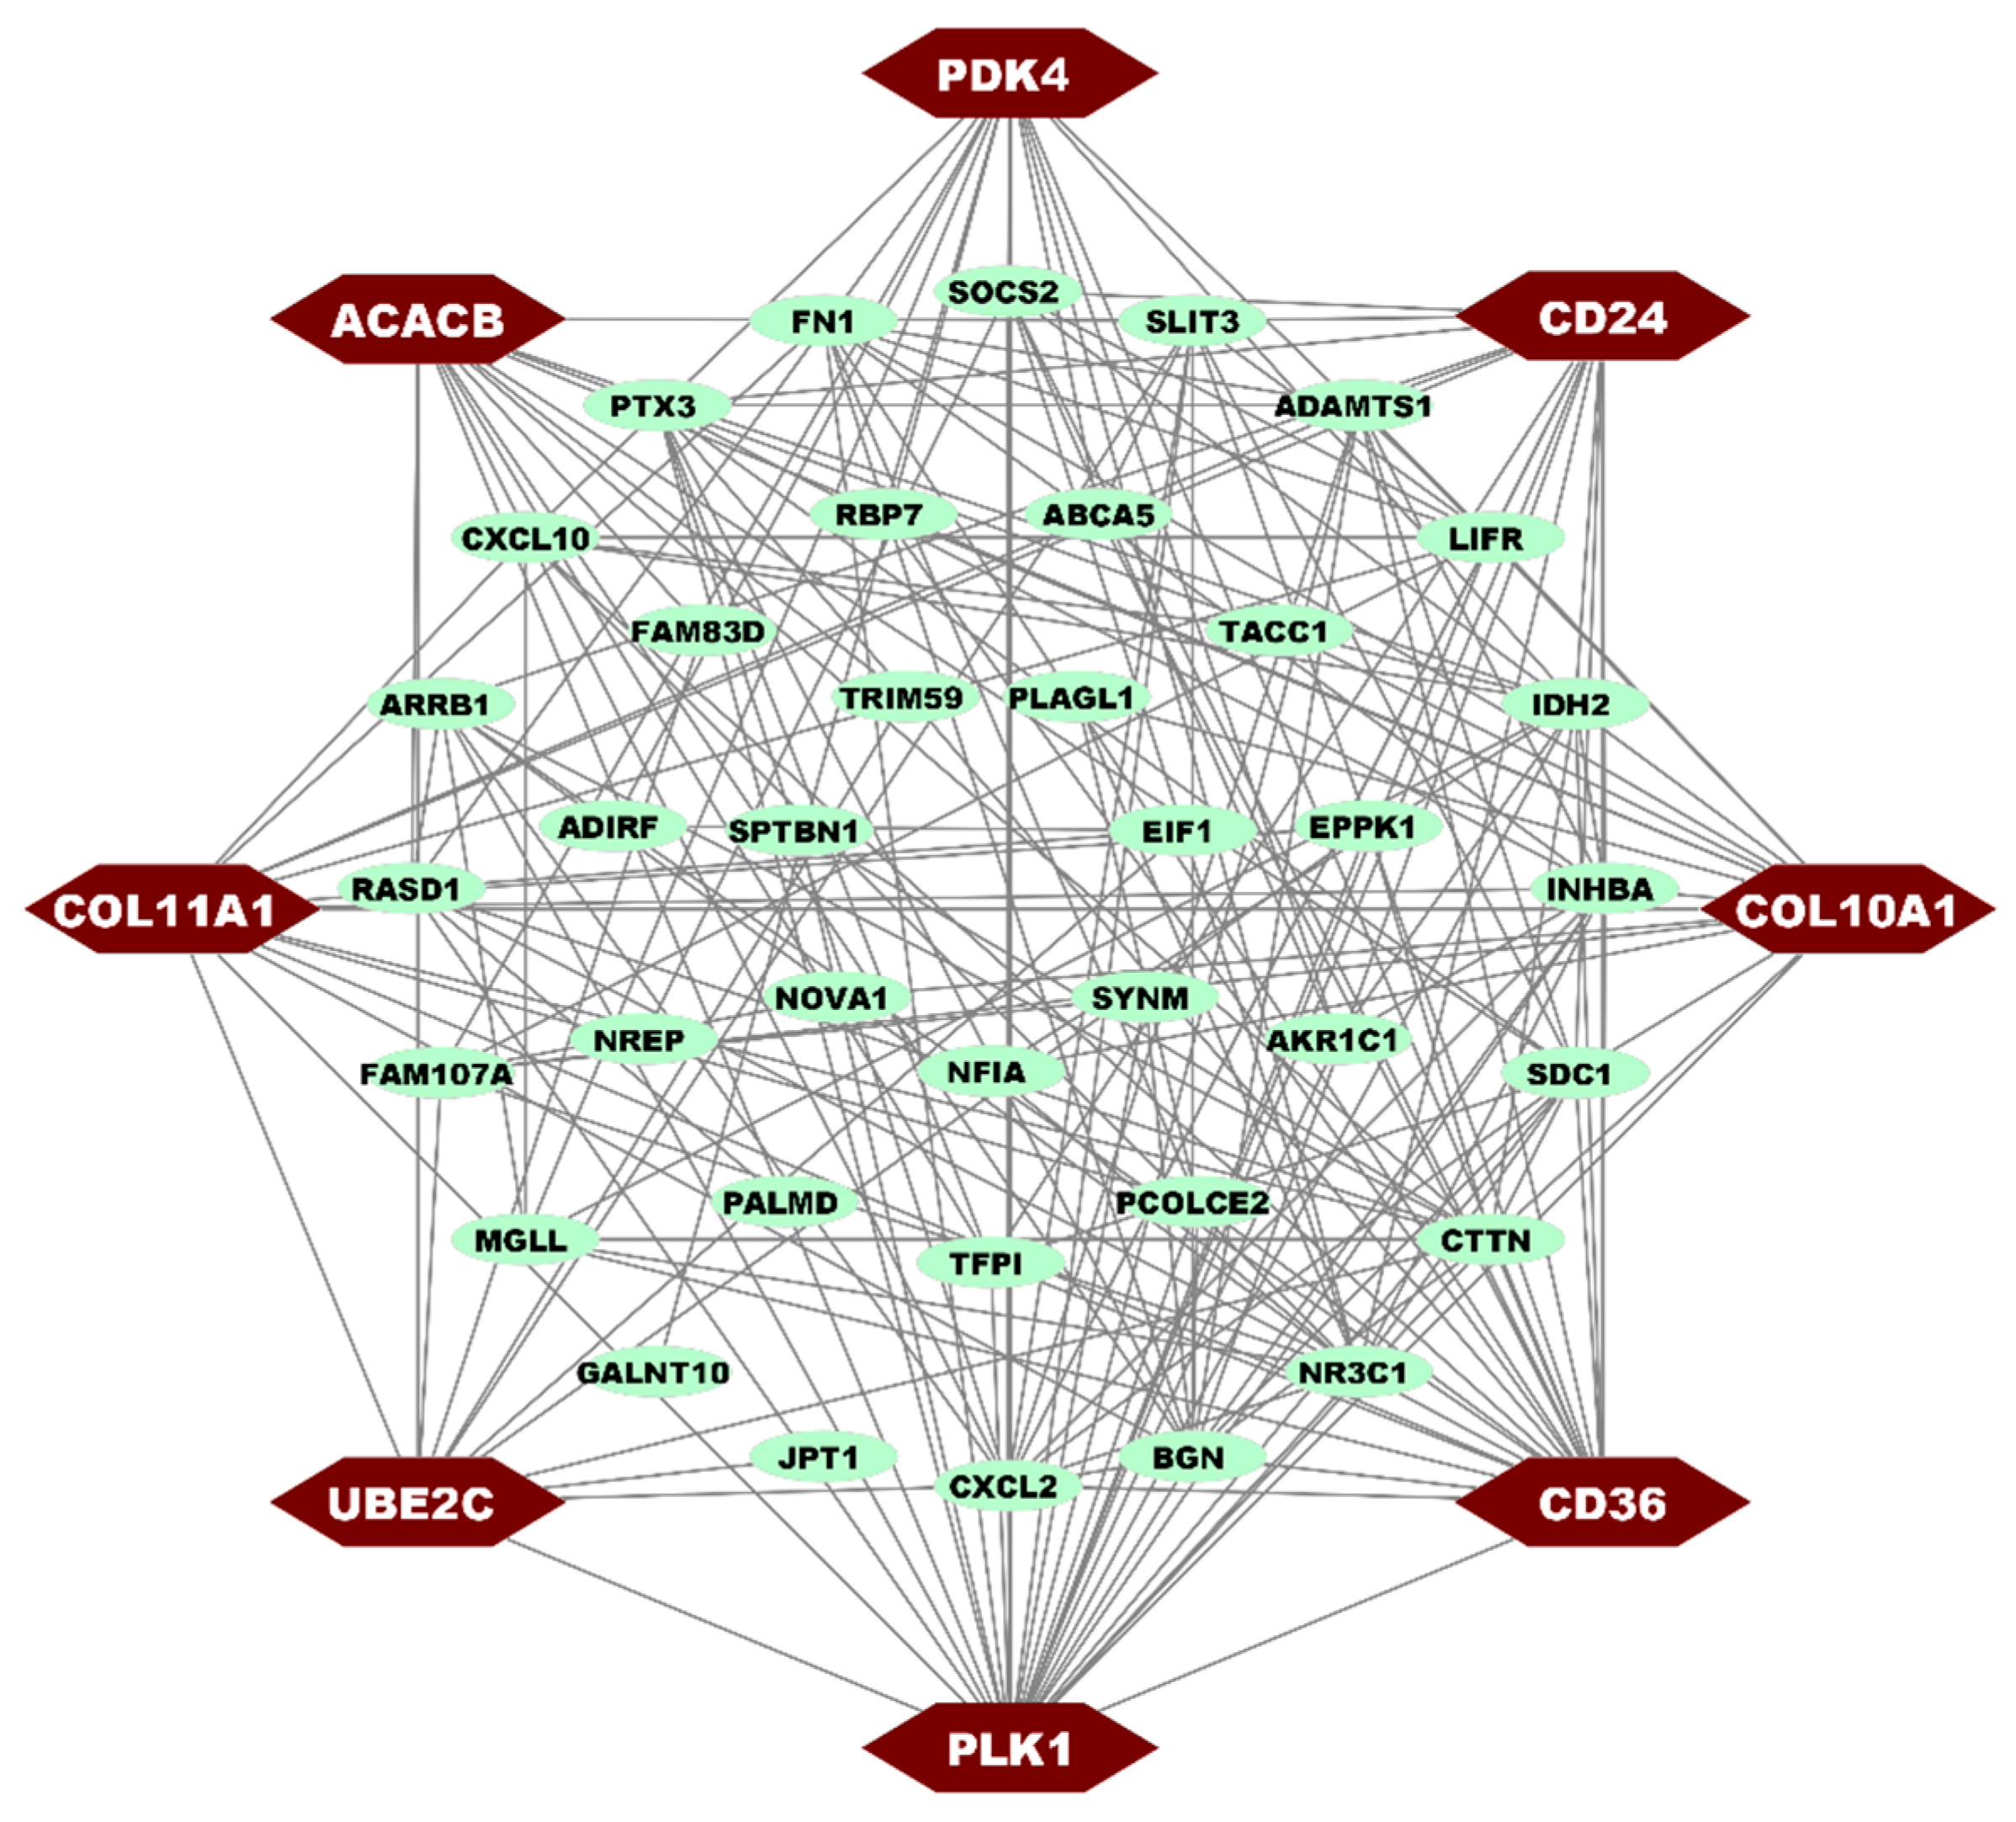
2.5. Protein-Protein Interaction (PPI) of cDEGs for Identification of Hub Gene (HubGs)
2.6. HubGs-Set Enrichment Analysis with GO-Terms and KEGG Pathways
2.7. HubGs Regulatory Network Analysis
2.8. Prognostic Performance of HubGs with the Independent Datasets
2.9. Expression Analysis of HubGs in Different BC Development Stages
2.10. HubGs-Guided Drug Repurposing
3. Results
3.1. Identification of DEGs from Microarray Data
3.2. Identification of DEGs from scRNA-seq Count Data
3.3. Identification of Common DEGs (cDEGs)
3.4. PPI Network of cDEGs for Identification of HubGs
3.5. HubGs-Set Enrichment Analysis with GO-Terms and KEGG Pathway
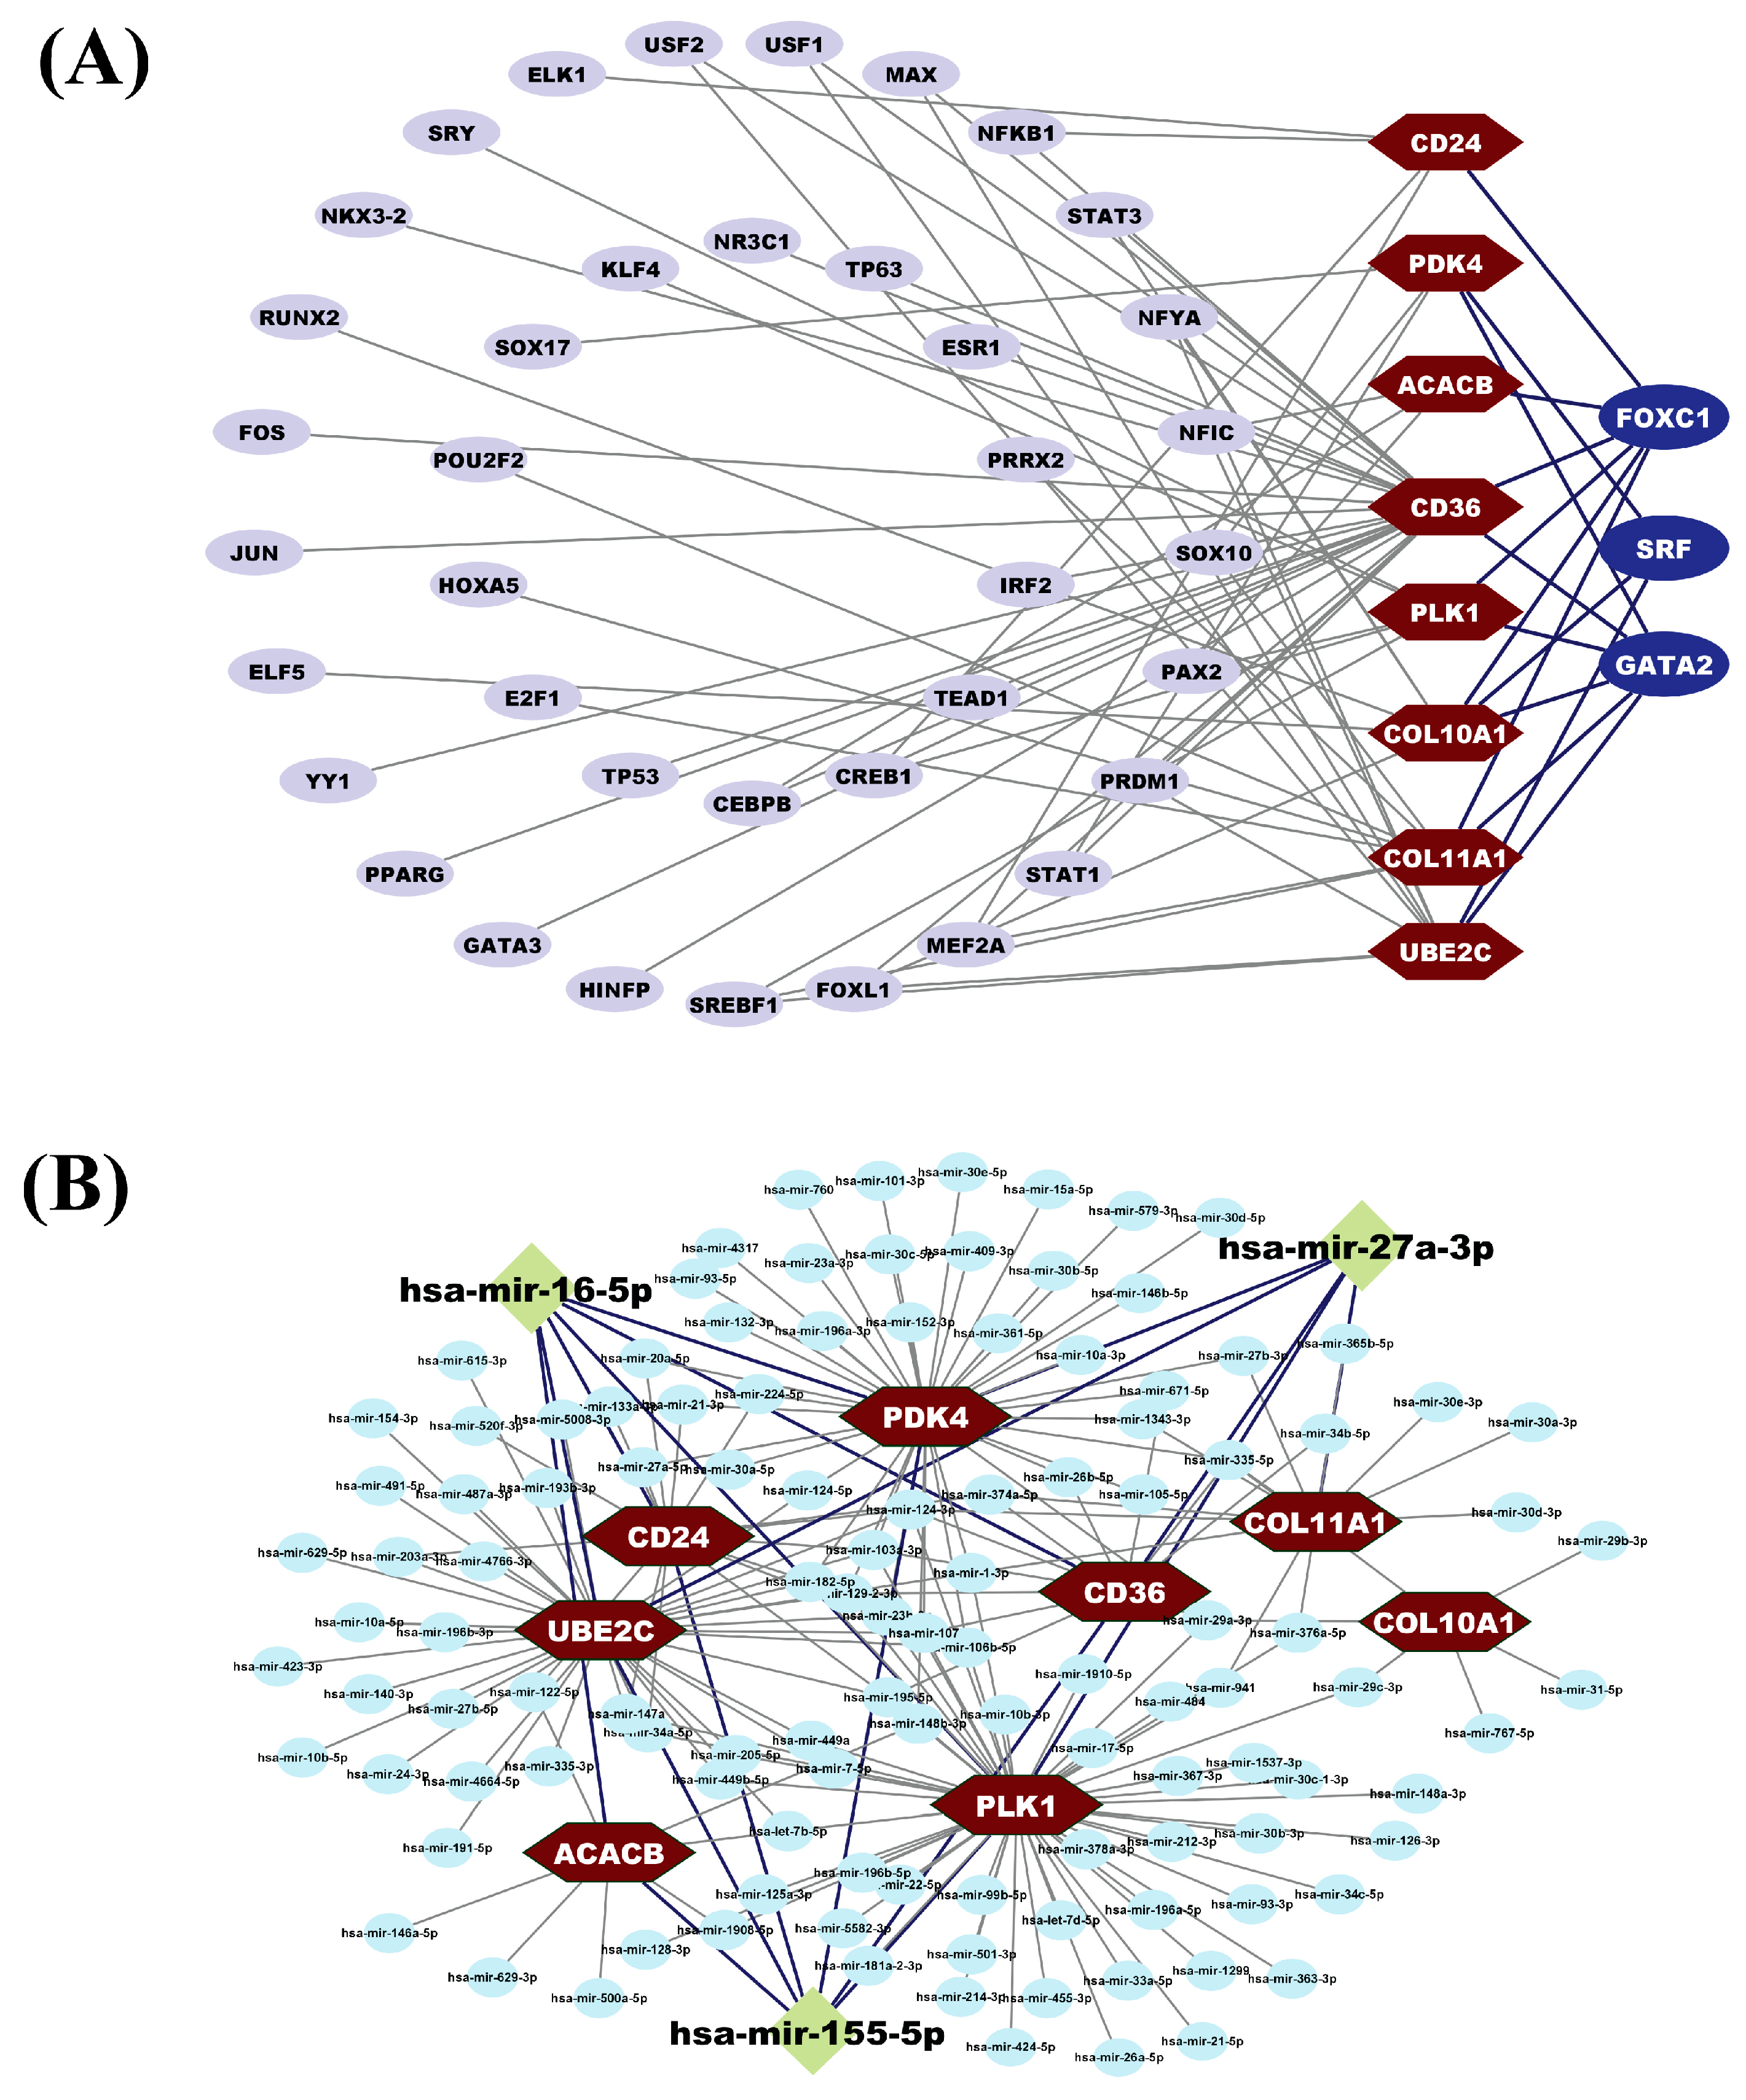
3.6. HubGs Regulatory Network Analysis
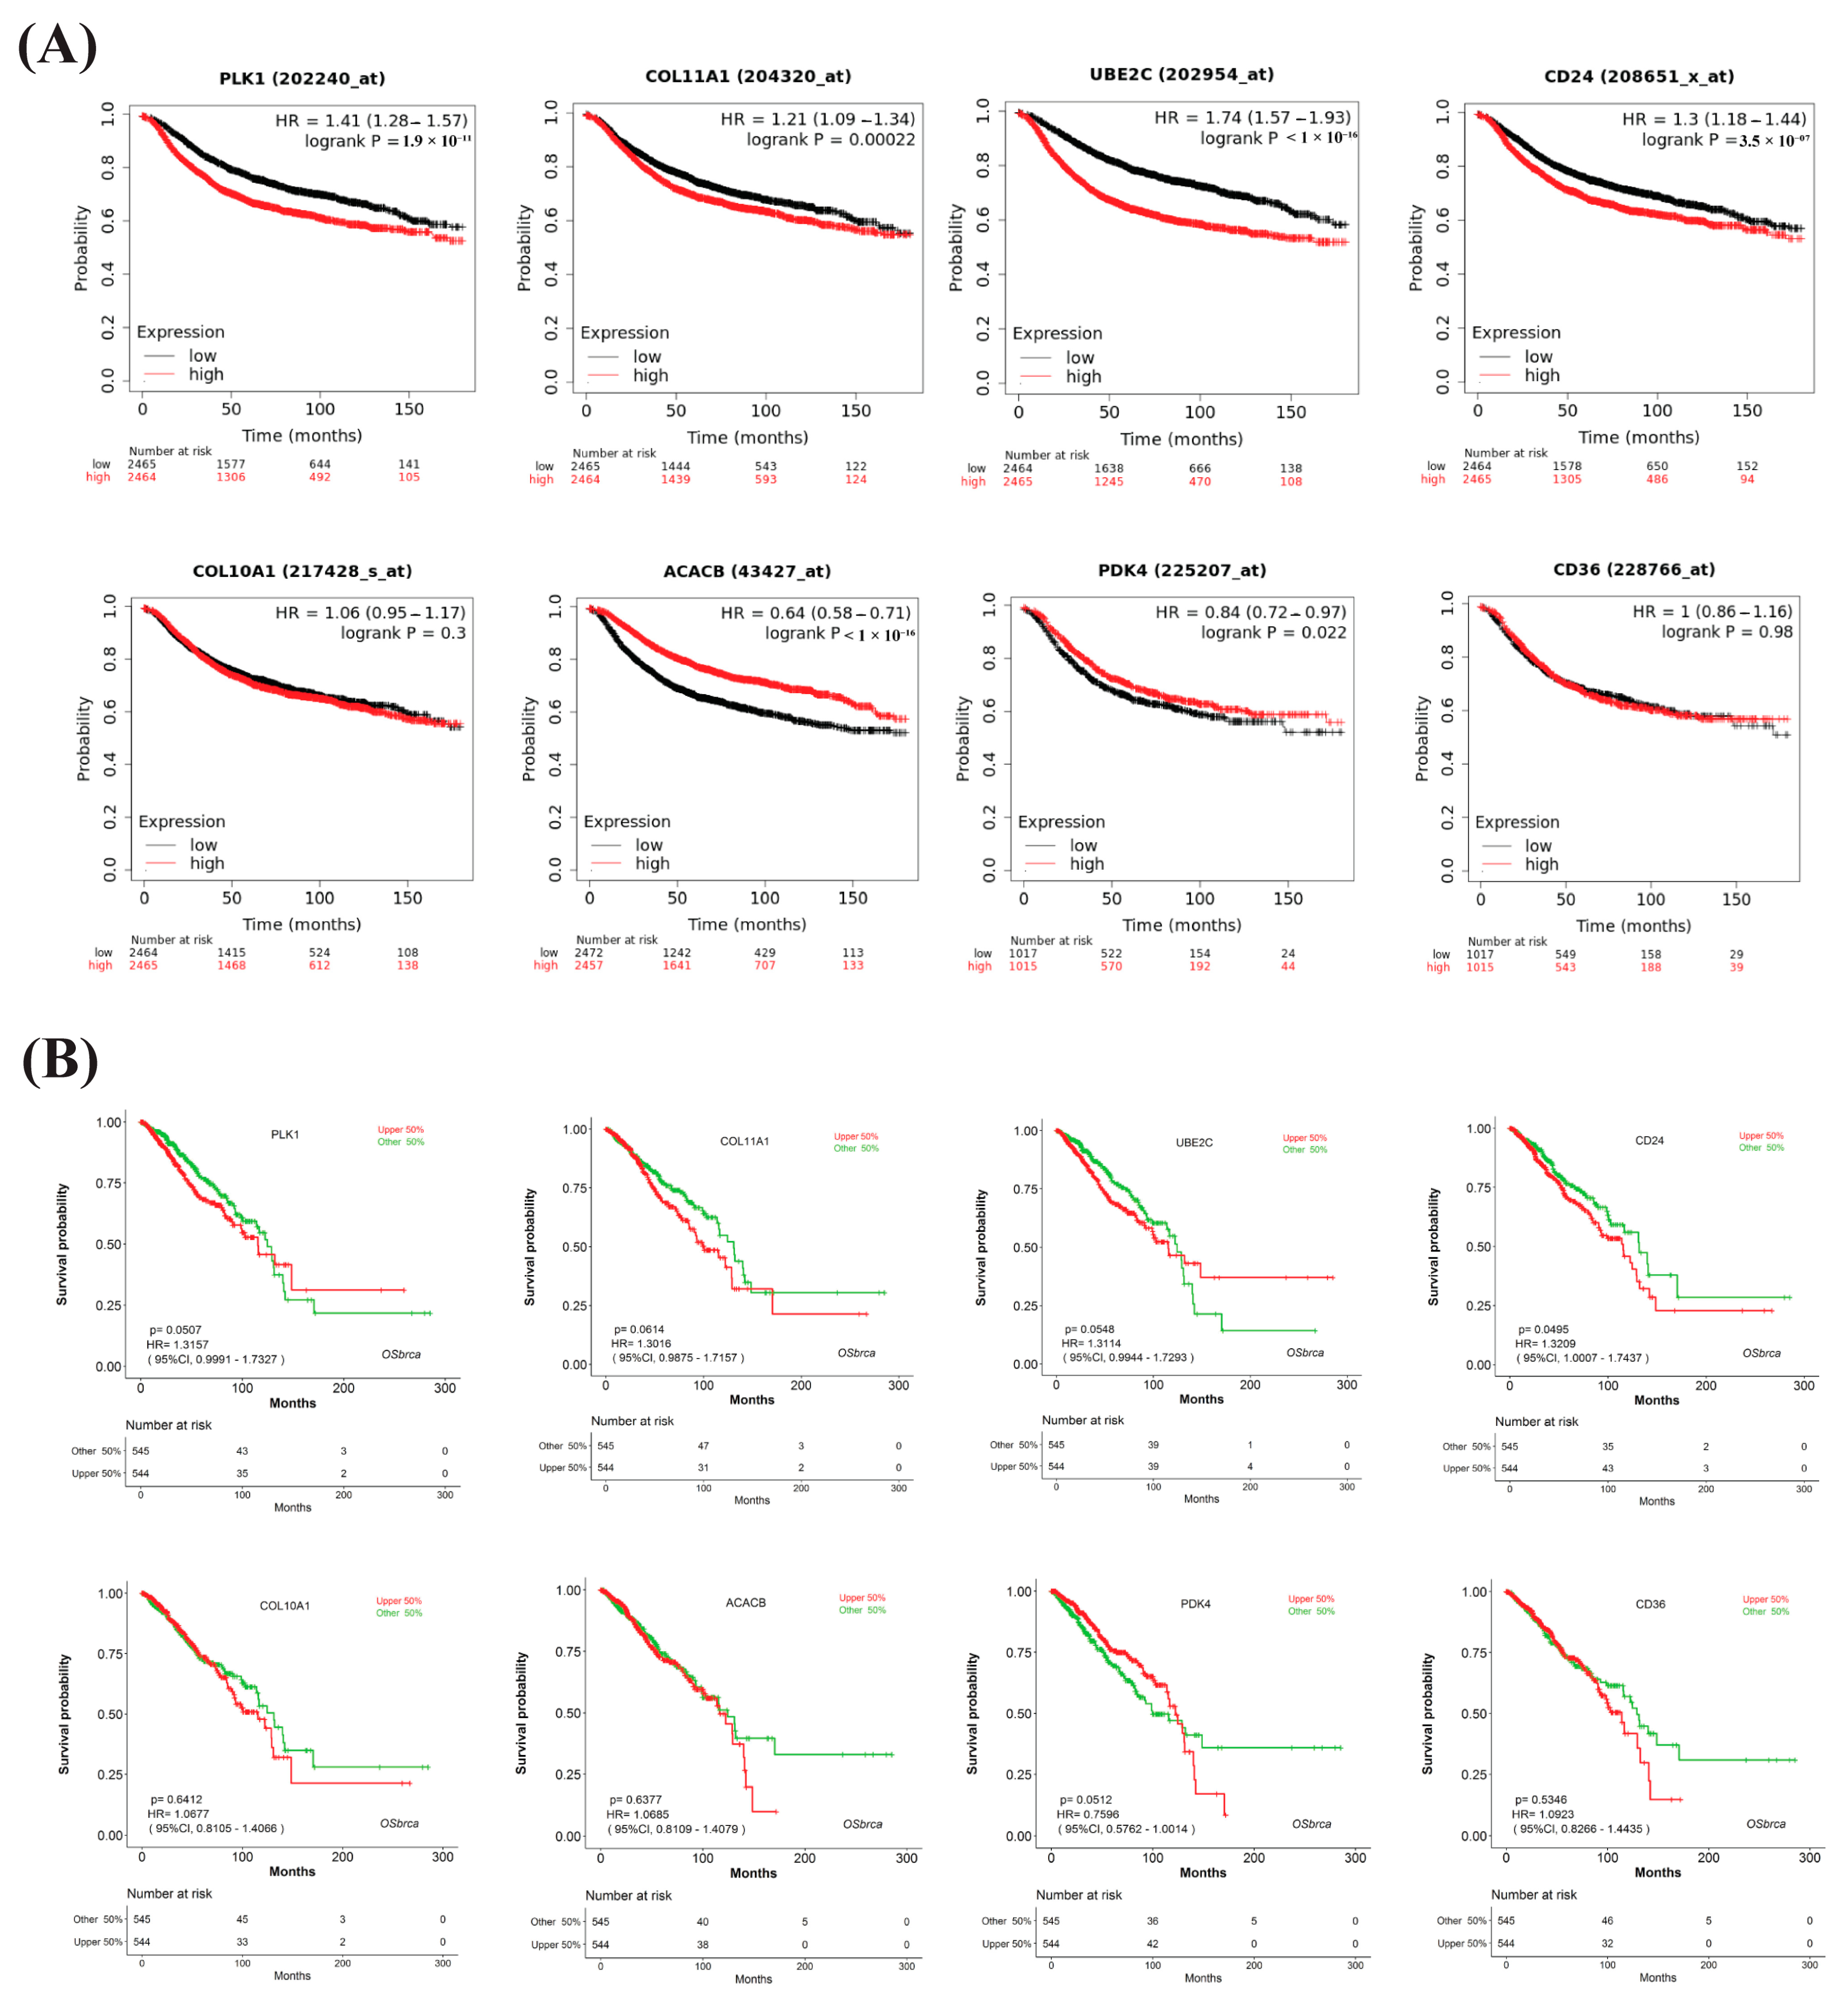
3.7. Prognostic Performance of HubGs with the Independent Expression Datasets
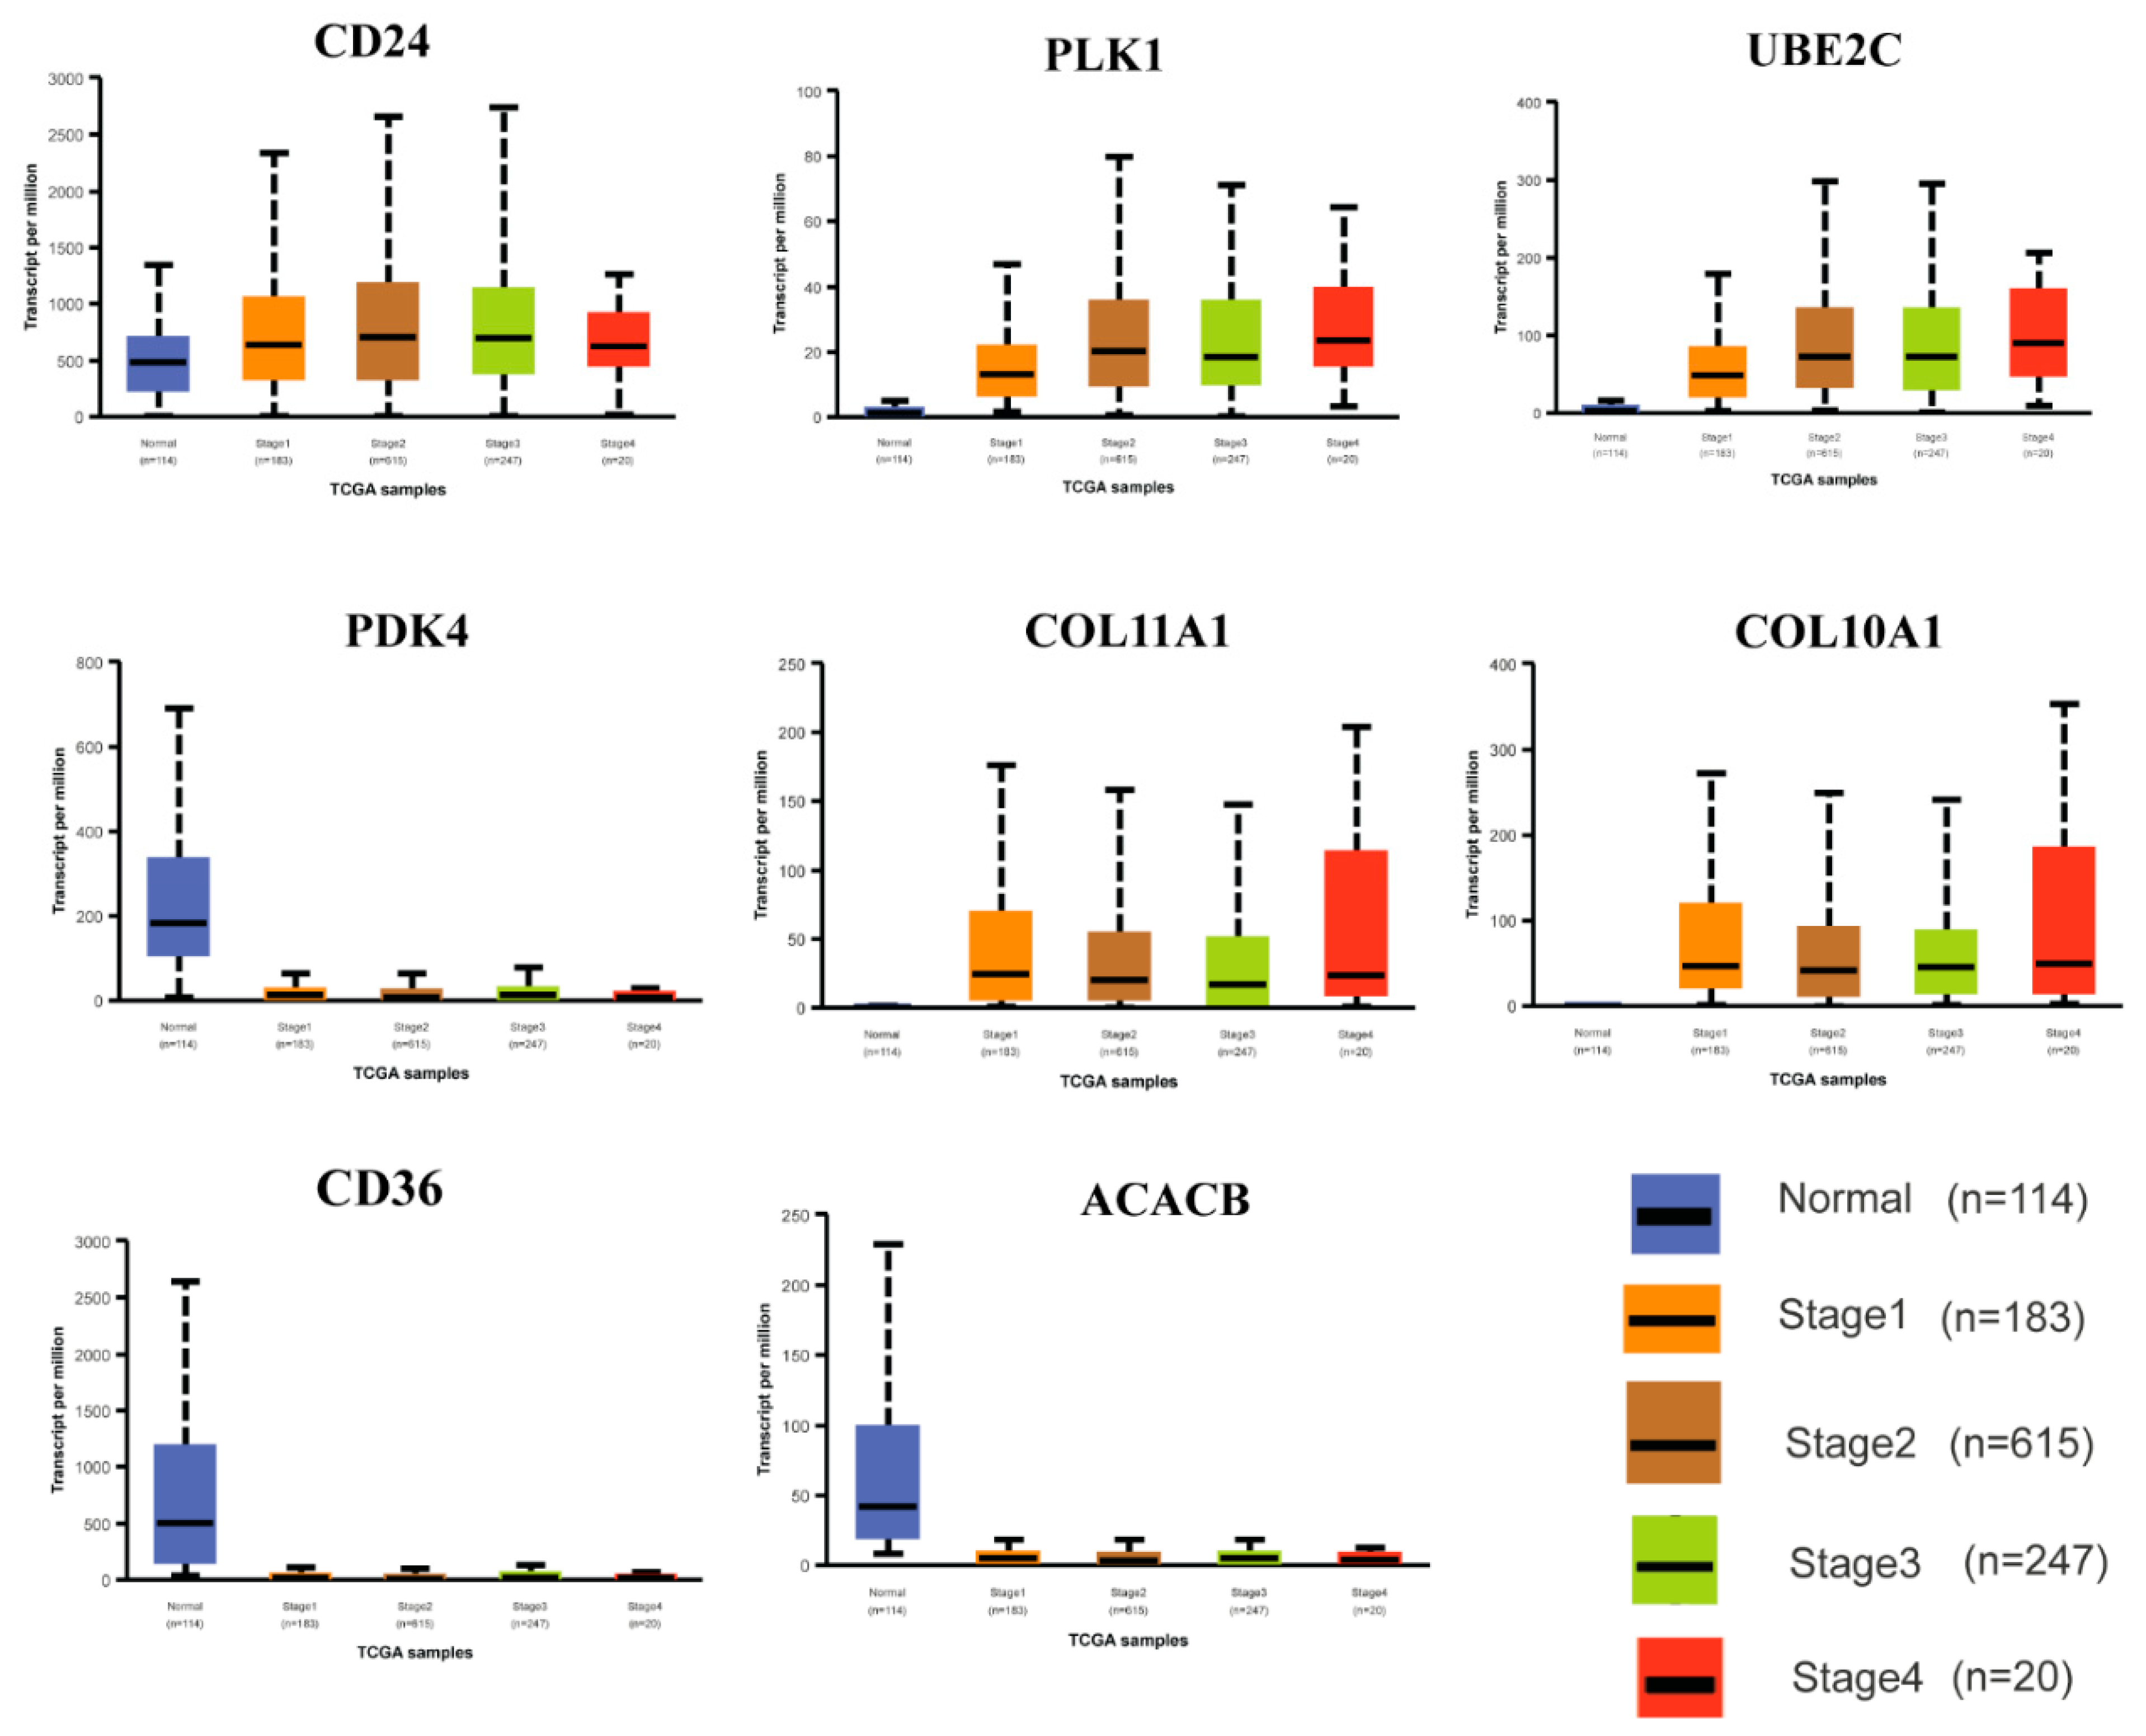
3.8. Expression Analysis of HubGs in Different BC Development Stages
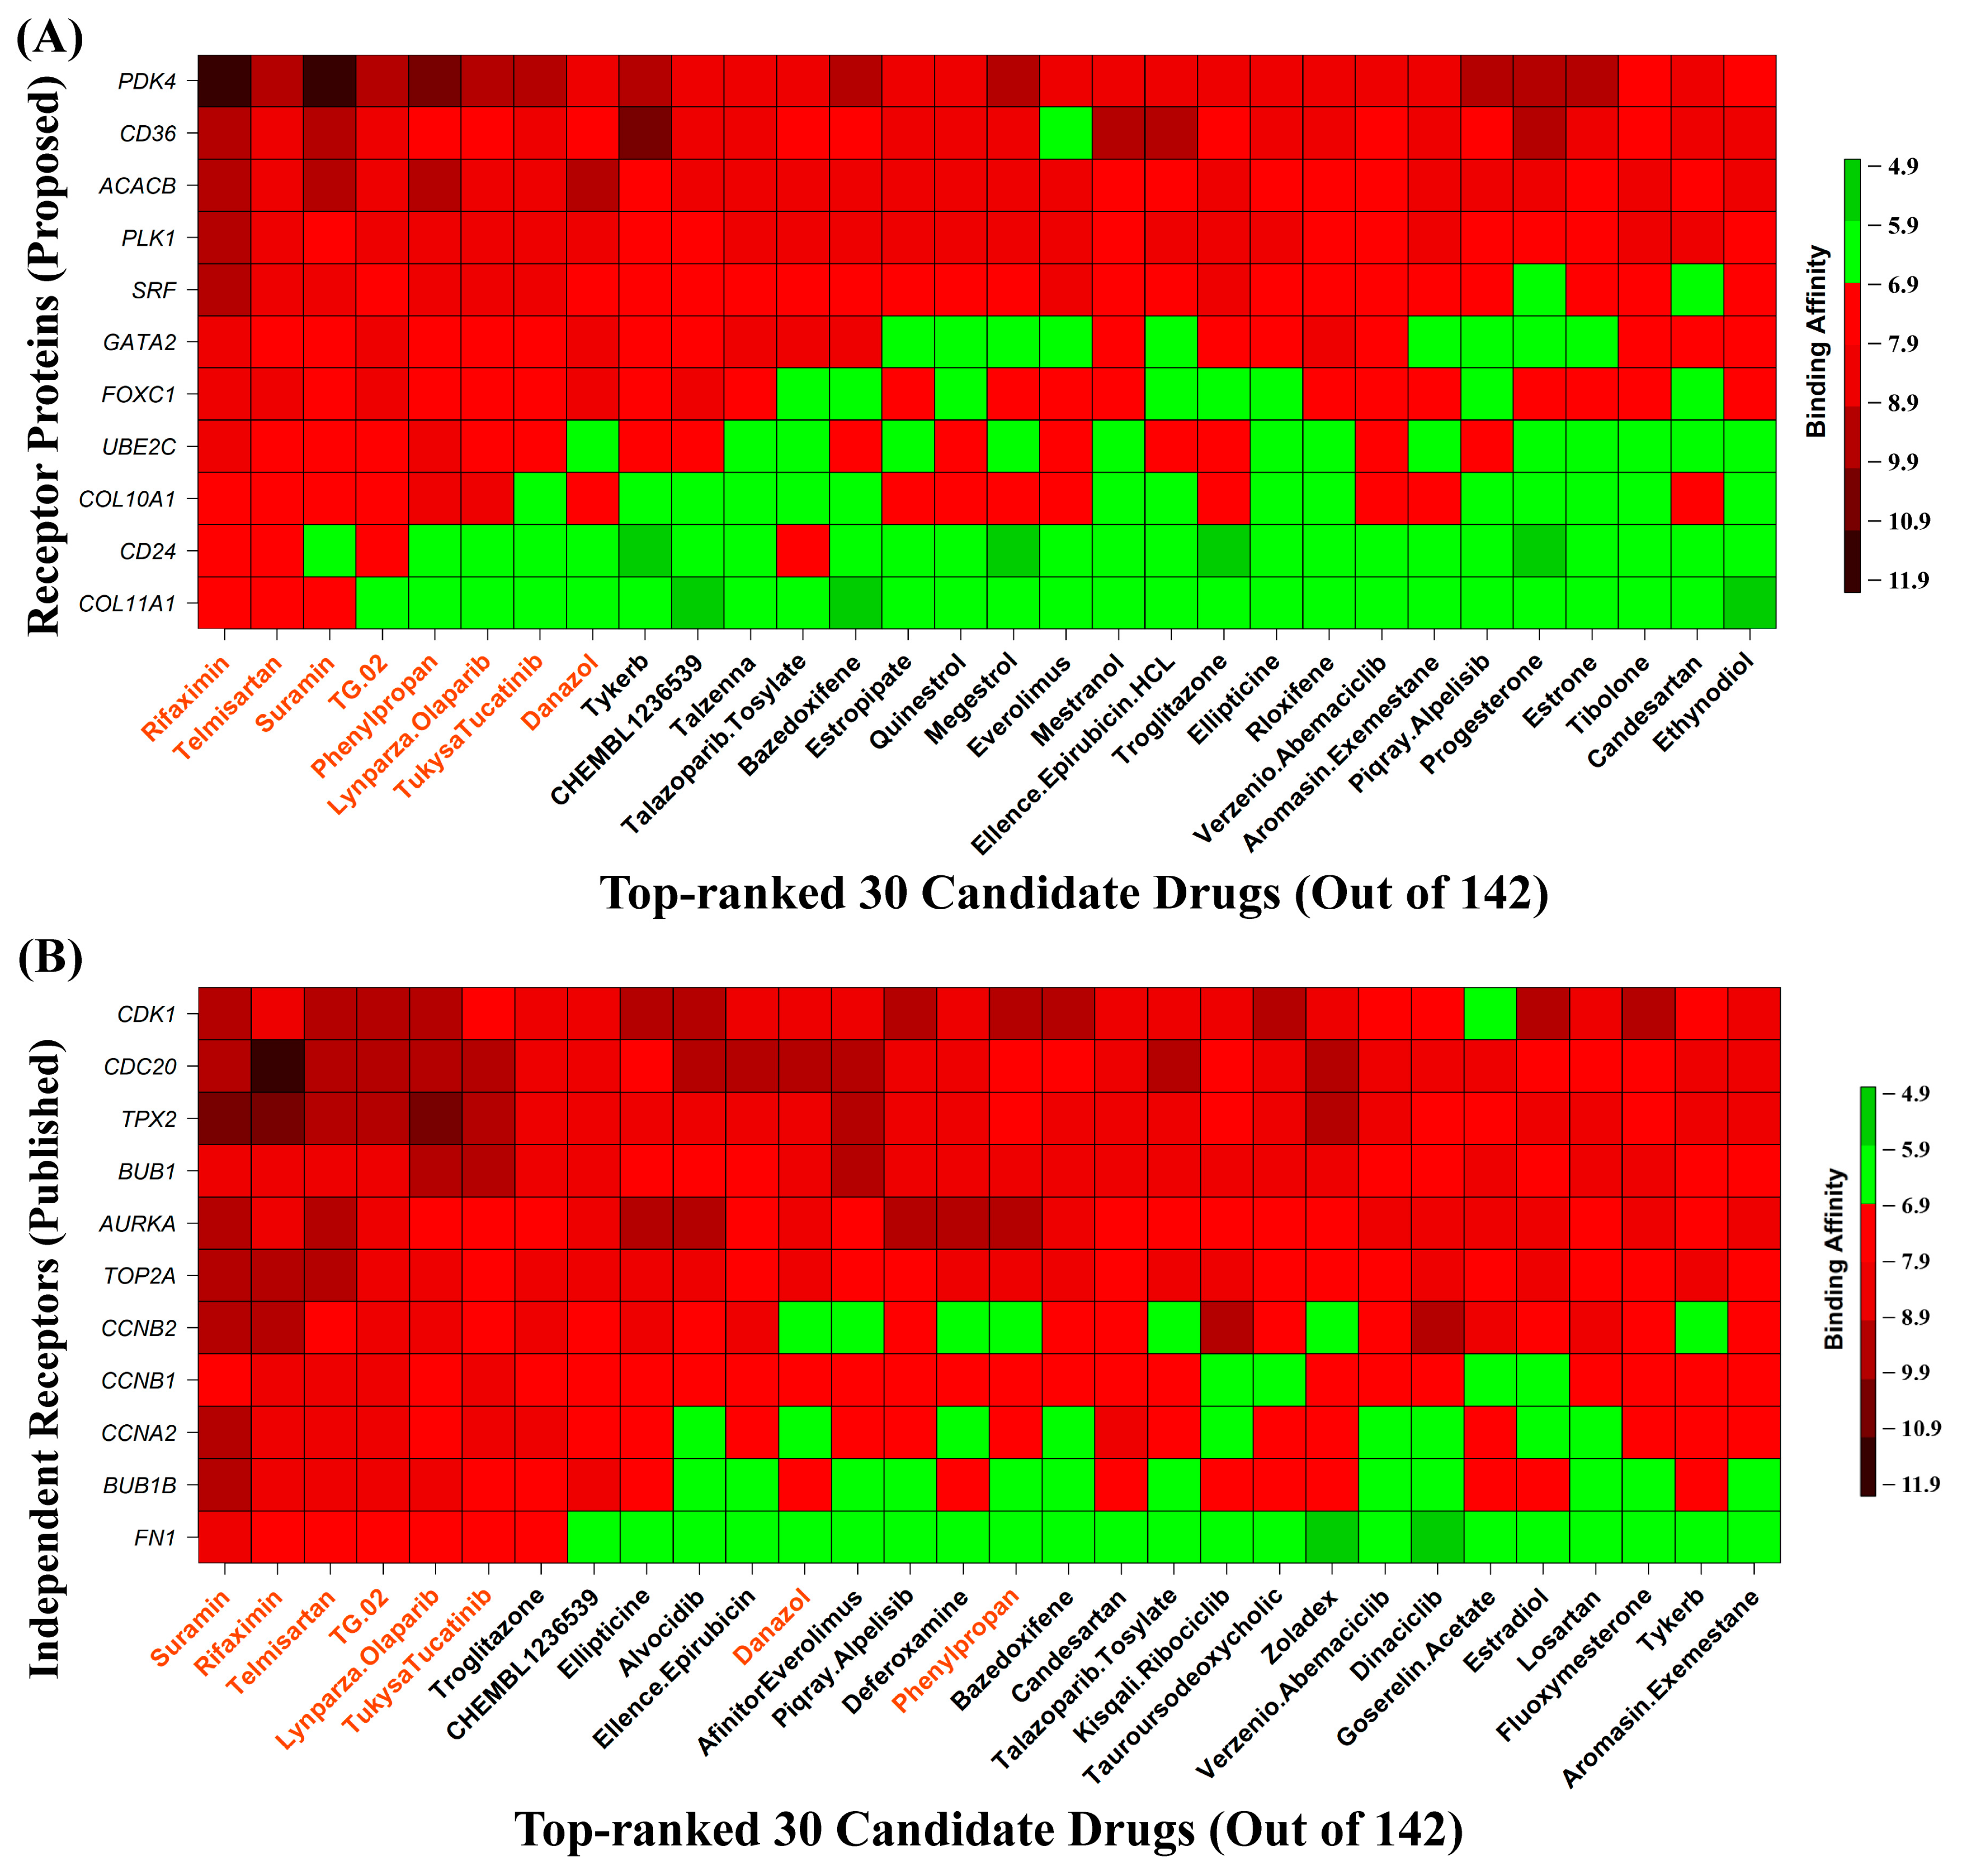
3.9. HubGs-Guided Drug Screening by Molecular Docking
4. Discussion
5. Conclusions
Supplementary Materials
Author Contributions
Funding
Institutional Review Board Statement
Informed Consent Statement
Data Availability Statement
Acknowledgments
Conflicts of Interest
References
- Yang, K.; Gao, J.; Luo, M. Identification of key pathways and hub genes in basal-like breast cancer using bioinformatics analysis. Oncol. Targets Ther. 2019, 12, 1319–1331. [Google Scholar] [CrossRef] [PubMed]
- Arnold, M.; Morgan, E.; Rumgay, H.; Mafra, A.; Singh, D.; Laversanne, M.; Vignat, J.; Gralow, J.R.; Cardoso, F.; Siesling, S.; et al. Current and future burden of breast cancer: Global statistics for 2020 and 2040. Breast 2022, 66, 15–23. [Google Scholar] [CrossRef] [PubMed]
- Rogoz, B.; Houzé de l’Aulnoit, A.; Duhamel, A.; Houzé de l’Aulnoit, D. Thirty-Year Trends of Survival and Time-Varying Effects of Prognostic Factors in Patients with Metastatic Breast Cancer—A Single Institution Experience. Clin. Breast Cancer 2018, 18, 246–253. [Google Scholar] [CrossRef] [PubMed]
- Lee, Y.; Ni, J.; Beretov, J.; Wasinger, V.C.; Graham, P.; Li, Y. Recent advances of small extracellular vesicle biomarkers in breast cancer diagnosis and prognosis. Mol. Cancer 2023, 22, 33. [Google Scholar] [CrossRef]
- Lee, H.B.; Han, W. Unique features of young age breast cancer and its management. J. Breast Cancer 2014, 17, 301–307. [Google Scholar] [CrossRef]
- McGuire, S. World Cancer Report 2014. Geneva, Switzerland: World Health Organization, International Agency for Research on Cancer, WHO Press, 2015. Adv. Nutr. 2016, 7, 418–419. [Google Scholar] [CrossRef]
- Burgess, S.; Foley, C.N.; Zuber, V. Inferring causal relationships between risk factors and outcomes using genetic variation. Handb. Stat. Genom. 2019, 1, 651–677. [Google Scholar] [CrossRef]
- Hanahan, D.; Weinberg, R.A. Hallmarks of cancer: The next generation. Cell 2011, 144, 646–674. [Google Scholar] [CrossRef]
- Gray, J.W.; Collins, C. Genome changes and gene expression in human solid tumors. Carcinogenesis 2000, 21, 443–452. [Google Scholar] [CrossRef]
- Porcu, E.; Sadler, M.C.; Lepik, K.; Auwerx, C.; Wood, A.R.; Weihs, A.; Sleiman, M.S.B.; Ribeiro, D.M.; Bandinelli, S.; Tanaka, T.; et al. Differentially expressed genes reflect disease-induced rather than disease-causing changes in the transcriptome. Nat. Commun. 2021, 12, 5647. [Google Scholar] [CrossRef]
- Hao, M.; Liu, W.; Ding, C.; Peng, X.; Zhang, Y.; Chen, H.; Dong, L.; Liu, X.; Zhao, Y.; Chen, X.; et al. Identification of hub genes and small molecule therapeutic drugs related to breast cancer with comprehensive bioinformatics analysis. PeerJ 2020, 8, e9946. [Google Scholar] [CrossRef] [PubMed]
- Dong, H.; Zhang, S.; Wei, Y.; Liu, C.; Wang, N.; Zhang, P.; Zhu, J.; Huang, J. Bioinformatic analysis of differential expression and core GENEs in breast cancer. Int. J. Clin. Exp. Pathol. 2018, 11, 1146–1156. [Google Scholar]
- Islam, M.A.; Hossen, M.B.; Horaira, M.A.; Hossen, M.A.; Kibria, M.K.; Reza, M.S.; Tuly, K.F.; Faruqe, M.O.; Kabir, F.; Mahumud, R.A.; et al. Exploring Core Genes by Comparative Transcriptomics Analysis for Early Diagnosis, Prognosis, and Therapies of Colorectal Cancer. Cancers 2023, 15, 1369. [Google Scholar] [CrossRef]
- Alam, M.S.; Sultana, A.; Reza, M.S.; Amanullah, M.; Kabir, S.R.; Mollah, M.N.H. Integrated bioinformatics and statistical approaches to explore molecular biomarkers for breast cancer diagnosis, prognosis and therapies. PLoS ONE 2022, 17, e0268967. [Google Scholar] [CrossRef]
- Chopra, S.; Khosla, M.; Vidya, R. Innovations and Challenges in Breast Cancer Care: A Review. Medicina 2023, 59, 957. [Google Scholar] [CrossRef]
- Shahjaman, M.; Kumar, N.; Mollah, M.M.H.; Ahmed, M.S.; Ara Begum, A.; Shahinul Islam, S.M.; Mollah, M.N.H. Robust significance analysis of microarrays by minimum β-Divergence method. Biomed. Res. Int. 2017, 2017. [Google Scholar] [CrossRef]
- Mollah, M.M.H.; Jamal, R.; Mokhtar, N.M.; Harun, R.; Mollah, M.N.H. A hybrid one-way ANOVA approach for the robust and efficient estimation of differential gene expression with multiple patterns. PLoS ONE 2015, 10, e0138810. [Google Scholar] [CrossRef]
- Shieh, A.D.; Hung, Y.S. Detecting outlier samples in microarray data. Stat. Appl. Genet. Mol. Biol. 2009, 8. [Google Scholar] [CrossRef]
- Yang, Z.; Yang, Z.R. Detection of non-structural outliers for microarray experiments. In Proceedings of the International Joint Conference on Neural Networks, Beijing, China, 6–11 July 2014. [Google Scholar] [CrossRef]
- Gottardo, R.; Raftery, A.E.; Yee, Y.K.; Bumgarner, R.E. Bayesian robust inference for differential gene expression in microarrays with multiple samples. Biometrics 2006, 62, 10–18. [Google Scholar] [CrossRef] [PubMed]
- Hossen, M.B.; Islam, M.A.; Reza, M.S.; Kibria, M.K.; Horaira, M.A.; Tuly, K.F.; Faruqe, M.O.; Kabir, F.; Mollah, M.N.H. Robust identification of common genomic biomarkers from multiple gene expression profiles for the prognosis, diagnosis, and therapies of pancreatic cancer. Comput. Biol. Med. 2023, 152, 106411. [Google Scholar] [CrossRef] [PubMed]
- Shahjaman, M.; Manir Hossain Mollah, M.; Rezanur Rahman, M.; Islam, S.M.S.; Nurul Haque Mollah, M. Robust identification of differentially expressed genes from RNA-seq data. Genomics 2020, 112, 2000–2010. [Google Scholar] [CrossRef] [PubMed]
- Wu, J.; Lv, Q.; Huang, H.; Zhu, M.; Meng, D. Screening and identification of key biomarkers in inflammatory breast cancer through integrated bioinformatic analyses. Genet. Test. Mol. Biomark 2020, 24, 484–491. [Google Scholar] [CrossRef] [PubMed]
- Wang, Y.; Zhu, M.; Guo, F.; Song, Y.; Fan, X.; Qin, G. Identification of Tumor Microenvironment-Related Prognostic Biomarkers in Luminal Breast Cancer. Front. Genet. 2020, 11, 555865. [Google Scholar] [CrossRef] [PubMed]
- Wu, J.R.; Zhao, Y.; Zhou, X.P.; Qin, X. Estrogen receptor 1 and progesterone receptor are distinct biomarkers and prognostic factors in estrogen receptor-positive breast cancer: Evidence from a bioinformatic analysis. Biomed. Pharmacother. 2020, 121, 109647. [Google Scholar] [CrossRef]
- Chen, J.; Liu, C.; Cen, J.; Liang, T.; Xue, J.; Zeng, H.; Zhang, Z.; Xu, G.; Yu, C.; Lu, Z.; et al. KEGG-expressed genes and pathways in triple negative breast cancer: Protocol for a systematic review and data mining. Medicine 2020, 99, e19986. [Google Scholar] [CrossRef]
- Zhou, Z.; Wu, B.; Tang, X.; Ke, R.; Zou, Q. Comprehensive analysis of fibroblast growth factor receptor (FGFR) family genes in breast cancer by integrating online databases and bioinformatics. Med. Sci. Monit. 2020, 26, e923517. [Google Scholar] [CrossRef]
- Liu, S.; Song, A.; Wu, Y.; Yao, S.; Wang, M.; Niu, T.; Gao, C.; Li, Z.; Zhou, X.; Huo, Z.; et al. Analysis of genomics and immune infiltration patterns of epithelial-mesenchymal transition related to metastatic breast cancer to bone. Transl. Oncol. 2021, 14, 100993. [Google Scholar] [CrossRef]
- Chuan, T.; Li, T.; Yi, C. Identification of CXCR4 and CXCL10 as potential predictive biomarkers in triple negative breast cancer (TNBC). Med. Sci. Monit. 2020, 26, e918281. [Google Scholar] [CrossRef]
- Jin, H.; Huang, X.; Shao, K.; Li, G.; Wang, J. Integrated Analysis Revealed Hub Genes in Breast Cancer. bioRxiv 2018, 414532. [Google Scholar] [CrossRef]
- Tian, T.; Gong, Z.; Wang, M.; Hao, R.; Lin, S.; Liu, K.; Guan, F.; Xu, P.; Deng, Y.; Song, D.; et al. Identification of long non-coding RNA signatures in triple-negative breast cancer. Cancer Cell Int. 2018, 18, 103. [Google Scholar] [CrossRef]
- Shi, G.; Shen, Z.; Liu, Y.; Yin, W. Identifying Biomarkers to Predict the Progression and Prognosis of Breast Cancer by Weighted Gene Co-expression Network Analysis. Front. Genet. 2020, 11, 597888. [Google Scholar] [CrossRef]
- Li, M.X.; Jin, L.T.; Wang, T.J.; Feng, Y.J.; Pan, C.P.; Zhao, D.M.; Shao, J. Identification of potential core genes in triple negative breast cancer using bioinformatics analysis. OncoTargets Ther. 2018, 11, 4105–4112. [Google Scholar] [CrossRef]
- Liu, S.; Liu, X.; Wu, J.; Zhou, W.; Ni, M.; Meng, Z.; Jia, S.; Zhang, J.; Guo, S.; Lu, S.; et al. Identification of candidate biomarkers correlated with the pathogenesis and prognosis of breast cancer via integrated bioinformatics analysis. Medicine 2020, 99, e23153. [Google Scholar] [CrossRef] [PubMed]
- Zhang, K.; Jiang, K.; Hong, R.; Xu, F.; Xia, W.; Qin, G.; Lee, K.; Zheng, Q.; Lu, Q.; Zhai, Q.; et al. Identification and characterization of critical genes associated with tamoxifen resistance in breast cancer. PeerJ 2020, 8, e10468. [Google Scholar] [CrossRef]
- Wei, L.M.; Li, X.Y.; Wang, Z.M.; Wang, Y.K.; Yao, G.; Fan, J.H.; Wang, X.S. Identification of hub genes in triple-negative breast cancer by integrated bioinformatics analysis. Gland. Surg. 2021, 10, 799–806. [Google Scholar] [CrossRef] [PubMed]
- Dong, P.; Yu, B.; Pan, L.; Tian, X.; Liu, F. Identification of Key Genes. and Pathways in Triple-Negative Breast Cancer by Integrated Bioinformatics Analysis. BioMed Res. Int. [CrossRef]
- Wu, J.Z.; Lu, P.; Liu, R.; Yang, T.J. Transcription regulation network analysis of MCF7 breast cancer cells exposed to estradiol. Asian Pac. J. Cancer Prev. 2012, 13, 3681–3685. [Google Scholar] [CrossRef] [PubMed]
- He, Y.; Cao, Y.; Wang, X.; Jisiguleng, W.; Tao, M.; Liu, J.; Wang, F.; Chao, L.; Wang, W.; Li, P.; et al. Identification of Hub Genes to Regulate Breast Cancer Spinal Metastases by Bioinformatics Analyses. Comput. Math. Methods Med. 2021, 2021, 5548918. [Google Scholar] [CrossRef]
- Zhu, C.; Ge, C.; He, J.; Zhang, X.; Feng, G.; Fan, S. Identification of Key Genes and Pathways Associated with Irradiation in Breast Cancer Tissue and Breast Cancer Cell Lines. Dose Response 2020, 18, 1559325820931252. [Google Scholar] [CrossRef]
- Li, L.; Huang, H.; Zhu, M.; Wu, J. Identification of hub genes and pathways of triple negative breast cancer by expression profiles analysis. Cancer Manag. Res. 2021, 13, 2095–2104. [Google Scholar] [CrossRef]
- Xiao, X.; Zhang, Z.; Luo, R.; Peng, R.; Sun, Y.; Wang, J.; Chen, X. Identification of potential oncogenes in triple_negative breast cancer based on bioinformatics analyses. Oncol. Lett. 2021, 21, 363. [Google Scholar] [CrossRef]
- Lu, X.; Gao, C.; Liu, C.; Zhuang, J.; Su, P.; Li, H.; Wang, X.; Sun, C. Identification of the key pathways and genes involved in HER2-positive breast cancer with brain metastasis. Pathol. Res. Pract. 2019, 215, 152475. [Google Scholar] [CrossRef] [PubMed]
- Wang, G. Identification of Potential Crucial Genes and Key Pathways in Breast Cancer Using. Bioinform. Anal. 2019, 10, 695. [Google Scholar] [CrossRef]
- Yan, L.; Wang, A.; Lv, Z.; Yuan, Y.; Xu, Q. Mitochondria-related core genes and TF-miRNA-hub mrDEGs network in breast cancer. Biosci. Rep. 2021, 41, BSR20203481. [Google Scholar] [CrossRef]
- Peng, Z.; Xu, B.; Jin, F. Circular RNA hsa_circ_0000376 Participates in Tumorigenesis of Breast Cancer by Targeting miR-1285-3p. Technol. Cancer. Res. Treat. 2020, 19, 1533033820928471. [Google Scholar] [CrossRef]
- Lin, Y.; Fu, F.; Lv, J.; Wang, M.; Li, Y.; Zhang, J.; Wang, C. Identification of potential key genes for HER-2 positive breast cancer based on bioinformatics analysis. Medicine 2020, 99, e18445. [Google Scholar] [CrossRef]
- Zhou, J.; Yang, R. Identification of key pathways and genes shared between Crohn’s disease and breast cancer using bioinformatics analysis. Oncol. Lett. 2020, 20, 119. [Google Scholar] [CrossRef] [PubMed]
- Lv, Q.; Liu, Y.; Huang, H.; Zhu, M.; Wu, J.; Meng, D. Identification of potential key genes and pathways for inflammatory breast cancer based on GEO and TCGA databases. Onco Targets Ther. 2020, 13, 5541–5550. [Google Scholar] [CrossRef]
- Bai, J.; Luo, Y.; Zhang, S. Microarray data analysis reveals gene expression changes in response to ionizing radiation in MCF7 human breast cancer cells. Hereditas 2020, 157, 1–8. [Google Scholar] [CrossRef] [PubMed]
- Wang, Y.; Li, H.; Ma, J.; Fang, T.; Li, X.; Liu, J.; Afewerky, H.K.; Li, X.; Gao, Q. Integrated Bioinformatics Data Analysis Reveals Prognostic Significance Of SIDT1 In Triple-Negative Breast Cancer. Onco Targets Ther. 2019, 12, 8401–8410. [Google Scholar] [CrossRef]
- Pei, J.; Wang, Y.; Li, Y. Identification of key genes controlling breast cancer stem cell characteristics via stemness indices analysis. J. Transl. Med. 2020, 18, 74. [Google Scholar] [CrossRef]
- Tang, D.; Zhao, X.; Zhang, L.; Wang, Z.; Wang, C. Identification of hub genes to regulate breast cancer metastasis to brain by bioinformatics analyses. J. Cell Biochem. 2019, 120, 9522–9531. [Google Scholar] [CrossRef] [PubMed]
- Qi, L.; Zhou, B.; Chen, J.; Hu, W.; Bai, R.; Ye, C.; Weng, X.; Zheng, S. Significant prognostic values of differentially expressed-aberrantly methylated hub genes in breast cancer. J. Cancer 2019, 10, 6618–6634. [Google Scholar] [CrossRef]
- Wang, Y.; Xu, H.; Zhu, B.; Qiu, Z.; Lin, Z. Systematic identification of the key candidate genes in breast cancer stroma. Cell Mol. Biol. Lett. 2018, 23, 1–15. [Google Scholar] [CrossRef] [PubMed]
- Fang, E.; Zhang, X. Identification of breast cancer hub genes and analysis of prognostic values using integrated bioinformatics analysis. Cancer Biomark. 2017, 21, 169–177. [Google Scholar] [CrossRef]
- Lou, W.; Liu, J.; Ding, B.; Xu, L.; Fan, W. Identification of chemoresistance-associated miRNAs in breast cancer. Cancer Manag. Res. 2018, 10, 4747–4757. [Google Scholar] [CrossRef] [PubMed]
- Bao, C.; Lu, Y.; Chen, J.; Chen, D.; Lou, W.; Ding, B.; Xu, L.; Fan, W. Exploring specific prognostic biomarkers in triple-negative breast cancer. Cell Death Dis. 2019, 10, 807. [Google Scholar] [CrossRef]
- Zhong, G.; Lou, W.; Shen, Q.; Yu, K.; Zheng, Y. Identification of key genes as potential biomarkers for triple-negative breast cancer using integrating genomics analysis. Mol. Med. Rep. 2020, 21, 557–566. [Google Scholar] [CrossRef] [PubMed]
- Wang, Y.; Zhang, Y.; Huang, Q.; Li, C. Integrated bioinformatics analysis reveals key candidate genes and pathways in Breast cancer. Mol. Med. Rep. 2018, 17, 8091–8100. [Google Scholar] [CrossRef] [PubMed]
- Dashti, S.; Taheri, M.; Ghafouri-Fard, S. An in-silico method leads to recognition of hub genes and crucial pathways in survival of patients with breast cancer. Sci. Rep. 2020, 10, 18770. [Google Scholar] [CrossRef]
- Liu, X.; Ma, Y.; Yang, W.; Wu, X.; Jiang, L.; Chen, X. Identification of therapeutic targets for breast cancer using biological informatics methods. Mol. Med. Rep. 2015, 12, 1789–1795. [Google Scholar] [CrossRef]
- Bao, S.; Chen, Y.; Yang, F.; Sun, C.; Yang, M.; Li, W.; Huang, X.; Li, J.; Wu, H.; Yin, Y. Screening and Identification of Key Biomarkers in Acquired Lapatinib-Resistant Breast Cancer. Front. Pharmacol. 2020, 11, 577150. [Google Scholar] [CrossRef] [PubMed]
- Zhang, J.; Zhou, Y.J.; Yu, Z.H.; Chen, A.X.; Yu, Y.; Wang, X.; Cao, X.C. Identification of core genes and clinical roles in pregnancy-associated breast cancer based on integrated analysis of different microarray profile datasets. Biosci. Rep. 2019, 39, BSR20190019. [Google Scholar] [CrossRef] [PubMed]
- Zheng, T.; Wang, A.; Hu, D.; Wang, Y. Molecular mechanisms of breast cancer metastasis by gene expression profile analysis. Mol. Med. Rep. 2017, 16, 4671–4677. [Google Scholar] [CrossRef] [PubMed]
- Hong, Z.; Wang, Q.; Hong, C.; Liu, M.; Qiu, P.; Lin, R.; Lin, X.; Chen, F.; Li, Q.; Liu, L.; et al. Identification of seven cell cycle-related genes with unfavorable prognosis and construction of their TF-miRNA-mRNA regulatory network in breast cancer. J. Cancer 2020, 12, 740–753. [Google Scholar] [CrossRef]
- Zhao, C.H.; Qu, L.; Zhang, H.; Qu, R. Identification of breast cancer-related circRNAs by analysis of microarray and RNA-sequencing data: An observational study. Medicine 2019, 98, e18042. [Google Scholar] [CrossRef]
- Alam, M.S.; Rahaman, M.M.; Sultana, A.; Wang, G.; Mollah, M.N.H. Statistics and network-based approaches to identify molecular mechanisms that drive the progression of breast cancer. Comput. Biol. Med. 2022, 145, 105508. [Google Scholar] [CrossRef]
- Qin, J.; Chen, Y.H. Molecular-level effects of eribulin and paclitaxel on breast cancer based on differential co-expression network analysis. Genet. Mol. Res. 2016, 15. [Google Scholar] [CrossRef]
- Takeshita, T.; Yan, L.; Peng, X.; Kimbung, S.; Hatschek, T.; Hedenfalk, I.A.; Rashid, O.M.; Takabe, K. Transcriptomic and functional pathway features were associated with survival after pathological complete response to neoadjuvant chemotherapy in breast cancer. Am. J. Cancer Res. 2020, 10, 2555–2569. [Google Scholar]
- Wang, Y.W.; Zhang, W.; Ma, R. Bioinformatic identification of chemoresistance-associated microRNAs in breast cancer based on microarray data. Oncol. Rep. 2018, 39, 1003–1010. [Google Scholar] [CrossRef]
- Cai, Y.; Mei, J.; Xiao, Z.; Xu, B.; Jiang, X.; Zhang, Y.; Zhu, Y. Identification of five hub genes as monitoring biomarkers for breast cancer metastasis in silico. Hereditas 2019, 156, 20. [Google Scholar] [CrossRef]
- Fu, Y.; Zhou, Q.Z.; Zhang, X.L.; Wang, Z.Z.; Wang, P. Identification of hub genes using co-expression network analysis in breast cancer as a tool to predict different stages. Med. Sci. Monit. 2019, 25, 8873–8890. [Google Scholar] [CrossRef]
- Li, Y.; Zhou, X.; Liu, J.; Yin, Y.; Yuan, X.; Yang, R.; Wang, Q.; Ji, J.; He, Q. Differentially expressed genes and key molecules of BRCA1/2-mutant breast cancer: Evidence from bioinformatics analyses. PeerJ 2020, 2020, e8403. [Google Scholar] [CrossRef] [PubMed]
- Lv, X.; He, M.; Zhao, Y.; Zhang, L.; Zhu, W.; Jiang, L.; Yan, Y.; Fan, Y.; Zhao, H.; Zhou, S.; et al. Identification of potential key genes and pathways predicting pathogenesis and prognosis for triple-negative breast cancer. Cancer Cell Int. 2019, 19, 172. [Google Scholar] [CrossRef] [PubMed]
- Yuan, C.L.; Jiang, X.M.; Yi, Y.; Jian-Fei, E.; Zhang, N.D.; Luo, X.; Zou, N.; Wei, W.; Liu, Y.Y. Identification of differentially expressed lncRNAs and mRNAs in luminal-B breast cancer by RNA-sequencing. BMC Cancer 2019, 19, 1171. [Google Scholar] [CrossRef]
- He, J.; Yang, J.; Chen, W.; Wu, H.; Yuan, Z.; Wang, K.; Li, G.; Sun, J.; Yu, L. Molecular features of triple negative breast cancer: Microarray evidence and further integrated analysis. PLoS ONE 2015, 10, e0129842. [Google Scholar] [CrossRef]
- Zeng, F.; Fu, J.; Hu, F.; Tang, Y.; Fang, X.; Zeng, F.; Chu, Y. Identification of key pathways and genes in response to trastuzumab treatment in breast cancer using bioinformatics analysis. Oncotarget 2018, 9, 32149–32160. [Google Scholar] [CrossRef]
- Amjad, E.; Asnaashari, S.; Sokouti, B.; Dastmalchi, S. Systems biology comprehensive analysis on breast cancer for identification of key gene modules and genes associated with TNM-based clinical stages. Sci. Rep. 2020, 10, 10816. [Google Scholar] [CrossRef]
- Clough, E.; Barrett, T. The Gene Expression Omnibus database. Methods Mol. Biol. 2016, 1418, 93–110. [Google Scholar] [CrossRef] [PubMed]
- Harrell, J.C.; Olex, A.L.; Dozmorov, M.; Altman, J.; Boyd, D.Z.E. Evaluation of Breast Cancer PDX Tumor Heterogeneity at Single Cell Resolution [scRNA-seq]; NCBI: Bethesda, MD, USA, 2023. [Google Scholar]
- Butler, A.; Hoffman, P.; Smibert, P.; Papalexi, E.; Satija, R. Integrating single-cell transcriptomic data across different conditions, technologies, and species. Nat. Biotechnol. 2018, 36, 411–420. [Google Scholar] [CrossRef]
- Liu, C.J.; Hu, F.F.; Xia, M.X.; Han, L.; Zhang, Q.; Guo, A.Y. GSCALite: A web server for gene set cancer analysis. Bioinformatics 2018, 34, 3771–3772. [Google Scholar] [CrossRef]
- Rey, D.; Neuhäuser, M. Wilcoxon-Signed-Rank Test. In International Encyclopedia of Statistical Science; Springer: Berlin/Heidelberg, Germany, 2011; pp. 1658–1659. [Google Scholar] [CrossRef]
- Ben-Hur, A.; Noble, W.S. Kernel methods for predicting protein-protein interactions. Bioinformatics 2005, 21. [Google Scholar] [CrossRef]
- Franceschini, A.; Szklarczyk, D.; Frankild, S.; Kuhn, M.; Simonovic, M.; Roth, A.; Lin, J.; Minguez, P.; Bork, P.; von Mering, C.; et al. STRING v9.1: Protein-protein interaction networks, with increased coverage and integration. Nucleic Acids Res. 2013, 41, D808–D815. [Google Scholar] [CrossRef] [PubMed]
- Shannon, P.; Markiel, A.; Ozier, O.; Baliga, N.S.; Wang, J.T.; Ramage, D.; Amin, N.; Schwikowski, B.; Ideker, T. Cytoscape: A software Environment for integrated models of biomolecular interaction networks. Genome Res. 2003, 13, 2498–2504. [Google Scholar] [CrossRef]
- Doms, A.; Schroeder, M. GoPubMed: Exploring PubMed with the gene ontology. Nucleic Acids Res. 2005, 33, W783–W786. [Google Scholar] [CrossRef] [PubMed]
- Kanehisa, M.; Goto, S. KEGG: Kyoto Encyclopedia of Genes and Genomes. Nucleic Acids Res. 2000, 28, 27–30. [Google Scholar] [CrossRef] [PubMed]
- Chen, E.Y.; Tan, C.M.; Kou, Y.; Duan, Q.; Wang, Z.; Meirelles, G.V.; Clark, N.R.; Ma’ayan, A. Enrichr: Interactive and collaborative HTML5 gene list enrichment analysis tool. BMC Bioinform. 2013, 14, 128. [Google Scholar] [CrossRef]
- Fornes, O.; Castro-Mondragon, J.A.; Khan, A.; Van Der Lee, R.; Zhang, X.; Richmond, P.A.; Modi, B.P.; Correard, S.; Gheorghe, M.; Baranašić, D.; et al. JASPAR 2020: Update of the open-Access database of transcription factor binding profiles. Nucleic Acids Res. 2020, 48, D87–D92. [Google Scholar] [CrossRef]
- Karagkouni, D.; Paraskevopoulou, M.D.; Chatzopoulos, S.; Vlachos, I.S.; Tastsoglou, S.; Kanellos, I.; Papadimitriou, D.; Kavakiotis, I.; Maniou, S.; Skoufos, G.; et al. DIANA-TarBase v8: A decade-long collection of experimentally supported miRNA-gene interactions. Nucleic Acids Res. 2018, 46, D239–D245. [Google Scholar] [CrossRef]
- Zhou, G.; Soufan, O.; Ewald, J.; Hancock, R.E.W.; Basu, N.; Xia, J. NetworkAnalyst 3.0: A visual analytics platform for comprehensive gene expression profiling and meta-analysis. Nucleic Acids Res. 2019, 47, W234–W241. [Google Scholar] [CrossRef]
- Győrffy, B. Survival analysis across the entire transcriptome identifies biomarkers with the highest prognostic power in breast cancer. Comput. Struct. Biotechnol. J. 2021, 19, 4101–4109. [Google Scholar] [CrossRef]
- Yan, Z.; Wang, Q.; Sun, X.; Ban, B.; Lu, Z.; Dang, Y.; Xie, L.; Zhang, L.; Li, Y.; Zhu, W.; et al. OSbrca: A Web Server for Breast Cancer Prognostic Biomarker Investigation with Massive Data from Tens of Cohorts. Front. Oncol. 2019, 9, 1349. [Google Scholar] [CrossRef]
- NIH. The Cancer Genome Atlas Program; NCI: Bethesda, MD, USA, 2022. [Google Scholar]
- Carithers, L.J.; Moore, H.M. The Genotype-Tissue Expression (GTEx) Project. Biopreserv. Biobank 2015, 13, 307–308. [Google Scholar] [CrossRef] [PubMed]
- Tang, Z.; Kang, B.; Li, C.; Chen, T.; Zhang, Z. GEPIA2: An enhanced web server for large-scale expression profiling and interactive analysis. Nucleic Acids Res. 2019, 47, W556–W560. [Google Scholar] [CrossRef] [PubMed]
- Sing, T.; Sander, O.; Beerenwinkel, N.; Lengauer, T. ROCR: Visualizing classifier performance in R. Bioinformatics 2005, 21, 3940–3941. [Google Scholar] [CrossRef] [PubMed]
- Dalton, W.B.; Yang, V.W. Mitotic origins of chromosomal instability in colorectal cancer. Curr. Color. Cancer Rep. 2007, 3, 59–64. [Google Scholar] [CrossRef]
- Pease, J.C.; Tirnauer, J.S. Mitotic spindle misorientation in cancer–Out of alignment and into the fire. J. Cell Sci. 2011, 124, 1007–1016. [Google Scholar] [CrossRef]
- Berman, H.M.; Westbrook, J.; Feng, Z.; Gilliland, G.; Bhat, T.N.; Weissig, H.; Shindyalov, I.N.; Bourne, P.E. The Protein Data Bank. Nucleic Acids Res. 2000, 28, 235–242. [Google Scholar] [CrossRef]
- Varadi, M.; Anyango, S.; Deshpande, M.; Nair, S.; Natassia, C.; Yordanova, G.; Yuan, D.; Stroe, O.; Wood, G.; Laydon, A.; et al. AlphaFold Protein Structure Database: Massively expanding the structural coverage of protein-sequence space with high-accuracy models. Nucleic Acids Res. 2022, 50, D439–D444. [Google Scholar] [CrossRef]
- Waterhouse, A.; Bertoni, M.; Bienert, S.; Studer, G.; Tauriello, G.; Gumienny, R.; Heer, F.T.; de Beer, T.A.P.; Rempfer, C.; Bordoli, L.; et al. SWISS-MODEL: Homology modelling of protein structures and complexes. Nucleic Acids Res. 2018, 46, W296–W303. [Google Scholar] [CrossRef]
- Kim, S.; Chen, J.; Cheng, T.; Gindulyte, A.; He, J.; He, S.; Li, Q.; Shoemaker, B.A.; Thiessen, P.A.; Yu, B.; et al. PubChem 2019 update: Improved access to chemical data. Nucleic Acids Res. 2019, 47, D1102–9. [Google Scholar] [CrossRef]
- Morris, G.M.; Huey, R.; Lindstrom, W.; Sanner, M.F.; Belew, R.K.; Goodsell, D.S.; Olson, A.J. AutoDock4 and AutoDockTools4: Automated docking with selective receptor flexibility. J. Comput. Chem. 2009, 16, 2785–2791. [Google Scholar] [CrossRef]
- Trott, O.; Olson, A.J. AutoDock Vina: Improving the speed and accuracy of docking with a new scoring function, efficient optimization, and multithreading. J. Comput. Chem. 2009, 31, 455–461. [Google Scholar] [CrossRef]
- Visualizer DS; v4.0.100.13345; Accelrys Software Inc.: San Diego, CA, USA, 2005.
- Hasan, M.M.; Yang, S.; Zhou, Y.; Mollah, M.N.H. SuccinSite: A computational tool for the prediction of protein succinylation sites by exploiting the amino acid patterns and properties. Mol. Biosyst. 2016, 12, 786–795. [Google Scholar] [CrossRef] [PubMed]
- Mu, R.; Ma, Z.; Lu, C.; Wang, H.; Cheng, X.; Tuo, B.; Fan, Y.; Liu, X.; Li, T. Role of succinylation modification in thyroid cancer and breast cancer. Am. J. Cancer Res. 2021, 11, 4683–4699. [Google Scholar] [PubMed]
- Wang, D.; Liu, D.; Yuchi, J.; He, F.; Jiang, Y.; Cai, S.; Li, J.; Xu, D. MusiteDeep: A deep-learning based webserver for protein post-translational modification site prediction and visualization. Nucleic Acids Res. 2021, 48, W140–W146. [Google Scholar] [CrossRef] [PubMed]
- Holstein, E.; Dittmann, A.; Kääriäinen, A.; Pesola, V.; Koivunen, J.; Pihlajaniemi, T.; Naba, A.; Izzi, V. The burden of post-translational modification (Ptm)— disrupting mutations in the tumor matrisome. Cancers 2021, 13, 1081. [Google Scholar] [CrossRef]
- Liu, X.; Zhang, Y.; Wang, Y.; Yang, M.; Hong, F.; Yang, S. Protein phosphorylation in cancer: Role of nitric oxide signaling pathway. Biomolecules 2021, 11, 1009. [Google Scholar] [CrossRef]
- Wang, Y.; Dai, J.; Zeng, Y.; Guo, J.; Lan, J. E3 Ubiquitin Ligases in Breast Cancer Metastasis: A Systematic Review of Pathogenic Functions and Clinical Implications. Front. Oncol. 2021, 11, 752604. [Google Scholar] [CrossRef]
- Van Der Rest, M.; Garrone, R. Collagen family of proteins. FASEB J. 1991, 5, 2814–2823. [Google Scholar] [CrossRef]
- Vázquez-Villa, F.; García-Ocaña, M.; Galván, J.A.; García-Martínez, J.; García-Pravia, C.; Menéndez-Rodríguez, P.; González-del Rey, C.; Barneo-Serra, L.; de Los Toyos, J.R. COL11A1/(pro)collagen 11A1 expression is a remarkable biomarker of human invasive carcinoma-associated stromal cells and carcinoma progression. Tumor Biol. 2015, 36, 2213–2222. [Google Scholar] [CrossRef]
- Raglow, Z.; Thomas, S.M. Tumor matrix protein collagen XIα1 in cancer. Cancer Lett. 2015, 357, 448–453. [Google Scholar] [CrossRef] [PubMed]
- Farmer, P.; Bonnefoi, H.; Anderle, P.; Cameron, D.; Wirapati, P.; Becette, V.; André, S.; Piccart, M.; Campone, M.; Brain, E.; et al. A stroma-related gene signature predicts resistance to neoadjuvant chemotherapy in breast cancer. Nat. Med. 2009, 15, 68–74. [Google Scholar] [CrossRef] [PubMed]
- Brodsky, A.S.; Xiong, J.; Yang, D.; Schorl, C.; Fenton, M.A.; Graves, T.A.; Sikov, W.M.; Resnick, M.B.; Wang, Y. Identification of stromal ColXα1 and tumor-infiltrating lymphocytes as putative predictive markers of neoadjuvant therapy in estrogen receptor-positive/HER2-positive breast cancer. BMC Cancer 2016, 16, 274. [Google Scholar] [CrossRef] [PubMed]
- Makoukji, J.; Makhoul, N.J.; Khalil, M.; El-Sitt, S.; Aldin, E.S.; Jabbour, M.; Boulos, F.; Gadaleta, E.; Sangaralingam, A.; Chelala, C.; et al. Gene expression profiling of breast cancer in Lebanese women. Sci. Rep. 2016, 6, 36639. [Google Scholar] [CrossRef]
- Feng, W.W.; Zuppe, H.T.; Kurokawa, M. The Role of CD36 in Cancer Progression and Its Value as a Therapeutic Target. Cells 2023, 12, 1605. [Google Scholar] [CrossRef]
- Feng, W.W.; Wilkins, O.; Bang, S.; Ung, M.; Li, J.; An, J.; Del Genio, C.; Canfield, K.; DiRenzo, J.; Wells, W.; et al. CD36-Mediated Metabolic Rewiring of Breast Cancer Cells Promotes Resistance to HER2-Targeted Therapies. Cell Rep. 2019, 29, 3405–3420. [Google Scholar] [CrossRef]
- Jing, X.; Cui, X.; Liang, H.; Hao, C.; Yang, Z.; Li, X.; Yang, X.; Han, C. CD24 is a Potential Biomarker for Prognosis in Human Breast Carcinoma. Cell Physiol. Biochem. 2018, 48, 111–119. [Google Scholar] [CrossRef]
- Bai, J.; Zhang, X.; Kang, X.; Jin, L.; Wang, P.; Wang, Z. Screening of core genes and pathways in breast cancer development via comprehensive analysis of multi gene expression datasets. Oncol. Lett. 2019, 18, 5821–5830. [Google Scholar] [CrossRef]
- Guda, M.R.; Asuthkar, S.; Labak, C.M.; Tsung, A.J.; Alexandrov, I.; Mackenzie, M.J.; Prasad, D.V.; Velpula, K.K. Targeting PDK4 inhibits breast cancer metabolism. Am. J. Cancer Res. 2018, 8, 1725–1738. [Google Scholar]
- Walter, W.; Thomalla, J.; Bruhn, J.; Fagan, D.H.; Zehowski, C.; Yee, D.; Skildum, A. Altered regulation of PDK4 expression promotes antiestrogen resistance in human breast cancer cells. Springerplus 2015, 4, 689. [Google Scholar] [CrossRef]
- Chou, C.P.; Huang, N.C.; Jhuang, S.J.; Pan, H.; Ben Peng, N.J.; Cheng, J.T.; Chen, C.F.; Chen, J.J.; Chang, T.H. Ubiquitin-conjugating enzyme UBE2C is highly expressed in breast microcalcification lesions. PLoS ONE 2014, 9, e93934. [Google Scholar] [CrossRef]
- Markant, S.L.; Esparza, L.A.; Sun, J.; Barton, K.L.; McCoig, L.M.; Grant, G.A.; Crawford, J.R.; Levy, M.L.; Northcott, P.A.; Shih, D.; et al. Targeting sonic hedgehog-associated medulloblastoma through inhibition of aurora and polo-like kinases. Cancer Res. 2013, 73, 6310–6322. [Google Scholar] [CrossRef] [PubMed]
- Takaki, T.; Trenz, K.; Costanzo, V.; Petronczki, M. Polo-like kinase 1 reaches beyond mitosis-cytokinesis, DNA damage response, and development. Curr. Opin. Cell Biol. 2008, 20, 650–660. [Google Scholar] [CrossRef] [PubMed]
- Takeshita, T.; Asaoka, M.; Katsuta, E.; Photiadis, S.J.; Narayanan, S.; Yan, L.; Takabe, K. High expression of polo-like kinase 1 is associated with TP53 inactivation, DNA repair deficiency, and worse prognosis in ER positive Her2 negative breast cancer. Am. J. Transl. Res. 2019, 11, 6507–6521. [Google Scholar] [PubMed]
- Elian, F.A.; Yan, E.; Walter, M.A. FOXC1, the new player in the cancer sandbox. Oncotarget 2018, 9, 8165–8178. [Google Scholar] [CrossRef] [PubMed]
- Ray, P.S.; Wang, J.; Qu, Y.; Sim, M.S.; Shamonki, J.; Bagaria, S.P.; Ye, X.; Liu, B.; Elashoff, D.; Hoon, D.S.; et al. FOXC1 is a potential prognostic biomarker with functional significance in basal-like breast cancer. Cancer Res. 2010, 70, 3870–3876. [Google Scholar] [CrossRef]
- Wang, Y.; He, X.; Ngeow, J.; Eng, C. GATA2 negatively regulates PTEN by preventing nuclear translocation of androgen receptor and by androgen-independent suppression of PTEN transcription in breast cancer. Hum. Mol. Genet. 2012, 21, 569–576. [Google Scholar] [CrossRef]
- Lundon, D.J.; Boland, A.; Prencipe, M.; Hurley, G.; O’Neill, A.; Kay, E.; Aherne, S.T.; Doolan, P.; Madden, S.F.; Clynes, M.; et al. The prognostic utility of the transcription factor SRF in docetaxel-resistant prostate cancer: In-vitro discovery and in-vivo validation. BMC Cancer 2017, 17, 163. [Google Scholar] [CrossRef]
- Liu, C.Y.; Chan, S.W.; Guo, F.; Toloczko, A.; Cui, L.; Hong, W. MRTF/SRF dependent transcriptional regulation of TAZ in breast cancer cells. Oncotarget 2016, 7, 13706. [Google Scholar] [CrossRef]
- Zhao, X.; He, L.; Li, T.; Lu, Y.; Miao, Y.; Liang, S.; Guo, H.; Bai, M.; Xie, H.; Luo, G.; et al. SRF expedites metastasis and modulates the epithelial to mesenchymal transition by regulating miR-199a-5p expression in human gastric cancer. Cell Death Differ. 2014, 21, 1900–1913. [Google Scholar] [CrossRef]
- Zhou, S.; Huang, Q.; Zheng, S.; Lin, K.; You, J.; Zhang, X. miR-27a regulates the sensitivity of breast cancer cells to cisplatin treatment via BAK-SMAC/DIABLO-XIAP axis. Tumor Biol. 2016, 37, 6837–6845. [Google Scholar] [CrossRef] [PubMed]
- Li, E.; Han, K.; Zhou, X. MicroRNA-27a-3p down-regulation inhibits malignant biological behaviors of ovarian cancer by targeting BTG1. Open Med 2019, 14, 577–585. [Google Scholar] [CrossRef]
- Ma, Y.; Yu, S.; Zhao, W.; Lu, Z.; Chen, J. MiR-27a regulates the growth, colony formation and migration of pancreatic cancer cells by targeting Sprouty2. Cancer Lett. 2010, 298, 150–158. [Google Scholar] [CrossRef] [PubMed]
- Liu, T.; Tang, H.; Lang, Y.; Liu, M.; Li, X. MicroRNA-27a functions as an oncogene in gastric adenocarcinoma by targeting prohibitin. Cancer Lett. 2009, 273, 233–242. [Google Scholar] [CrossRef] [PubMed]
- Ghafouri-Fard, S.; Khoshbakht, T.; Hussen, B.M.; Abdullah, S.T.; Taheri, M.; Samadian, M. A review on the role of mir-16-5p in the carcinogenesis. Cancer Cell Int. 2022, 22, 342. [Google Scholar] [CrossRef]
- Pasculli, B.; Barbano, R.; Fontana, A.; Biagini, T.; Di Viesti, M.P.; Rendina, M.; Valori, V.M.; Morritti, M.; Bravaccini, S.; Ravaioli, S.; et al. Hsa-miR-155-5p Up-Regulation in Breast Cancer and Its Relevance for Treatment With Poly[ADP-Ribose] Polymerase 1 (PARP-1) Inhibitors. Front. Oncol. 2020, 10, 1415. [Google Scholar] [CrossRef]
- Lashen, A.; Toss, M.S.; Alsaleem, M.; Green, A.R.; Mongan, N.P.; Rakha, E. The characteristics and clinical significance of atypical mitosis in breast cancer. Mod. Pathol. 2022, 35, 1341–1348. [Google Scholar] [CrossRef]
- Krasin, M.J.; Davidoff, A.M. Principles of Pediatric Oncology, Genetics of Cancer, and Radiation Therapy. In Pediatr Surgery, 2-Volume Set Expert Consult; Online Print; Elsevier: Amsterdam, The Netherlands, 2012; pp. 397–416. [Google Scholar] [CrossRef]
- Ortega, M.A.; Fraile-Martínez, O.; Asúnsolo, Á.; Buján, J.; García-Honduvilla, N.; Coca, S. Signal Transduction Pathways in Breast Cancer: The Important Role of PI3K/Akt/mTOR. J. Oncol. 2020, 2020. [Google Scholar] [CrossRef]
- Monaco, M.E. Fatty acid metabolism in breast cancer subtypes. Oncotarget 2017, 8, 29487–29500. [Google Scholar] [CrossRef] [PubMed]
- Mo, L.; Liu, J.; Yang, Z.; Gong, X.; Meng, F.; Zou, R.; Hou, L.; Fang, F. DNAJB4 identified as a potential breast cancer marker: Evidence from bioinformatics analysis and basic experiments. Gland. Surg. 2020, 9, 1955–1972. [Google Scholar] [CrossRef]
- Zhao, X.; Guo, X.; Jiao, D.; Zhu, J.; Xiao, H.; Yang, Y.; Zhao, S.; Zhang, J.; Jiao, F.; Liu, Z. Analysis of the expression profile of serum exosomal lncRNA in breast cancer patients. Ann. Transl. Med. 2021, 9, 1382. [Google Scholar] [CrossRef] [PubMed]
- Buergy, D.; Wenz, F.; Groden, C.; Brockmann, M.A. Tumor-platelet interaction in solid tumors. Int. J. Cancer 2012, 130, 2747–2760. [Google Scholar] [CrossRef] [PubMed]
- Vangenderen, C.; Harkness, T.A.A.; Arnason, T.G. The role of Anaphase Promoting Complex activation, inhibition and substrates in cancer development and progression. Aging 2020, 12, 15818–15855. [Google Scholar] [CrossRef] [PubMed]
- Melloy, P.G. The anaphase-promoting complex: A key mitotic regulator associated with somatic mutations occurring in cancer. Genes Chromosom. Cancer 2020, 59, 189–202. [Google Scholar] [CrossRef]
- Thu, K.L.; Silvester, J.; Elliott, M.J.; Ba-alawi, W.; Duncan, M.H.; Elia, A.C.; Mer, A.S.; Smirnov, P.; Safikhani, Z.; Haibe-Kains, B.; et al. Disruption of the anaphase-promoting complex confers resistance to TTK inhibitors in triple-negative breast cancer. Proc. Natl. Acad. Sci. USA 2018, 115, E1570–E1577. [Google Scholar] [CrossRef]
- Henke, E.; Nandigama, R.; Ergün, S. Extracellular Matrix in the Tumor Microenvironment and Its Impact on Cancer Therapy. Front. Mol. Biosci. 2020, 6, 160. [Google Scholar] [CrossRef]
- Walker, C.; Mojares, E.; Del Río Hernández, A. Role of extracellular matrix in development and cancer progression. Int. J. Mol. Sci. 2018, 19, 3028. [Google Scholar] [CrossRef]
- Oskarsson, T. Extracellular matrix components in breast cancer progression and metastasis. Breast 2013, 22, S66–S72. [Google Scholar] [CrossRef]
- Lepucki, A.; Orlińska, K.; Mielczarek-Palacz, A.; Kabut, J.; Olczyk, P.; Komosińska-Vassev, K. The Role of Extracellular Matrix Proteins in Breast Cancer. J. Clin. Med. 2022, 11, 1250. [Google Scholar] [CrossRef]
- Hynes, N.E. Tyrosine kinase signalling in breast cancer. Breast Cancer Res. 2000, 2, 154–157. [Google Scholar] [CrossRef]
- Templeton, A.J.; Diez-Gonzalez, L.; Ace, O.; Vera-Badillo, F.; Šeruga, B.; Jordán, J.; Amir, E.; Pandiella, A.; Ocaña, A. Prognostic relevance of receptor tyrosine kinase expression in breast cancer: A meta-analysis. Cancer Treat. Rev. 2014, 40, 1048–1055. [Google Scholar] [CrossRef]
- Xiao, Q.; Zhou, Y.; Lauschke, V.M. Impact of variants in ATP-binding cassette transporters on breast cancer treatment. Pharmacogenomics 2020, 21, 1299–1310. [Google Scholar] [CrossRef] [PubMed]
- de Kruijf, E.M.; Dekker, T.J.A.; Hawinkels, L.J.A.C.; Putter, H.; Smit, V.T.H.B.M.; Kroep, J.R.; Kuppen, P.J.K.; van de Velde, C.J.H.; Ten Dijke, P.; Tollenaar, R.A.E.M.; et al. The prognostic role of TGF-β signaling pathway in breast cancer patients. Ann. Oncol. 2013, 24, 384–390. [Google Scholar] [CrossRef] [PubMed]
- Li, J.; Han, X. Adipocytokines and breast cancer. Curr. Probl. Cancer 2018, 42, 208–214. [Google Scholar] [CrossRef]
- Wang, Y.Y.; Hung, A.C.; Lo, S.; Yuan, S.S.F. Adipocytokines visfatin and resistin in breast cancer: Clinical relevance, biological mechanisms, and therapeutic potential. Cancer Lett. 2021, 498, 229–239. [Google Scholar] [CrossRef]
- Goodwin, P. Insulin resistance in breast cancer: Relevance and clinical implications. Breast Cancer Res. 2011, 13, O7. [Google Scholar] [CrossRef]
- Keerthana, C.K.; Rayginia, T.P.; Shifana, S.C.; Anto, N.P.; Kalimuthu, K.; Isakov, N.; Anto, R.J. The role of AMPK in cancer metabolism and its impact on the immunomodulation of the tumor microenvironment. Front. Immunol. 2023, 14, 1114582. [Google Scholar] [CrossRef]
- Li, X.; Wang, L.; Zhou, X.E.; Ke, J.; De Waal, P.W.; Gu, X.; Tan, M.H.; Wang, D.; Wu, D.; Xu, H.E.; et al. Structural basis of AMPK regulation by adenine nucleotides and glycogen. Cell Res. 2015, 25, 50–66. [Google Scholar] [CrossRef]
- Shapovalov, V.; Kopanitsa, L.; Pruteanu, L.L.; Ladds, G.; Bailey, D.S. Transcriptomics-based phenotypic screening supports drug discovery in human glioblastoma cells. Cancers 2021, 13, 3780. [Google Scholar] [CrossRef] [PubMed]
- Hossain, M.T.; Reza, M.S.; Peng, Y.; Feng, S.; Wei, Y. Identification of Key Genes as Potential Drug Targets for Gastric Cancer. Tsinghua Sci. Technol. 2023, 28, 649–664. [Google Scholar] [CrossRef]
- Hossen, M.A.; Reza, M.S.; Harun-Or-Roshid, M.; Islam, M.A.; Siddika, M.A.; Mollah, M.N.H. Identification of Drug Targets and Agents Associated with Hepatocellular Carcinoma through Integrated Bioinformatics Analysis. Curr. Cancer Drug Targets 2023, 23, 547–563. [Google Scholar] [CrossRef]
- Mosharaf, M.P.; Reza, M.S.; Gov, E.; Mahumud, R.A.; Mollah, M.N.H. Disclosing Potential Key Genes, Therapeutic Targets and Agents for Non-Small Cell Lung Cancer: Evidence from Integrative Bioinformatics Analysis. Vaccines 2022, 10, 771. [Google Scholar] [CrossRef] [PubMed]
- Yu, H.; Choo, S.; Park, J.; Jung, J.; Kang, Y.; Lee, D. Prediction of drugs having opposite effects on disease genes in a directed network. BMC Syst. Biol. 2016, 10. [Google Scholar] [CrossRef] [PubMed]
- Woll, P.J.; Ranson, M.; Margison, J.; Thomson, Y.; Van Der Water, L.; George, N.; Howell, A. Suramin for breast and prostate cancer: A pilot study of intermittent short infusions without adaptive control. Ann. Oncol. 1994, 5, 597–600. [Google Scholar] [CrossRef] [PubMed]
- Soyano, A.E.; Reynolds, G.; Moreno-Aspitia, A.; Chumsri, S. Rifaximin for pertuzumab-related GI toxicities. Front. Oncol. 2017, 7, 168. [Google Scholar] [CrossRef] [PubMed]
- Godugu, C.; Patel, A.R.; Marepally, S.; Doddapaneni, R.; Sachdeva, M.S.; Chougule, M.B. Abstract 2139: Effect of telmisartan on triple negative breast cancer (TNBC) and lung cancer tumor progression and intratumoral distribution of nanoparticles. Cancer Res. 2013, 73, 2139. [Google Scholar] [CrossRef]
- Kecel-Gunduz, S.; Budama-Kilinc, Y.; Gok, B.; Bicak, B.; Akman, G.; Arvas, B.; Aydogan, F.; Yolacan, C. Computer-aided anticancer drug design: In vitro and in silico studies of new iminocoumarin derivative. J. Mol. Struct. 2021, 1239, 130539. [Google Scholar] [CrossRef]
- Murthy, R.K.; Loi, S.; Okines, A.; Paplomata, E.; Hamilton, E.; Hurvitz, S.A.; Lin, N.U.; Borges, V.; Abramson, V.; Anders, C.; et al. Tucatinib, Trastuzumab, and Capecitabine for HER2-Positive Metastatic Breast Cancer. N. Engl. J. Med. 2020, 382, 597–609. [Google Scholar] [CrossRef]
- Xie, J.; Zou, Y.; Gao, T.; Xie, L.; Tan, D.; Xie, X. Therapeutic Landscape of Human Epidermal Growth Factor Receptor 2–Positive Breast Cancer. Cancer Control 2022, 29, 199–216. [Google Scholar] [CrossRef]
- Tutt, A.N.J.; Garber, J.E.; Kaufman, B.; Viale, G.; Fumagalli, D.; Rastogi, P.; Gelber, R.D.; de Azambuja, E.; Fielding, A.; Balmaña, J.; et al. Adjuvant Olaparib for Patients with BRCA1–or BRCA2 -Mutated Breast Cancer. N. Engl. J. Med. 2021, 384, 2394–2405. [Google Scholar] [CrossRef]
- Zhang, M.; Zhang, L.; Hei, R.; Li, X.; Cai, H.; Wu, X.; Zheng, Q.; Cai, C. CDK inhibitors in cancer therapy, an overview of recent development. Am. J. Cancer Res. 2021, 11, 1913–1935. [Google Scholar] [PubMed]
- Drugs Approved for Breast Cancer. (2023, February 10). National Cancer Institute. Available online: https://www.cancer.gov/about-cancer/treatment/drugs/breast (accessed on 1 July 2023).


| Degree (A) | Closeness (B) | Betweenness (C) | HubGs (A∪B∪C) |
|---|---|---|---|
| PLK1 CD36 COL10A1 CD24 PDK4 | PLK1 CD36 PDK4 COL10A1 COL11A1 | PLK1 PDK4 UBE2C COL10A1 ACACB | COL11A1, COL10A1, CD36, ACACB, PDK4, CD24, PLK1, UBE2C |
| Term | Count | Adj p-Value | Hub Genes |
|---|---|---|---|
| Biological Process | |||
| GO:1904666~Regulation of Ubiquitin Protein Ligase Activity | 2 | 0.002 | UBE2C, PLK1 |
| GO:1901990~Regulation of Mitotic Cell Cycle Phase Transition | 2 | 0.018 | UBE2C, PLK1 |
| GO:0043062~Extracellular Structure Organization | 2 | 0.021 | COL11A1, COL10A1 |
| GO:0006631~Fatty Acid Metabolic Process | 2 | 0.023 | CD36, ACACB |
| GO:0009966~Regulation Of Signal Transduction | 2 | 0.030 | CD36, CD24 |
| Cellular Component | |||
| GO:0045121~Membrane Raft | 2 | 0.048 | CD36, CD24 |
| GO:0005788~Endoplasmic Reticulum Lumen | 2 | 0.048 | COL11A1, COL10A1 |
| GO:0031092~Platelet Alpha Granule Membrane | 1 | 0.048 | CD36 |
| GO:0005680~Anaphase-Promoting Complex | 1 | 0.048 | UBE2C |
| GO:0062023~Collagen-Containing Extracellular Matrix | 2 | 0.048 | COL11A1, COL10A1 |
| Molecular Function | |||
| GO:0030296~Protein Tyrosine Kinase Activator Activity | 2 | 0.0013 | CD36, CD24 |
| GO:0030295~Protein Kinase Activator Activity | 1 | 0.006 | CD36, CD24 |
| GO:0005524~ATP Binding | 2 | 0.029 | PLK1, PDK4 |
| GO:0050431~Transforming Growth Factor Beta Binding | 1 | 0.030 | CD36 |
| GO:0061631~Ubiquitin Conjugating Enzyme Activity | 1 | 0.030 | UBE2C |
| KEGG Pathways | |||
| Adipocytokine signaling pathway | 2 | 0.004 | CD36, ACACB |
| Protein digestion and absorption | 2 | 0.004 | COL11A1, COL10A1 |
| Insulin resistance | 2 | 0.004 | CD36, ACACB |
| AMPK signaling pathway | 2 | 0.004 | CD36, ACACB |
| Fatty acid biosynthesis | 1 | 0.024 | ACACB |
| Top Three Ligands | Succinylated Sites of ACACB Protein | ||||||||||
|---|---|---|---|---|---|---|---|---|---|---|---|
| K83 | K158 | K228 | K305 | K435 | K722 | K1264 | K1449 | K1469 | K1473 | K2246 | |
| Suramin | −9 | −13.1 | −8.2 | −8.1 | −12.1 | −8.3 | −8.2 | −8.4 | −7.8 | −8.7 | −6.7 |
| Rifaximin | −9.2 | −8.5 | −12.1 | −9 | −8.7 | −7.1 | −7.3 | −6.9 | −6.8 | −8.8 | −8.2 |
| Telmisartan | −9 | −7.1 | −8.2 | −6.9 | −7.1 | −7.3 | −9.5 | −8.8 | −8.3 | −7.2 | −8.1 |
| Top three ligands | Succinylated sites of PDK4 protein | Succinylated sites of CD36 protein | |||||||||
| K142 | K213 | K218 | K223 | K231 | K286 | K403 | K406 | ||||
| Suramin | −9.5 | −7.5 | −8.2 | −7.5 | −8.1 | −9.5 | −9 | −7.1 | |||
| Rifaximin | −7.6 | −8.2 | −10.2 | −8.4 | −8.3 | −7.2 | −6.9 | −7.7 | |||
| Telmisartan | −5.3 | −7.5 | −7.3 | −8.2 | −9 | −9.5 | −9.1 | −8.5 | |||
| Top three ligands | Phosphorylated sites of ACACB protein | ||||||||||
| S302 | S350 | T70 | S72 | S175 | S195 | S246 | S469 | S1360 | T2025 | ||
| Suramin | −10 | −7.2 | −7.1 | −8.5 | −12.1 | −6.2 | −5.6 | −9.1 | −8.2 | −7.5 | |
| Rifaximin | −8.3 | −5.3 | −8.1 | −9.1 | −8.7 | −12.1 | −8 | −8.2 | −7.6 | −9.1 | |
| Telmisartan | −8 | −10 | −7 | −7.1 | −8.8 | −7.9 | −7.8 | −7.3 | −9 | −11.1 | |
| Top three ligands | Phosphorylated sites of PDK4 protein | Phosphorylated sites of CD36 protein | |||||||||
| S10 | S13 | S33 | S106 | S222 | T316 | S390 | S302 | S350 | |||
| Suramin | −8.1 | −7.6 | −8.8 | −7.7 | −8.3 | −8.9 | −7.2 | −7.3 | −9.5 | ||
| Rifaximin | −8.8 | −8.2 | −7.5 | −8.1 | −8.1 | −9.1 | −6.8 | −11.2 | −8.7 | ||
| Telmisartan | −7.2 | −8.7 | −7.9 | −12.1 | −7 | −7.1 | −8.4 | −9 | −7.9 | ||
| Top three ligands | Uubiquitinated sites of ACACB protein | ||||||||||
| S302 | S350 | T70 | S72 | S175 | S195 | S246 | S469 | S1360 | T2025 | ||
| Suramin | −9.2 | −7.8 | −8.1 | −8 | −9.2 | −7.4 | −8.1 | −8.1 | −9 | −7 | |
| Rifaximin | −7.1 | −8.5 | −8.9 | −7.1 | −8.5 | −6.7 | −8.8 | −7.9 | −8.7 | −8.4 | |
| Telmisartan | −8.3 | −8.9 | −8.1 | −7.5 | −8.5 | −8.1 | −5.6 | −10 | −7.2 | −6.9 | |
| Top three ligands | Ubiquitination sites of PDK4 protein | Ubiquitinated sites of CD36 protein | |||||||||
| S10 | S13 | S33 | S106 | S222 | T316 | S390 | S302 | S350 | |||
| Suramin | −7.8 | −7.3 | −10.2 | −9.1 | −6.8 | −8.1 | −9.1 | −8.8 | −8.2 | ||
| Rifaximin | −7 | −9.5 | −8 | −5.6 | −8.8 | −9.1 | −8.7 | −8.5 | −7.3 | ||
| Telmisartan | −7.3 | −7.9 | −7.8 | −7.7 | −8.9 | −7.1 | −8.8 | S302 | S350 | ||
| Protein and Ligand | Binding Affinity (kCal/mol) | The 3D View of Complex | Protein and Ligand Interaction | Interacting Amino Acids | |
|---|---|---|---|---|---|
| Hydrogen Bond | Hydrophobic Interactions | ||||
| PDK4 and Rifaximin | −11 |  |  | LYS257, UNL1, LEU306, GLU254 | LEU255, HIS250 |
| ACACB and Suramin | −9 |  |  | ASP257, ARG258, UNL1, LYS274, SER278, TRP282, TRP348, ARG258, PHE254, ILE279 | TRP282, UNL1, ILE260, ILE293, VAL251, ILE279 |
| CD36 and Telmisartan | −8.6 |  |  | UNL1, PHE201 | UNL1, TRP180, ALA120, ARG176, ALA132, ARG176 |
Disclaimer/Publisher’s Note: The statements, opinions and data contained in all publications are solely those of the individual author(s) and contributor(s) and not of MDPI and/or the editor(s). MDPI and/or the editor(s) disclaim responsibility for any injury to people or property resulting from any ideas, methods, instructions or products referred to in the content. |
© 2023 by the authors. Licensee MDPI, Basel, Switzerland. This article is an open access article distributed under the terms and conditions of the Creative Commons Attribution (CC BY) license (https://creativecommons.org/licenses/by/4.0/).
Share and Cite
Tuly, K.F.; Hossen, M.B.; Islam, M.A.; Kibria, M.K.; Alam, M.S.; Harun-Or-Roshid, M.; Begum, A.A.; Hasan, S.; Mahumud, R.A.; Mollah, M.N.H. Robust Identification of Differential Gene Expression Patterns from Multiple Transcriptomics Datasets for Early Diagnosis, Prognosis, and Therapies for Breast Cancer. Medicina 2023, 59, 1705. https://doi.org/10.3390/medicina59101705
Tuly KF, Hossen MB, Islam MA, Kibria MK, Alam MS, Harun-Or-Roshid M, Begum AA, Hasan S, Mahumud RA, Mollah MNH. Robust Identification of Differential Gene Expression Patterns from Multiple Transcriptomics Datasets for Early Diagnosis, Prognosis, and Therapies for Breast Cancer. Medicina. 2023; 59(10):1705. https://doi.org/10.3390/medicina59101705
Chicago/Turabian StyleTuly, Khanis Farhana, Md. Bayazid Hossen, Md. Ariful Islam, Md. Kaderi Kibria, Md. Shahin Alam, Md. Harun-Or-Roshid, Anjuman Ara Begum, Sohel Hasan, Rashidul Alam Mahumud, and Md. Nurul Haque Mollah. 2023. "Robust Identification of Differential Gene Expression Patterns from Multiple Transcriptomics Datasets for Early Diagnosis, Prognosis, and Therapies for Breast Cancer" Medicina 59, no. 10: 1705. https://doi.org/10.3390/medicina59101705