
Dual-Energy CT-Based Bone Mineral Density Has Practical Value for Osteoporosis Screening around the Knee

 , , , ,
Abstract
:1. Introduction
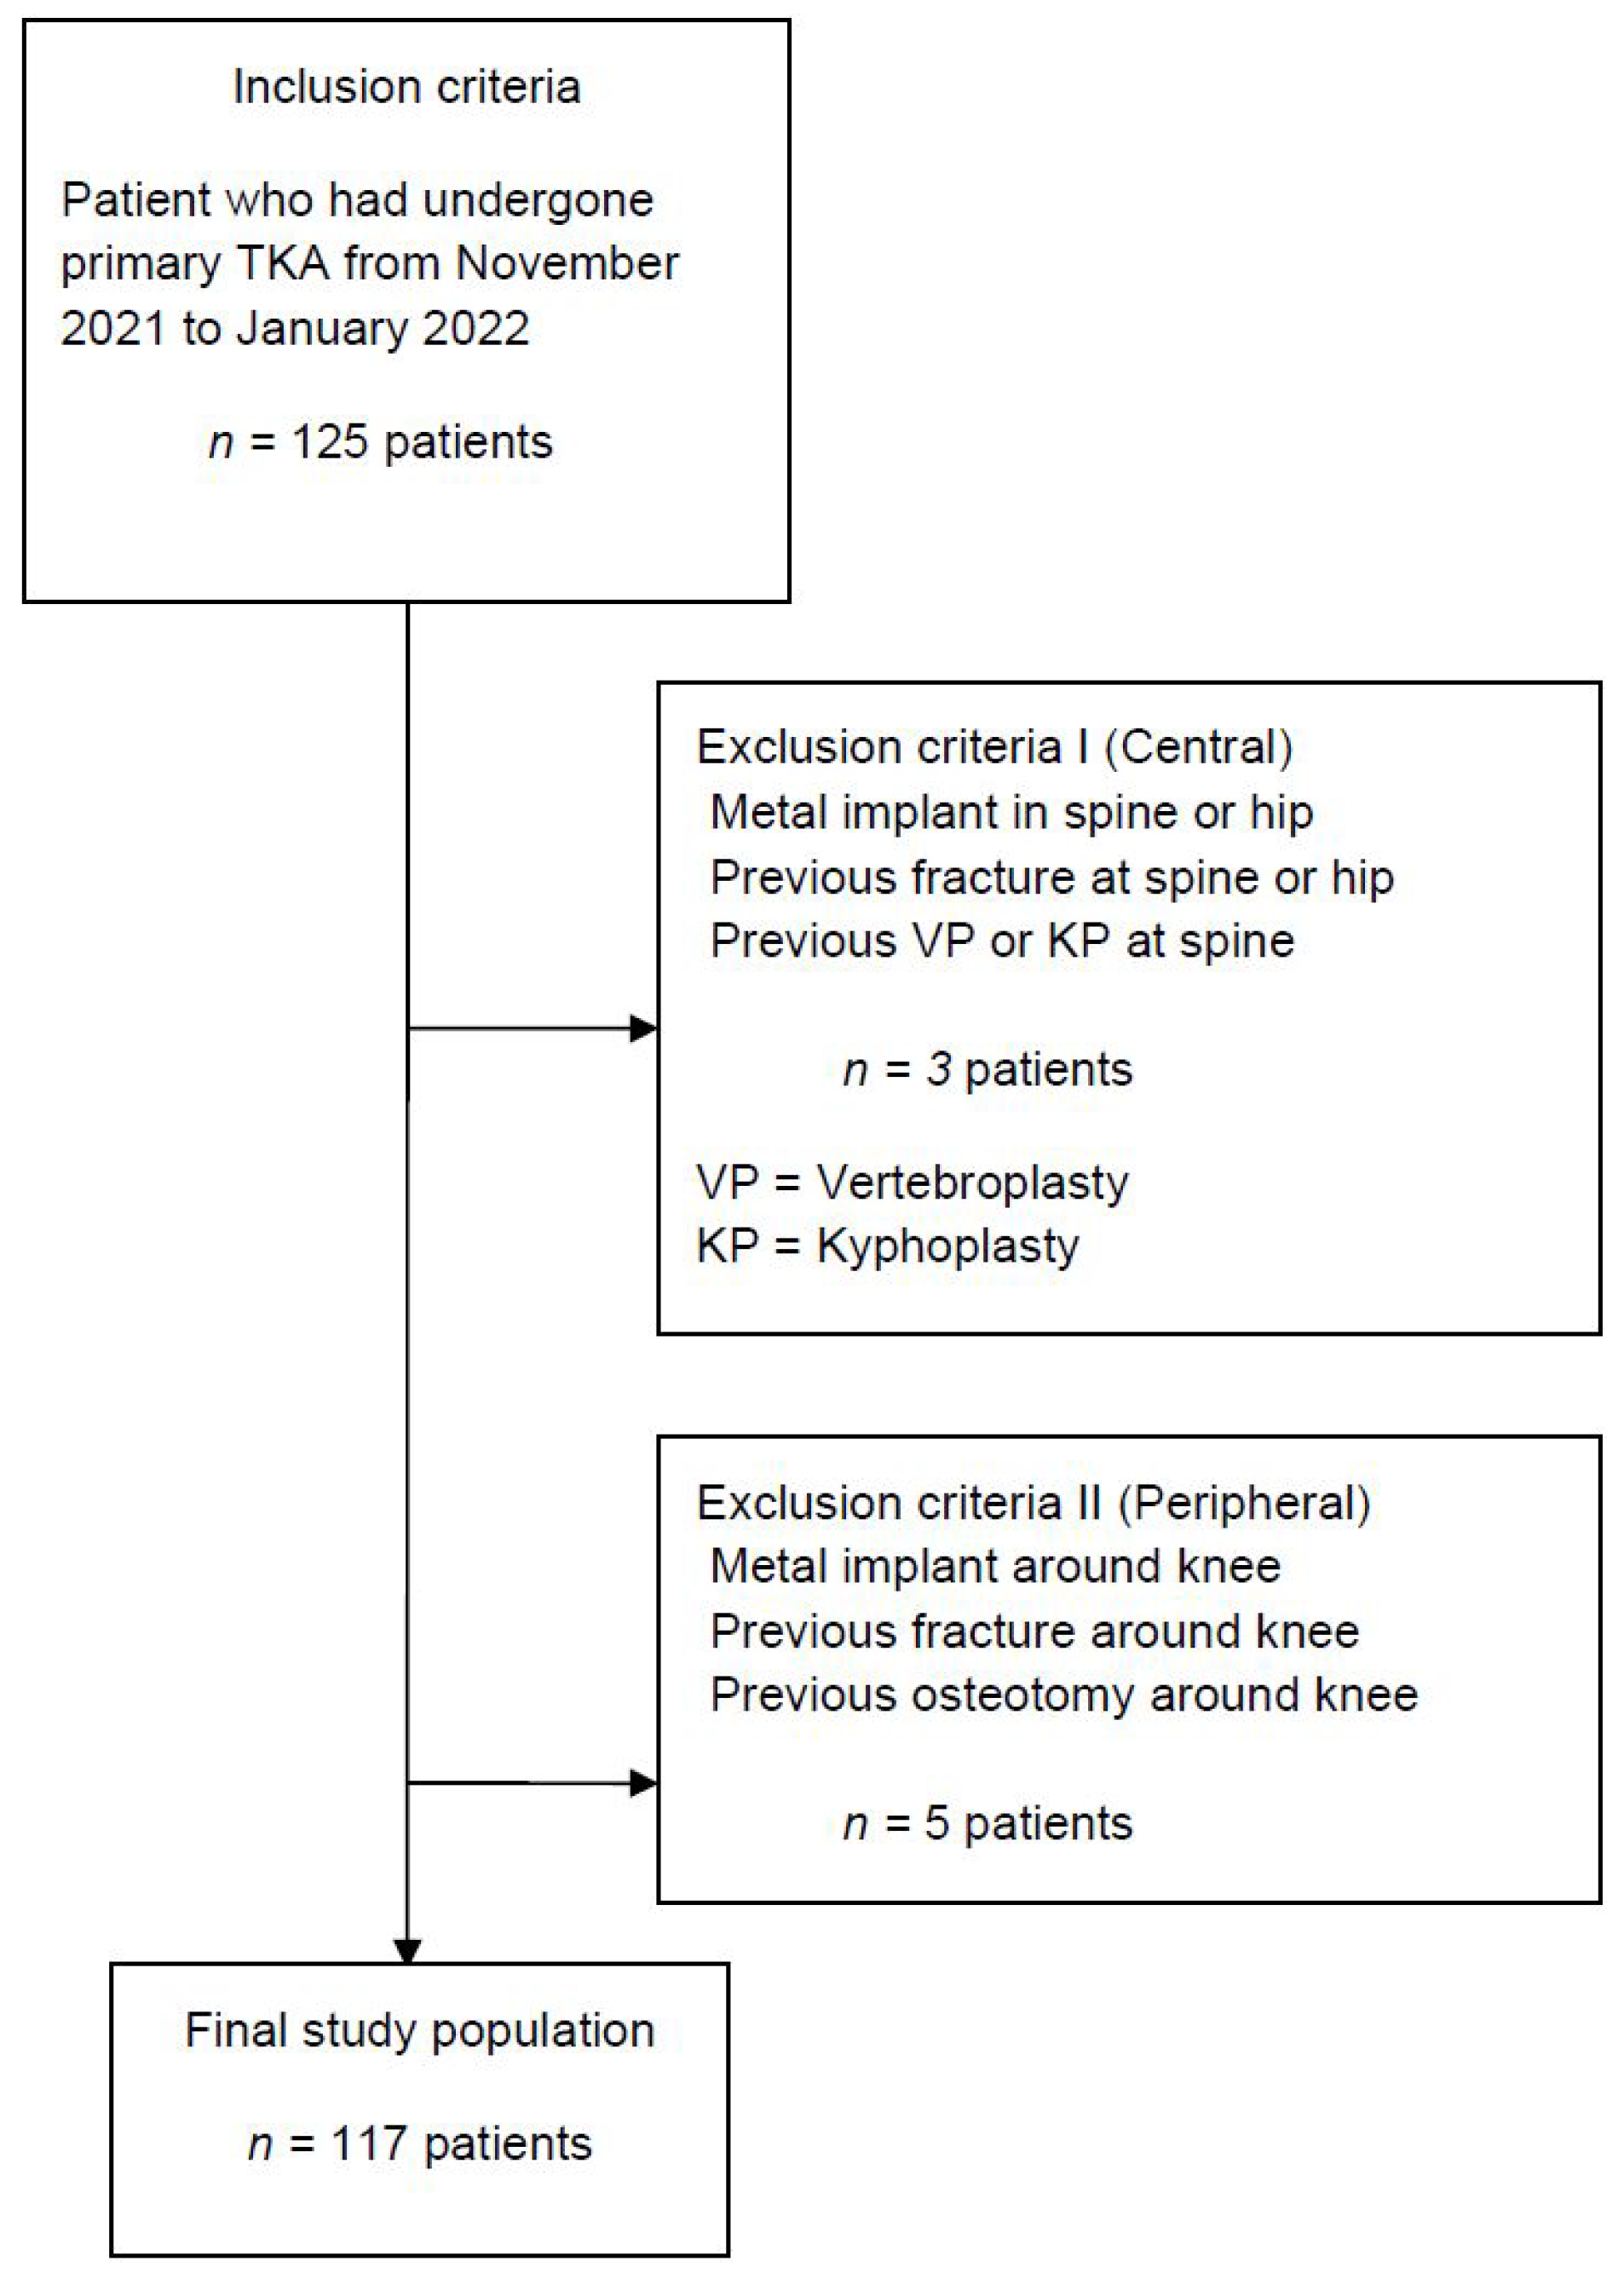
2. Material and Methods
Statistical Analysis
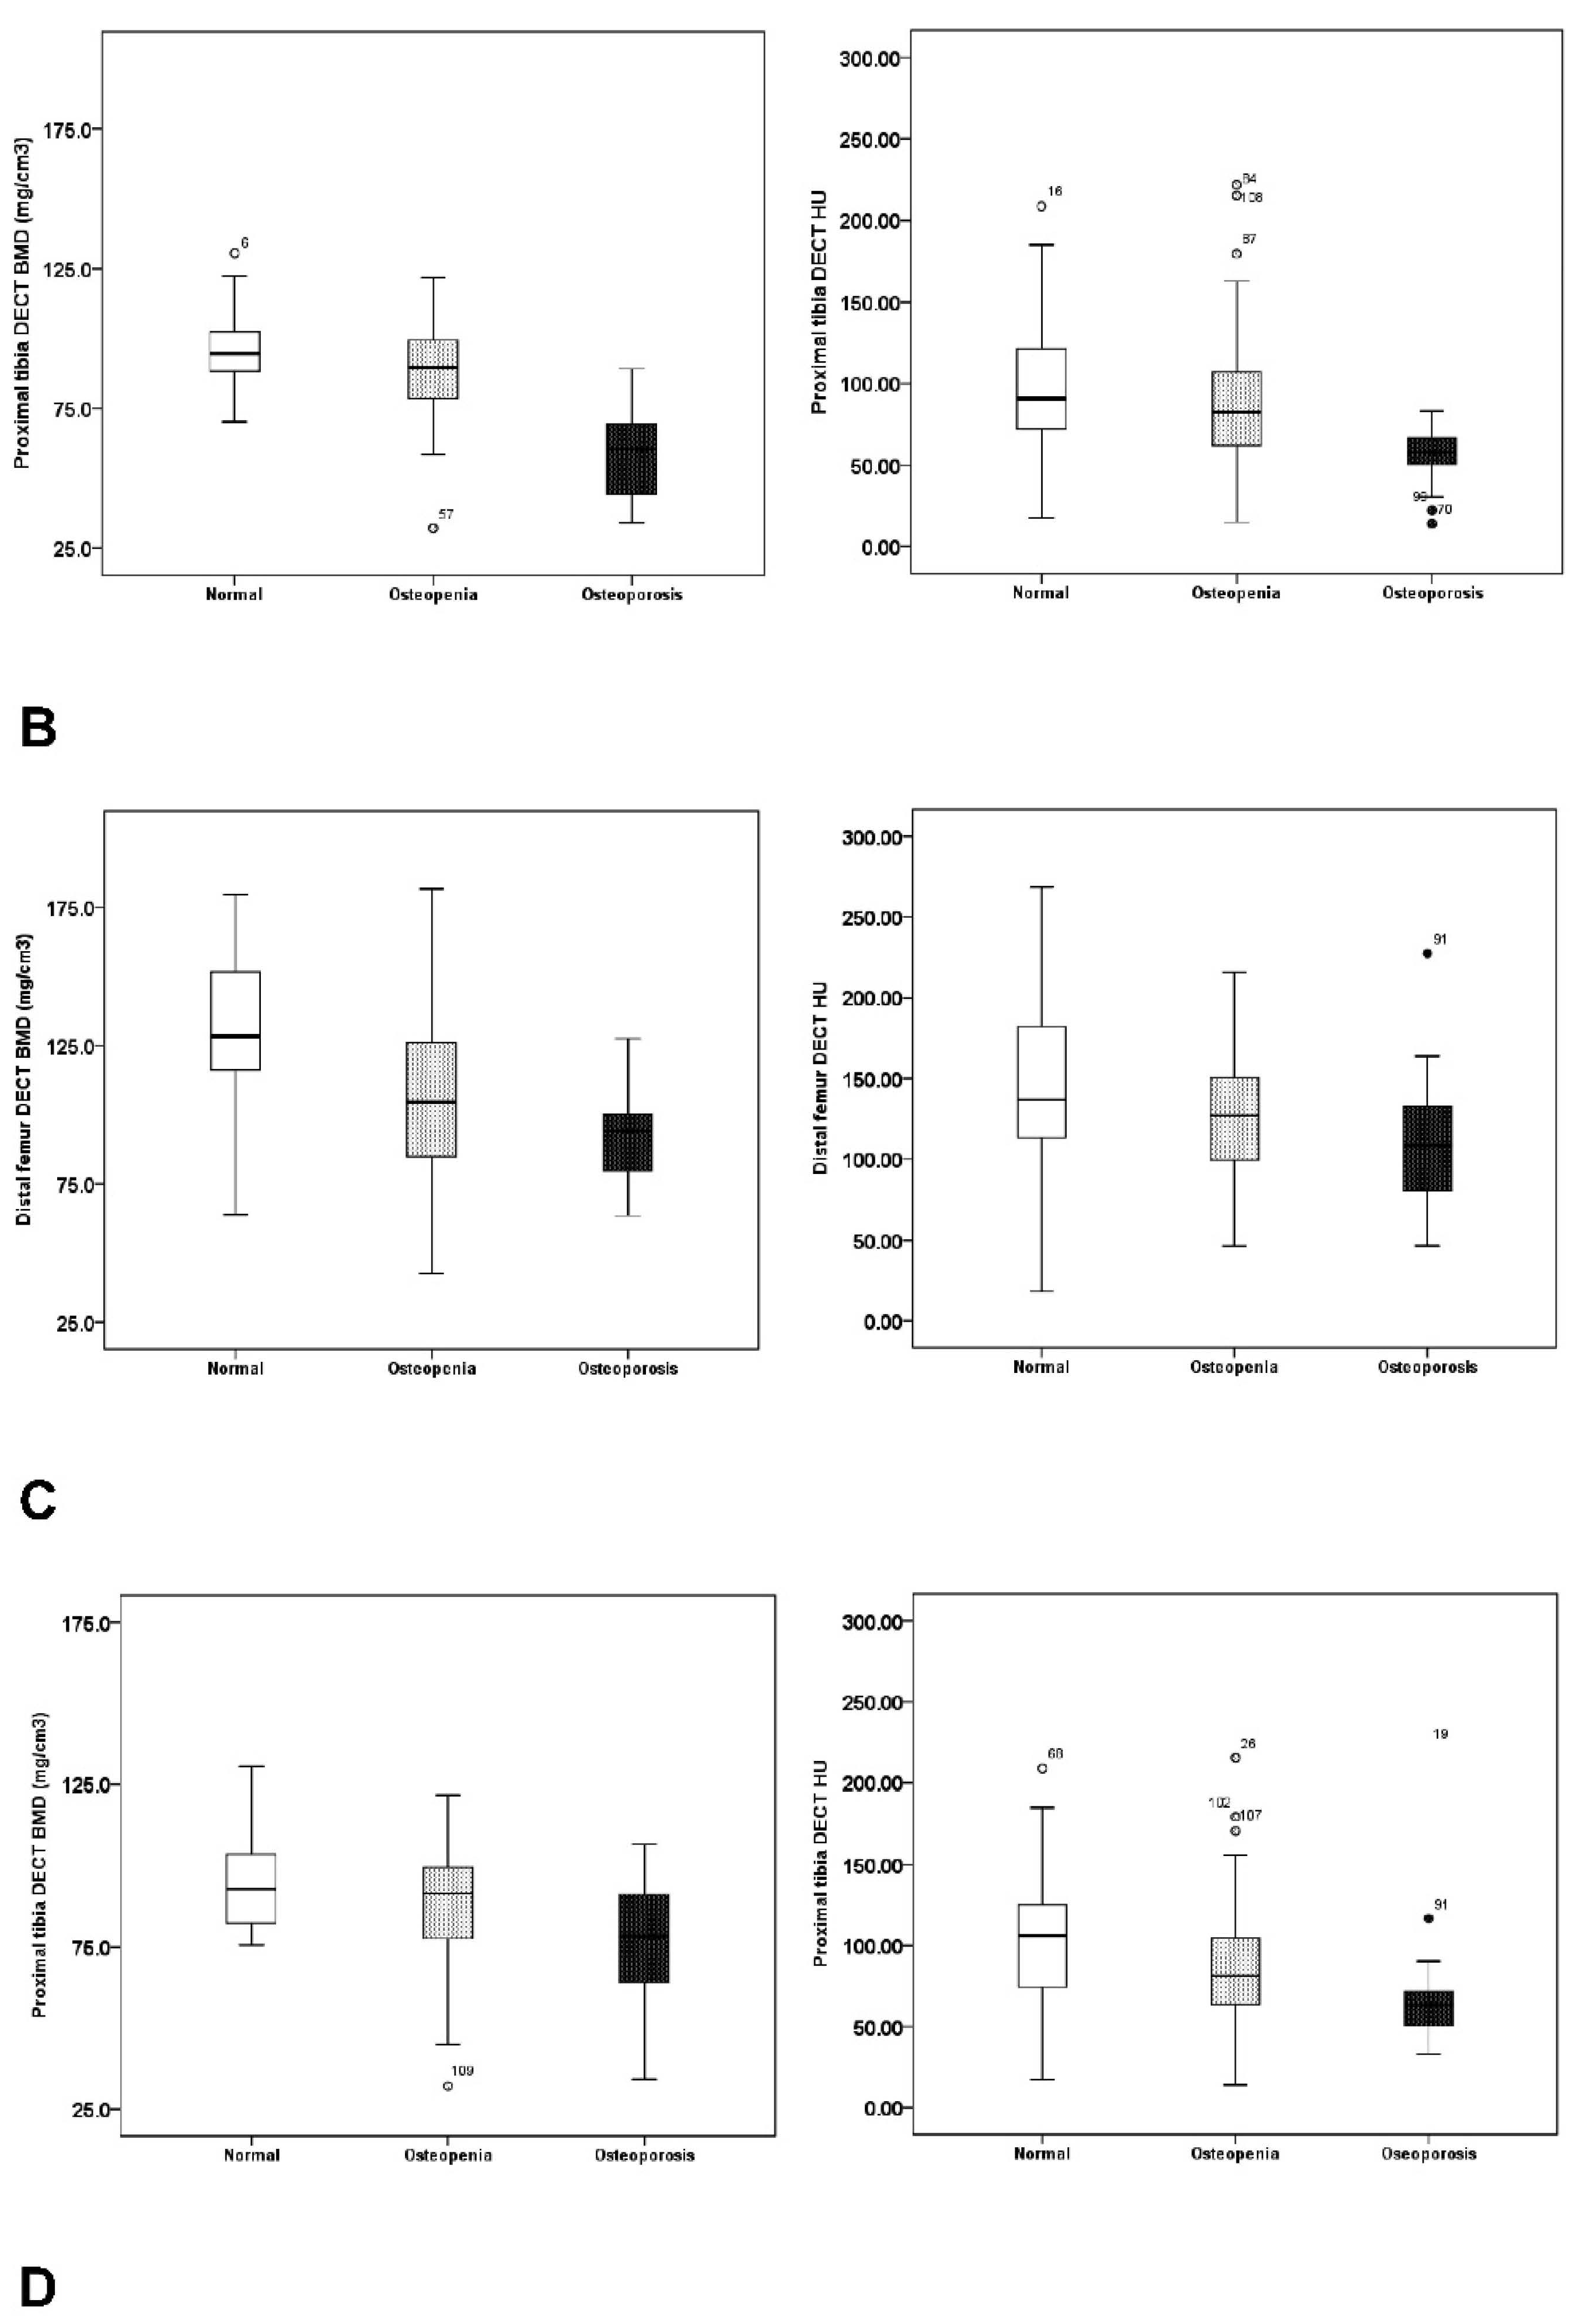
3. Results
4. Discussion
5. Conclusions
Author Contributions
Funding
Institutional Review Board Statement
Informed Consent Statement
Data Availability Statement
Acknowledgments
Conflicts of Interest
References
- Shah, S.H.; Schwartz, B.E.; Schwartz, A.R.; Goldberg, B.A.; Chmell, S.J. Total Knee Arthroplasty in the Younger Patient. J. Knee Surg. 2017, 30, 555–559. [Google Scholar] [PubMed]
- Roof, M.A.; Kreinces, J.B.; Schwarzkopf, R.; Rozell, J.C.; Aggarwal, V.K. Are there avoidable causes of early revision total knee arthroplasty? Knee Surg. Relat. Res. 2022, 34, 29. [Google Scholar] [CrossRef] [PubMed]
- Lee, S.H.; Kim, D.H.; Lee, Y.S. Is there an optimal age for total knee arthroplasty? A systematic review. Knee Surg. Relat. Res. 2020, 32, 60. [Google Scholar] [CrossRef] [PubMed]
- Kulshrestha, V.; Sood, M.; Kumar, S.; Sood, N.; Kumar, P.; Padhi, P.P. Does Risk Mitigation Reduce 90-Day Complications in Patients Undergoing Total Knee Arthroplasty? A Cohort Study. Clin. Orthop. Surg. 2022, 14, 56–68. [Google Scholar] [CrossRef] [PubMed]
- Kulshrestha, V.; Sood, M.; Kanade, S.; Kumar, S.; Datta, B.; Mittal, G. Early Outcomes of Medial Pivot Total Knee Arthroplasty Compared to Posterior-Stabilized Design: A Randomized Controlled Trial. Clin. Orthop. Surg. 2020, 12, 178–186. [Google Scholar] [CrossRef] [PubMed]
- Rand, J.A.; Trousdale, R.T.; Ilstrup, D.M.; Harmsen, W.S. Factors affecting the durability of primary total knee prostheses. J. Bone Jt. Surgery. Am. Vol. 2003, 85, 259–265. [Google Scholar] [CrossRef] [PubMed]
- Annette, W.D.; Robertsson, O.; Lidgren, L. Surgery for knee osteoarthritis in younger patients. Acta Orthop. 2010, 81, 161–164. [Google Scholar]
- Parvizi, J.; Nunley, R.M.; Berend, K.R.; Lombardi, A.V., Jr.; Ruh, E.L.; Clohisy, J.C.; Hamilton, W.G.; Della Valle, C.J.; Barrack, R.L. High level of residual symptoms in young patients after total knee arthroplasty. Clin. Orthop. Relat. Res. 2014, 472, 133–137. [Google Scholar] [CrossRef] [PubMed]
- Bisschop, R.; Brouwer, R.W.; Van Raay, J.J. Total knee arthroplasty in younger patients: A 13-year follow-up study. Orthopedics 2010, 33, 876. [Google Scholar] [CrossRef] [PubMed]
- Kamath, A.F.; Siddiqi, A.; Malkani, A.L.; Krebs, V.E. Cementless Fixation in Primary Total Knee Arthroplasty: Historical Perspective to Contemporary Application. J. Am. Acad. Orthop. Surg. 2021, 29, e363–e379. [Google Scholar] [CrossRef]
- Grau, L.C.; Ong, A.C.; Restrepo, S.; Griffiths, S.Z.; Hozack, W.J.; Smith, E.B. Survivorship, Clinical and Radiographic Outcomes of a Novel Cementless Metal-Backed Patella Design. J. Arthroplast. 2021, 36, S221–s226. [Google Scholar] [CrossRef] [PubMed]
- Berger, R.A.; Lyon, J.H.; Jacobs, J.J.; Barden, R.M.; Berkson, E.M.; Sheinkop, M.B.; Rosenberg, A.G.; Galante, J.O. Problems with cementless total knee arthroplasty at 11 years followup. Clin. Orthop. Relat. Res. 2001, 392, 196–207. [Google Scholar] [CrossRef] [PubMed]
- Robertsson, O.; Bizjajeva, S.; Fenstad, A.M.; Furnes, O.; Lidgren, L.; Mehnert, F.; Odgaard, A.; Pedersen, A.B.; Havelin, L.I. Knee arthroplasty in Denmark, Norway and Sweden. A pilot study from the Nordic Arthroplasty Register Association. Acta Orthop. 2010, 81, 82–89. [Google Scholar] [CrossRef] [PubMed]
- Søballe, K.; Hansen, E.S.; Brockstedt-Rasmussen, H.; Bünger, C. Hydroxyapatite coating converts fibrous tissue to bone around loaded implants. J. Bone Jt. Surgery. Br. Vol. 1993, 75, 270–278. [Google Scholar] [CrossRef] [PubMed]
- Chen, C.; Shi, Y.; Wu, Z.; Gao, Z.; Chen, Y.; Guo, C.; Bao, X. Long-term effects of cemented and cementless fixations of total knee arthroplasty: A meta-analysis and systematic review of randomized controlled trials. J. Orthop. Surg. Res. 2021, 16, 590. [Google Scholar] [CrossRef] [PubMed]
- Bobyn, J.D.; Stackpool, G.J.; Hacking, S.A.; Tanzer, M.; Krygier, J.J. Characteristics of bone ingrowth and interface mechanics of a new porous tantalum biomaterial. J. Bone Jt. Surgery. Br. Vol. 1999, 81, 907–914. [Google Scholar] [CrossRef]
- Nakama, G.Y.; Peccin, M.S.; Almeida, G.J.; Lira Neto Ode, A.; Queiroz, A.A.; Navarro, R.D. Cemented, cementless or hybrid fixation options in total knee arthroplasty for osteoarthritis and other non-traumatic diseases. Cochrane Database Syst. Rev. 2012, 10, Cd006193. [Google Scholar] [CrossRef] [PubMed]
- Petersen, M.M.; Nielsen, P.T.; Lebech, A.; Toksvig-Larsen, S.; Lund, B. Preoperative bone mineral density of the proximal tibia and migration of the tibial component after uncemented total knee arthroplasty. J. Arthroplast. 1999, 14, 77–81. [Google Scholar] [CrossRef]
- Andersen, M.R.; Winther, N.S.; Lind, T.; Schrøder, H.M.; Flivik, G.; Petersen, M.M. Low Preoperative BMD Is Related to High Migration of Tibia Components in Uncemented TKA-92 Patients in a Combined DEXA and RSA Study With 2-Year Follow-Up. J. Arthroplast. 2017, 32, 2141–2146. [Google Scholar] [CrossRef] [PubMed]
- Gausden, E.B.; Nwachukwu, B.U.; Schreiber, J.J.; Lorich, D.G.; Lane, J.M. Opportunistic Use of CT Imaging for Osteoporosis Screening and Bone Density Assessment: A Qualitative Systematic Review. J. Bone Jt. Surgery. Am. Vol. 2017, 99, 1580–1590. [Google Scholar] [CrossRef] [PubMed]
- Booz, C.; Noeske, J.; Albrecht, M.H.; Lenga, L.; Martin, S.S.; Yel, I.; Huizinga, N.A.; Vogl, T.J.; Wichmann, J.L. Diagnostic accuracy of quantitative dual-energy CT-based bone mineral density assessment in comparison to Hounsfield unit measurements using dual x-ray absorptiometry as standard of reference. Eur. J. Radiol. 2020, 132, 109321. [Google Scholar] [CrossRef] [PubMed]
- Koch, V.; Hokamp, N.G.; Albrecht, M.H.; Gruenewald, L.D.; Yel, I.; Borggrefe, J.; Wesarg, S.; Eichler, K.; Burck, I.; Gruber-Rouh, T.; et al. Accuracy and precision of volumetric bone mineral density assessment using dual-source dual-energy versus quantitative CT: A phantom study. Eur. Radiol. Exp. 2021, 5, 43. [Google Scholar] [CrossRef] [PubMed]
- Mazess, R.B. Errors in measuring trabecular bone by computed tomography due to marrow and bone composition. Calcif. Tissue Int. 1983, 35, 148–152. [Google Scholar] [CrossRef] [PubMed]
- Rajiah, P.; Sundaram, M.; Subhas, N. Dual-Energy CT in Musculoskeletal Imaging: What Is the Role Beyond Gout? AJR Am. J. Roentgenol. 2019, 213, 493–505. [Google Scholar] [CrossRef]
- Gruenewald, L.D.; Koch, V.; Martin, S.S.; Yel, I.; Eichler, K.; Gruber-Rouh, T.; Lenga, L.; Wichmann, J.L.; Alizadeh, L.S.; Albrecht, M.H.; et al. Diagnostic accuracy of quantitative dual-energy CT-based volumetric bone mineral density assessment for the prediction of osteoporosis-associated fractures. Eur. Radiol. 2022, 32, 3076–3084. [Google Scholar] [CrossRef] [PubMed]
- Pickhardt, P.J.; Pooler, B.D.; Lauder, T.; del Rio, A.M.; Bruce, R.J.; Binkley, N. Opportunistic screening for osteoporosis using abdominal computed tomography scans obtained for other indications. Ann. Intern. Med. 2013, 158, 588–595. [Google Scholar] [CrossRef]
- Lee, S.J.; Binkley, N.; Lubner, M.G.; Bruce, R.J.; Ziemlewicz, T.J.; Pickhardt, P.J. Opportunistic screening for osteoporosis using the sagittal reconstruction from routine abdominal CT for combined assessment of vertebral fractures and density. Osteoporos. Int. J. Establ. Result Coop. Between Eur. Found. Osteoporos. Natl. Osteoporos. Found. USA 2016, 27, 1131–1136. [Google Scholar] [CrossRef]
- Garner, H.W.; Paturzo, M.M.; Gaudier, G.; Pickhardt, P.J.; Wessell, D.E. Variation in Attenuation in L1 Trabecular Bone at Different Tube Voltages: Caution Is Warranted When Screening for Osteoporosis With the Use of Opportunistic CT. AJR Am. J. Roentgenol. 2017, 208, 165–170. [Google Scholar] [CrossRef]
- Julin, J.; Jämsen, E.; Puolakka, T.; Konttinen, Y.T.; Moilanen, T. Younger age increases the risk of early prosthesis failure following primary total knee replacement for osteoarthritis. A follow-up study of 32,019 total knee replacements in the Finnish Arthroplasty Register. Acta Orthop. 2010, 81, 413–419. [Google Scholar] [CrossRef] [PubMed]
- Harwin, S.F.; Elmallah, R.K.; Jauregui, J.J.; Cherian, J.J.; Mont, M.A. Outcomes of a Newer-Generation Cementless Total Knee Arthroplasty Design. Orthopedics 2015, 38, 620–624. [Google Scholar] [CrossRef]
- Kanis, D.R.; Ratner, M.A.; Marks, T.J.J.C.R. Design and construction of molecular assemblies with large second-order optical nonlinearities. Quantum Chem. Asp. 1994, 94, 195–242. [Google Scholar]
- Yu, E.W.; Thomas, B.J.; Brown, J.K.; Finkelstein, J.S. Simulated increases in body fat and errors in bone mineral density measurements by DXA and QCT. J. Bone Miner. Res. Off. J. Am. Soc. Bone Miner. Res. 2012, 27, 119–124. [Google Scholar] [CrossRef]
- Kim, D.H.; Shanti, N.; Tantorski, M.E.; Shaw, J.D.; Li, L.; Martha, J.F.; Thomas, A.J.; Parazin, S.J.; Rencus, T.C.; Kwon, B. Association between degenerative spondylolisthesis and spinous process fracture after interspinous process spacer surgery. Spine J. Off. J. N. Am. Spine Soc. 2012, 12, 466–472. [Google Scholar] [CrossRef]
- Schreiber, J.J.; Hughes, A.P.; Taher, F.; Girardi, F.P. An association can be found between hounsfield units and success of lumbar spine fusion. HSS J. Musculoskelet. J. Hosp. Spec. Surg. 2014, 10, 25–29. [Google Scholar] [CrossRef] [PubMed]
- Meredith, D.S.; Schreiber, J.J.; Taher, F.; Cammisa, F.P., Jr.; Girardi, F.P. Lower preoperative Hounsfield unit measurements are associated with adjacent segment fracture after spinal fusion. Spine 2013, 38, 415–418. [Google Scholar] [CrossRef] [PubMed]
- Nguyen, H.S.; Shabani, S.; Patel, M.; Maiman, D. Posterolateral lumbar fusion: Relationship between computed tomography Hounsfield units and symptomatic pseudoarthrosis. Surg. Neurol. Int. 2015, 6, S611–S614. [Google Scholar] [CrossRef] [PubMed]
- Koh, I.J.; Kim, T.K.; Chang, C.B.; Cho, H.J.; In, Y. Trends in use of total knee arthroplasty in Korea from 2001 to 2010. Clin. Orthop. Relat. Res. 2013, 471, 1441–1450. [Google Scholar] [CrossRef] [PubMed]
- Lenga, L.; Leithner, D.; Peterke, J.L.; Albrecht, M.H.; Gudauskas, T.; D’Angelo, T.; Booz, C.; Hammerstingl, R.; Vogl, T.J.; Martin, S.S.; et al. Comparison of Radiation Dose and Image Quality of Contrast-Enhanced Dual-Source CT of the Chest: Single-Versus Dual-Energy and Second-Versus Third-Generation Technology. AJR Am. J. Roentgenol. 2019, 212, 741–747. [Google Scholar] [CrossRef]


| Demographic Data | n = 117 | |
|---|---|---|
| Age * | 70.6 ± 6.5 (54~88) | |
| Sex (male: female) † | 15 (13): 102 (87) | |
| Height (cm) * | 153.7 ± 7.2 (140~178) | |
| Weight (kg) * | 63.0 ± 10.6 (44~89) | |
| BMI (kg/m2) * | 26.6 ± 3.4 (21.0~35.2) | |
| Diagnosis of Osteoporosis (%) † | L2 | Femur neck |
| Normal | 44 (38) | 31 (26.5) |
| Osteopenia | 60 (51) | 69 (59) |
| Osteoporosis | 13 (11) | 17 (14.5) |
| DXA | L2 | Femur neck |
| BMD * | 0.859 ± 0.166 (0.556~1.468) | 0.640 ± 0.097 (0.451~0.945) |
| T-score * | −1.055 ± 1.419 (−3.7~3.3) | −1.532 ± 0.899 (−3.3~1.3) |
| DXA | |||||||||
|---|---|---|---|---|---|---|---|---|---|
| L2 | Femur Neck | ||||||||
| BMD (g/cm2) | T-Score | BMD (g/cm2) | T-Score | ||||||
| Pearson r | p Value | Pearson r | p Value | Pearson r | p Value | Pearson r | p Value | ||
| DECT HU | L2 | 0.529 | <0.01 | 0.524 | <0.01 | 0.417 | <0.01 | 0.408 | <0.01 |
| Femur neck | 0.351 | <0.01 | 0.352 | <0.01 | 0.593 | <0.01 | 0.578 | <0.01 | |
| Distal femur | 0.458 | <0.01 | 0.450 | <0.01 | 0.307 | <0.01 | 0.286 | <0.01 | |
| Proximal tibia | 0.342 | <0.01 | 0.342 | <0.01 | 0.286 | <0.01 | 0.267 | 0.015 | |
| DECT BMD (g/cm3) | L2 | 0.585 | <0.01 | 0.585 | <0.01 | 0.476 | <0.01 | 0.479 | <0.01 |
| Femur neck | 0.379 | <0.01 | 0.384 | <0.01 | 0.546 | <0.01 | 0.550 | <0.01 | |
| Distal femur | 0.458 | <0.01 | 0.446 | <0.01 | 0.454 | <0.01 | 0.444 | <0.01 | |
| Proximal tibia | 0.466 | <0.01 | 0.479 | <0.01 | 0.382 | <0.01 | 0.381 | <0.01 | |
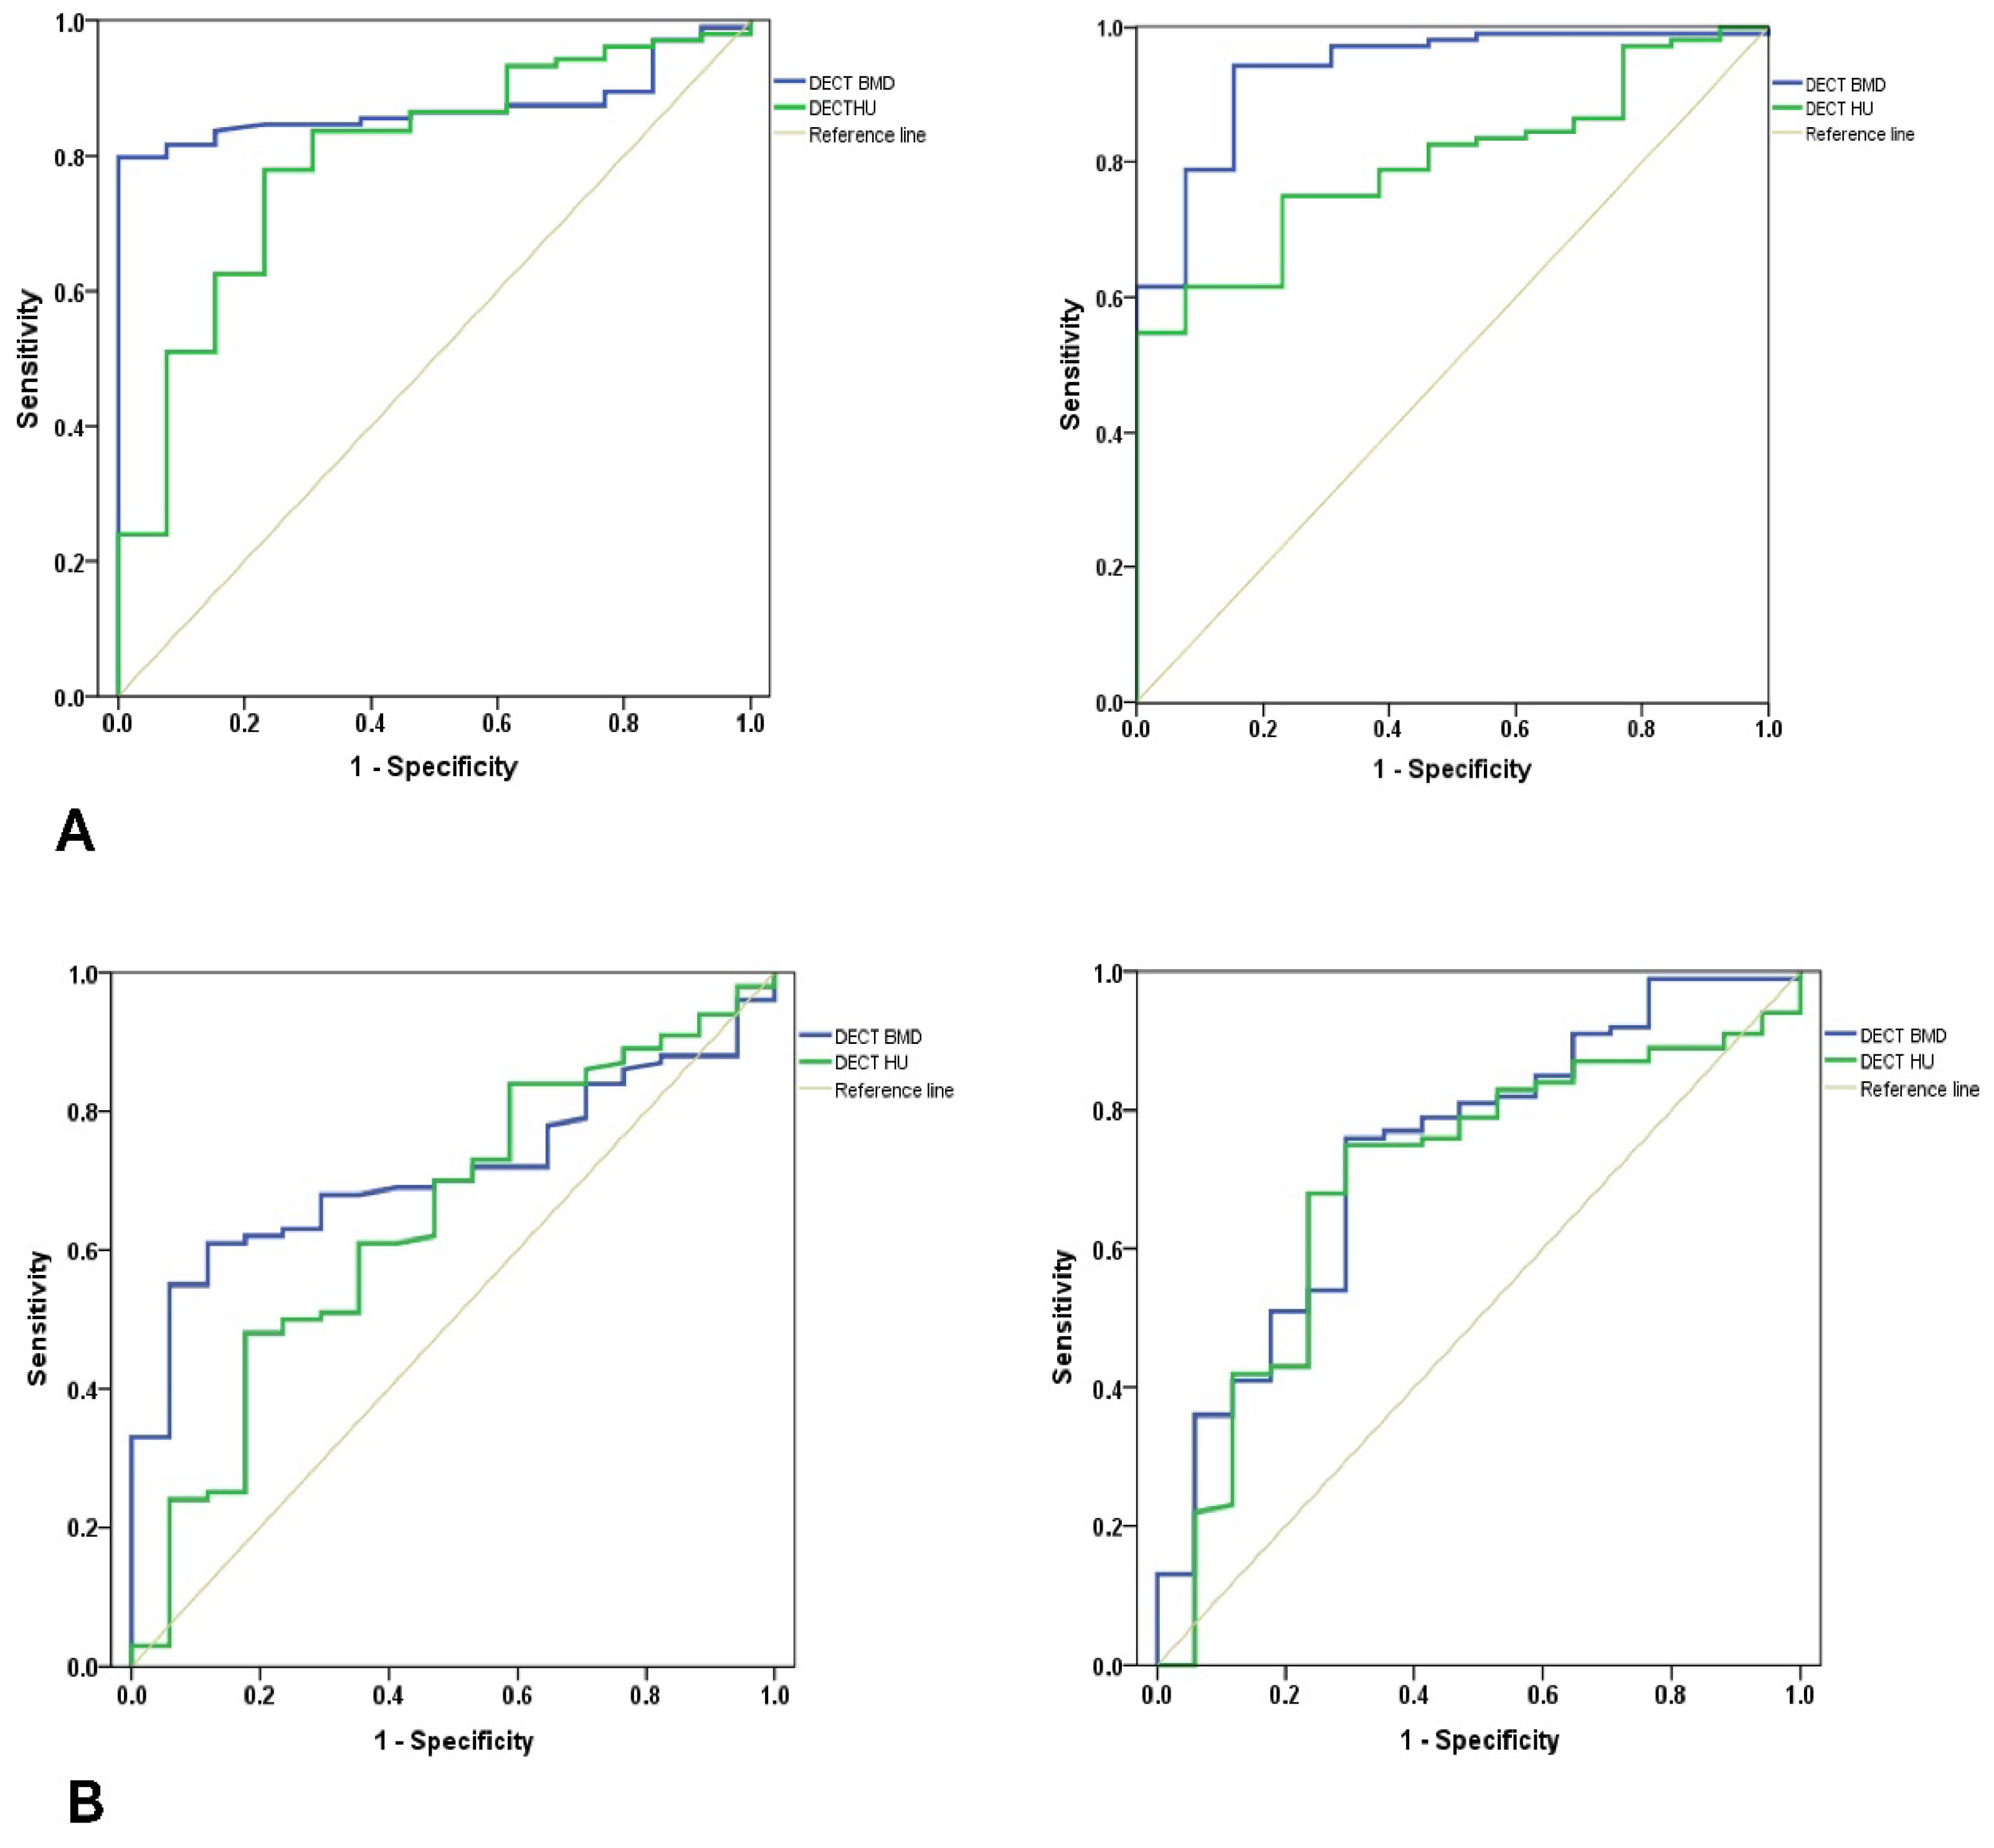
| L2 DXA as Standard of Reference | Femur Neck DXA as Standard of Reference | ||||||||||||
|---|---|---|---|---|---|---|---|---|---|---|---|---|---|
| 95% CI | 95% CI | ||||||||||||
| AUC | Cut-Off | Sensitivity | Specificity | Min | Max | AUC | Cut-Off | Sensitivity | Specificity | Min | Max | ||
| Distal femur | DECT BMD | 0.872 | 89.2 | 82% | 92% | 0.809 | 0.936 | 0.714 | 96.9 | 70% | 71% | 0.616 | 0.813 |
| DECT HU | 0.796 | 104.5 | 78% | 77% | 0.673 | 0.919 | 0.643 | 117.4 | 67% | 65% | 0.503 | 0.783 | |
| Proximal tibia | DECT BMD | 0.935 | 78.3 | 85% | 85% | 0.871 | 0.999 | 0.738 | 80.9 | 76% | 71% | 0.609 | 0.866 |
| DECT HU | 0.800 | 66.5 | 75% | 77% | 0.706 | 0.894 | 0.697 | 66.8 | 75% | 71% | 0.560 | 0.823 | |
Publisher’s Note: MDPI stays neutral with regard to jurisdictional claims in published maps and institutional affiliations. |
© 2022 by the authors. Licensee MDPI, Basel, Switzerland. This article is an open access article distributed under the terms and conditions of the Creative Commons Attribution (CC BY) license (https://creativecommons.org/licenses/by/4.0/).
Share and Cite
Choi, K.Y.; Lee, S.-W.; In, Y.; Kim, M.S.; Kim, Y.D.; Lee, S.-y.; Lee, J.-W.; Koh, I.J. Dual-Energy CT-Based Bone Mineral Density Has Practical Value for Osteoporosis Screening around the Knee. Medicina 2022, 58, 1085. https://doi.org/10.3390/medicina58081085
Choi KY, Lee S-W, In Y, Kim MS, Kim YD, Lee S-y, Lee J-W, Koh IJ. Dual-Energy CT-Based Bone Mineral Density Has Practical Value for Osteoporosis Screening around the Knee. Medicina. 2022; 58(8):1085. https://doi.org/10.3390/medicina58081085
Chicago/Turabian StyleChoi, Keun Young, Sheen-Woo Lee, Yong In, Man Soo Kim, Yong Deok Kim, Seung-yeol Lee, Jin-Woo Lee, and In Jun Koh. 2022. "Dual-Energy CT-Based Bone Mineral Density Has Practical Value for Osteoporosis Screening around the Knee" Medicina 58, no. 8: 1085. https://doi.org/10.3390/medicina58081085