
Serum Cystatin C as a Biomarker for Early Diabetic Kidney Disease and Dyslipidemia in Young Type 1 Diabetes Patients

Abstract
:1. Introduction
2. Materials and Methods
2.1. Study Design and Subjects
2.2. Laboratory Analyses
2.3. Evaluation of Kidney Function
2.4. Evaluation of Microvascular Complications
2.5. Statistical Analyses
3. Results
3.1. General Characteristics of the Cohort
3.2. Dyslipidemia and Microvascular Complications
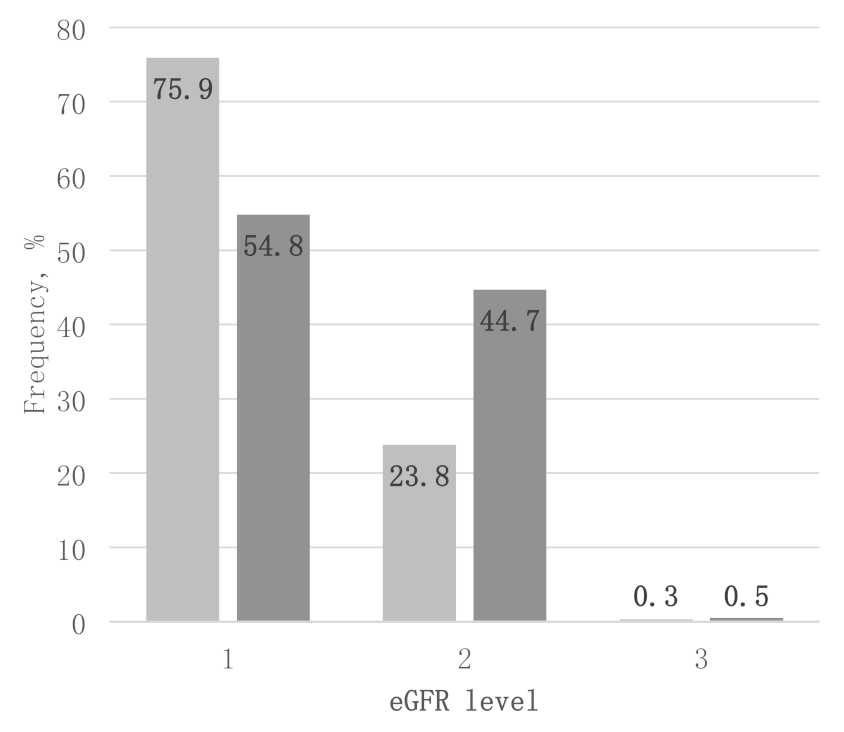
3.3. GFR and Kidney Function
4. Discussion
5. Conclusions
Author Contributions
Funding
Institutional Review Board Statement
Informed Consent Statement
Data Availability Statement
Conflicts of Interest
References
- Tonelli, M.; Wiebe, N.; Culleton, B.; House, A.; Rabbat, C.; Fok, M.; McAlister, F.; Garg, A.X. Chronic Kidney Disease and Mortality Risk: A Systematic Review. J. Am. Soc. Nephrol. 2006, 17, 2034–2047. [Google Scholar] [CrossRef] [PubMed] [Green Version]
- Donaghue, K.C.; Marcovecchio, M.L.; Wadwa, R.P.; Chew, E.Y.; Wong, T.Y.; Calliari, L.E.; Zabeen, B.; Salem, M.A.; Craig, M.E. ISPAD Clinical Practice Consensus Guidelines 2018: Microvascular and macrovascular complications in children and adolescents. Pediatr. Diabetes 2018, 19 (Suppl. 27), 262–274. [Google Scholar] [CrossRef] [PubMed]
- Shlipak, M.G.; Matsushita, K.; Arnlov, J.; Inker, L.A.; Katz, R.; Polkinghorne, K.R.; Rothenbacher, D.; Sarnak, M.J.; Astor, B.C.; Coresh, J.; et al. Cystatin C versus Creatinine in Determining Risk based on Kidney Function. N. Engl. J. Med. 2013, 369, 932–943. [Google Scholar] [CrossRef] [Green Version]
- Dharnidharka, V.R.; Kwon, C.; Stevens, G. Serum cystatin C is superior to serum creatinine as a marker of kidney function: A meta-analysis. Am. J. Kidney Dis. 2002, 40, 221–226. [Google Scholar] [CrossRef]
- Henskens, Y.M.; Veerman, E.C.; Nieuw Amerongen, A.V. Cystatins in health and disease. Biol. Chem. Hoppe Seyler 1996, 377, 71–86. [Google Scholar] [PubMed]
- American Heart Association. Third report of the National Education Program (NCEP) Expert Panel on Detection, Evaluation, and Treatment of High Blood Cholesterol in Adults (Adult Treatment Panell III) Final Report. Circulation 2002, 106, 3143–3421. [Google Scholar] [CrossRef]
- Laing, S.P.; Swerdlow, A.J.; Slater, S.D.; Burden, A.C.; Morris, A.; Waugh, N.R.; Gatling, W.; Bingley, P.J.; Patterson, C.C. Mortality from heart disease in a cohort of 23,000 patients with insulin-treated diabetes. Diabetologia 2003, 46, 760–765. [Google Scholar] [CrossRef] [Green Version]
- Vergès, B. Lipid disorders in type 1 diabetes. Diabetes Metab. 2009, 35, 353–360. [Google Scholar] [CrossRef]
- Jenkins, A.J.; Lyons, T.J.; Zheng, D.; Otvos, J.D.; Lackland, D.T.; Mcgee, D.; Garvey, T.; Klein, R.; The DCCT/EDIC Research Group. Lipoproteins in the DCCT/EDIC cohort: Associations with diabetic nephropathy. Kidney Int. 2003, 64, 817–828. [Google Scholar] [CrossRef] [Green Version]
- Orchard, T.J.; Stevens, L.K.; Forrest, K.Y.; Fuller, J.H. Cardiovascular disease in insulin dependent Diabetes mellitus: Similar rates but different risk factors in the US compared with Europe. Int. J. Epidemiol. 1998, 27, 976–983. [Google Scholar] [CrossRef] [Green Version]
- Nakhjavan-Shahraki, B.; Yousefifard, M.; Ataei, N.; Baikpour, M.; Ataei, F.; Bazargani, B.; Abbasi, A.; Ghelichkhani, P.; Javidilarijani, F.; Hosseini, M. Accuracy of cystatin C in prediction of acute kidney injury in children; serum or urine levels: Which one works better? A systematic review and meta-analysis. BMC Nephrol. 2017, 18, 120. [Google Scholar] [CrossRef] [PubMed] [Green Version]
- Brady, T.M.; Townsend, K.; Schneider, M.F.; Cox, C.; Kimball, T.; Madueme, P.; Warady, B.; Furth, S.; Mitsnefes, M. Cystatin C and Cardiac Measures in Children Adolescents With CKD. Am. J. Kidney Dis. 2017, 69, 247–256. [Google Scholar] [CrossRef] [PubMed] [Green Version]
- Shankar, R.K.; Dolan, L.M.; Isom, S.; Saydah, S.; Maahs, D.M.; Dabelea, D.; Reynols, K.; Hirsch, I.B.; Rodriguez, B.L.; Mayer-Davis, E.J.; et al. Serum Cystatin C in Youth with Diabetes: The SEARCH for Diabetes in Youth Study. Diabetes Res. Clin. Pract. 2017, 130, 258–265. [Google Scholar] [CrossRef] [PubMed]
- Verkauskiene, R.; Danyte, E.; Dobrovolskiene, R.; Stankute, I.; Simoniene, D.; Razanskaite-Virbickiene, D.; Seibokaite, A.; Urbonaite, B.; Jurgeviciene, N.; Vitkauskiene, A.; et al. The course of diabetes in children, adolescents and young adults: Does the autoimmunity status matter? BMC Endocr. Disord. 2016, 16, 61. [Google Scholar] [CrossRef] [Green Version]
- Couper, J.J.; Haller, M.J.; Greenbaum, C.J.; Ziegler, A.G.; Wherret, D.K.; Knip, M.; Craig, M.E. ISPAD Clinical Practice Consensus Guidelines 2018: Stages of type 1 diabetes in children and adolescents. Pediatr. Diabetes 2018, 19 (Suppl. 27), 20–27. [Google Scholar] [CrossRef]
- Stankute, I.; Dobrovolskiene, R.; Danyte, E.; Razanskaite-Virbickiene, D.; Jasinskiene, E.; Mockeviciene, G.; Marciulionyte, D.; Schwitzgebel, V.M.; Verkauskiene, R. Factors Affecting Cardiovascular Risk in Children, Adolescents, and Young Adults with Type 1 Diabetes. J. Diabetes Res. 2019, 2019, 9134280. [Google Scholar] [CrossRef]
- De Onis, M.; Lobstein, T. Defining obesity risk in childhood population: Which cut-offs should we use? Int. J. Pediatr. Obes. 2010, 5, 548–560. [Google Scholar] [CrossRef]
- Mehta, S.K. Waist Circumference to Height Ratio in Children and Adolescents. Clin. Pediatr. 2015, 54, 652–658. [Google Scholar] [CrossRef]
- DiMeglio, L.A.; Acerini, C.L.; Codner, E.; Craig, M.E.; Hofer, S.E.; Pillay, K.; Maahs, D.M. ISPAD Clinical Practice Consensus Guidelines 2018: Glycemic control targets and glucose monitoring for children, adolescents, and young adults with diabetes. Pediatr Diabetes 2018, 19 (Suppl. 27), 105–114. [Google Scholar] [CrossRef] [Green Version]
- Mian, A.N.; Schwartz, G.J. Measurement and Estimation of Glomerular Filtration Rate in Children. Adv. Chronic Kidney Dis. 2017, 24, 348–356. [Google Scholar] [CrossRef]
- Inker, L.A.; Schmid, C.H.; Tighiouart, H.; Eckfeldt, J.H.; Feldman, H.I.; Greene, T.; Kusek, J.W.; Manzi, J.; Van Lente, F.; Zhang, Y.L.; et al. CKD-EPI Investigators Estimating glomerular filtration rate from serum creatinine and cystatin C. N. Engl. J. Med. 2012, 367, 20–29. [Google Scholar] [CrossRef] [PubMed] [Green Version]
- Levey, A.S.; Stevens, L.A.; Schmid, C.H.; Zhang, Y.; Castro, A.F.; Feldman, H.I.; Kusek, J.W.; Eggers, V.; Van Lente, F.; Greene, T.; et al. CKD-EPI (Chronic Kidney Disease Epidemiology Collaboration) A new equation to estimate glomerular filtration rate. Ann. Intern. Med. 2009, 150, 604–612. [Google Scholar] [CrossRef] [PubMed]
- American Diabetes Association. 11. Microvascular complications and foot care: Standards of Medical Care in Diabetes—2019. Diabetes Care 2019, 42 (Suppl. 1), S124–S138. [Google Scholar] [CrossRef] [PubMed] [Green Version]
- Mogensen, C.E.; Hansen, K.W.; Nielsen, S.; Pedersen, M.M.; Rehling, M.; Schmitz, A. Monitoring diabetic nephropathy: Glomerular filtration rate and abnormal albuminuria in diabetic renal disease-reproducibility, progression, and efficacy of antihypertensive intervention. Am. J. Kidney Dis. 1993, 22, 174–187. [Google Scholar] [CrossRef]
- Boulton, A.J.; Armstrong, D.G.; Albert, S.F.; Frykberg, R.K.; Hellman, R.; Kirkman, S.; Lavery, L.A.; LeMaster, J.W.; Mills, J.L.; Mueller, M.J.; et al. Comprehensive foot examination and risk assessment. A report of the Task Force of the Foot Care Interest Group of the American Diabetes Association, with endorsement by the American Association of Clinical Endocrinologists. Phys. Ther. 2008, 88, 1436–1443. [Google Scholar] [CrossRef] [Green Version]
- Herman, W.H.; Pop-Busui, R.; Braffett, B.H.; Martin, C.L.; Cleary, P.A.; Albers, J.W.; Feldman, E.L.; DCCT/EDIC Research Group. Use of the Michigan Neuropathy Screening Instrument as a measure of distal symmetrical peripheral neuropathy in Type 1 diabetes: Results from the Diabetes Control and Complications Trial/Epidemiology of Diabetes Interventions and Complications. Diabet Med. 2012, 29, 937–944. [Google Scholar] [CrossRef] [Green Version]
- He, Z. Diagnosis and Treatment of Diabetic Nephropathy in Type 1 and Type 2 Diabetes Patients. J. Mol. Biomark. Diagn. 2016, 7, 5. [Google Scholar] [CrossRef]
- Van Donge, T.; Welzel, T.; Atkinson, A. Age-Dependent Changes of Kidney Injury Biomarkers in Pediatrics. J. Clin. Pharmacol. 2019, 59 (Suppl. 1), S21–S32. [Google Scholar]
- Tsai, C.-W.; Grams, M.E.; Inker, L.A.; Coresh, J.; Selvin, E. Cystatin C–and Creatinine-Based Estimated Glomerular Filtration Rate, Vascular Disease, and Mortality in Persons with Diabetes in the U.S. Diabetes Care 2014, 37, 1002–1008. [Google Scholar] [CrossRef] [Green Version]
- Huang, S.H.S.; Sharma, A.P.; Yasin, A.; Lindsay, R.M.; Clark, W.F.; Filler, G. Hyperfiltration Affects Accuracy of Creatinine eGFR Measurement. Clin. J. Am. Soc. Nephrol. 2011, 6, 274–280. [Google Scholar] [CrossRef] [Green Version]
- Murty, M.S.N.; Sharma, U.K.; Pandey, V.B.; Kankare, S.B. Serum cystatin C as a marker of renal function in detection of early acute kidney injury. Indian J. Nephrol. 2013, 23, 180–183. [Google Scholar] [CrossRef] [PubMed]
- Leem, A.Y.; Park, M.S.; Park, B.H.; Jung, W.J.; Chung, K.S.; Kim, S.Y.; Kim, E.Y.; Jung, J.Y.; Kang, Y.A.; Kim, Y.S.; et al. Value of Serum Cystatin C Measurement in the Diagnosis of Sepsis-Induced Kidney Injury and Prediction of Renal Function Recovery. Yonsei Med. J. 2017, 58, 604–612. [Google Scholar] [CrossRef] [PubMed]
- Groesbeck, D.; Kottgen, A.; Parekh, R.; Selvin, E.; Schwartz, G.E.; Coresh, J.; Furth, S. Age, gender, and race effects on cystatin C levels in US adolescents. Clin. J. Am. Soc. Nephrol. 2008, 3, 1777–1785. [Google Scholar] [CrossRef] [PubMed]
- Croda-Todd, M.T.; Soto-Montano, X.J.; Hernandez-Cancino, P.A. Adult cystatin C reference intervals determined by nephelometric immunoassay. Clin. Biochem. 2007, 13, 1084–1087. [Google Scholar] [CrossRef] [PubMed]
- Maahs, D.M.; Prentice, N.; McFann, K.; Snell-Bergeon, J.; Jalal, D.; Bishop, F.Z.; Aragon, B.; Wadwa, P. Age and sex influence cystatin C in adolescents with and without type 1 diabetes. Diabetes Care 2011, 34, 2360–2362. [Google Scholar] [CrossRef] [PubMed] [Green Version]
- Norlund, L.; Fex, G.; Lanke, J.; von Schenck, H.; Nilsson, J.E.; Leksell, H.; Grubb, A. Reference intervals for the glomerular filtration rate and cell-proliferation markers: Serum cystatin C and serum b2-microglobulin/cystatin C ratio. Scand. J. Clin. Lab. Investig. 1997, 57, 463–470. [Google Scholar] [CrossRef]
- Grundy, S.M.; Cleeman, J.I.; Daniels, S.R. American Heart Association; National Heart, Lung, and Blood Institute. Diagnosis and Management of the Metabolic Syndrome: An American Heart Association/National Heart, Lung, and Blood Institute Scientific Statement. Circulation 2005, 112, 2735–2752. [Google Scholar] [CrossRef] [Green Version]
- Servais, A.; Giral, P.; Bernard, M.; Bruckert, E.; Deray, G.; Bagnis, C.I. Is serum cystatin-C a reliable marker for metabolic syndrome? Am. J. Med. 2008, 121, 426–432. [Google Scholar] [CrossRef]
- Koenig, W.; Twardella, D.; Brenner, H.; Rothenbacher, D. Plasma concentrations of cystatin C in patients with coronary heart disease and risk for secondary cardiovascular events: More than simply a marker of glomerular filtration rate. Clin. Chem. 2005, 51, 321–327. [Google Scholar] [CrossRef] [Green Version]
- Lee, M.; Saver, J.L.; Huang, W.H.; Chow, J.; Chang, K.-H.; Ovbiagele, B. Impact of elevated cystatin C level on cardiovascular disease risk in predominantly high cardio-vascular risk populations: A meta-analysis. Circ. Cardiovasc. Outcomes 2010, 3, 675–683. [Google Scholar] [CrossRef] [Green Version]
- Pasala, S.; Carmody, J.B. How to use serum creatinine, cystatin C and GFR. Arch. Dis. Child. Educ. Pract. Ed. 2017, 102, 37–43. [Google Scholar] [CrossRef] [PubMed]


| Category | Gender/Total | Median (Range), Total Cohort | Age Groups | p-Value (Comparing Children vs. Adults | |
|---|---|---|---|---|---|
| Median (Range) in Children (<18 Years) | Median (Range) in Adults (≥18 Years) | ||||
| BMI Z-score | Males | 0.23 (−3.66;4.34) | 0.32 (−3.66;4.34) | 0.07 (−1.91;3.16) | NS |
| Females | 0.36 (−3.96;2.97) | 0.36 (−3.96;2.8) | 0.37 (−1.87;2.97) | NS | |
| Total | 0.29 (−3.96;4.34) | 0.34 (−3.96;4.34) | 0.29 (−1.91;3.16) | NS | |
| WtHR | Males | 0.44 (0.36;0.8) | 0.44 (0.38;0.8) | 0.44 (0.36;0.61) | NS |
| Females | 0.45 (0.25;0.63) | 0.44 (0.25;0.59) | 0.45 0.37;0.63) | NS | |
| Total | 0.44 (0.25;0.8) | 0.44 (0.25;0.8) | 0.45 (0.36;0.63) | NS | |
| HbA1c, % mmol/mol | Males | 7.8 (5.2;14.8) a 61.7 (33.3;138.3) | 7.8 (5.3;14.8) b 61.7 (34.4;138.3) | 7.9 (5.2;14.1) 62.8 (33.3;138.3) | 0.047 |
| Females | 8.3 (5.4;19.9) a 67.2 (35.5;194) | 8.3 (5.5;19.9) b 67.2 (35.5;194) | 8.3 (5.4;14.1) 67.2 (25.5;194) | NS | |
| Total | 8 (5.2;19.9) 63.9 (33.3;194) | 8 (5.3;19.9) 63.9 (34.4;194) | 8.2 (5.2;14.1) 66.1 (33.3;130.6) | NS | |
| Serum creatinine, μmol/L * | Males | 70 (7;126) a | 62 (7;107) b | 80 (35;113) c | <0.001 |
| Females | 59 (6;111) a | 58 (6;94) b | 64 (36;111) c | <0.001 | |
| Total | 63 (6;126) | 59 (6;107) | 70 (35;113) | <0.001 | |
| Serum cystatine C, mg/L | Males | 0.84 (0.08;1.71) a | 0.85 (0.54;1.27) b | 0.82 (0.08;1.71) c | NS |
| Females | 0.78 (0.33;1.19) a | 0.80 (0.33;1.11) b | 0.76 (0.52;1.19) c | 0.004 | |
| Total | 0.81 (0.08;1.71) | 0.83 (0.33;1.27) | 0.79 (0.08;1.71) | 0.008 | |
| Total cholesterol, mmol/L | Males | 4.6 (1.9;8.9) a | 4.7 (1.9;8.9) b | 4.6 (2.9;7.9) c | NS |
| Females | 4.9 (2.5;9.3) a | 4.9 (3.1;8.5) b | 5.0 (2.5;9.3) c | NS | |
| Total | 4.8 (1.9;9.3) | 4.8 (1.9;8.9) | 4.7 (2.5;9.3) | NS | |
| LDL-cholesterol, mmol/L | Males | 2.6 (0.5;5.8) a | 2.5 (0.5;5.8) b | 2.6 (1.3;5.7) c | NS |
| Females | 2.8 (0.8;6.5) a | 2.8 (1.1;6.1) b | 2.8 (0.8;6.5) c | NS | |
| Total | 2.7 (0.5;6.5) | 2.7 (0.5;6.1) | 2.7 (0.8;6.5) | NS | |
| HDL-cholesterol, mmol/L | Males | 1.4 (0.6;2.7) a | 1.4 (0.8;2.7) | 1.3 (0.6;2.3) c | <0.001 |
| Females | 1.5 (0.3;2.6) a | 1.5 (0.6;2.6) | 1.5 (0.3;2.6) c | NS | |
| Total | 1.4 (0.3;2.7) | 1.5 (0.6;2.7) | 1.4 (0.3;2.6) | 0.012 | |
| Triglycerides, mmol/L | Males | 0.7 (0.1;5.3) a | 0.7 (0.1;5.3) b | 0.9 (0.2;5.3) | <0.001 |
| Females | 0.8 (0.3;5.1) a | 0.8 (0.3;5.1) b | 0.9 (0.3;3.3) | NS | |
| Total | 0.8 (0.1;5.3) | 0.7 (0.1;5.3) | 0.9 (0.2;5.3) | <0.001 | |
| AER, mg/24 h | Males | 7.5 (0.06;787) | 7 (1;787) | 9 (0.06;533) | NS |
| Females | 6.8 (0.08;667) | 5.6 (0.5;180) | 9 (0.08;667) | <0.001 | |
| Total | 7.2 (0.06;787) | 6 (0.5;787) | 9 (0.06;667) | <0.001 | |
| eGFRcreat, ml/min/1.73 m2 | Males | 96 (51;194) a | 92 (51;169) b | 121 (68;194) | <0.001 |
| Females | 104 (59;154) a | 98 (64;151) b | 115 (59;154) | <0.001 | |
| Total | 101 (51;194) | 96 (51;169) | 118 (58;194) | <0.001 | |
| eGFRcys, ml/min/1.73 m2 | Males | 89 (57;160) a | 83 (57;125) b | 118 (58;160) | <0.001 |
| Females | 95 (64;201) a | 88 (64;201) b | 117 (66;146) | <0.001 | |
| Total | 92 (57;201) | 85 (57;201) | 117 (58;160) | <0.001 | |
| Gender/Total | Frequency | Diabetes Duration | p-Value (Comparing Diabetes Duration Groups) | ||
|---|---|---|---|---|---|
| <5 Years | ≥5 Years | ||||
| Retinopathy, % (n) | Males | 5 (19) a | 0 | 10.4 (19) | <0.001 |
| Females | 12.8 (51) a | 1.7 (3) | 21.7 (48) | <0.001 | |
| Total | 9 (70) | 0.8 (3) | 16.6 (37) | <0.001 | |
| Neuropathy, % (n) | Males | 8.9 (33) | 2.6 (5) | 16.1 (28) | <0.001 |
| Females | 12.6 (49) | 2.3 (4) | 21.2 (45) | <0.001 | |
| Total | 10.8 (82) | 2.4 (9) | 18.9 (73) | <0.001 | |
| Elevated AER, % (n) | Males | 13.2 (50) | 13.7 (27) | 12.6 (23) | NS |
| Females | 13.8 (55) | 10.1 (18) | 16.7 (37) | NS | |
| Total | 13.5 (105) | 12 (45) | 14.9 (60) | NS | |
| Dyslipidemia, % (n) | Males | 60.3 (229) | 56.3 (111) | 64.5 (118) | NS |
| Females | 66.2 (264) | 61.8 (110) | 69.7 (154) | NS | |
| Total | 63.3 (493) | 58.9 (221) | 67.3 (272) | 0.015 | |
| Obesity, % (n) | Males | 3.7 (14) | 4.7 (9) | 2.7 (5) | NS |
| Females | 3.5 (14) | 3.4 (6) | 3.6 (8) | NS | |
| Total | 3.6 (28) | 4.1 (15) | 3.2 (13) | NS | |
| Duration of Diabetes, Years | BMI Z-Score | WtHR | HbA1c, % | Cystatin C, mg/L | Creatinine, μmol/L | AER, mg/24 h | Total Cholesterol, mmol/L | LDL, mmol/L | HDL, mmol/L | Triglycerides, mmol/L | eGFRcreat, ml/min/1.73 m2 | eGFRcys ml/min/1.73 m2 | |
|---|---|---|---|---|---|---|---|---|---|---|---|---|---|
| Duration ofdiabetes, years | 1.00 | 0.052 | −0.006 | 0.301 *** | −0.035 | 0.288 *** | 0.139 *** | 0.089 * | 0.085 * | −0.057 | 0.241 *** | 0.148 *** | 0.239 *** |
| BMI Z-score | 1.00 | 0.661 *** | 0.033 | 0.006 | 0.056 | 0.035 | 0.07 | 0.09 * | −0.044 | 0.089 * | −0.062 | −0.019 | |
| WtHR | 1.00 | 0.084 * | −0.096 * | −0.131 *** | −0.043 | 0.119 ** | 0.108 ** | −0.028 | 0.154 *** | 0.035 | 0.084 * | ||
| HbA1c, % | 1.00 | −0.088 * | −0.049 | 0.067 | 0.227 *** | 0.211 *** | −0.083 * | 0.418 *** | 0.145 *** | 0.108 ** | |||
| Cystatin C, mg/L | 1.00 | 0.228 *** | 0.011 | −0.036 | −0.001 | −0.097 ** | 0.05 | −0.234 *** | −0.805 *** | ||||
| Creatinine, μmol/L | 1.00 | 0.131 *** | −0.111 ** | −0.053 | −0.217 *** | 0.149 *** | −0.447 *** | 0.023 | |||||
| AER, mg/24 h | 1.00 | 0.024 | 0.04 | −0.036 | 0.108 ** | 0.072 | 0.063 | ||||||
| Total cholesterol, mmol/L | 1.00 | 0.857 *** | 0.357 *** | 0.351 *** | 0.062 | 0.017 | |||||||
| LDL, mmol/L | 1.00 | 0.003 | 0.368 *** | 0.033 | −0.010 | ||||||||
| HDL, mmol/L | 1.00 | −0.228 *** | 0.000 | −0.002 | |||||||||
| Triglycerides, mmol/L | 1.00 | 0.092 * | 0.052 | ||||||||||
| eGFRcreat, ml/min/1.73 m2 | 1.00 | 0.455 *** | |||||||||||
| eGFRcys, ml/min/1.73 m2 | 1.00 |
Publisher’s Note: MDPI stays neutral with regard to jurisdictional claims in published maps and institutional affiliations. |
© 2022 by the authors. Licensee MDPI, Basel, Switzerland. This article is an open access article distributed under the terms and conditions of the Creative Commons Attribution (CC BY) license (https://creativecommons.org/licenses/by/4.0/).
Share and Cite
Stankute, I.; Radzeviciene, L.; Monstaviciene, A.; Dobrovolskiene, R.; Danyte, E.; Verkauskiene, R. Serum Cystatin C as a Biomarker for Early Diabetic Kidney Disease and Dyslipidemia in Young Type 1 Diabetes Patients. Medicina 2022, 58, 218. https://doi.org/10.3390/medicina58020218
Stankute I, Radzeviciene L, Monstaviciene A, Dobrovolskiene R, Danyte E, Verkauskiene R. Serum Cystatin C as a Biomarker for Early Diabetic Kidney Disease and Dyslipidemia in Young Type 1 Diabetes Patients. Medicina. 2022; 58(2):218. https://doi.org/10.3390/medicina58020218
Chicago/Turabian StyleStankute, Ingrida, Lina Radzeviciene, Ausra Monstaviciene, Rimante Dobrovolskiene, Evalda Danyte, and Rasa Verkauskiene. 2022. "Serum Cystatin C as a Biomarker for Early Diabetic Kidney Disease and Dyslipidemia in Young Type 1 Diabetes Patients" Medicina 58, no. 2: 218. https://doi.org/10.3390/medicina58020218