
Evaluating Change of Marginal Bone Height with Cone-Beam Computed Tomography Following Surgical Treatment with Guided Tissue Regeneration (Bone Grafting) or Access Flap Alone: A Retrospective Study


Abstract
:1. Introduction
2. Materials and Methods
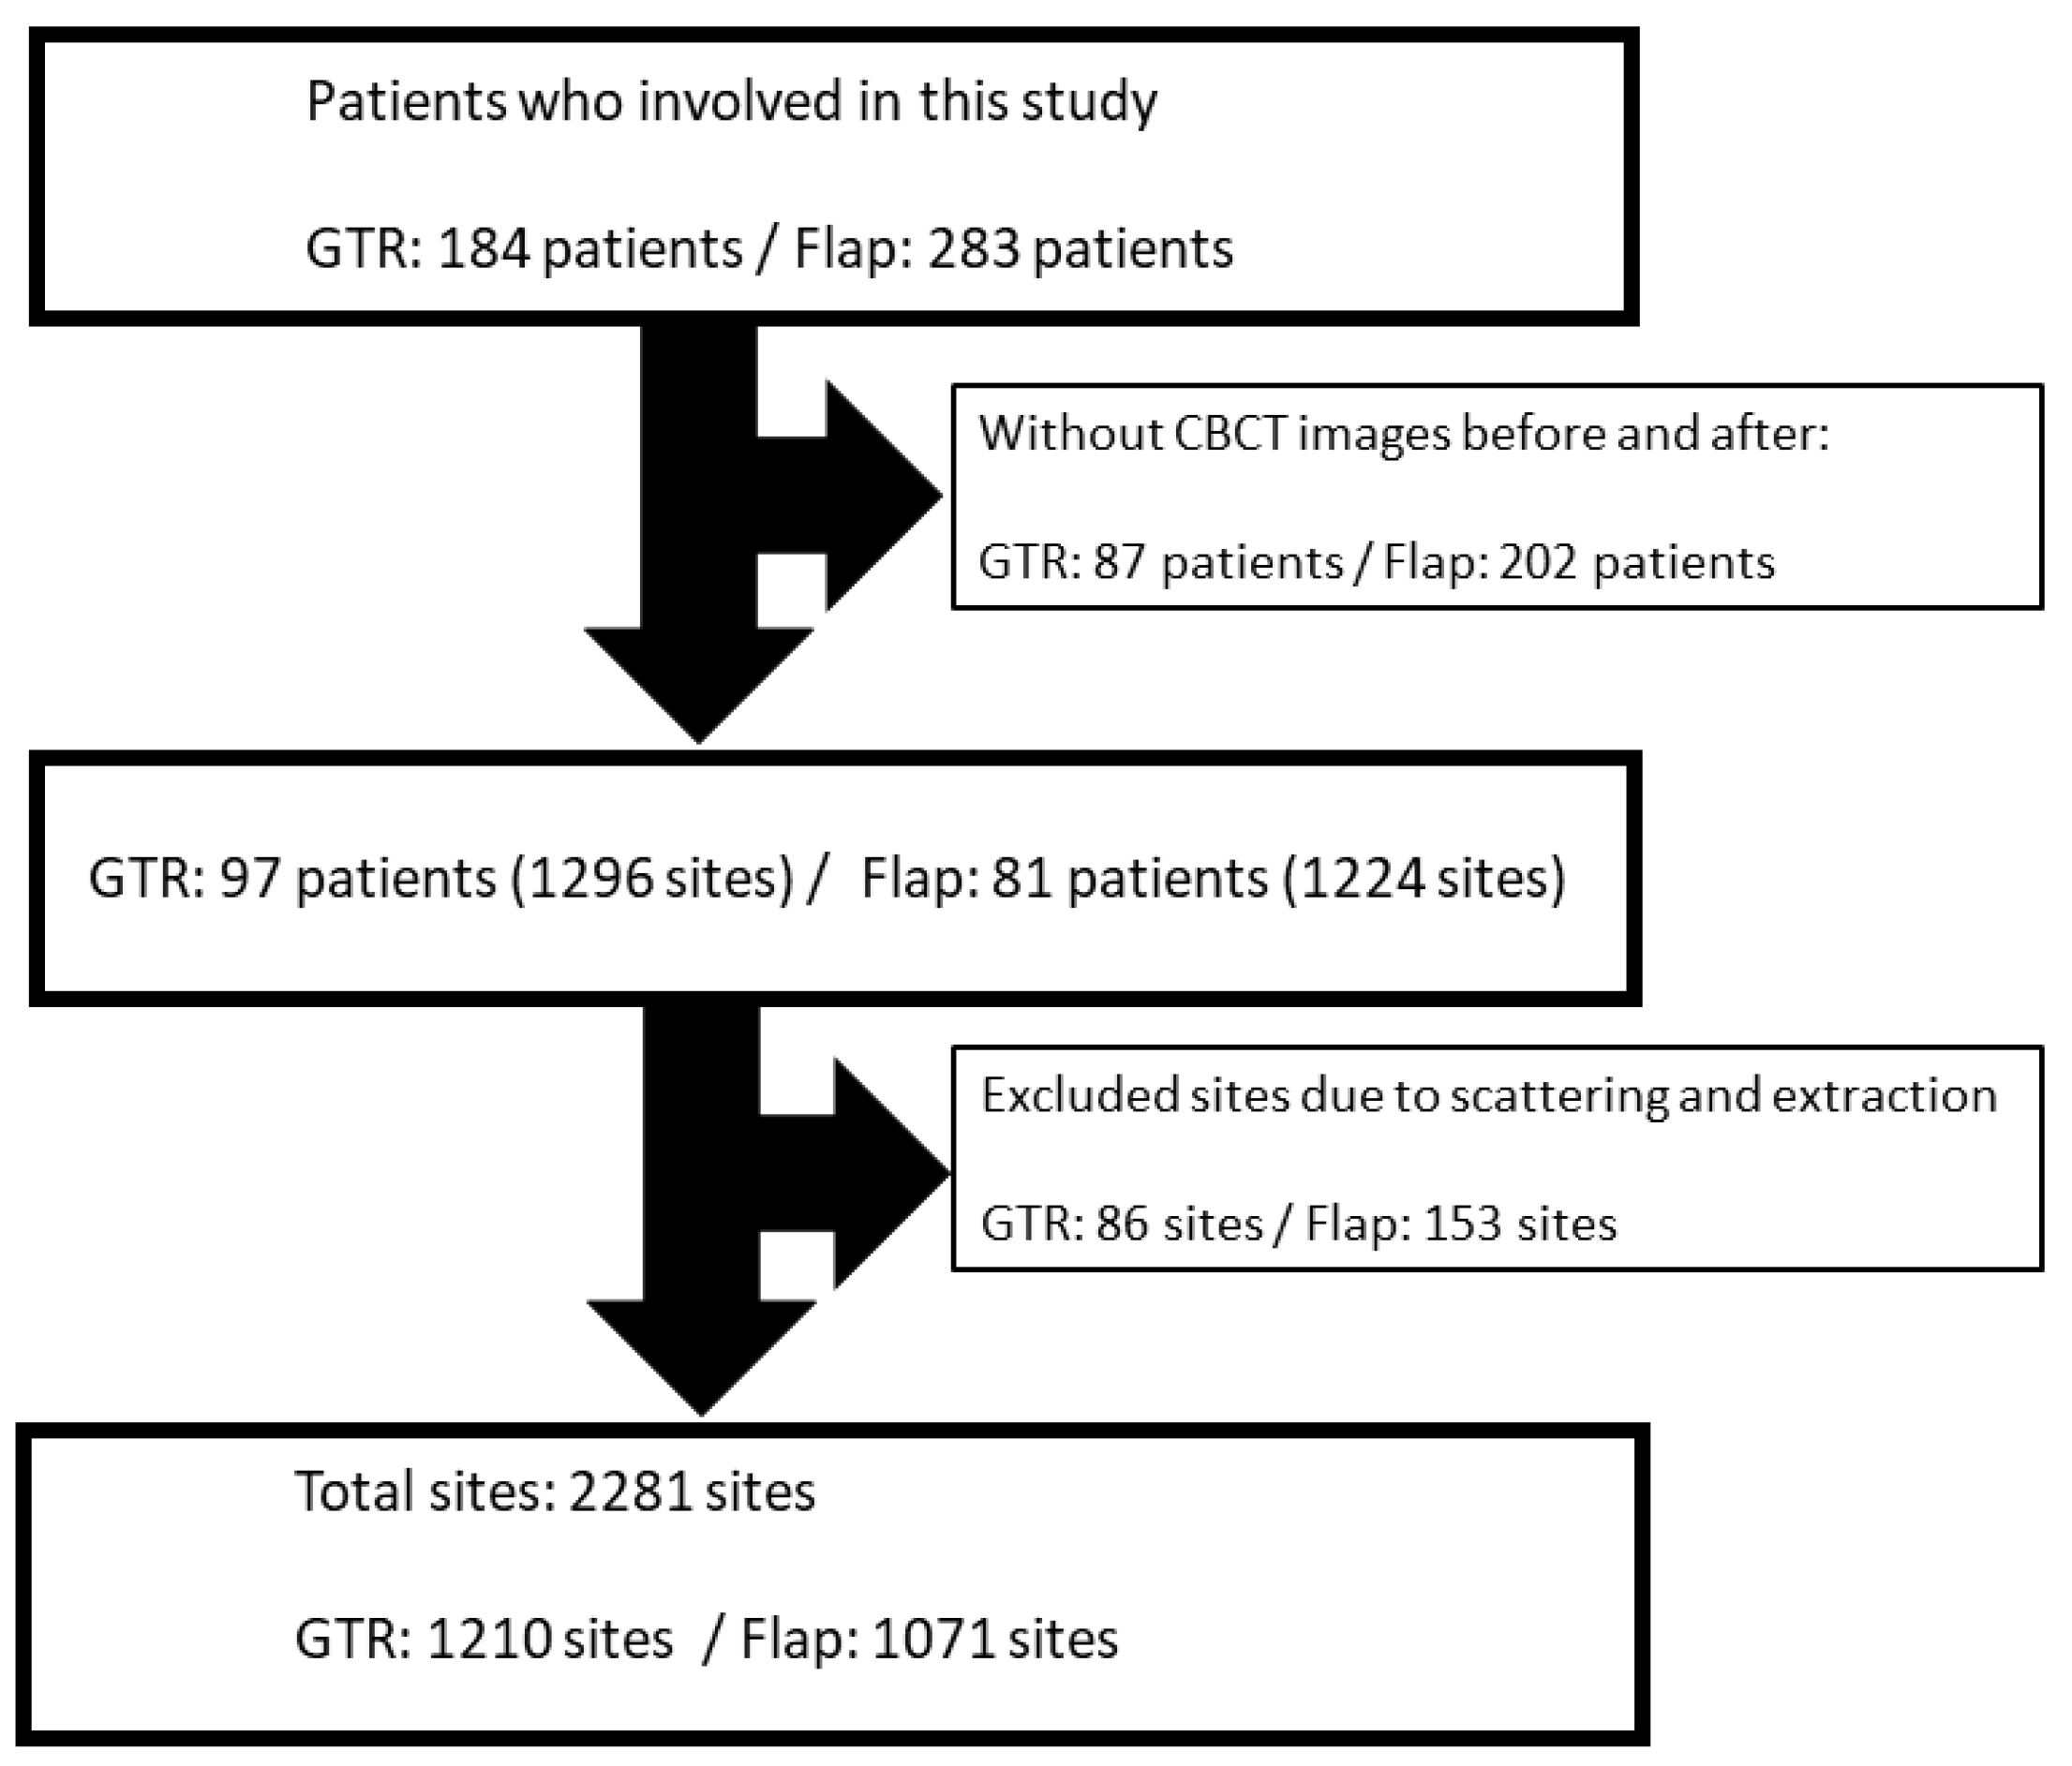
2.1. Study Population
- Clinical and radiographical diagnosis of severe chronic periodontitis;
- Presence of at least one intrabony defect of ≥ 3 mm on the radiographs;
- PPD ≥5 mm in the intrabony defects.
2.2. Pre-Treatment
2.3. Surgical Procedures
2.4. CBCT Taking and Maintenance Care (3 and 6 Months)
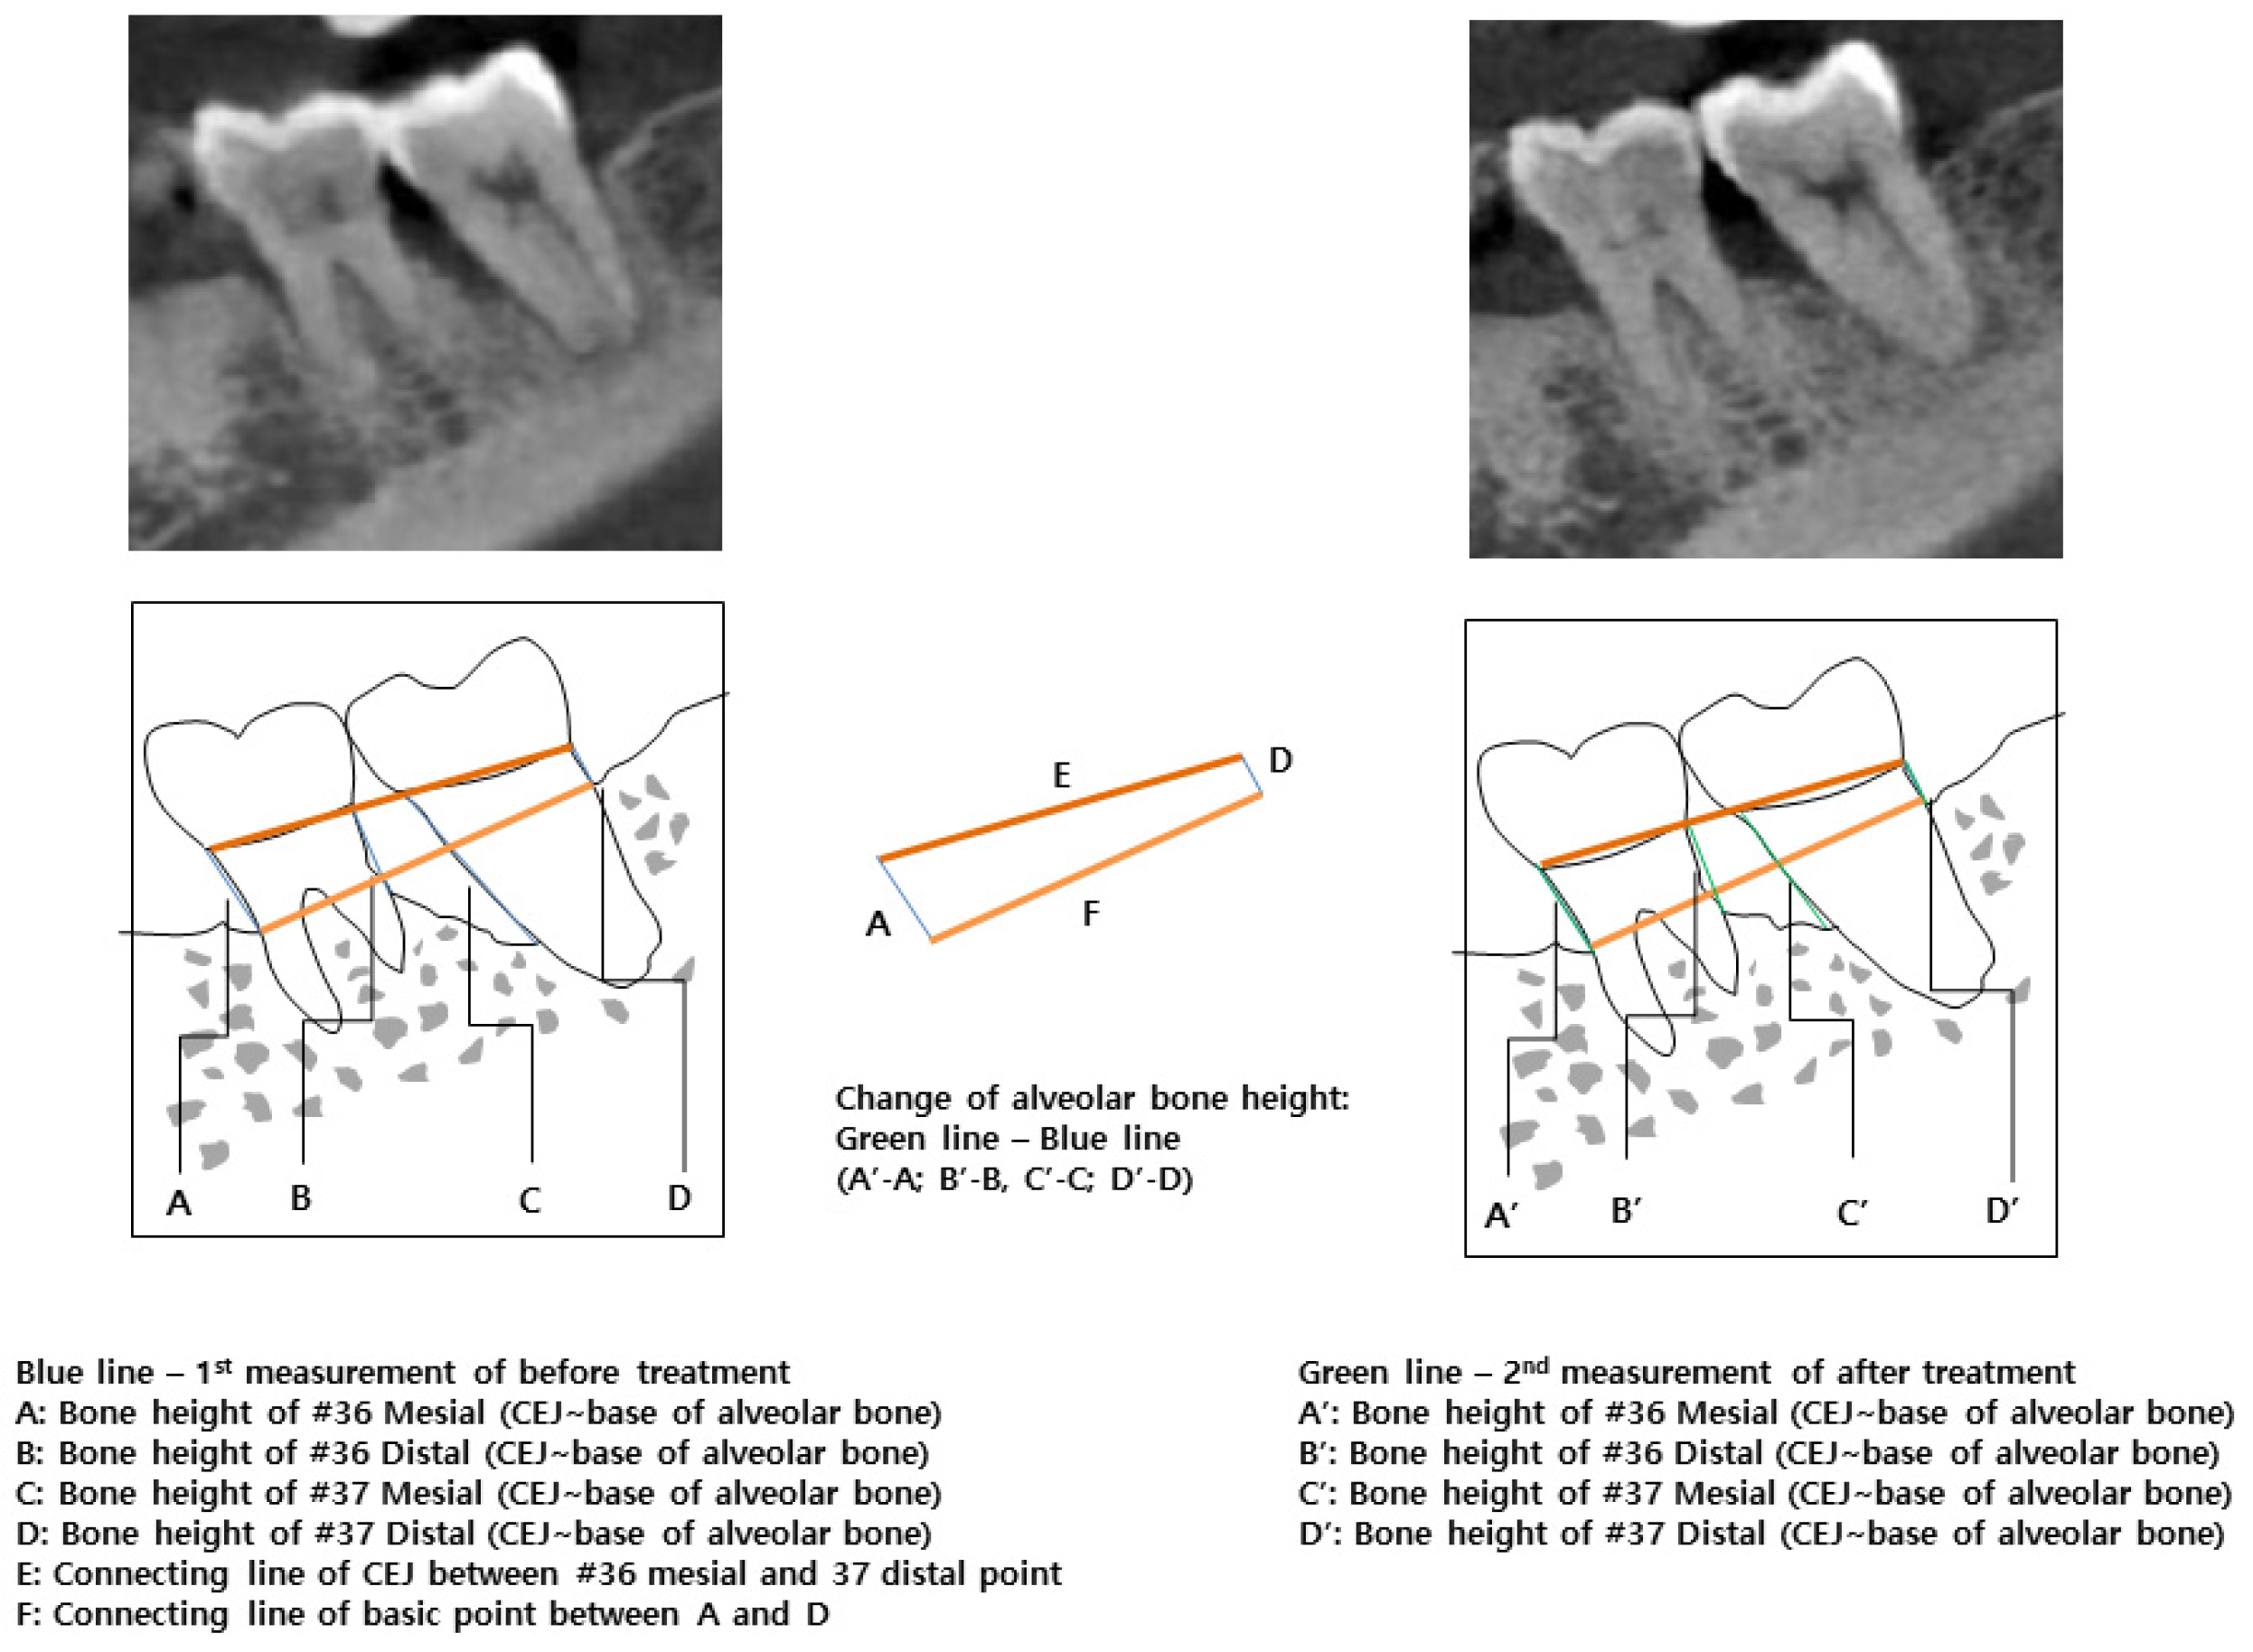
2.5. Radiographic Evaluation and Bone Height Measurement
2.6. Statistical Analysis
3. Results
3.1. Baseline Characteristics
3.2. Association of Tooth Site and Bone Height between GTR and Flap
3.3. Association of Sex and Bone Height between GTR and Flap
3.4. Association of Smoking and Bone Height between GTR and Flap
3.5. Association of Age and Bone Height between GTR and Flap
3.6. Association of CBCT Interval and Bone Height between GTR and Flap
3.7. Multivariable Analysis for Alveolar Bone Loss after Treatment
4. Discussion
5. Conclusions
Author Contributions
Funding
Institutional Review Board Statement
Informed Consent Statement
Data Availability Statement
Conflicts of Interest
References
- Lang, N.P.; Lindhe, J. Clinical Periodontology and Implant Dentistry, 5th ed.; John Wiley & Sons: New York, NY, USA, 2015; pp. 783–786. [Google Scholar]
- Rosen, P.S.; Reynolds, M.A.; Bowers, G.M. The treatment of intrabony defects with bone grafts. J. Periodontol. 2000, 22, 88–103. [Google Scholar] [CrossRef]
- Cortellini, P.; Tonetti, M.S. Focus on intrabony defects: Guided tissue regeneration. Periodontol. 2000 2000, 22, 104–132. [Google Scholar] [CrossRef]
- Nevins, M.L.; Camelo, M.; Lynch, S.E.; Schenk, R.K.; Nevins, M. Evaluation of periodontal regeneration following grafting intrabony defects with bio-oss collagen: A human histologic report. Int. J. Periodontics Restor. Dent. 2003, 23, 9–17. [Google Scholar]
- Sculean, A.; Berakdar, M.; Chiantella, G.C.; Donos, N.; Arweiler, N.B.; Brecx, M. Healing of intrabony defects following treatment with a bovine-derived xenograft and collagen membrane: A controlled clinical study. J. Periodontol. 2003, 30, 73–80. [Google Scholar] [CrossRef] [PubMed]
- Stavropoulos, A.; Karring, E.S.; Kostopoulos, L.; Karring, T. Deproteinized bovine bone and gentamicin as an adjunct to GTR in the treatment of intrabony defects: A randomized controlled clinical study. J. Clin. Periodontol. 2003, 30, 486–495. [Google Scholar] [CrossRef]
- Blank, B.S.; Levy, A.R. Combined treatment of a large periodontal defect using GTR and DFDBA. J. Int. J. Periodontics Restor. Dent. 1999, 19, 480–487. [Google Scholar]
- Parashis, A.; Andronikaki-Faldami, A.; Tsiklakis, K. Comparison of 2 Regenerative Procedures—Guided Tissue Regeneration and Demineralized Freeze-Dried Bone Allograft—in the Treatment of Intrabony Defects: A Clinical and Radiographic Study. J. Periodontol. 1998, 69, 751–758. [Google Scholar] [CrossRef]
- Luepke, P.G.; Mellonig, J.T.; Brunsvold, M.A. A clinical evaluation of a bioresorbable barrier with and without decalcified freeze-dried bone allograft in the treatment of molar furcations. J. Clin. Periodontol. 1997, 24, 440–446. [Google Scholar] [CrossRef]
- Kiany, F.; Moloudi, F. Amnion membrane as a novel barrier in the treatment of intrabony defects: A controlled clinical trial. Int. J. Oral. Maxillofac. Implant. 2015, 30, 639–647. [Google Scholar] [CrossRef] [Green Version]
- Bunyaratavej, P.; Wang, H.L. Collagen membranes: A review. J. Periodontol. 2001, 72, 215–229. [Google Scholar] [CrossRef] [PubMed] [Green Version]
- Sanz-Sánchez, I.; Ortiz-Vigón, A.; Sanz-Martin, I.; Figuero, E.; Sanz, M. Effectiveness of lateral bone augmentation on the alveolar crest dimension: A systematic review and meta-analysis. Dent. Res. J. 2015, 94, 128S–142S. [Google Scholar] [CrossRef] [PubMed]
- Behring, J.; Junker, R.; Walboomers, X.F.; Chessnut, B.; Jansen, J.A. Toward guided tissue and bone regeneration: Morphology, attachment, proliferation, and migration of cells cultured on collagen barrier membranes. A systematic review. Odontology 2008, 96, 1–11. [Google Scholar] [CrossRef] [PubMed]
- Becker, J.; Al-Nawas, B.; Klein, M.O.; Schliephake, H.; Terheyden, H.; Schwarz, F. Use of a new cross-linked collagen membrane for the treatment of dehiscence-type defects at titanium implants: A prospective, randomized-controlled double-blinded clinical multicenter study. Clin. Oral. Implant. Res. 2009, 20, 742–749. [Google Scholar] [CrossRef]
- Drexler, J.W.; Powell, H.M. Dehydrothermal crosslinking of electrospun collagen. Tissue Eng. Part C Methods 2011, 17, 9–17. [Google Scholar] [CrossRef] [PubMed]
- Misch, K.A.; Yi, E.S.; Sarment, D.P. Accuracy of cone beam computed tomography for periodontal defect measurements. J. Periodontol. 2006, 77, 1261–1266. [Google Scholar] [CrossRef] [PubMed]
- Vandenberghe, B.; Jacobs, R.; Yang, J. Diagnostic validity (or acuity) of 2D CCD versus 3D CBCT-images for assessing periodontal breakdown. Oral. Surg. Oral. Med. Oral. Pathol. Oral. Radiol. 2007, 104, 395–401. [Google Scholar] [CrossRef] [PubMed]
- Vandenberghe, B.; Jacobs, R.; Yang, J. Detection of periodontal bone loss using digital intraoral and cone beam computed tomography images: An in vitro assessment of bony and/or infrabony defects. Dentomaxillofac. Radiol. 2008, 37, 252–260. [Google Scholar] [CrossRef]
- Ratka-Krüger, P.; Neukranz, E.; Raetzke, P. Guided tissue regeneration procedure with bioresorbable membranes versus conventional flap surgery in the treatment of infrabony periodontal defects. J. Clin. Periodontol. 2000, 27, 120–127. [Google Scholar] [CrossRef]
- Tonetti, M.S.; Cortellini, P.; Lang, N.P.; Suvan, J.E.; Adriaens, P.; Dubravec, D. Clinical outcomes following treatment of human intrabony defects with GTR/bone replacement material or access flap alone. A multicenter randomized controlled clinical trial. J. Clin. Periodontol. 2004, 31, 770–776. [Google Scholar] [CrossRef]
- Petsos, H.; Ratka-Krüger, P.; Neukranz, E.; Raetzke, P.; Eickholz, P.; Nickles, K. Infrabony defects 20 years after open flap debridement and guided tissue regeneration. J. Clin. Periodontol. 2019, 46, 552–563. [Google Scholar] [CrossRef]
- Tonetti, M.; Cortellini, P.; Suvan, J.; Adriaens, P.; Baldi, C.; Dubravec, D. Evaluation of generalizability of the added benefit of GTR in the treatment of deep intrabony defects. A phase iv multicenter randomized controlled clinical trial. J. Periodontol. 1998, 69, 1183–1192. [Google Scholar] [CrossRef]
- Cortellini, P.; Tonetti, M.S.; Lang, N.P.; Suvan, J.E.; Zucchelli, G.; Vangsted, T. The simplified papilla preservation flap in the regenerative treatment of deep intrabony defects: Clinical outcomes and postoperative morbidity. J. Periodontol. 2001, 72, 1702–1712. [Google Scholar] [CrossRef]
- Nibali, L.; Koidou, V.P.; Nieri, M.; Barbato, L.; Pagliaro, U.; Cairo, F. Regenerative surgery versus access flap for the treatment of intrabony periodontal defects. A systematic review and meta-analysis. J. Clin. Periodontol. 2019, 47, 320–351. [Google Scholar] [CrossRef] [Green Version]
- Dorj, O.; Lee, W.-F.; Salamanca, E.; Pan, Y.-H.; Wu, Y.-F.; Hsu, Y.-S.; Lin, J.C.Y.; Lin, Y.-D.; Choy, C.-S.; Chang, W.-J. Guided Tissue Regeneration Treatment Yields Better Results in Class II Furcations in the Mandible Than in the Maxilla: A Retrospective Study. Int. J. Environ. Res. Public Health 2021, 18, 7447. [Google Scholar] [CrossRef]
- Metzler, D.G.; Seamons, B.C.; Mellonig, J.T.; Gher, M.E.; Gray, J.L. Clinical Evaluation of Guided Tissue Regeneration in the Treatment of Maxillary Class II Molar Furcation Invasions. J. Periodontol. 1991, 62, 353–360. [Google Scholar] [CrossRef]
- Pontoriero, R.; Lindhe, J. Guided tissue regeneration in the treatment of degree II furcations in maxillary molars. J. Clin. Periodontol. 1995, 22, 756–763. [Google Scholar] [CrossRef]
- Bhedasgaonkar, S.Y.; Kapadia, J.; Patil, N.A. Treatment of infrabony defects with platelet-rich fibrin along with bone graft: Case report. J. Int. Clin. Dent. Res. Organ. 2015, 7, 69–74. [Google Scholar]
- Hills, D. Evaluation of Demineralized Freeze-Dried Bone Allograft in Combination with Chorion Membrane in the Treatment of Grade II Furcation Defects: A Randomized Controlled Trial. Periodontics 2019, 39, 659–667. [Google Scholar]
- Camelo, M.; Nevins, M.L.; Lynch, S.E.; Schenk, R.K.; Simion, M.; Nevins, M. Periodontal regeneration with an autogenous bone-Bio-Oss composite graft and a Bio-Gide membrane. Int. J. Periodontics Restor. Dent. 2001, 21, 109–120. [Google Scholar]
- Yamada, S.; Shima, N.; Kitamura, H.; Sugito, H. Effect of porous xenographic bone graft with collagen barrier membrane on periodontal regeneration. Int. J. Periodontics Restor. Dent. 2002, 22, 389–397. [Google Scholar]
- Murphy, K.G.; Gunsolley, J.C. Guided tissue regeneration for the treatment of periodontal intrabony and furcation defects. A systematic review. Ann. Periodontol. 2003, 8, 266–302. [Google Scholar] [CrossRef] [PubMed]
- Ortolani, E.; Quadrini, F.; Bellisario, D.; Santo, L.; Polimeni, A.; Santarsiero, A. Mechanical qualification of collagen membranes used in dentistry. Ann. dell’Istituto Super. Sanita 2015, 51, 229–235. [Google Scholar]
- Park, J.I.; Yang, C.; Kim, Y.T.; Kim, M.S.; Lee, J.S.; Choi, S.H. Space maintenance using crosslinked collagenated porcine bone grafted without a barrier membrane in one-wall intrabony defects. J. Biomed. Mater. Res. B Appl. Biomater. 2014, 102, 1454–1461. [Google Scholar] [CrossRef] [PubMed]
- Jung, U.W.; Cha, J.K.; Vignoletti, F.; Nuñez, J.; Sanz, J.; Sanz, M. Simultaneous lateral bone augmentation and implant placement using a particulated synthetic bone substitute around chronic peri-implant dehiscence defects in dogs. J. Clin. Periodontol. 2017, 44, 1172–1180. [Google Scholar] [CrossRef]
- Paolantonio, M. Combined periodontal regenerative technique in human intrabony defects by collagen membranes and anorganic bovine bone. A controlled clinical study. J. Periodontol. 2002, 73, 158–166. [Google Scholar] [CrossRef]
- Silvipriya, K.; Kumar, K.K.; Bhat, A.; Kumar, B.D.; John, A.; Lakshmanan, P. Collagen: Animal sources and biomedical application. J. Appl. Pharm. Sci. 2015, 5, 123–127. [Google Scholar] [CrossRef] [Green Version]
- Cortial, D.; Gouttenoire, J.; Rousseau, C.; Ronzière, M.-C.; Piccardi, N.; Msika, P. Activation by IL-1 of bovine articular chondrocytes in culture within a 3D collagen-based scaffold. An in vitro model to address the effect of compounds with therapeutic potential in osteoarthritis. Osteoarthr. Cartil. 2006, 14, 631–640. [Google Scholar] [CrossRef] [Green Version]
- Lee, J.H.; Lee, J.S.; Baek, W.S.; Lim, H.C.; Cha, J.K.; Choi, S.H. Assessment of dehydrothermally cross-linked collagen membrane for guided bone regeneration around peri-implant dehiscence defects: A randomized single-blinded clinical trial. J. Periodontal Implant. Sci. 2015, 45, 229–237. [Google Scholar] [CrossRef] [Green Version]
- Mohan, R.; Mark, R.; Sing, I.; Jain, A. Diagnostic Accuracy of CBCT for Aggressive Periodontitis. J. Clin. Imaging Sci. 2014, 4, 2. [Google Scholar] [CrossRef] [Green Version]
- Feijo, C.V.; Lucena, J.G.; Kurita, L.M.; Pereira, S.L. Evaluation of cone beam computed tomography in the detection of horizontal periodontal bone defects: An in vivo study. Int. J. Periodontics Restor. Dent. 2012, 32, 162–168. [Google Scholar]
- Zhao, H.; Wang, H.; Pan, Y.; Pan, C.; Jin, X. The relationship between root concavities in first premolars and chronic periodontitis. J. Periodontal. Res. 2014, 49, 213–219. [Google Scholar] [CrossRef] [PubMed]
- Ludlow, J.B.; Davies-Ludlow, L.E.; Brooks, S.L.; Howerton, W.B. Dosimetry of 3 CBCT devices for oral and maxillofacial radiology: CB Mercuray, NewTom 3G and i-CAT. Dentomaxillofac. Radiol. 2006, 35, 219–226. [Google Scholar] [CrossRef] [PubMed]


| Variable | GTR (mm) | Flap (mm) | p 2 | ||||
|---|---|---|---|---|---|---|---|
| N | Mean (SD) | p 1 | N | Mean (SD) | p 1 | ||
| Total N/mean (SD) | 2281 | 0.10 (1.19) | |||||
| 1210 | 0.03 (0.13) | 1071 | 0.190 (0.104) | 0.00001 * | |||
| Sex | 0.939 | 0.079 | |||||
| Male (%) | 594 (49.1) | 0.01 (1.22) | 666 (62.2) | 0.18 (1.14) | 0.010 * | ||
| Female (%) | 616 (50.9) | 0.05 (1.37) | 405 (37.8) | 0.20 (0.85) | 0.00002 * | ||
| Age [years, mean (SD)] | 49.77 (8.03) | 0.001 * | 51.25 (9.40) | 0.417 | |||
| 29–45 (%) | 416 (34) | −0.17 (1.21) | 376 (35) | 0.17 (0.10) | 0.00001 * | ||
| 46–53 (%) | 388 (32) | 0.19 (1.26) | 0.0004 * | 312 (29) | 0.24 (1.11) | 0.217 | 0.040 * |
| 54–76 (%) | 406 (34) | 0.08 (1.39) | 0.006 * 0.565 | 383 (36) | 0.16 (1.01) | 0.901 0.280 | 0.125 |
| Smoking | 0.551 | 0.301 | |||||
| Present (%) | 280 (21.6) | 0.10 (1.30) | 239 (19.5) | 0.22 (1.23) | 0.120 | ||
| Past (%) | 91 (7.0) | −0.05 (1.05) | 0.415 | 82 (6.7) | 0.09 (1.14) | 0.218 | 0.693 |
| Not (%) | 839 (64.7) | 0.01 (1.32) | 0.317 0.930 | 750 (61.3) | 0.12 (0.96) | 0.891 0.334 | 0.009 * |
| CBCT interval [days, mean (SD)] | 692.67 (351.28) | 0.131 | 688.42 (342.93) | 0.954 | |||
| 87–490 | 404 (33) | −0.06 (1.23) | 332 (31) | 0.17 (0.83) | 0.0001 * | ||
| 491–859 | 362 (30) | 0.02 (1.24) | 0.241 | 419 (39) | 0.20 (1.24) | 0.795 | 0.018 * |
| 860–1543 | 444 (37) | 0.11 (1.40) | 0.051 0.373 | 320 (30) | 0.20 (0.95) | 0.948 0.797 | 0.092 |
| Systemic diseases | 0.546 | 0.004 * | |||||
| Hypertension (%) | 74 (6) | 0.15 (1.49) | 140 (13) | 0.30 (1.17) | 0.130 | ||
| Rhinitis, Sinusitis (%) | 14 (1) | −0.01 (0.47) | 0.986 | 64 (6) | 0.03 (0.82) | 0.104 0.083 | 0.824 |
| Hepatitis (%) | 14 (1) | 0.32 (0.84) | 0.201 0.129 | 16 (1) | −0.35 (0.74) | 0.021 0.013 0.145 | 0.022 * |
| Diabetes mellitus, Hyperlipidemia (%) | 30 (2) | −0.15 (0.72) | 0.504 0.648 0.051 | 68 (6) | −0.05 (0.84) | 0.017 0.007 0.411 0.335 | 0.945 |
| None (%) | 1078 (89) | 0.02 (1.31) | 0.963 0.905 0.132 0.399 | 783 (73) | 0.22 (1.05) | 0.619 | 0.00001 * |
| Medicine | 0.286 | 0.011 * | |||||
| Aspirin, Hypertension (%) | 30 (2) | −0.22 (0.98) | 148 (14) | 0.17 (1.02) | 0.107 | ||
| Anticoagulant (%) | 32 (3) | −0.01 (1.44) | 0.972 | 0 (0) | - | - | - |
| Diabetes mellitus, hyperlipidemia (%) | 24 (2) | 0.23 (0.51) | 0.084 0.071 | 40 (4) | −0.21 (0.96) | 0.023 0.002 * | 0.018 * |
| None (%) | 1124 (93) | 0.03 (1.31) | 0.398 0.391 0.136 | 883 (82) | 0.21 (1.05) | 0.621 | 0.00001 * |
| Oral regions | 0.568 | 0.004 * | |||||
| #14–17 (%) | 298 (25) | 0.04 (1.21) | 302 (28) | 0.32 (0.91) | 0.00001 * | ||
| #24–27 (%) | 362 (30) | 0.10 (1.50) | 0.893 | 264 (25) | 0.07 (1.05) | 0.004 * | 0.342 |
| #34–37 (%) | 274 (23) | −0.03 (1.10) | 0.379 0.323 | 232 (22) | 0.18 (0.91) | 0.030 0.556 | 0.024 * |
| #44–47 (%) | 276 (23) | −0.03 (1.29) | 0.320 0.265 0.880 | 273 (25) | 0.18 (1.25) | 0.001 * 0.768 0.427 | 0.087 |
| Precise sites | 0.735 | 0.537 | |||||
| #04 (%) | 312 (26) | −0.03 (1.06) | 282 (26) | 0.11 (0.76) | 0.033 * | ||
| #05 (%) | 312 (26) | −0.04 (0.94) | 0.808 | 282 (26) | 0.17 (0.91) | 0.180 | 0.002 * |
| #06 (%) | 306 (25) | 0.09 (1.23) | 0.291 0.380 | 261 (24) | 0.22 (1.04) | 0.198 0.979 | 0.061 |
| #07 (%) | 280 (23) | 0.10 (1.84) | 0.921 0.961 0.445 | 246 (23) | 0.28 (1.40) | 0.394 0.840 0.830 | 0.039 * |
| Variable | Surgery | ||||
|---|---|---|---|---|---|
| GTR | FLAP | p | |||
| N | Mean (SD) | N | Mean (SD) | ||
| Total | 1210 | 0.03 (0.13) | 1071 | 0.19 (0.10) | 0.00001 * |
| Location | |||||
| Site #10 | |||||
| #14M | 39 | −0.08 (1.38) | 38 | 0.26 (0.67) | 0.068 |
| #14D | 39 | −0.23 (1.21) | 38 | 0.32 (0.73) | 0.016 * |
| #15M | 39 | 0.01 (0.63) | 39 | 0.36 (0.64) | 0.036 * |
| #15D | 39 | 0.36 (1.04) | 39 | 0.30 (0.74) | 0.730 |
| #16M | 36 | 0.02 (1.18) | 38 | 0.21 (0.77) | 0.584 |
| #16D | 36 | 0.08 (1.39) | 38 | 0.32 (1.17) | 0.242 |
| #17M | 35 | 0.04 (0.98) | 36 | 0.40 (1.04) | 0.167 |
| #17D | 35 | 0.13 (1.68) | 36 | 0.39 (1.34) | 0.060 |
| Site #20 | |||||
| #24M | 48 | 0.03 (0.98) | 36 | −0.05 (0.80) | 0.978 |
| #24D | 48 | −0.09 (0.83) | 36 | −0.13 (0.87) | 0.964 |
| #25M | 47 | −0.22 (1.19) | 34 | 0.14 (0.78) | 0.244 |
| #25D | 47 | −0.29 (1.04) | 34 | −0.08 (1.33) | 0.043 * |
| #26M | 48 | 0.20 (1.20) | 31 | 0.36 (0.97) | 0.778 |
| #26D | 48 | 0.31 (1.62) | 31 | 0.13 (0.88) | 0.996 |
| #27M | 38 | 0.92 (2.91) | 31 | 0.05 (1.58) | 0.704 |
| #27D | 38 | 0.13 (1.37) | 31 | 0.15 (0.97) | 0.587 |
| Site #30 | |||||
| #34M | 33 | 0.05 (0.98) | 31 | 0.20 (0.64) | 0.326 |
| #34D | 33 | 0.04 (0.70) | 31 | 0.14 (0.60) | 0.427 |
| #35M | 35 | −0.22 (0.94) | 31 | 0.17 (0.68) | 0.073 |
| #35D | 35 | 0.00 (0.83) | 31 | 0.06 (0.79) | 0.867 |
| #36M | 35 | −0.17 (0.84) | 27 | −0.01 (0.97) | 0.243 |
| #36D | 35 | 0.01 (0.93) | 27 | 0.31 (0.96) | 0.203 |
| #37M | 34 | 0.22 (1.41) | 27 | 0.30 (1.31) | 0.890 |
| #37D | 34 | −0.17 (1.81) | 27 | 0.27 (1.23) | 0.576 |
| Site #40 | |||||
| #44M | 36 | −0.19 (1.01) | 36 | 0.11 (0.98) | 0.463 |
| #44D | 36 | 0.24 (1.28) | 36 | −0.01 (0.60) | 0.426 |
| #45M | 35 | 0.16 (0.84) | 37 | 0.08 (0.96) | 0.660 |
| #45D | 35 | −0.02 (0.67) | 37 | 0.25 (1.11) | 0.266 |
| #46M | 34 | 0.21 (1.45) | 34 | 0.13 (1.35) | 0.628 |
| #46D | 34 | −0.02 (0.84) | 35 | 0.24 (1.19) | 0.601 |
| #47M | 33 | −0.37 (1.28) | 29 | 0.47 (1.57) | 0.023 * |
| #47D | 33 | −0.25 (2.29) | 29 | 0.22 (2.08) | 0.277 |
| Variable | Sex | |||||||||
|---|---|---|---|---|---|---|---|---|---|---|
| Male | Female | |||||||||
| GTR | FLAP | p | GTR | FLAP | p | |||||
| N | Mean (SD) | N | Mean (SD) | N | Mean (SD) | N | Mean (SD) | |||
| Total | 594 | 0.00 (0.12) | 666 | 0.18 (0.11) | 0.010 * | 616 | 0.05 (0.14) | 405 | 0.20 (0.09) | 0.00001 * |
| Location | ||||||||||
| Site #10 | ||||||||||
| #14M | 18 | −0.16 (1.86) | 20 | 0.28 (0.80) | 0.120 | 21 | −0.01 (0.82) | 18 | 0.25 (0.50) | 0.366 |
| #14D | 18 | −0.08 (0.74) | 20 | 0.25 (0.71) | 0.253 | 21 | −0.36 (1.51) | 18 | 0.41 (0.76) | 0.028 * |
| #15M | 19 | 0.02 (0.69) | 21 | 0.19 (0.62) | 0.606 | 20 | 0.01 (0.58) | 18 | 0.55 (0.62) | 0.009 * |
| #15D | 19 | 0.54 (1.32) | 21 | 0.25 (0.85) | 0.635 | 20 | 0.20 (0.67) | 18 | 0.36 (0.61) | 0.285 |
| #16M | 18 | 0.13 (0.62) | 20 | 0.19 (0.82) | 0.769 | 18 | −0.09 (1.56) | 18 | 0.23 (0.73) | 0.635 |
| #16D | 18 | −0.03 (0.89) | 20 | 0.38 (1.25) | 0.278 | 18 | 0.20 (1.77) | 18 | 0.27 (1.10) | 0.569 |
| #17M | 17 | 0.04 (0.69) | 18 | 0.53 (1.23) | 0.215 | 18 | 0.04 (1.21) | 18 | 0.26 (0.82) | 0.410 |
| #17D | 17 | −0.07 (1.64) | 18 | 0.44 (1.84) | 0.203 | 18 | 0.31 (1.74) | 18 | 0.34 (0.58) | 0.260 |
| Site #20 | ||||||||||
| #24M | 20 | 0.27 (1.03) | 24 | −0.14 (0.85) | 0.310 | 28 | −0.14 (0.92) | 12 | 0.13 (0.68) | 0.214 |
| #24D | 20 | 0.11 (0.77) | 24 | −0.15 (0.92) | 0.315 | 28 | −0.23 (0.85) | 12 | −0.09 (0.79) | 0.594 |
| #25M | 20 | 0.07 (0.77) | 23 | 0.20 (0.83) | 0.706 | 27 | −0.43 (1.40) | 11 | 0.03 (0.69) | 0.202 |
| #25D | 20 | −0.16 (0.66) | 23 | −0.21 (1.55) | 0.227 | 27 | −0.40 (1.25) | 11 | 0.20 (0.70) | 0.084 |
| #26M | 21 | 0.21 (0.76) | 19 | 0.28 (0.97) | 0.734 | 27 | 0.19 (1.46) | 12 | 0.48 (1.00) | 0.511 |
| #26D | 21 | 0.05 (0.79) | 19 | 0.14 (1.09) | 0.776 | 27 | 0.50 (2.05) | 12 | 0.12 (0.41) | 0.681 |
| #27M | 14 | 0.34 (1.14) | 20 | 0.02 (1.21) | 0.612 | 24 | 1.26 (3.55) | 11 | 0.12 (2.18) | 0.831 |
| #27D | 14 | −0.11 (1.02) | 20 | 0.19 (1.15) | 0.889 | 24 | 0.28 (1.54) | 11 | 0.08 (0.56) | 0.444 |
| Site #30 | ||||||||||
| #34M | 18 | −0.01 (0.93) | 22 | 0.22 (0.70) | 0.663 | 15 | 0.11 (1.07) | 9 | 0.16 (0.52) | 0.323 |
| #34D | 18 | 0.17 (0.76) | 22 | 0.15 (0.56) | 0.859 | 15 | −0.11 (0.62) | 9 | 0.12 (0.72) | 0.370 |
| #35M | 19 | −0.18 (1.22) | 21 | 0.06 (0.68) | 0.542 | 16 | −0.27 (0.45) | 10 | 0.40 (0.66) | 0.012 * |
| #35D | 19 | −0.05 (1.03) | 21 | 0.18 (0.93) | 0.480 | 16 | 0.06 (0.54) | 10 | −0.19 (0.29) | 0.169 |
| #36M | 19 | −0.18 (1.01) | 20 | 0.08 (0.99) | 0.291 | 16 | −0.15 (0.62) | 7 | −0.27 (0.93) | 0.788 |
| #36D | 19 | −0.02 (0.90) | 20 | 0.46 (1.00) | 0.109 | 16 | 0.04 (0.98) | 7 | −0.11 (0.70) | 0.867 |
| #37M | 17 | 0.30 (1.51) | 19 | 0.35 (1.42) | 0.886 | 17 | 0.15 (1.33) | 8 | 0.20 (1.10) | 0.815 |
| #37D | 17 | −0.24 (2.31) | 19 | 0.28 (1.29) | 0.775 | 17 | −0.11 (1.20) | 8 | 0.23 (1.14) | 0.640 |
| Site #40 | ||||||||||
| #44M | 20 | −0.16 (1.15) | 24 | 0.20 (1.12) | 0.351 | 16 | −0.23 (0.83) | 12 | −0.09 (0.62) | 0.834 |
| #44D | 20 | 0.26 (1.64) | 24 | −0.08 (0.64) | 0.457 | 16 | 0.21 (0.62) | 12 | 0.15 (0.50) | 0.889 |
| #45M | 19 | −0.03 (0.79) | 24 | −0.03 (1.03) | 0.990 | 16 | 0.38 (0.88) | 13 | 0.29 (0.79) | 0.676 |
| #45D | 19 | −0.22 (0.66) | 24 | 0.30 (1.33) | 0.126 | 16 | 0.22 (0.61) | 13 | 0.16 (0.54) | 0.947 |
| #46M | 19 | 0.34 (1.82) | 23 | 0.17 (1.58) | 0.752 | 15 | 0.03 (0.80) | 11 | 0.05 (0.72) | 0.658 |
| #46D | 19 | 0.02 (0.69) | 23 | 0.22 (1.41) | 0.889 | 15 | −0.06 (1.03) | 12 | 0.28 (0.61) | 0.282 |
| #47M | 19 | −0.77 (1.32) | 15 | 0.39 (1.89) | 0.017 * | 14 | 0.19 (1.01) | 14 | 0.56 (1.21) | 0.488 |
| #47D | 19 | −0.33 (2.85) | 15 | 0.60 (2.45) | 0.211 | 14 | −0.14 (1.28) | 14 | −0.19 (1.60) | 0.782 |
| Variable | Smoking | ||||||||||||||
|---|---|---|---|---|---|---|---|---|---|---|---|---|---|---|---|
| Present | Past | Not | |||||||||||||
| GTR | Flap | p | GTR | Flap | p | GTR | Flap | p | |||||||
| N | Mean (SD) | N | Mean (SD) | N | Mean (SD) | N | Mean (SD) | N | Mean (SD) | N | Mean (SD) | ||||
| Total | 280 | 0.10 (0.13) | 239 | 0.22 (0.12) | 0.120 | 91 | −0.05 (0.11) | 82 | 0.09 (0.11) | 0.693 | 839 | 0.01 (1.32) | 750 | 0.19 (0.96) | 0.009 * |
| Location | |||||||||||||||
| Site #10 | |||||||||||||||
| #14M | 8 | 0.56 (1.87) | 4 | 0.38 (0.34) | 0.495 | 3 | −0.13 (0.12) | 2 | 0.15 (0.64) | 1.000 | 28 | −0.25 (1.27) | 32 | 0.26 (0.71) | 0.096 |
| #14D | 10 | −0.03 (0.63) | 9 | 0.33 (0.41) | 0.205 | 5 | 0.16 (0.45) | 3 | 0.63 (0.67) | 0.131 | 24 | −0.39 (1.46) | 26 | 0.28 (0.82) | 0.080 |
| #15M | 9 | −0.11 (0.52) | 6 | 0.13 (0.29) | 0.473 | 4 | −0.58 (0.74) | 1 | N/A | 0.277 | 26 | 0.15 (0.60) | 32 | 0.40 (0.69) | 0.194 |
| #15D | 10 | 0.15 (0.95) | 11 | 0.47 (1.08) | 0.501 | 5 | 1.46 (2.07) | 1 | N/A | 0.546 | 24 | 0.23 (0.62) | 27 | 0.22 (0.57) | 0.769 |
| #16M | 5 | −0.66 (1.30) | 5 | 0.02 (1.21) | 0.465 | 3 | 0.63 (0.50) | 1 | N/A | 0.180 | 28 | 0.08 (1.18) | 32 | 0.25 (0.71) | 0.630 |
| #16D | 8 | 0.29 (0.38) | 11 | 0.17 (0.78) | 0.589 | 6 | −0.07 (0.58) | 2 | 0.40 (0.14) | 0.317 | 22 | 0.05 (1.75) | 25 | 0.38 (1.35) | 0.276 |
| #17M | 3 | −0.13 (0.95) | 6 | 0.48 (0.59) | 0.362 | 1 | N/A | 1 | N/A | 0.317 | 31 | 0.10 (0.98) | 29 | 0.38 (1.13) | 0.366 |
| #17D | 9 | 0.82 (1.92) | 10 | 0.88 (2.07) | 0.838 | 3 | −0.50 (0.52) | 4 | −0.23 (0.30) | 0.368 | 23 | −0.06 (1.64) | 22 | 0.28 (0.97) | 0.044 |
| Site #20 | |||||||||||||||
| #24M | 9 | 0.69 (1.27) | 6 | −0.43 (0.60) | 0.037* | 1 | N/A | 0 | N/A | N/A | |||||
| #24D | 12 | 0.36 (0.45) | 14 | −0.34 (0.88) | 0.074 | 5 | −0.32 (0.99) | 3 | −1.03 (1.30) | 0.294 | 38 | −0.13 (0.86) | 30 | 0.02 (0.82) | 0.332 |
| #25M | 8 | 0.10 (0.62) | 7 | −0.11 (0.89) | 0.602 | 1 | N/A (N/A) | 1 | N/A | 0.317 | 31 | −0.23 (0.87) | 19 | 0.17 (0.66) | 0.126 |
| #25D | 14 | −0.09 (0.74) | 9 | 0.12 (0.69) | 0.229 | 4 | −0.83 (0.76) | 5 | 0.48 (0.53) | 0.027* | 38 | −0.26 (1.28) | 26 | 0.25 (0.74) | 0.089 |
| #26M | 10 | −0.26 (0.80) | 6 | −0.07 (0.70) | 0.785 | 2 | 0.15 (0.21) | 4 | 0.53 (1.36) | 1.000 | 29 | −0.32 (1.18) | 20 | −0.31 (1.64) | 0.380 |
| #26D | 10 | −0.08 (0.80) | 9 | −0.17 (1.17) | 0.870 | 5 | 0.02 (0.18) | 3 | 0.80 (0.96) | 0.453 | 36 | 0.33 (1.29) | 21 | 0.44 (0.97) | 0.993 |
| #27M | 9 | 1.24 (1.49) | 5 | −1.06 (1.31) | 0.019 * | 1 | N/A | 3 | 0.67 (0.65) | 0.180 | 33 | 0.47 (1.90) | 19 | 0.17 (0.67) | 0.754 |
| #27D | 14 | 0.46 (1.48) | 13 | 0.34 (1.30) | 0.697 | 1 | N/A | 4 | −0.03 (0.41) | 0.717 | 28 | 0.94 (3.24) | 23 | 0.21 (1.65) | 0.622 |
| Site #30 | |||||||||||||||
| #34M | 6 | 0.10 (0.73) | 3 | −0.37 (0.67) | 0.362 | 2 | −0.20 (2.12) | 3 | −0.07 (0.55) | 1.000 | 25 | 0.06 (0.99) | 25 | 0.3 (0.63) | 0.161 |
| #34D | 11 | 0.04 (0.65) | 8 | 0.23 (0.52) | 0.617 | 2 | −0.40 (0.28) | 2 | −0.35 (0.64) | 1.000 | 20 | 0.09 (0.76) | 21 | 0.15 (0.63) | 0.522 |
| #35M | 6 | −1.05 (1.23) | 2 | −0.10 (0.14) | 0.129 | 1 | N/A | 1 | N/A | 0.317 | 28 | −0.07 (0.80) | 28 | 0.16 (0.69) | 0.221 |
| #35D | 12 | −0.18 (1.16) | 10 | 0.36 (0.55) | 0.289 | 2 | 0.75 (0.07) | 2 | 0.55 (1.20) | 1.000 | 21 | 0.03 (0.60) | 19 | −0.15 (0.83) | 0.635 |
| #36M | 4 | −0.10 (0.22) | 4 | −0.18 (1.98) | 0.468 | 2 | −0.50 (0.14) | 1 | N/A | 0.480 | 29 | −0.16 (0.92) | 22 | 0.05 (0.76) | 0.336 |
| #36D | 10 | −0.05 (0.75) | 9 | 0.37 (0.97) | 0.487 | 3 | 0.57 (0.90) | 3 | 0.20 (1.13) | 0.827 | 22 | −0.04 (1.01) | 15 | 0.29 (0.99) | 0.233 |
| #37M | 7 | 0.59 (1.51) | 4 | 1.48 (2.13) | 0.448 | 3 | 0.50 (0.50) | 4 | 0.33 (1.30) | 0.858 | 24 | 0.08 (1.46) | 19 | 0.05 (1.04) | 0.961 |
| #37D | 9 | −0.51 (2.84) | 6 | 0.22 (0.93) | 0.637 | 2 | 0.70 (0.99) | 4 | −1.20 (0.37) | 0.064 | 23 | −0.12 (1.35) | 17 | 0.63 (1.21) | 0.118 |
| Site #40 | |||||||||||||||
| #44M | 4 | 0.00 (0.29) | 8 | 0.59 (1.81) | 0.495 | 3 | −0.40 (0.80) | 2 | 0.10 (0.28) | 0.564 | 29 | −0.20 (1.10) | 26 | −0.04 (0.57) | 0.800 |
| #44D | 10 | 1.12 (1.93) | 10 | −0.01 (0.55) | 0.041 * | 3 | −1.00 (1.28) | 4 | −0.60 (1.16) | 0.724 | 23 | 0.01 (0.55) | 22 | 0.10 (0.45) | 0.715 |
| #45M | 5 | −0.50 (0.57) | 5 | 0.84 (1.06) | 0.028 * | 2 | 0.75 (1.06) | 3 | −0.03 (1.50) | 0.564 | 28 | 0.23 (0.83) | 29 | −0.04 (0.86) | 0.143 |
| #45D | 9 | −0.03 (0.64) | 10 | 0.02 (0.77) | 0.652 | 3 | −0.17 (1.11) | 6 | 0.88 (2.27) | 0.362 | 23 | 0.00 (0.65) | 21 | 0.18 (0.71) | 0.409 |
| #46M | 7 | −0.03 (0.79) | 5 | −0.24 (2.10) | 0.569 | 1 | N/A | 2 | 0.85 (3.89) | 1.000 | 26 | 0.24 (1.60) | 27 | 0.14 (1.00) | 0.624 |
| #46D | 15 | −0.37 (0.93) | 12 | 0.63 (1.72) | 0.117 | 3 | 0.20 (0.36) | 3 | −0.37 (0.49) | 0.127 | 16 | 0.27 (0.73) | 20 | 0.10 (0.78) | 0.678 |
| #47M | 6 | −0.43 (1.01) | 6 | 0.18 (1.08) | 0.226 | 4 | −0.15 (0.34) | 1 | N/A | 0.480 | 23 | −0.39 (1.45) | 22 | 0.59 (1.72) | 0.058 |
| #47D | 11 | 0.25 (2.75) | 6 | 1.40 (3.26) | 0.392 | 5 | −0.70 (1.98) | 3 | −0.63 (0.60) | 1.000 | 17 | −0.44 (2.13) | 20 | −0.01 (1.72) | 0.234 |
| Variable | Age | ||||||||||||||
|---|---|---|---|---|---|---|---|---|---|---|---|---|---|---|---|
| 29–45 Years Old | 46–53 Years Old | 54–76 Years Old | |||||||||||||
| GTR | FLAP | p | GTR | FLAP | p | GTR | FLAP | p | |||||||
| N | Mean (SD) | N | Mean (SD) | N | Mean (SD) | N | Mean (SD) | N | Mean (SD) | N | Mean (SD) | ||||
| Total | 416 | −0.17 (0.12) | 376 | 0.17 (0.10) | 0.00001 * | 388 | 0.19 (0.13) | 312 | 0.24 (0.11) | 0.040 * | 406 | 0.08 (0.14) | 383 | 0.16 (0.10) | 0.125 |
| Location | |||||||||||||||
| Site #10 | |||||||||||||||
| #14M | 10 | −0.23 (0.55) | 13 | 0.19 (0.39) | 0.087 | 13 | −0.02 (0.46) | 10 | 0.12 (0.78) | 0.618 | 16 | −0.03 (2.11) | 15 | 0.43 (0.78) | 0.352 |
| #14D | 10 | −0.32 (0.66) | 13 | 0.26 (0.41) | 0.016 * | 13 | 0.03 (0.55) | 10 | 0.43 (1.06) | 0.223 | 16 | −0.38 (1.76) | 15 | 0.31 (0.72) | 0.332 |
| #15M | 11 | −0.03 (0.56) | 13 | 0.22 (0.51) | 0.337 | 12 | −0.01 (0.72) | 10 | 0.34 (0.52) | 0.186 | 16 | 0.06 (0.63) | 16 | 0.48 (0.80) | 0.162 |
| #15D | 11 | 0.66 (1.71) | 13 | 0.19 (0.67) | 0.642 | 12 | 0.18 (0.56) | 10 | 0.34 (0.62) | 0.427 | 16 | 0.30 (0.67) | 16 | 0.36 (0.88) | 0.777 |
| #16M | 9 | −0.71 (1.10) | 13 | 0.14 (0.67) | 0.076 | 12 | 0.48 (0.77) | 9 | 0.30 (1.03) | 0.943 | 15 | 0.09 (1.33) | 16 | 0.21 (0.73) | 0.905 |
| #16D | 9 | −0.32 (1.24) | 13 | 0.20 (0.92) | 0.192 | 12 | 0.06 (0.76) | 9 | 0.78 (1.53) | 0.251 | 15 | 0.35 (1.82) | 16 | 0.17 (1.13) | 0.782 |
| #17M | 8 | −0.58 (1.30) | 13 | 0.39 (1.37) | 0.180 | 12 | 0.1 (0.63) | 7 | 0.63 (0.51) | 0.074 | 15 | 0.32 (0.92) | 16 | 0.30 (0.94) | 0.766 |
| #17D | 8 | −0.43 (1.02) | 13 | 0.35 (1.83) | 0.514 | 12 | 0.67 (2.44) | 7 | 0.06 (0.57) | 1.000 | 15 | −0.01 (1.10) | 16 | 0.56 (1.14) | 0.038 |
| Site #20 | |||||||||||||||
| #24M | 16 | 0.03 (1.04) | 14 | −0.05 (0.76) | 0.532 | 17 | 0.03 (0.76) | 11 | 0.02 (1.08) | 0.981 | 15 | 0.03 (1.19) | 11 | −0.13 (0.57) | 0.549 |
| #24D | 16 | 0.13 (0.53) | 14 | −0.11 (0.67) | 0.631 | 17 | 0.08 (0.73) | 11 | 0.36 (0.87) | 0.239 | 15 | −0.52 (1.05) | 11 | −0.64 (0.87) | 0.585 |
| #25M | 15 | −0.29 (1.76) | 14 | 0.07 (0.6) | 0.930 | 17 | −0.08 (0.55) | 10 | 0.40 (0.98) | 0.174 | 15 | −0.3 (1.08) | 10 | −0.01 (0.81) | 0.469 |
| #25D | 15 | −0.39 (1.47) | 14 | −0.08 (0.93) | 0.457 | 17 | −0.13 (0.73) | 10 | −0.11 (2.23) | 0.050 * | 15 | −0.39 (0.85) | 10 | −0.04 (0.56) | 0.502 |
| #26M | 16 | −0.21 (0.94) | 10 | 0.08 (0.58) | 0.544 | 17 | 0.17 (0.74) | 9 | 0.39 (1.02) | 0.808 | 15 | 0.67 (1.67) | 12 | 0.56 (1.19) | 0.825 |
| #26D | 16 | −0.35 (1.14) | 10 | 0.11 (0.81) | 0.398 | 17 | 0.29 (0.79) | 9 | 0.34 (0.83) | 0.646 | 15 | 1.02 (2.39) | 12 | −0.01 (1.01) | 0.170 |
| #27M | 11 | −0.57 (1.39) | 12 | 0.03 (1.08) | 0.281 | 14 | 1.84 (3.48) | 9 | 0.61 (1.34) | 0.614 | 13 | 1.20 (2.89) | 10 | −0.43 (2.18) | 0.238 |
| #27D | 11 | −0.32 (1.05) | 12 | −0.11 (1.39) | 0.711 | 14 | 0.06 (1.26) | 9 | 0.60 (0.50) | 0.072 | 13 | 0.60 (1.64) | 10 | 0.05 (0.50) | 0.071 |
| Site #30 | |||||||||||||||
| #34M | 16 | −0.07 (0.67) | 11 | 0.16 (0.49) | 0.308 | 10 | 0.49 (1.17) | 9 | −0.03 (0.77) | 0.436 | 7 | −0.31 (1.19) | 11 | 0.43 (0.65) | 0.220 |
| #34D | 16 | 0.05 (0.66) | 11 | 0.06 (0.52) | 0.921 | 10 | 0.09 (0.53) | 9 | 0.43 (0.55) | 0.175 | 7 | −0.04 (1.05) | 11 | −0.03 (0.67) | 0.555 |
| #35M | 17 | −0.29 (0.68) | 11 | 0.36 (0.78) | 0.036 * | 11 | −0.20 (0.53) | 9 | −0.04 (0.65) | 0.760 | 7 | −0.09 (1.80) | 11 | 0.16 (0.6) | 0.496 |
| #35D | 17 | −0.03 (0.71) | 11 | 0.36 (0.58) | 0.229 | 11 | 0.15 (0.6) | 9 | −0.27 (0.82) | 0.237 | 7 | −0.16 (1.38) | 11 | 0.04 (0.91) | 0.964 |
| #36M | 17 | −0.26 (0.62) | 9 | −0.4 (1.36) | 0.552 | 11 | 0.00 (0.67) | 8 | 0.19 (0.68) | 0.455 | 7 | −0.21 (1.46) | 10 | 0.18 (0.70) | 0.961 |
| #36D | 17 | −0.08 (0.83) | 9 | 0.36 (0.58) | 0.124 | 11 | −0.04 (1.02) | 8 | 0.29 (1.11) | 0.508 | 7 | 0.30 (1.08) | 10 | 0.28 (1.17) | 0.660 |
| #37M | 18 | 0.02 (1.58) | 9 | −0.07 (1.25) | 0.837 | 9 | 0.50 (1.14) | 7 | −0.37 (0.83) | 0.090 | 7 | 0.40 (1.32) | 11 | 1.04 (1.34) | 0.585 |
| #37D | 18 | −0.24 (2.14) | 9 | 0.36 (1.21) | 0.381 | 9 | 0.2 (1.55) | 7 | −0.63 (0.57) | 0.080 | 7 | −0.49 (1.22) | 11 | 0.76 (1.31) | 0.146 |
| Site #40 | |||||||||||||||
| #44M | 12 | −0.14 (1.19) | 12 | 0.25 (0.55) | 0.469 | 10 | 0.01 (1.03) | 13 | 0.32 (1.47) | 0.755 | 14 | −0.38 (0.85) | 11 | −0.31 (0.39) | 0.600 |
| #44D | 12 | 0.37 (2.06) | 12 | 0.23 (0.47) | 0.469 | 10 | 0.10 (0.35) | 13 | 0.06 (0.72) | 0.619 | 14 | 0.22 (0.83) | 11 | −0.35 (0.45) | 0.061 |
| #45M | 11 | 0.33 (0.75) | 12 | 0.24 (0.83) | 0.643 | 10 | 0.25 (0.74) | 13 | 0.22 (0.96) | 0.828 | 14 | −0.04 (0.99) | 12 | −0.23 (1.07) | 0.680 |
| #45D | 11 | 0.12 (0.57) | 12 | 0.38 (0.36) | 0.153 | 10 | −0.18 (0.74) | 13 | 0.58 (1.71) | 0.144 | 14 | −0.01 (0.70) | 12 | −0.23 (0.56) | 0.353 |
| #46M | 11 | 0.24 (0.72) | 12 | −0.02 (1.13) | 0.478 | 10 | 0.36 (2.17) | 13 | 0.37 (1.75) | 0.153 | 13 | 0.06 (1.33) | 9 | −0.03 (1.03) | 0.947 |
| #46D | 11 | 0.19 (0.96) | 12 | 0.13 (1.39) | 0.579 | 10 | 0.15 (0.60) | 13 | 0.39 (1.34) | 0.733 | 13 | −0.32 (0.87) | 10 | 0.19 (0.71) | 0.250 |
| #47M | 10 | −1.05 (1.64) | 10 | 0.69 (2.12) | 0.010 * | 9 | −0.10 (1.15) | 9 | −0.09 (1.16) | 0.965 | 14 | −0.05 (0.89) | 10 | 0.76 (1.25) | 0.150 |
| #47D | 10 | −1.64 (2.05) | 10 | 0.77 (2.64) | 0.011 * | 9 | 0.88 (3.29) | 9 | 0.28 (1.61) | 0.626 | 14 | 0.02 (0.95) | 10 | −0.39 (1.86) | 0.953 |
| Variable | CBCT Interval | ||||||||||||||
|---|---|---|---|---|---|---|---|---|---|---|---|---|---|---|---|
| 87–490 Days | 491–859 Days | 860–1543 Days | |||||||||||||
| GTR | Flap | p | GTR | Flap | p | GTR | Flap | p | |||||||
| N | Mean (SD) | N | Mean (SD) | N | Mean (SD) | N | Mean (SD) | N | Mean (SD) | N | Mean (SD) | ||||
| Total | 404 | −0.06 (0.12) | 332 | 0.17 (0.08) | 0.00001 * | 362 | 0.02 (0.12) | 419 | 0.20 (0.12) | 0.018 * | 444 | 0.11 (0.14) | 320 | 0.20 (0.10) | 0.092 |
| Location | |||||||||||||||
| Site #10 | |||||||||||||||
| #14M | 11 | −0.30 (0.91) | 14 | 0.20 (0.51) | 0.084 | 12 | 0.10 (0.56) | 18 | 0.33 (0.85) | 0.308 | 16 | −0.06 (2.00) | 6 | 0.20 (0.34) | 0.529 |
| #14D | 11 | −0.06 (0.70) | 14 | 0.54 (0.85) | 0.094 | 12 | −0.73 (1.94) | 18 | 0.26 (0.67) | 0.048 * | 16 | 0.04 (0.56) | 6 | 0.02 (0.52) | 0.912 |
| #15M | 11 | −0.14 (0.62) | 14 | 0.26 (0.63) | 0.146 | 12 | −0.05 (0.71) | 19 | 0.46 (0.71) | 0.084 | 16 | 0.16 (0.58) | 6 | 0.23 (0.45) | 0.767 |
| #15D | 11 | −0.06 (0.63) | 14 | 0.33 (0.76) | 0.138 | 12 | 0.54 (0.78) | 19 | 0.31 (0.82) | 0.502 | 16 | 0.53 (1.35) | 6 | 0.20 (0.46) | 0.795 |
| #16M | 11 | −0.11 (1.29) | 14 | 0.38 (0.74) | 0.285 | 11 | 0.23 (1.32) | 17 | 0.23 (0.77) | 0.869 | 14 | −0.04 (1.02) | 7 | −0.19 (0.79) | 0.525 |
| #16D | 11 | −0.44 (1.23) | 14 | 0.14 (0.74) | 0.188 | 11 | 0.50 (2.05) | 17 | 0.64 (1.54) | 0.247 | 14 | 0.16 (0.65) | 7 | −0.07 (0.63) | 0.501 |
| #17M | 9 | −0.26 (1.12) | 12 | 0.57 (0.71) | 0.039 * | 11 | 0.23 (0.81) | 18 | 0.42 (1.17) | 0.770 | 15 | 0.08 (1.02) | 6 | 0.00 (1.24) | 0.969 |
| #17D | 9 | −0.01 (0.98) | 12 | 0.38 (1.02) | 0.545 | 11 | 0.50 (2.18) | 18 | 0.32 (1.73) | 0.787 | 15 | −0.06 (1.65) | 6 | 0.60 (0.36) | 0.017 * |
| Site #20 | |||||||||||||||
| #24M | 18 | −0.19 (0.50) | 13 | 0.10 (0.69) | 0.074 | 12 | 0.13 (0.93) | 11 | 0.14 (0.95) | 0.734 | 18 | 0.18 (1.33) | 12 | −0.39 (0.71) | 0.122 |
| #24D | 18 | −0.04 (0.66) | 13 | −0.36 (0.92) | 0.470 | 12 | 0.19 (0.61) | 11 | −0.03 (1.15) | 0.926 | 18 | −0.33 (1.04) | 12 | 0.03 (0.39) | 0.339 |
| #25M | 17 | −0.42 (1.55) | 13 | 0.08 (0.86) | 0.502 | 11 | −0.04 (0.71) | 10 | 0.20 (0.96) | 0.502 | 19 | −0.14 (1.07) | 11 | 0.17 (0.54) | 0.289 |
| #25D | 17 | −0.40 (1.33) | 13 | 0.07 (0.71) | 0.130 | 11 | −0.28 (0.68) | 10 | −0.47 (2.24) | 0.306 | 19 | −0.21 (0.95) | 11 | 0.11 (0.73) | 0.342 |
| #26M | 18 | 0.39 (1.69) | 10 | 0.10 (0.65) | 0.386 | 12 | −0.21 (0.74) | 10 | 0.72 (0.96) | 0.032 * | 18 | 0.27 (0.75) | 11 | 0.26 (1.18) | 0.557 |
| #26D | 18 | 0.53 (1.86) | 10 | 0.25 (0.56) | 0.665 | 12 | 0.26 (1.94) | 10 | 0.11 (1.33) | 0.575 | 18 | 0.11 (1.14) | 11 | 0.05 (0.65) | 0.840 |
| #27M | 12 | 0.93 (1.85) | 10 | −0.18 (0.99) | 0.261 | 10 | 1.14 (3.03) | 10 | −0.27 (2.42) | 0.384 | 16 | 0.79 (3.59) | 11 | 0.56 (0.98) | 0.236 |
| #27D | 12 | 0.09 (1.73) | 10 | −0.11 (0.80) | 0.766 | 10 | −0.04 (1.00) | 10 | 0.12 (0.76) | 0.705 | 16 | 0.28 (1.33) | 11 | 0.41 (1.26) | 0.225 |
| Site #30 | |||||||||||||||
| #34M | 10 | −0.43 (0.72) | 7 | 0.16 (0.49) | 0.095 | 13 | 0.16 (0.50) | 12 | 0.13 (0.79) | 0.445 | 10 | 0.38 (1.47) | 12 | 0.30 (0.59) | 0.947 |
| #34D | 10 | −0.11 (0.40) | 7 | 0.26 (0.32) | 0.077 | 13 | 0.15 (0.64) | 12 | 0.08 (0.50) | 0.784 | 10 | 0.06 (1.00) | 12 | 0.13 (0.81) | 0.869 |
| #35M | 10 | 0.05 (0.22) | 8 | −0.05 (0.78) | 0.591 | 15 | −0.28 (0.71) | 12 | 0.33 (0.65) | 0.042 * | 10 | −0.41 (1.53) | 11 | 0.16 (0.66) | 0.191 |
| #35D | 10 | −0.13 (0.63) | 8 | 0.29 (0.49) | 0.180 | 15 | 0.31 (0.56) | 12 | −0.01 (0.91) | 0.261 | 10 | −0.33 (1.20) | 11 | −0.03 (0.86) | 0.572 |
| #36M | 11 | −0.18 (0.81) | 6 | −0.10 (1.11) | 0.480 | 14 | −0.10 (0.49) | 11 | −0.47 (0.92) | 0.364 | 10 | −0.25 (1.25) | 10 | 0.55 (0.70) | 0.049 * |
| #36D | 11 | 0.13 (0.78) | 6 | 0.22 (0.59) | 0.920 | 14 | −0.21 (0.82) | 11 | 0.42 (1.23) | 0.198 | 10 | 0.20 (1.20) | 10 | 0.24 (0.85) | 0.677 |
| #37M | 9 | 0.63 (1.62) | 5 | −0.30 (0.96) | 0.255 | 15 | 0.01 (1.35) | 11 | −0.02 (0.82) | 0.856 | 10 | 0.18 (1.36) | 11 | 0.90 (1.66) | 0.307 |
| #37D | 9 | −0.74 (2.63) | 5 | 0.14 (0.77) | 0.503 | 15 | 0.41 (1.11) | 11 | 0.38 (1.54) | 0.795 | 10 | −0.53 (1.71) | 11 | 0.21 (1.14) | 0.230 |
| Site #40 | |||||||||||||||
| #44M | 14 | 0.01 (0.55) | 11 | −0.04 (0.30) | 0.659 | 9 | −0.64 (1.41) | 13 | 0.58 (1.42) | 0.116 | 13 | −0.10 (1.05) | 12 | −0.28 (0.58) | 0.785 |
| #44D | 14 | 0.06 (0.53) | 11 | −0.02 (0.53) | 0.783 | 9 | −0.44 (0.92) | 13 | −0.06 (0.76) | 0.547 | 13 | 0.90 (1.74) | 12 | 0.07 (0.51) | 0.091 |
| #45M | 14 | 0.14 (0.95) | 10 | 0.03 (0.70) | 0.837 | 9 | −0.24 (0.81) | 14 | −0.06 (0.84) | 0.924 | 12 | 0.48 (0.63) | 13 | 0.28 (1.25) | 0.978 |
| #45D | 14 | −0.11 (0.86) | 10 | 0.61 (1.74) | 0.394 | 9 | −0.08 (0.48) | 14 | 0.03 (0.61) | 0.567 | 12 | 0.13 (0.53) | 13 | 0.21 (0.93) | 0.585 |
| #46M | 14 | −0.34 (1.01) | 11 | 0.42 (1.39) | 0.227 | 8 | 0.33 (1.29) | 11 | 0.15 (1.07) | 1.000 | 12 | 0.77 (1.81) | 12 | −0.16 (1.59) | 0.339 |
| #46D | 14 | −0.06 (1.00) | 11 | 0.27 (1.50) | 0.913 | 8 | −0.01 (0.92) | 12 | 0.17 (1.32) | 0.817 | 12 | 0.03 (0.65) | 12 | 0.29 (0.76) | 0.418 |
| #47M | 13 | −0.25 (0.95) | 8 | 0.21 (0.49) | 0.076 | 7 | −1.14 (2.01) | 12 | 0.36 (2.11) | 0.117 | 13 | −0.07 (0.97) | 9 | 0.86 (1.44) | 0.150 |
| #47D | 13 | −0.34 (2.48) | 8 | 0.06 (0.61) | 0.514 | 7 | −0.87 (1.42) | 12 | −0.01 (2.93) | 0.525 | 13 | 0.18 (2.53) | 9 | 0.66 (1.66) | 0.332 |
| Alveolar Bone Loss | |||
|---|---|---|---|
| OR | 95% CI | p | |
| Type of surgery (GTR/Flap) | 0.731 | 0.619–0.862 | 0.001 * |
| Sex | 1.025 | 0.849–1.237 | 0.798 |
| Age | 0.998 | 0.988–1.009 | 0.753 |
| Smoking | 0.979 | 0.790–1.214 | 0.847 |
| Systemic diseases | 1.275 | 0.794–2.049 | 0.354 |
| Medicine | 1.295 | 0.804–2.085 | 0.514 |
| Upper/Lower jaw | 1.255 | 1.063–1.481 | 0.007 * |
| Sites | 1.055 | 0.832–1.336 | 0.528 |
Publisher’s Note: MDPI stays neutral with regard to jurisdictional claims in published maps and institutional affiliations. |
© 2021 by the authors. Licensee MDPI, Basel, Switzerland. This article is an open access article distributed under the terms and conditions of the Creative Commons Attribution (CC BY) license (https://creativecommons.org/licenses/by/4.0/).
Share and Cite
Lee, I.-K.; Choi, H.-S.; Jeong, S.-H.; Lee, J.-T. Evaluating Change of Marginal Bone Height with Cone-Beam Computed Tomography Following Surgical Treatment with Guided Tissue Regeneration (Bone Grafting) or Access Flap Alone: A Retrospective Study. Medicina 2021, 57, 869. https://doi.org/10.3390/medicina57090869
Lee I-K, Choi H-S, Jeong S-H, Lee J-T. Evaluating Change of Marginal Bone Height with Cone-Beam Computed Tomography Following Surgical Treatment with Guided Tissue Regeneration (Bone Grafting) or Access Flap Alone: A Retrospective Study. Medicina. 2021; 57(9):869. https://doi.org/10.3390/medicina57090869
Chicago/Turabian StyleLee, In-Kyung, Hyun-Seok Choi, Sang-Heon Jeong, and Jung-Tae Lee. 2021. "Evaluating Change of Marginal Bone Height with Cone-Beam Computed Tomography Following Surgical Treatment with Guided Tissue Regeneration (Bone Grafting) or Access Flap Alone: A Retrospective Study" Medicina 57, no. 9: 869. https://doi.org/10.3390/medicina57090869