Differences in Risk Factors for Diabetic Retinopathy in Type 1 and Type 2 Diabetes Mellitus Patients in North-East Poland

Abstract
:1. Introduction
2. Materials and Methods
2.1. Study Population
2.2. Methods of Assessing Risk Factors for Diabetic Retinopathy
2.3. Statistical Analysis
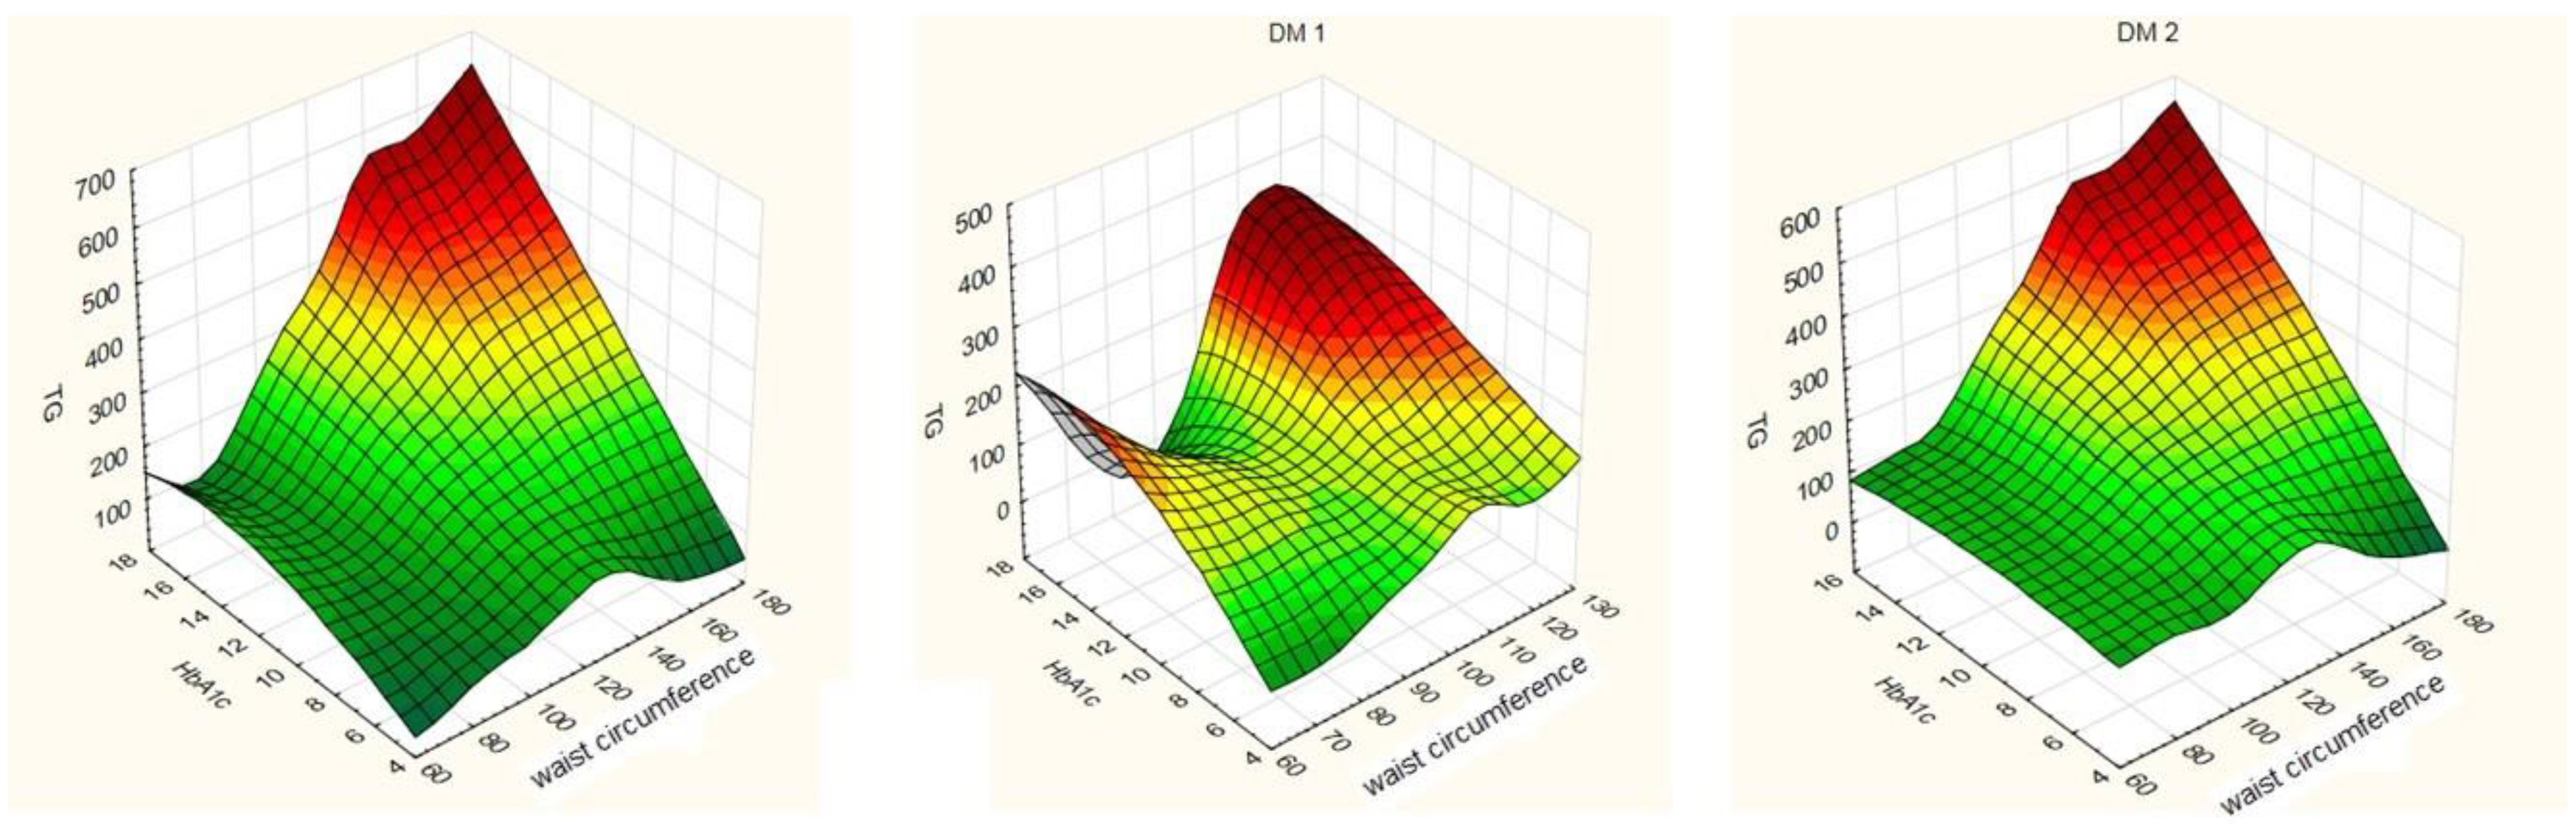
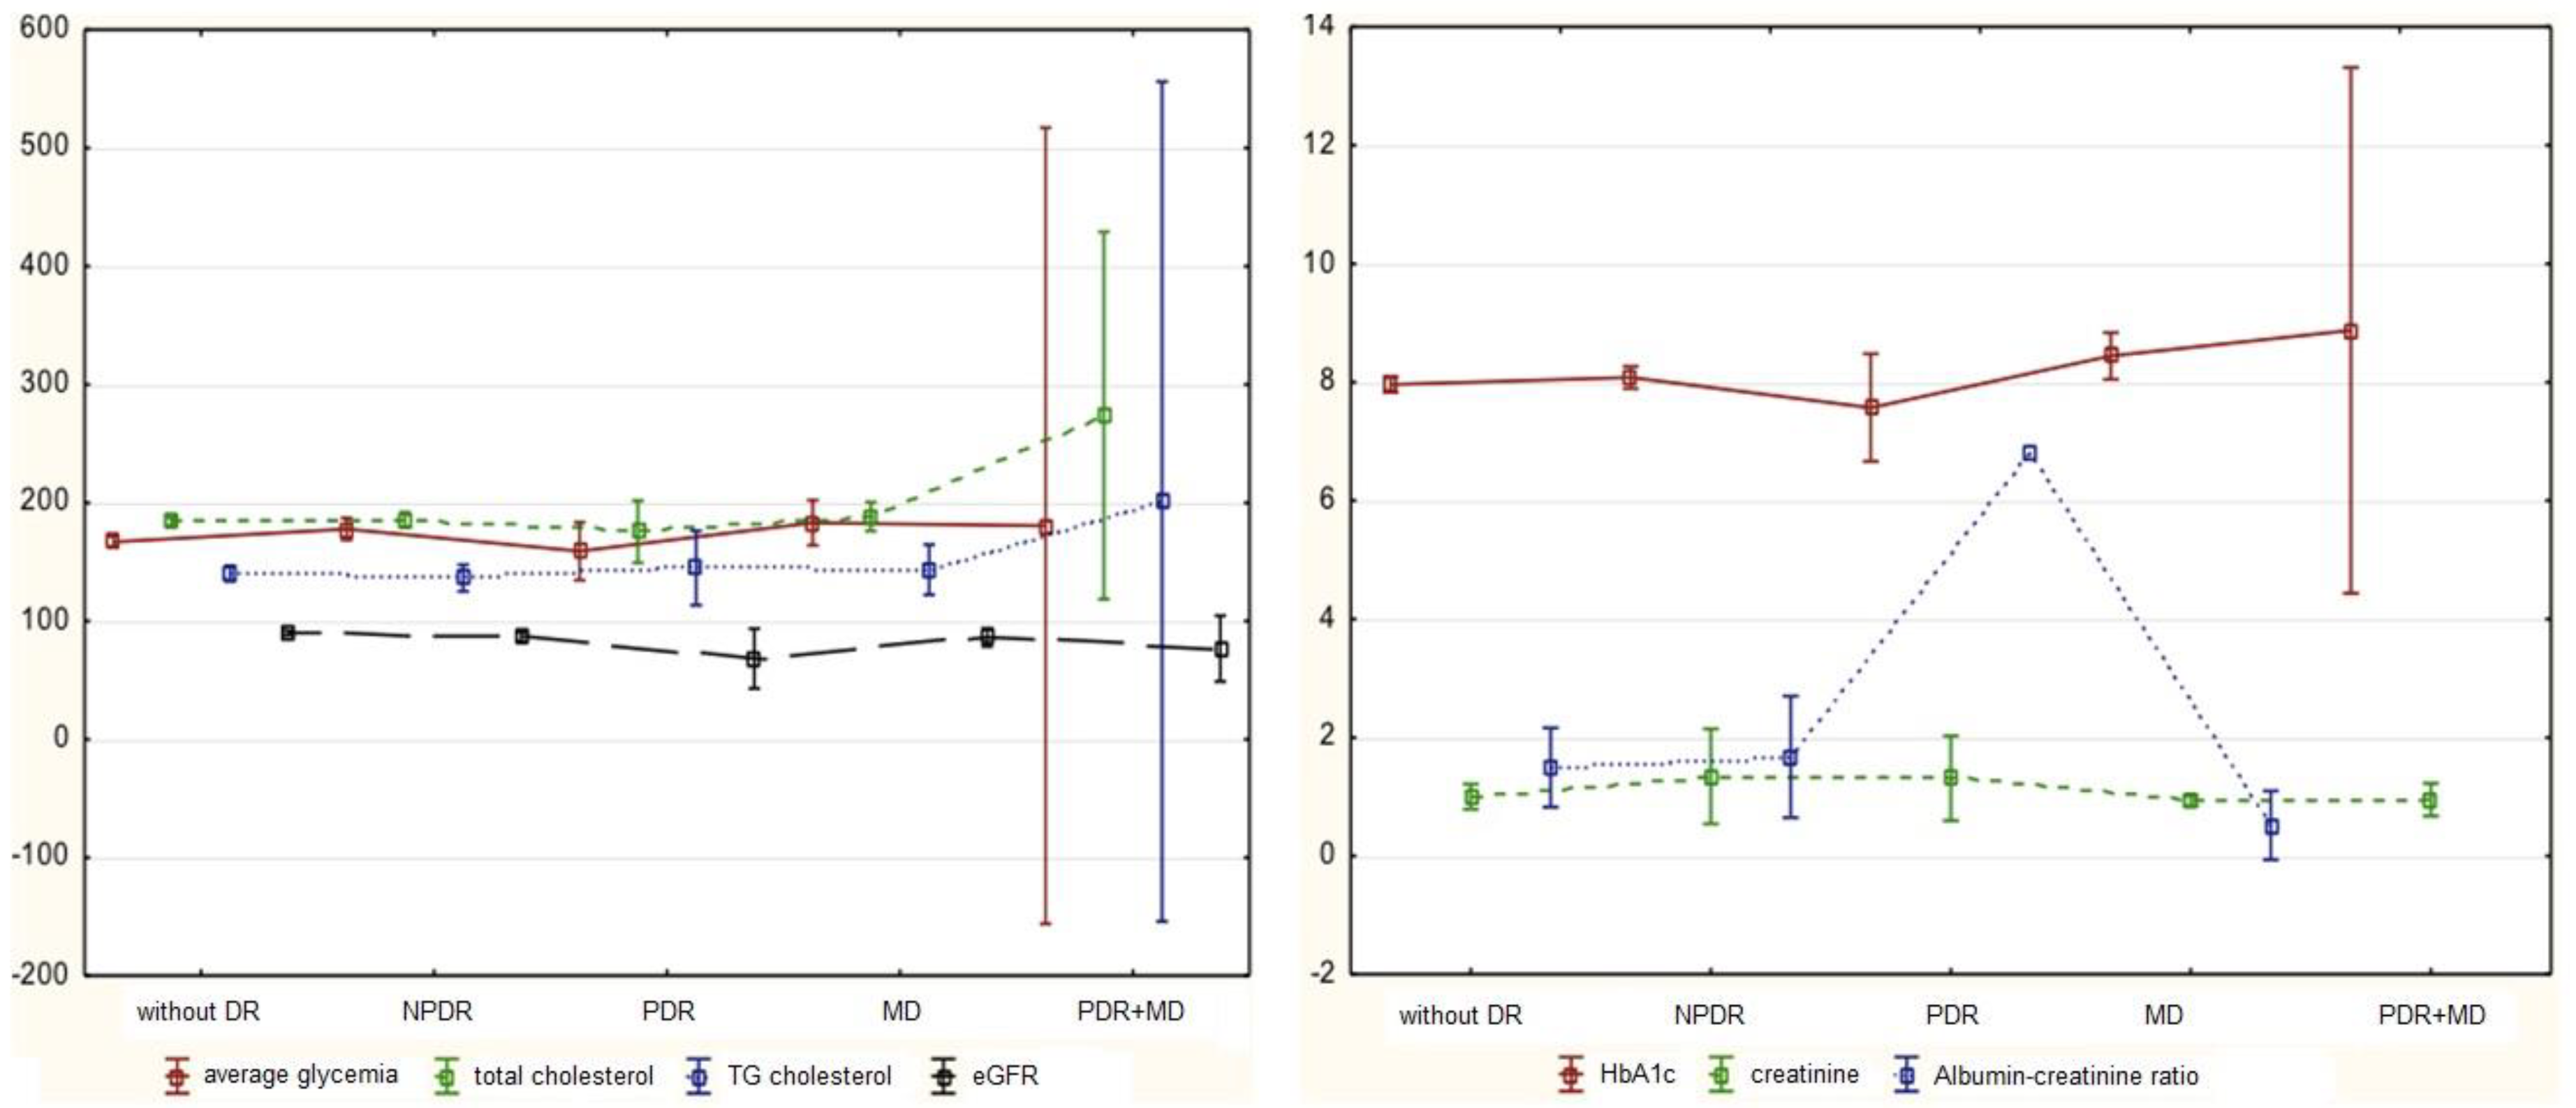
3. Results
4. Discussion
5. Conclusions
Author Contributions
Funding
Conflicts of Interest
References
- Wolfensberger, T.J.; Hamilton, A.M. Diabetic retinopathy-an historical review. Semin. Ophthalmol. 2001, 16, 2–7. [Google Scholar] [CrossRef] [PubMed]
- Matuszewski, W.; Bandurska-Stankiewicz, E.; Modzelewski, R.; Kamińska, U.; Stefanowicz-Rutkowska, M. Diagnosis and treatment of diabetic retinopathy – historical overview. Clin. Diabetol. 2017, 6, 182–188. [Google Scholar] [CrossRef] [Green Version]
- Bliss, M. Chwały Wystarczy Dla Wszystkich; Historia odkrycia insulin; Wyd. PTBPC: Łódź, Poland, 2003. [Google Scholar]
- Banting, F.G.; Best, C.H.; Collip, J.B.; Campbell, W.R.; Fletcher, A.A. Pancreatic extracts in the treatment of diabetes mellitus: Preliminary report. Can. Med. Assoc. J. 1922, 12, 141–146. [Google Scholar] [PubMed]
- Deshpande, A.D.; Harris-Hayes, M.; Schootman, M. Epidemiology of diabetes and diabetes-related complications. Phys. Ther. 2008, 88, 1254–1264. [Google Scholar] [CrossRef] [PubMed] [Green Version]
- Scanlon, P.H.; Aldington, S.J.; Stratton, I.M. Epidemiological issues in diabetic retinopathy. Middle East Afr. J. Ophthalmol. 2013, 20, 293–300. [Google Scholar] [CrossRef] [PubMed]
- Klein, R.; Klein, B.E.; Moss, S.E. The Wisconsin Epidemiologic Study of Diabetic Retinopathy. II. Prevalence and risk of diabetic retinopathy when age at diagnosis is less than 30 years. Arch. Ophthalmol. 1984, 102, 520–526. [Google Scholar] [CrossRef]
- Magliah, S.F.; Bardisi, W.; Al Attah, M.; Khorsheed, M.M. The prevalence and risk factors of diabetic retinopathy in selected primary care centers during the 3-year screening intervals. J. Fam. Med. Prim. Care 2018, 7, 975–981. [Google Scholar]
- Gupta, N.; Mansoor, S.; Sharma, A.; Sapkal, A.; Sheth, J.; Falatoonzadeh, P.; Kuppermann, B.; Kenney, M. Diabetic retinopathy and VEGF. Open Ophthalmol. J. 2013, 7, 4–10. [Google Scholar] [CrossRef] [Green Version]
- Frank, R.N. Diabetic Retinopathy. N. Eng. J. Med. 2004, 350, 48–58. [Google Scholar] [CrossRef]
- Polskie Towarzystwo Diabetologiczne. Zalecenia kliniczne dotyczące postępowania u chorych na cukrzycę 2018. Stanowisko Polskiego Towarzystwa Diabetologicznego. Diabetol. Prakt. 2018, 4, 1. [Google Scholar]
- American Diabetes Association. Standards of Medical Care in Diabetes—2016. Diabetes Care 2018, 34 (Suppl. S1), S109–S111. [Google Scholar]
- Schreur, V.; van Asten, F.; Ng, H.; Weeda, J.; Groenewoud, J.M.M.; Tack, C.J.; Hoyng, C.B.; de Jong, E.K.; Klaver, C.C.W.; Jeroen Klevering, B. Risk factors for development and progression of diabetic retinopathy in Dutch patients with type 1 diabetes mellitus. Acta Ophthalmol. 2018, 96, 459–464. [Google Scholar] [CrossRef] [PubMed] [Green Version]
- Walicka, M.; Chlebus, M.; Brzozowska, M.; Śliwczyński, A.; Jędrzejczyk, T.; Kania, L.; Puzianowska-Kuźnicka, M.; Franek, E. Chorobowość z powodu cukrzycy w Polsce w latach 2010–2014. Clin. Diabet. 2015, 4, 13–18. [Google Scholar]
- WHO. Definition. Diagnosis and Classification of Diabetes Mellitus and Its Complications; Report of a WHO consultation. Part 1. Diagnosis and classification of diabetes mellitus; WHO: Geneva, Switzerland, 1999. [Google Scholar]
- Mancia, K.; Fagard, R.; Narkiewicz, K.; Redon, J.; Zanchetti, A.; Böhm, M.; Christiaens, T.; Cifkova, R.; De Backer, G.; Dominiczak, A.; et al. 2013 ESH/ESC Guidelines for the management of arterial hypertension. Eur. Heart J. 2013, 34, 2159–2219. [Google Scholar]
- Clinical Guidelines on the Identification, Evaluation, and Treatment of Overweight and Obesity in Adults. Available online: http://www.nhlbi.nih.gov/files/docs/guidelines/ob_gdlns.pdf (accessed on 10 February 2014).
- The IDF Consensus Worldwide Definition of the Metabolic Syndrome. Available online: https://www.idf.org/component/attachments/attachments.html?id=705&task=download (accessed on 8 April 2020).
- Kilpatrick, E.S.; Rigby, A.S.; Atkin, S.L. A1C variability and the risk of microvascular complications in type 1 diabetes: Data from the Diabetes Control and Complications Trial. Diabetes Care 2008, 31, 2198–2202. [Google Scholar] [CrossRef] [PubMed] [Green Version]
- Kilpatrick, E.S.; Rigby, A.S.; Atkin, S.L. The effect of glucose variability on the risk of microvascular complications in type 1 diabetes. Diabetes Care 2006, 29, 1486–1490. [Google Scholar] [CrossRef] [PubMed] [Green Version]
- Hietala, K.; Wade´n, J.; Forsblom, C.; Harjutsalo, V.; Kytö, J.; Summanen, P.; Groop, P.H. HbA1c variability is associated with an increased risk of retinopathy requiring laser treatment in type 1 diabetes. Diabetologia 2013, 56, 737–745. [Google Scholar] [CrossRef] [Green Version]
- Sartore, G.; Chilelli, N.C.; Burlina, S.; Lapolla, A. Association between glucose variability as assessed by continuous glucose monitoring (CGM) and diabetic retinopathy in type 1 and type 2 diabetes. Acta Diabetol. 2013, 50, 437–442. [Google Scholar] [CrossRef]
- Penno, G.; Solini, A.; Bonora, E.; Fondelli, C.; Orsi, E.; Zerbini, G.; Morano, S.; Cavalot, F.; Lamacchia, O.; Laviola, L.; et al. HbA1c variability as an independent correlate of nephropathy, but not retinopathy, in patients with type 2 diabetes: The Renal Insufficiency and Cardiovascular Events (RIACE) Italian Multicenter Study. Diabetes Care 2013, 36, 2301–2310. [Google Scholar] [CrossRef] [Green Version]
- Savage, S.; Estacio, R.O.; Jeffers, B.; Schrier, R.W. Urinary albumin excretion as a predictor of diabetic retinopathy, neuropathy, and cardiovascular disease in NIDDM. Diabetes Care 1996, 19, 1243–1248. [Google Scholar] [CrossRef]
- Kodali, V.R. Atherogenic lipids and vascular complications in a selected diabetic population with normal urinary albumin/creatinine ratios. Diabetes Metab. Syndr. 2014, 8, 124–127. [Google Scholar] [CrossRef]
- Wu, J.; Geng, J.; Liu, L.; Weiping, T.; Liu, L.; Chen, L. The Relationship between Estimated Glomerular Filtration Rate and Diabetic Retinopathy. Hindawi Publishing Corporation. J. Ophthalmol. 2015, 326209. [Google Scholar] [CrossRef] [Green Version]
- Chen, Y.H.; Chen, H.S.; Tarng, D.C. More impact of microalbuminuria on retinopathy than moderately reduced GFR among type 2 diabetic patients. Diabetes Care 2012, 35, 803–808. [Google Scholar] [CrossRef] [PubMed] [Green Version]
- Klein, R.; Moss, S.E.; Klein, B.E. Is gross proteinuria a risk factor for the incidence of proliferative diabetic retinopathy? Ophthalmology 1993, 100, 1140–1146. [Google Scholar] [CrossRef]
- Sobczak, A.I.S.; Stewart, A.J. Coagulatory Defects in Type-1 and Type-2 Diabetes. Int. J. Mol. Sci. 2019, 20, 6345. [Google Scholar] [CrossRef] [PubMed] [Green Version]
- Klein, R.; Zinman, B.; Gardiner, R.; Suissa, S.; Donnelly, S.M.; Sinaiko, A.R.; Kramer, M.S.; Goodyer, P.; Moss, S.E.; Strand, T.; et al. Renin-Angiotensin-System Study. The relationship of diabetic retinopathy to preclinical diabetic glomerulopathy lesions in type 1diabetic patients: The Renin-Angiotensin-System Study. Diabetes 2005, 54, 527–533. [Google Scholar] [CrossRef] [PubMed] [Green Version]
- Wirta, O.; Pasternack, A.; Mustonem, J.; Laippala, P.; Lähde, Y. Retinopathy is indenpendently related to microalbuminuria in type 2 diabetes mellitus. Clin. Nephrol. 1999, 51, 329–334. [Google Scholar]
- Leehey, D.J.; Kramer, H.J.; Daoud, T.M.; Chatha, M.P.; Iserb, M.A. Progression of kidney disease in type 2 diabetes—Beyond blood pressure control: An observational study. BMC Nephrol. 2005, 6, 8. [Google Scholar] [CrossRef] [PubMed] [Green Version]
- Kim, H.K.; Kim, C.H.; Kim, S.W.; Park, J.Y.; Hong, S.K.; Yoon, Y.H.; Lee, K.U. Development and progression of diabetic retinopathy in Koreans with NIDDM. Diabetes Care 1998, 21, 134–138. [Google Scholar] [CrossRef]
- Yamamoto, M.; Fujihara, K.; Ishizawa, M.; Osawa, T.; Kaneko, M.; Ishiguro, H.; Matsubayashi, Y.; Seida, H.; Yamanaka, N.; Tanaka, S.; et al. Overt Proteinuria, Moderately Reduced eGFR and Their Combination Are Predictive of Severe Diabetic Retinopathy or Diabetic Macular Edema in Diabetes. Invest. Ophthalmol. Vis. Sci. 2019, 60, 2685–2689. [Google Scholar] [CrossRef] [Green Version]
- Knuiman, M.W.; Welborn, T.A.; McCann, V.J.; Stanton, K.G.; Constable, J. Prevalence of diabetic complications in relation to risk factors. Diabetes 1986, 35, 1332–1339. [Google Scholar] [CrossRef] [PubMed]
- Hamman, R.F.; Mayer, E.J.; Moo-Young, G.A.; Hildebrandt, W.; Marshall, J.A.; Baxter, J. Prevalence and risk factors of diabetic retinopathy in non-Hispanic whites and Hispanics with NIDDM. San Luis Valley Diabetes Study. Diabetes 1989, 38, 1231–1237. [Google Scholar] [CrossRef] [PubMed]
- The Early Treatment Diabetic Retinopathy Study Research Group. Association of abstract serum lipid levels with retinal hard exudate in diabetic retinopathy: ETDRS report no.22. Arch. Ophthalmol. 1987, 94, 1614–1620. [Google Scholar]
- Gordon, B.; Chang, S.; Kavanagh, M.; errocal, M.; Yannuzzi, L.; Robertson, C.; Drexler, A. The effects of lipid lowering on diabetic retinopathy. Am. J. Ophthalmol. 1991, 112, 385–391. [Google Scholar] [CrossRef]
- Cusick, M.; Chew, E.Y.; Chan, C.C.; Kruth, H.S.; Murphy, P.P.; Ferris, F.L. Histopathology and regression of retinal hard exudates in diabetic retinopathy after reduction of elevated serum lipid levels. Ophthalmology 2003, 110, 2126–2133. [Google Scholar] [CrossRef]
- Ulbig, M.R.; Hamilton, A.M. Factors influencing the natural history of diabetic retinopathy. Eye 1993, 7, 242–249. [Google Scholar] [CrossRef]
- The FIELD Study Investigators. Effects of long-term fenofibrate therapy on cardiovascular events in 9795 people with type 2 diabetes mellitus (the FIELD study): Randomised controlled trial. Lancet 2005, 366, 1849–1861. [Google Scholar] [CrossRef]
- The FIELD Study Investigators. Fenofibrate Intervention and Event Lowering in Diabetes (FIELD) study: Baseline characteristics and short-term effects of fenofibrate. Cardiovasc. Diabetol. 2005, 4, 13. [Google Scholar] [CrossRef] [Green Version]
- Miljanovic, B.; Glynn, R.J.; Nathan, D.M. A prospective study of serum lipids and risk of diabetic macular edema in type 1 diabetes. Diabetes 2004, 53, 2883–2892. [Google Scholar] [CrossRef] [Green Version]
- Zhang, H.; Wang, J.; Ying, G. Serum lipids and other risk factors for diabetic retinopathy in Chinese type 2 diabetic patients. J. Zhejiang Univ. 2013, 5, 392–399. [Google Scholar] [CrossRef] [Green Version]
- Chang, Y.C.; Wu, W.C. Dyslipidemia and diabetic retinopathy. Rev. Diabet. Stud. 2013, 10, 121–132. [Google Scholar] [CrossRef] [PubMed]
- Kaštelan, S.; Salopek Rabatić, J.; Tomić, M.; Antunica, A.G.; Ljubić, S.; Kaštelan, H.; Novak, B.; Orešković, D. Body mass index and retinopathy in type 1 diabetic patients. Int. J. Endocrinol. 2014, 2014, 387919. [Google Scholar] [CrossRef] [PubMed]
- Price, S.A.; Gorelik, A.; Fourlanos, S.; Colman, P.G.; Wentworth, J.M. Obesity is associated with retinopathy and macrovascular disease in type 1 diabetes. Obes. Res. Clin. Pract. 2014, 8, 178–182. [Google Scholar] [CrossRef] [PubMed]
- Uruska, A.; Araszkiewicz, A.; Uruski, P.; Zozulinska-Ziolkiewicz, D. Higher risk of microvascular complications in smokers with type 1 diabetes despite intensive insulin therapy. Microvasc. Res. 2014, 92, 79–84. [Google Scholar] [CrossRef] [PubMed]
- Muhlhauser, I.; Bender, R.; Bott, U.; Jörgens, V.; Grüsser, M.; Wagener, W.; Overmann, H.; Berger, M. Cigarette smoking and progression of retinopathy and nephropathy in type 1 diabetes. Diabet. Med. 1996, 13, 536–543. [Google Scholar] [CrossRef]
- Nielsen, M.M.; Hjollund, E. Smoking and diabetic microangiopathy. Lancet 1978, 2, 533–534. [Google Scholar] [CrossRef]
- Klein, R.; Klein, B.E.; Davis, M.D. Is cigarette smoking associated with diabetic retinopathy? Am. J. Epidemiol. 1983, 118, 228–238. [Google Scholar] [CrossRef]
- Campagna, D.; Alamo, A.; Di Pino, A.; Russo, C.; Calogero, A.E.; Purrello, F.; Polosa, R. Smoking and diabetes: Dangerous liaisons and confusing relationships. Diabetol. Metab. Syndr. 2019, 11, 85. [Google Scholar] [CrossRef]
- Stratton, I.M.; Kohner, E.M.; Aldington, S.J.; Turner, R.C.; Holman, R.R.; Manley, S.E.; Matthews, D.R. UKPDS 50: Risk factors for incidence and progression of retinopathy in Type II diabetes over 6 years from diagnosis. Diabetologia 2001, 44, 156–163. [Google Scholar] [CrossRef] [Green Version]
- UKPDS Group. Intensive blood-glucose control with sulphonylureas or insulin compared with conventional treatment and risk of complications in patients with type 2 diabetes (UKPDS 33). UK Prospective Diabetes Study (UKPDS) Group. Lancet 1998, 352, 837–853. [Google Scholar] [CrossRef]
- Al-Adsani, A.M. Risk factors for diabetic retinopathy in Kuwaiti type 2 diabetic patients. Saudi Med. J. 2007, 28, 579–583. [Google Scholar] [PubMed]
- Klein, R.; Klein, B.E.; Moss, S.E. The Wisconsin Epidemiologic Study of Diabetic Retinopathy.III. Prevalence and risk of diabetic retinopathy when age at diagnosis is 30 or more years. Arch. Ophthalmol. 1984, 102, 527–532. [Google Scholar] [CrossRef]
- Diabetes Control and Complications Trial Research Group. The effect of intensive treatment of diabetes on the development and progression of long-term complications in insulin-dependent diabetes mellitus. N. Engl. J. Med. 1993, 329, 977–986. [Google Scholar] [CrossRef] [PubMed]
- Diabetes Control and Complications Trial/Epidemiology of Diabetes Interventions and Complications research Group. Retinopathy and nephropathy in patients with type 1 diabetes four years after a trial of intensive therapy. N. Engl. J. Med. 2000, 342, 381–389. [Google Scholar] [CrossRef] [PubMed] [Green Version]
- Chautervedi, N.; Sjolie, A.K.; Stephenson, J.M.; Abrahamian, H.; Keipes, M.; Castellarin, A.; Rogulja-Pepeonik, Z.; Fuller, J.H. EUCLID Study Group: Effect of lisinopril on progression of retinopathy in normotensive people with type 1 diabetes. EURODIAB Controlled Trial of Lisinopril in Insulin-Dependent Diabetes Mellitus. Lancet 1998, 351, 28–31. [Google Scholar] [CrossRef]
- Ohkubo, Y.; Kishikawa, H.; Araki, E.; Miyata, T.; Isami, S.; Motoyoshi, S.; Kojima, Y.; Furuyoshi, N.; Shichiri, M. Intensive insulin therapy prevents the progression of diabetic microvascular complications in Japanese patients with non–insulin-dependent diabetes mellitus: A randomized prospective 6-year study. Diabetes Res. Clin. Pract. 1995, 28, 103–117. [Google Scholar] [CrossRef]


| Metabolic Balance Indicator | Recommended Range |
|---|---|
| Glycated hemoglobin (HbA1c) | ≤7.0% (≤53 mmol/mol) |
| Concentration of total cholesterol | <175 mg/dL (<4.5 mmol/L) |
| Concentration of triglycerides | <150 mg/dL (<1.7 mmol/L) |
| Concentration of creatinine | 0.5–0.9 mg/dL |
| Glomerular filtration rate (GFR) | >60 mL/min |
| Urine albumin–creatinine ratio | 0.0–2.5 mg/mmol |
| Study Group | |||||||
|---|---|---|---|---|---|---|---|
| Total | DM1 | DM2 | p | With DR | Without DR | p | |
| n (%) | 1209 (100) | 315 (26) | 894 (74) | - | 308 (25.48) | 901 (74.52) | - |
| Age—years (SD) | 54.9 (15.79) | 37.04 (13.55) | 61.2 (11.13) | 0.000 | 56.1 (14.18) | 54.5 (16.30) | 0.451 |
| Diabetes duration—years (SD) | 11.0 (8.60) | 12.3 (9.78) | 10.5 (8.09) | 0.038 | 17.4 (8.72) | 8.8 (7.39) | 0.000 |
| OAD (%) | 351 (29) | 0 (0) | 351 (39) | 1.000 | 39 (13) | 312 (35) | 0.005 |
| IT (%) | 520 (43) | 315 (100) | 205 (23) | 1.000 | 161 (53) | 359 (40) | 0.005 |
| OAD + IT (%) | 338 (28) | 0 (0) | 338 (38) | 1.000 | 108 (34) | 230 (25) | 0.089 |
| HbA1c (%) | 8.00 (1.79) | 8.44 (2.02) | 7.84 (1.67) | 0.000 | 8.1 (1.42) | 8.0 (1.90) | 0.000 |
| Total cholesterol (mg/dL) | 184.64 (44.14) | 182.39 (39.32) | 185.42 (45.70) | 0.683 | 186.6 (45.1) | 183.9 (43.79) | 0.493 |
| TG cholesterol (mg/dL) | 139.84 (83.66) | 106.28 (63.97) | 151.64 (86.56) | 0.000 | 138.8 (75.74) | 140.2 (86.42) | 0.576 |
| Creatinine (mg/dL) | 1.07 (3.51) | 0.85 (0.38) | 1.15 (4.12) | 0.000 | 1.2 (4.84) | 1.0 (2.89) | 0.117 |
| eGFR (mL/min/1.73 m2) | 88.81 (25.81) | 101.10 (25.80) | 84.04 (24.02) | 0.000 | 85.7 (26.39) | 90.0 (25.52) | 0.029 |
| ACR (mg/mmol) | 1.54 (3.09) | 0.53 (0.74) | 2.08 (3.68) | 0.019 | 1.7 (2.78) | 1.5 (3.22) | 0.353 |
| Systolic BP (mmHg) | 133.38(17.12) | 127.70 (15.15) | 135.39 (17.33) | 0.000 | 135.6 (19.51) | 132.6 (16.17) | 0.040 |
| Diastolic BP (mmHg) | 78.90 (9.44) | 77.54 (8.97) | 79.38 (9.56) | 0.015 | 78.3 (9.47) | 79.1 (9.43) | 0.128 |
| BMI (kg/m2) | 28.95 (6.09) | 24.24 (4.00) | 30.61 (5.82) | 0.000 | 28.4 (5.69) | 29.1 (6.21) | 0.113 |
| Waist circumference (cm) | 98.75 (15.37) | 87.06 (10.88) | 102.35 (14.76) | 0.000 | 98.1 (15.47) | 99.0 (15.35) | 0.557 |
| DM1 Patients | |||||||||||
| DM Duration | BMI | Waist | Mean Glycemia | HbA1c | Cholesterol | TG | Creatinine | GFR | Albumin–Creatinine Ratio | Systolic APB | |
| BMI | 0.089 | 1.000 | |||||||||
| Waist | −0.058 | 0.677 * | 1.000 | ||||||||
| Mean glycemia | 0.051 | −0.458 | −0.509 * | 1.000 | |||||||
| HbA1c | −0.164 | −0.475 | −0.360 | 0.772 * | 1.000 | ||||||
| Cholesterol | 0.132 | −0.262 | −0.477 | 0.390 | 0.193 | 1.000 | |||||
| TG | −0.381 | −0.084 | −0.176 | 0.452 | 0.530 * | 0.588 * | 1.000 | ||||
| Creatinine | −0.065 | −0.034 | 0.185 | −0.158 | −0.164 | −0.293 | −0.268 | 1.000 | |||
| eGFR | −0.002 | −0.087 | −0.390 | 0.509 * | 0.231 | 0.468 | 0.489 | −0.625 * | 1.000 | ||
| Albumin−creatinine ratio | 0.145 | −0.075 | −0.270 | −0.228 | −0.159 | 0.120 | −0.179 | 0.045 | −0.149 | 1.000 | |
| Systolic ABP | −0.079 | −0.010 | 0.197 | −0.176 | −0.353 | −0.200 | −0.396 | 0.654 * | −0.171 | 0.136 | 1.000 |
| Diastolic ABP | 0.460 | −0.197 | 0.039 | 0.222 | 0.338 | −0.213 | −0.240 | 0.472 | −0.387 | −0.017 | 0.236 |
| DM2 patients | |||||||||||
| DM Duration | BMI | Waist | Mean Glycemia | HbA1c | Cholesterol | TG | Creatinine | GFR | Albumin–Creatinine Ratio | Systolic ABP | |
| BMI | 0.001 | 1.000 | |||||||||
| Waist | 0.036 | 0.903 * | 1.000 | ||||||||
| Mean glycemia | −0.182 | 0.347 * | 0.417 * | 1.000 | |||||||
| HbA1c | −0.237 | 0.222 | 0.263 | 0.758 * | 1.000 | ||||||
| Cholesterol | −0.154 | −0.196 | −0.204 | −0.068 | 0.025 | 1.000 | |||||
| TG | −0.108 | 0.370 * | 0.398 * | 0.461 * | 0.439 * | 0.340 | 1.000 | ||||
| Creatinine | 0.046 | 0.158 | 0.283 | −0.110 | 0.021 | −0.160 | −0.090 | 1.000 | |||
| eGFR | −0.031 | −0.201 | −0.253 | 0.063 | −0.022 | 0.244 | −0.037 | −0.837 * | 1.000 | ||
| Albumin–creatinine ratio | 0.014 | 0.281 | 0.357 * | 0.362 * | 0.106 | 0.035 | 0.351 * | 0.051 | −0.106 | 1.000 | |
| Systolic ABP | −0.402 * | 0.042 | 0.065 | 0.116 | 0.048 | 0.050 | 0.168 | 0.127 | −0.074 | 0.183 | 1.000 |
| Diastolic ABP | −0.584 * | −0.269 | −0.229 | 0.026 | 0.044 | 0.063 | 0.177 | −0.079 | 0.044 | 0.035 | 0.469 * |
| DM1 patients | ||||||
| Model | DM Duration (SE) | Albumin–Creatinine Ratio (SE) | GFR (SE) | HbA1c (SE) | Cigarette Smoking (SE) | |
| 1 | 0.17 * (0.06) | 1.06 * (0.61) | 0.04 (0.02) | - | - | |
| 2 | 0.25 * (0.09) | 0.82 (0.73) | 0.07 * (0.02) | - | 22.16 * (1.69) | |
| 3 | 0.16 * (0.06) | 1.05 * (0.31) | 0.04 (0.02) | - | - | |
| 4 | 0.09 * (0.02) | - | 0.01 * (0.008) | 0.26 * (0.09) | - | |
| DM2 patients | ||||||
| Model | DM Duration (SE) | Albumin–Creatinine Ratio (SE) | GFR (SE) | HbA1c (SE) | Cigarette Smoking (SE) | Treatment Model (SE) |
| 1 | 0.11 * (0.04) | 0.05 (0.09) | −0.02 (0.02) | - | - | - |
| 2 | 0.10 * (0.04) | 0.04 (0.09) | −0.02 (0.02) | - | 18.55 * (0.55) | - |
| 3 | 0.14 * (0.06) | 0.02 (0.11) | −0.03 (0.02) | - | - | −1.12 * (0.55) |
| 4 | 0.09 * (0.02) | - | −0.02 * (0.01) | 0.26 * (0.09) | - | - |
© 2020 by the authors. Licensee MDPI, Basel, Switzerland. This article is an open access article distributed under the terms and conditions of the Creative Commons Attribution (CC BY) license (http://creativecommons.org/licenses/by/4.0/).
Share and Cite
Matuszewski, W.; Stefanowicz-Rutkowska, M.M.; Szychlińska, M.; Bandurska-Stankiewicz, E. Differences in Risk Factors for Diabetic Retinopathy in Type 1 and Type 2 Diabetes Mellitus Patients in North-East Poland. Medicina 2020, 56, 177. https://doi.org/10.3390/medicina56040177
Matuszewski W, Stefanowicz-Rutkowska MM, Szychlińska M, Bandurska-Stankiewicz E. Differences in Risk Factors for Diabetic Retinopathy in Type 1 and Type 2 Diabetes Mellitus Patients in North-East Poland. Medicina. 2020; 56(4):177. https://doi.org/10.3390/medicina56040177
Chicago/Turabian StyleMatuszewski, Wojciech, Magdalena M. Stefanowicz-Rutkowska, Magdalena Szychlińska, and Elżbieta Bandurska-Stankiewicz. 2020. "Differences in Risk Factors for Diabetic Retinopathy in Type 1 and Type 2 Diabetes Mellitus Patients in North-East Poland" Medicina 56, no. 4: 177. https://doi.org/10.3390/medicina56040177