Energy Expenditure of a Single Sit-to-Stand Movement with Slow Versus Normal Speed Using the Different Frequency Accumulation Method


Abstract
:1. Introduction
2. Materials and Methods
2.1. Participants
2.2. Experimental Design
2.3. Sit-to-Stand Movement
2.4. Indirect Calorimetry Measurement and Energy Expenditure
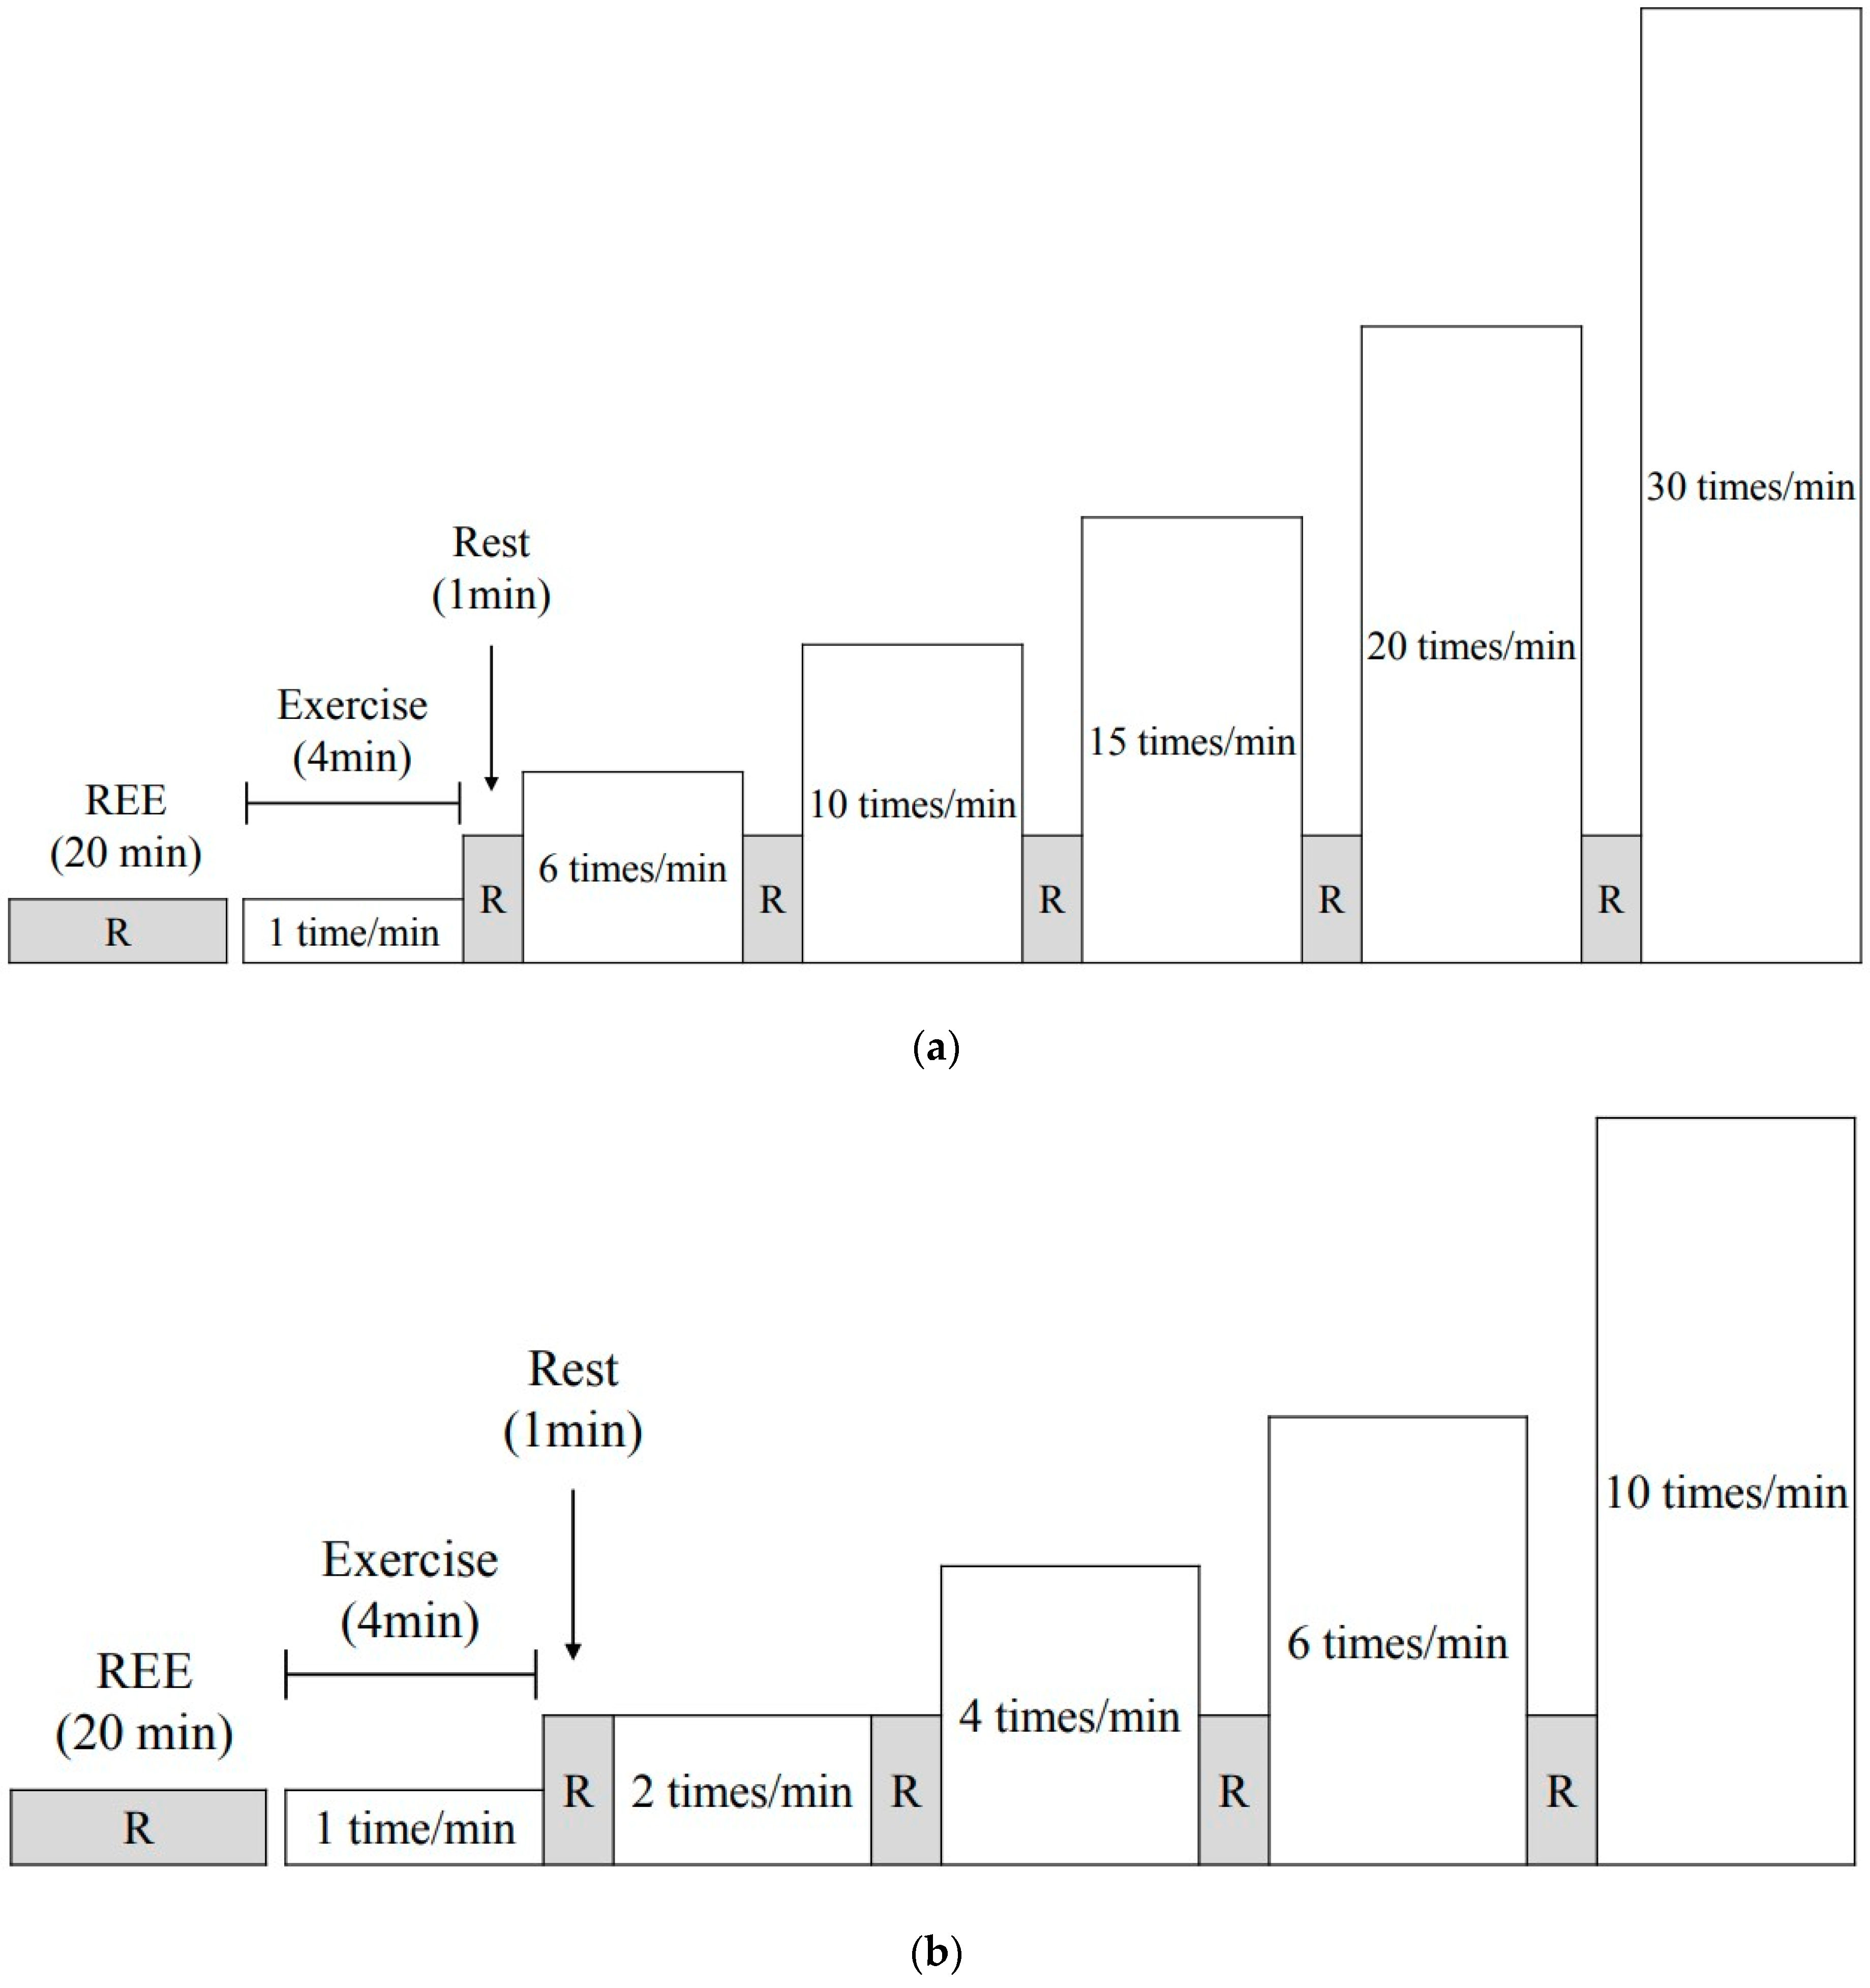
2.5. Different Frequency Accumulation Method (DFAM)
2.6. Heart Rate, Ratings of Perceived Exertion, and Blood Lactate Concentration
2.7. Statistical Analyses
3. Results
4. Discussion
5. Conclusions
Author Contributions
Funding
Acknowledgments
Conflicts of Interest
References
- Bonn, S.E.; Rimm, E.B.; Matthews, C.E.; Troiano, R.P.; Bowles, H.R.; Rood, J.; Barnett, J.B.; Willett, W.C.; Chomistek, A.K. Associations of Sedentary Time with Energy Expenditure and Anthropometric Measures. Med. Sci. Sports Exerc. 2018, 50, 2575–2583. [Google Scholar] [CrossRef]
- Carter, S.; Hartman, Y.; Holder, S.; Thijssen, D.H.; Hopkins, N.D. Sedentary behavior and cardiovascular disease risk: Mediating mechanisms. Exerc. Sport Sci. Rev. 2017, 45, 80–86. [Google Scholar] [CrossRef] [PubMed]
- Diaz, K.M.; Howard, V.J.; Hutto, B.; Colabianchi, N.; Vena, J.E.; Safford, M.M.; Blair, S.N.; Hooker, S.P. Patterns of sedentary behavior and mortality in U.S. Middle-aged and older adults: A national cohort study. Ann. Intern. Med. 2017, 167, 465–475. [Google Scholar] [CrossRef] [PubMed]
- Gibbs, B.B.; Hergenroeder, A.L.; Katzmarzyk, P.T.; Lee, I.M.; Jakicic, J.M. Definition, measurement, and health risks associated with sedentary behavior. Med. Sci. Sports Exerc. 2015, 47, 1295–1300. [Google Scholar] [CrossRef] [PubMed]
- Patel, A.V.; Maliniak, M.L.; Rees-Punia, E.; Matthews, C.E.; Gapstur, S.M. Prolonged leisure-time spent sitting in relation to cause-specific mortality in a large U.S. Cohort. Am. J. Epidemiol. 2018, 187, 2151–2158. [Google Scholar] [CrossRef] [PubMed]
- Levine, J.A.; Eberhardt, N.L.; Jensen, M.D. Role of nonexercise activity thermogenesis in resistance to fat gain in humans. Science 1999, 283, 212–214. [Google Scholar] [CrossRef]
- The 2018 Physical Activity Guidelines Advisory Committee. Physical activity guidelines for Americans. 2018. Available online: https://health.gov/paguidelines/second-edition/report/ (accessed on 11 March 2019).
- Alkhajah, T.A.; Reeves, M.M.; Eakin, E.G.; Winkler, E.A.; Owen, N.; Healy, G.N. Sit-stand workstations: A pilot intervention to reduce office sitting time. Am. J. Prev. Med. 2012, 43, 298–303. [Google Scholar] [CrossRef]
- Healy, G.N.; Winkler, E.A.; Eakin, E.G.; Owen, N.; LaMontagne, A.D.; Moodie, M.; Dunstan, D.W. A cluster rct to reduce workers’ sitting time: Impact on cardiometabolic biomarkers. Med. Sci. Sports Exerc. 2017, 49, 2032–2039. [Google Scholar] [CrossRef]
- Miles-Chan, J.L.; Sarafian, D.; Montani, J.P.; Schutz, Y.; Dulloo, A. Heterogeneity in the energy cost of posture maintenance during standing relative to sitting: Phenotyping according to magnitude and time-course. PLoS ONE 2013, 8, e65827. [Google Scholar] [CrossRef]
- Gibbs, B.B.; Kowalsky, R.J.; Perdomo, S.J.; Grier, M.; Jakicic, J.M. Energy expenditure of deskwork when sitting, standing or alternating positions. Occup. Med. 2017, 67, 121–127. [Google Scholar] [CrossRef]
- Judice, P.B.; Hamilton, M.T.; Sardinha, L.B.; Zderic, T.W.; Silva, A.M. What is the metabolic and energy cost of sitting, standing and sit/stand transitions? Eur. J. Appl. Physiol. 2016, 116, 263–273. [Google Scholar] [CrossRef]
- Creasy, S.A.; Rogers, R.J.; Byard, T.D.; Kowalsky, R.J.; Jakicic, J.M. Energy Expenditure During Acute Periods of Sitting, Standing, and Walking. J. Phys. Act. Health 2016, 13, 573–578. [Google Scholar] [CrossRef] [PubMed]
- Kamimura, S.; Akiyama, S. The relationship between sit-to-stand frequency and anaerobic threshold determined by cycle ergometer. J. Phys. Ther. Sci. 2011, 23, 53–55. [Google Scholar] [CrossRef]
- Nakamura, K.; Ohira, M.; Yokokawa, Y. The effect of different standing up frequencies in sit-to-stand exercise on oxygen uptake. J. Phys. Ther. Sci. 2014, 26, 1631–1633. [Google Scholar] [CrossRef]
- Nakamura, K.; Nagasawa, Y.; Sawaki, S.; Yokokawa, Y.; Ohira, M. Effect of different seat heights during an incremental sit-to-stand exercise test on peak oxygen uptake in young, healthy women. J. Sports Sci. Med. 2016, 15, 410–416. [Google Scholar]
- Hatamoto, Y.; Yamada, Y.; Fujii, T.; Higaki, Y.; Kiyonaga, A.; Tanaka, H. A novel method for calculating the energy cost of turning during running. Open Access J. Sports Med. 2013, 4, 117–122. [Google Scholar] [CrossRef] [PubMed] [Green Version]
- Hatamoto, Y.; Yamada, Y.; Sagayama, H.; Higaki, Y.; Kiyonaga, A.; Tanaka, H. The relationship between running velocity and the energy cost of turning during running. PLoS ONE 2014, 9, e81850. [Google Scholar] [CrossRef] [PubMed]
- Hatamoto, Y.; Yamada, Y.; Higaki, Y.; Tanaka, H. A novel approach for measuring energy expenditure of a single sit-to-stand movement. Eur. J. Appl. Physiol. 2016, 116, 997–1004. [Google Scholar] [CrossRef]
- Anthony, K.; Robinson, K.; Logan, P.; Gordon, A.L.; Harwood, R.H.; Masud, T. Chair-based exercises for frail older people: A systematic review. BioMed Res. Int. 2013, 2013, 309506. [Google Scholar] [CrossRef]
- Watanabe, Y.; Tanimoto, M.; Oba, N.; Sanada, K.; Miyachi, M.; Ishii, N. Effect of resistance training using bodyweight in the elderly: Comparison of resistance exercise movement between slow and normal speed movement. Geriatr. Gerontol. Int. 2015, 15, 1270–1277. [Google Scholar] [CrossRef] [PubMed]
- Nakagata, T.; Naito, H.; Yamada, Y. Metabolic equivalents of body weight resistance training with slow movement: Implications for exercise prescription and health promotion. J. Exerc. Physiol. Online 2018, 21, 29–38. [Google Scholar]
- Weir, J.B. New methods for calculating metabolic rate with special reference to protein metabolism. J. Physiol. 1949, 109, 1–9. [Google Scholar] [CrossRef] [Green Version]
- Borg, G. Perceived exertion as an indicator of somatic stress. Scand. J. Rehabil. Med. 1970, 2, 92–98. [Google Scholar]
- Nakagata, T.; Yamada, Y.; Naito, H. Energy expenditure, recovery oxygen consumption, and substrate oxidation during and after body weight resistance exercise with slow movement compared to treadmill walking. Physiol. Int. 2018, 105, 371–385. [Google Scholar] [CrossRef]
- Ainsworth, B.E.; Haskell, W.L.; Herrmann, S.D.; Meckes, N.; Bassett, D.R., Jr.; Tudor-Locke, C.; Greer, J.L.; Vezina, J.; Whitt-Glover, M.C.; Leon, A.S. 2011 compendium of physical activities: A second update of codes and MET values. Med. Sci. Sports Exerc. 2011, 43, 1575–1581. [Google Scholar] [CrossRef] [PubMed]
- Garber, C.E.; Blissmer, B.; Deschenes, M.R.; Franklin, B.A.; Lamonte, M.J.; Lee, I.M.; Nieman, D.C.; Swain, D.P.; American College of Sports Medicine. American college of sports medicine position stand. Quantity and quality of exercise for developing and maintaining cardiorespiratory, musculoskeletal, and neuromotor fitness in apparently healthy adults: Guidance for prescribing exercise. Med. Sci. Sports Exerc. 2011, 43, 1334–1359. [Google Scholar] [CrossRef]
- Janssen, W.G.; Bussmann, H.B.; Stam, H.J. Determinants of the sit-to-stand movement: A review. Phys. Ther. 2002, 82, 866–879. [Google Scholar]
- Australian Government Department of Health. Make Your Move-Sit Less-Be Active for Life. 2014. Available online: http://www.health.gov.au/internet/main/publishing.nsf/content/F01F92328EDADA5BCA257BF0001E720D/$File/brochure%20PA%20Guidelines_A5_18-64yrs.pdf (accessed on 11 March 2019).
- Davies, S.; Burns, H.; Jewell, T.; McBride, M. Start Active, Stay Active: A Report on Physical Activity from the Four Home Countries’ Chief Medical Officers. 2011. Available online: https://assets.publishing.service.gov.uk/government/uploads/system/uploads/attachment_data/file/216370/dh_128210.pdf (accessed on 11 March 2019).
- Ortega, J.D.; Farley, C.T. Individual limb work does not explain the greater metabolic cost of walking in elderly adults. J. Appl. Physiol. 2007, 102, 2266–2273. [Google Scholar] [CrossRef] [PubMed] [Green Version]
- Ko, S.U.; Stenholm, S.; Chia, C.W.; Simonsick, E.M.; Ferrucci, L. Gait pattern alterations in older adults associated with type 2 diabetes in the absence of peripheral neuropathy—Results from the baltimore longitudinal study of aging. Gait Posture 2011, 34, 548–552. [Google Scholar] [CrossRef] [PubMed]
- Nagai, K.; Yamada, M.; Uemura, K.; Yamada, Y.; Ichihashi, N.; Tsuboyama, T. Differences in muscle coactivation during postural control between healthy older and young adults. Arch. Gerontol. Geriatr. 2011, 53, 338–343. [Google Scholar] [CrossRef] [Green Version]
- Tanimoto, M.; Ishii, N. Effects of low-intensity resistance exercise with slow movement and tonic force generation on muscular function in young men. J. Appl. Physiol. 2006, 100, 1150–1157. [Google Scholar] [CrossRef] [PubMed] [Green Version]


| Normal (1 s) | 1 time/min | 6 times/min | 10 times/min | 15 times/min | 20 times/min | 30 times/min |
|---|---|---|---|---|---|---|
| Exercise timing | 0 (every 1 min) | 0,10,20, 30,40,50 (every 10 s) | 0,6,12… 48,54 (every 6 s) | 0,4,8… 52,56 (every 4 s) | 0,3,6… 54,57 (every 3 s) | 0,2,4… 56,58 (every 2 s) |
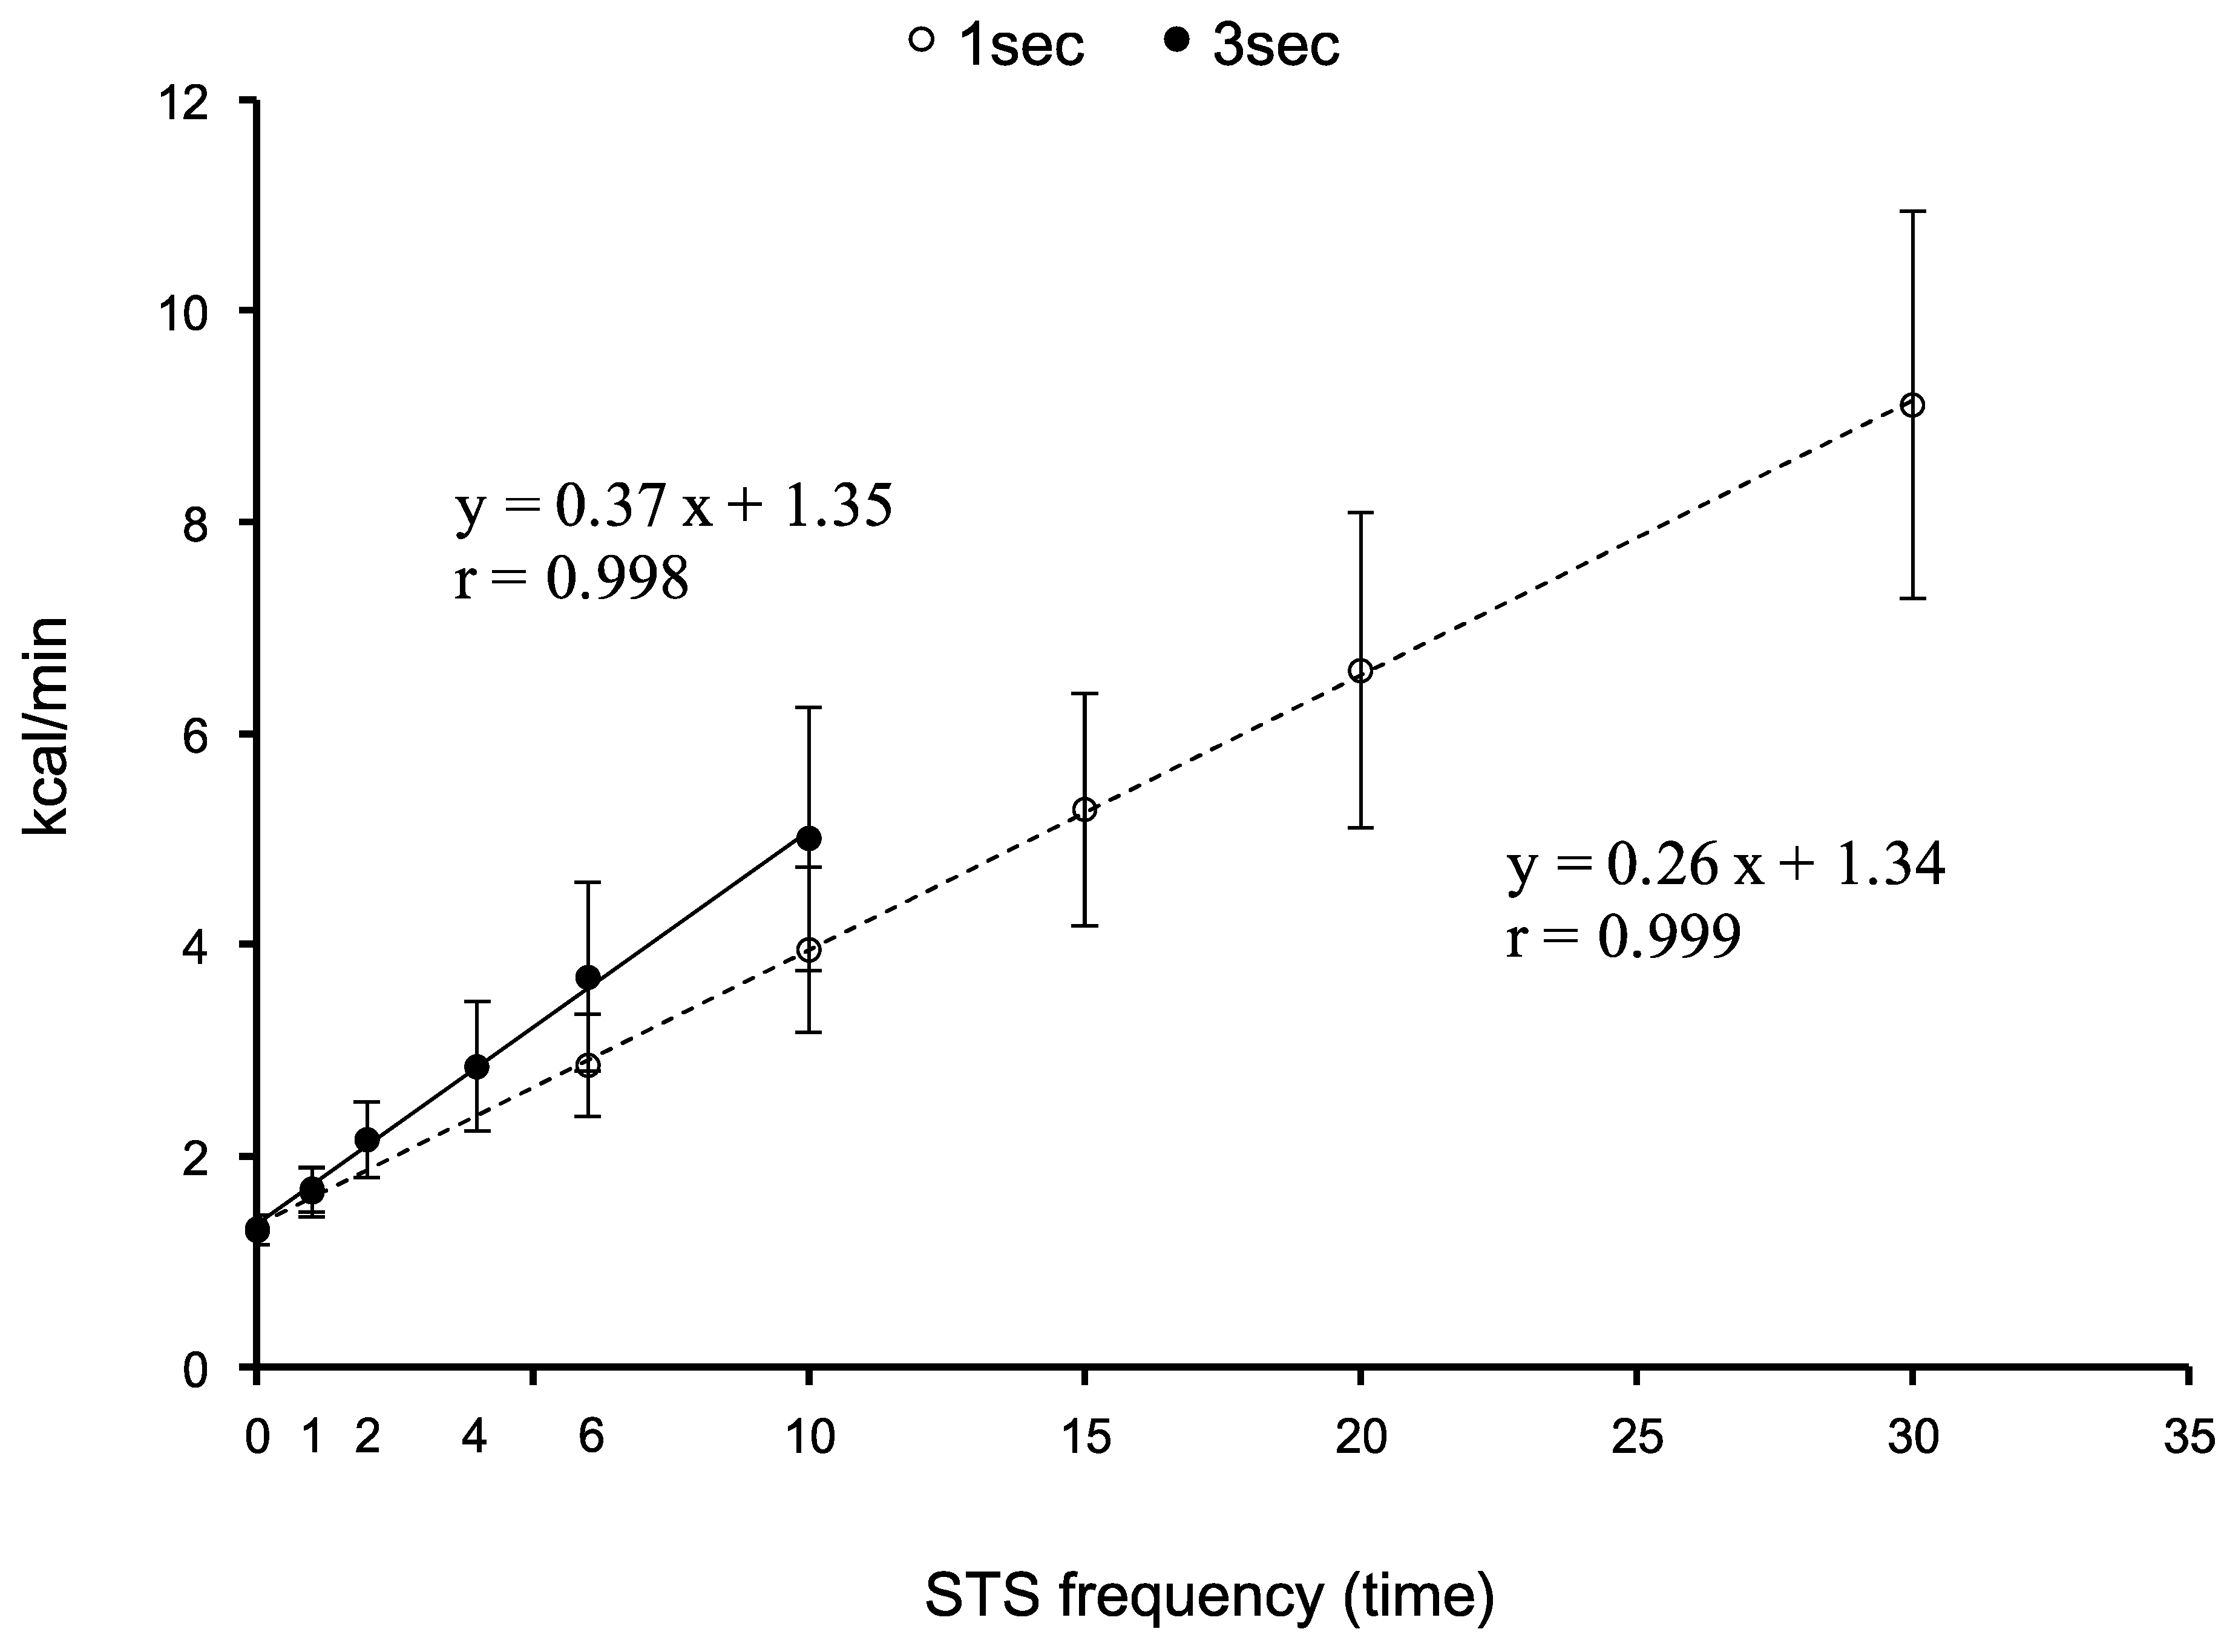
| EE (kcal/min) | 1.7 ± 0.2 | 2.9 ± 0.5 | 4.0 ± 0.8 | 5.3 ± 1.1 | 6.6 ± 1.5 | 9.1 ± 1.8 |
| METs | 1.5 ± 0.2 | 2.7 ± 0.3 | 3.6 ± 0.4 | 4.8 ± 0.6 | 5.9 ± 0.8 | 8.1 ± 0.9 |
| HR (bpm) | 79 ± 10 | 86 ± 10 | 95 ± 13 | 103 ± 13 | 118 ± 15 | 137 ± 25 |
| RPE | 7 ± 1 | 9 ± 2 | 10 ± 2 | 11 ± 2 | 12 ± 2 | 14 ± 3 |
| La (mM) | 0.68 ± 0.20 | 0.71 ± 0.22 | 0.74 ± 0.24 | 0.84 ± 0.46 | 1.23 ± 0.86 | 2.48 ± 1.47 |
| Slow (3 s) | 1 time/min | 2 times/min | 4 times/min | 6 times/min | 10 times/min | |
| Exercise timing | 0 (every 1 min) | 0,30 (every 30 s) | 0,15, 30,45 (every 15 s) | 0,10,20, 30,40,50 (every 10 s) | 0,6,12… 48,54 (every 6 s) | |
| EE (kcal/min) | 1.7 ± 0.2 | 2.2 ± 0.4 | 2.8 ± 0.6 | 3.7 ± 0.9 | 5.0 ± 1.2 | |
| METs | 1.5 ± 0.2 | 2.0 ± 0.2 | 2.6 ± 0.3 | 3.3 ± 0.5 | 4.5 ± 0.7 | |
| HR (bpm) | 80 ± 10 | 83 ± 10 | 86 ± 11 | 92 ± 13 | 101 ± 13 | |
| RPE | 7 ± 2 | 8 ± 2 | 9 ± 2 | 10 ± 3 | 11 ± 3 | |
| La (mmol/L) | 0.90 ± 0.26 | 0.87 ± 0.18 | 0.85 ± 0.21 | 0.90 ± 0.23 | 1.47 ± 0.97 |
© 2019 by the authors. Licensee MDPI, Basel, Switzerland. This article is an open access article distributed under the terms and conditions of the Creative Commons Attribution (CC BY) license (http://creativecommons.org/licenses/by/4.0/).
Share and Cite
Nakagata, T.; Yamada, Y.; Hatamoto, Y.; Naito, H. Energy Expenditure of a Single Sit-to-Stand Movement with Slow Versus Normal Speed Using the Different Frequency Accumulation Method. Medicina 2019, 55, 77. https://doi.org/10.3390/medicina55030077
Nakagata T, Yamada Y, Hatamoto Y, Naito H. Energy Expenditure of a Single Sit-to-Stand Movement with Slow Versus Normal Speed Using the Different Frequency Accumulation Method. Medicina. 2019; 55(3):77. https://doi.org/10.3390/medicina55030077
Chicago/Turabian StyleNakagata, Takashi, Yosuke Yamada, Yoichi Hatamoto, and Hisashi Naito. 2019. "Energy Expenditure of a Single Sit-to-Stand Movement with Slow Versus Normal Speed Using the Different Frequency Accumulation Method" Medicina 55, no. 3: 77. https://doi.org/10.3390/medicina55030077