1. Introduction
This viscosity is a key parameter in the assessment of blood flow and tissue perfusion in microcirculatory studies. In the isolated hind-limbs of dogs, the blood viscosity increases exponentially when the hematocrit is raised, and the blood flow then requires a higher driving pressure [
1]. However, the effects of variations in the red blood cell (RBC), platelet (Trc), and leukocyte counts within the normal range on the macrocirculation in healthy humans are poorly studied.
Volume kinetics is a macroscopic method that is applicable to the study of these effects, if any [
2]. The volume kinetic method is based on repeated measurement of the blood hemoglobin (Hb) concentration, which is the inverse of the blood water concentration [
3]. Infusion fluids contain almost exclusively water; therefore, Hb changes are a useful index of the water volume that equilibrates with the circulating blood. This type of analysis can also be used for the simulation of the influences of combined differences in distribution and elimination of infused fluid on plasma volume expansion, peripheral edema, and urinary excretion [
4].
The aim of the present study was to investigate the kinetics of a rapid fluid load of three different crystalloid fluids (Ringer's acetate, Ringer's lactate, and isotonic saline) in a randomized cross-over fashion in volunteers. The influence of variations in the RBC, Trc, and leukocyte counts on fluid kinetics was studied by applying these parameters as time-varying covariates in a population kinetic model for nonlinear mixed effects. The arterial blood pressure and the heart rate were also monitored because the hemodynamics may have competitive effects on the kinetics.
2. Materials and methods
The study was based on 30 strictly controlled infusion experiments performed in 10 male volunteers aged between 24 and 44 (mean, 32) years and with a body weight ranging between 72 and 95 (mean, 81) kg. All volunteers received an intravenous infusion of 25 mL/kg of Ringer's acetate, Ringer's lactate, and isotonic saline over 30 min, administered in a crossover fashion and in random order. The subjects gave their approval for participation after being informed of the study's purpose, which had been approved by the Ethics Committee of Huddinge University Hospital (Dnr 222/98, chairperson Lennart Kaijser). The project originally contained five infusions, and a two-step analysis of the hemodilution has been published [
5]. Here, three of the infusions are studied in more detail.
The experiments were limited to only one experiment in one volunteer per day throughout the duration of the study. The wash-out period between the infusions was one week. On each occasion, the volunteer arrived at the Research Center at Söder Hospital in Stockholm at 8:30 AM. He had been allowed to ingest one glass (250 mL) of fluid and one sandwich 2 h before arrival. The volunteer rested for 30 min on a bed to reach a hemodynamic steady state. A cannula was placed in the cubital vein of each arm: one for blood sampling and the other for infusion of crystalloid fluid. Volunteers were covered in blankets to ensure good thermal comfort. The arm used for blood sampling was placed on a body-temperature heating pad.
The rate of infusion of crystalloid fluid was controlled using infusion pumps. During and after the infusions, venous blood (2–3 mL) was withdrawn to measure the Hb concentration, the hematocrit (Hct), RBC, Trc, and total leukocyte count on the Technicon H2 (Bayer, Tarrytown, NY, USA) instrument used for routine measurements in the Clinical Chemistry Laboratory of the Hospital. The samples were withdrawn in a standardized manner, using a discard sample to prevent admixture of rinsing solution (isotonic saline), to ensure a coefficient of variation (CV) of approximately 1%. A volume of saline was then injected that corresponded to the sampled plasma volume. Sampling was performed every 5 min for 2 h and then every 10 min during the following 2 h, for a total of 37 samples over 4 h. The baseline sample was drawn in duplicate, and the mean of the two measurements was used in the calculations. The subjects voided just before the experiments, and this urine was discarded. The volume of the urine excreted during the study was recorded.
The ionic contents in mmol/L of the three crystalloid fluids (all manufactured by Baxter Healthcare) were as follows:
Ringer's acetate Na+ 130, K+ 4, Ca2+ 2, Cl− 110, acetate 130 (273 mosmol/kg)
Ringer's lactate Na+ 130, K+ 4, Ca2+ 2.7, Cl− 109, lactate 28 (273 mosmol/kg)
Isotonic saline Na+ 154, Cl−154 (308 mosmol/kg)
The systolic and diastolic arterial pressures and the heart rate were measured on a noninvasive hemodynamic monitor (Propaq, Protocol Systems Inc., Beaverton, OR, USA) and the results were recorded for the same time points as the blood samples were taken. The mean arterial pressure (MAP) was calculated as the diastolic pressure plus one third of the difference between the systolic and diastolic pressures.
The serum sodium and potassium concentrations and the serum osmolality were measured every 15–30 min by a direct potentiometry technique using an IL BGE analyzer (Instrumentation Laboratory, Milan, Italy) with a coefficient of variation of 1%–2%.
2.1. Kinetic model
A two-volume kinetic model with two routes of elimination was simultaneously fitted to the dependent variables (frequently measured plasma dilution and total urinary excretion) in all 30 experiments. The reason why two elimination functions are used is that not all of the fluid that is eliminated from the kinetic system can be recovered as urine. The influence of various covariates on the model parameters was then tested sequentially, as guided by a reduction of the residual error (–2 LL = log likelihood).
This kinetic model has been used previously [
4] and agrees well with physiological data showing the isotonic infusion fluids distribute between two compartments, the plasma and the interstitial fluid space.
Fluid infused into the plasma (
Vc, volume) is eliminated by urinary excretion (
k10, rate constant) and residual elimination (
kb, rate constant; previously called “
k10 residual” [
4]), as well as being distributed (
k12, rate constant) and re-distributed (
k21, rate constant) to the interstitial fluid space (
Vt, volume). All flow rates are proportional to the volume expansion of the respective body fluid space. Several other models have been tested, including one- and two-compartment models and zero-order
kb, but the present one has found to be most appropriate [
6].
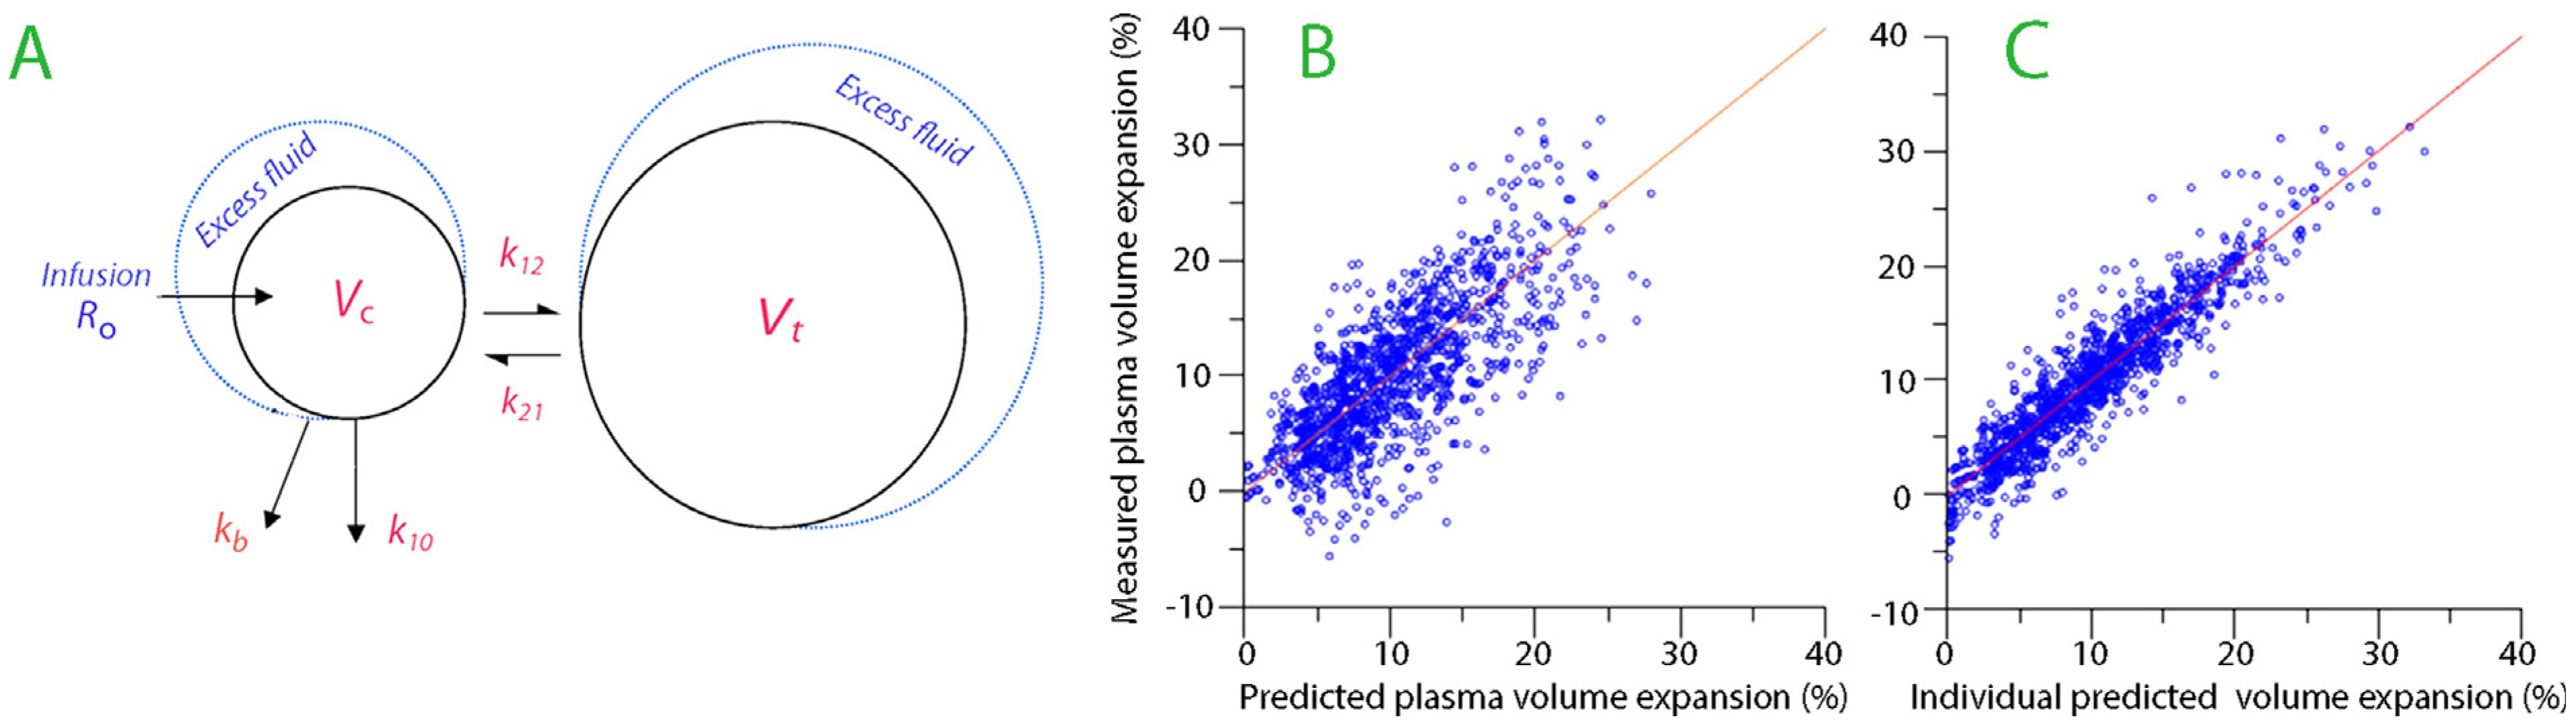
A schematic drawing of the kinetic model is shown in
Fig. 1A. In the model, fluid is infused at rate
Ro and expands the volume of a central body fluid space
Vc to
vc (the plasma volume). The fluid distribution to the peripheral body fluid space
Vt (the interstitial fluid volume) is governed by
k12 and its return from
vt to
vc by rate constant
k21. The elimination was given as the sum of two flows: the urinary excretion was set to the product of the volume expansion of
Vc and an elimination rate constant,
k10, and a residual elimination, which equaled the product of
Vc and another rate constant,
kb.
The differential equations are:
The Hb-derived fractional plasma dilution was used to indicate the volume expansion of
Vc resulting from the infusion, and thus served as dependent variable (input function) in the calculations. The fractional dilution provides a linear relationship between the added fluid volume and the concentration of a marker in an expandable fluid space [
2]. Hence:
Symbols in capital letters denote baseline values. A minor correction was made for the effects of blood sampling on the plasma dilution [
2].
The measured urinary excretion during 15-min intervals shows good linear correlation with the urinary excretion as predicted by a single exponential [
7,
8]. The relationships between urinary excretion,
k10, and the half-life of the infused fluid (
T1/2) can then be written as follows (AUC = area under the curve);
2.2. Population kinetic modeling
Population (mixed effects) kinetics include the traditional fixed model components used in pharmacokinetics but adds sub-models for the variations in these components that are individual-specific or occasion-specific. For example, the central volume of distribution (
Vc) in an individual is dependent both on the typical value (tv) for
Vc in the population, but might also be dependent on the body weight (BW) of the individual (ind).
By considering the body weight, a more precise predic- tion of the dependent variable (here, the plasma dilution) can be made than in the traditional situation, where only the mean
Vc for the population is used. BW is called a covariate, and its relationship to
Vc can be described mathematically in many ways. In the present work, the exponential model error form was usually found to be the most appropriate one. Hence:
The typical value of a fixed parameter for a population is derived from the THETA vector and the random effects from the ETA vector. The latter includes information about between-subject, within-subject, and residual variability [
9].
2.3. Kinetic analysis
The fixed parameters in the structural model (
Vc,
k12,
k21,
kb, and
k10) were estimated simultaneously using the Phoenix software for nonlinear mixed effects (NLME), version 1.3 (Pharsight, St. Louis, MO), while setting
k10 equal to the total urinary excretion divided by the AUC of the volume-time curve during the entire experiment. The sandwich method was employed as the variance estimator, which is efficient when specifying covariance misspecification. This so-called
base model was developed using the First Order Conditional Estimation search routine of Lindstrom–Bates (FOCE LB) and the additive model for the within-subject variability [
9].
The base model was refined to become the full model by adding covariates in a sequential fashion. The decision to include a covariate was based on a reduction of the log likelihood (—2 LL) for the curve-fit by >3.8 points, which represents P < 0.05 (>6.6 points represents P < 0.01). The confidence interval for the covariate should also be statistically significant (not include 1.0) and the coefficient of variation, i.e. the inter-individual variability, should be <50%.
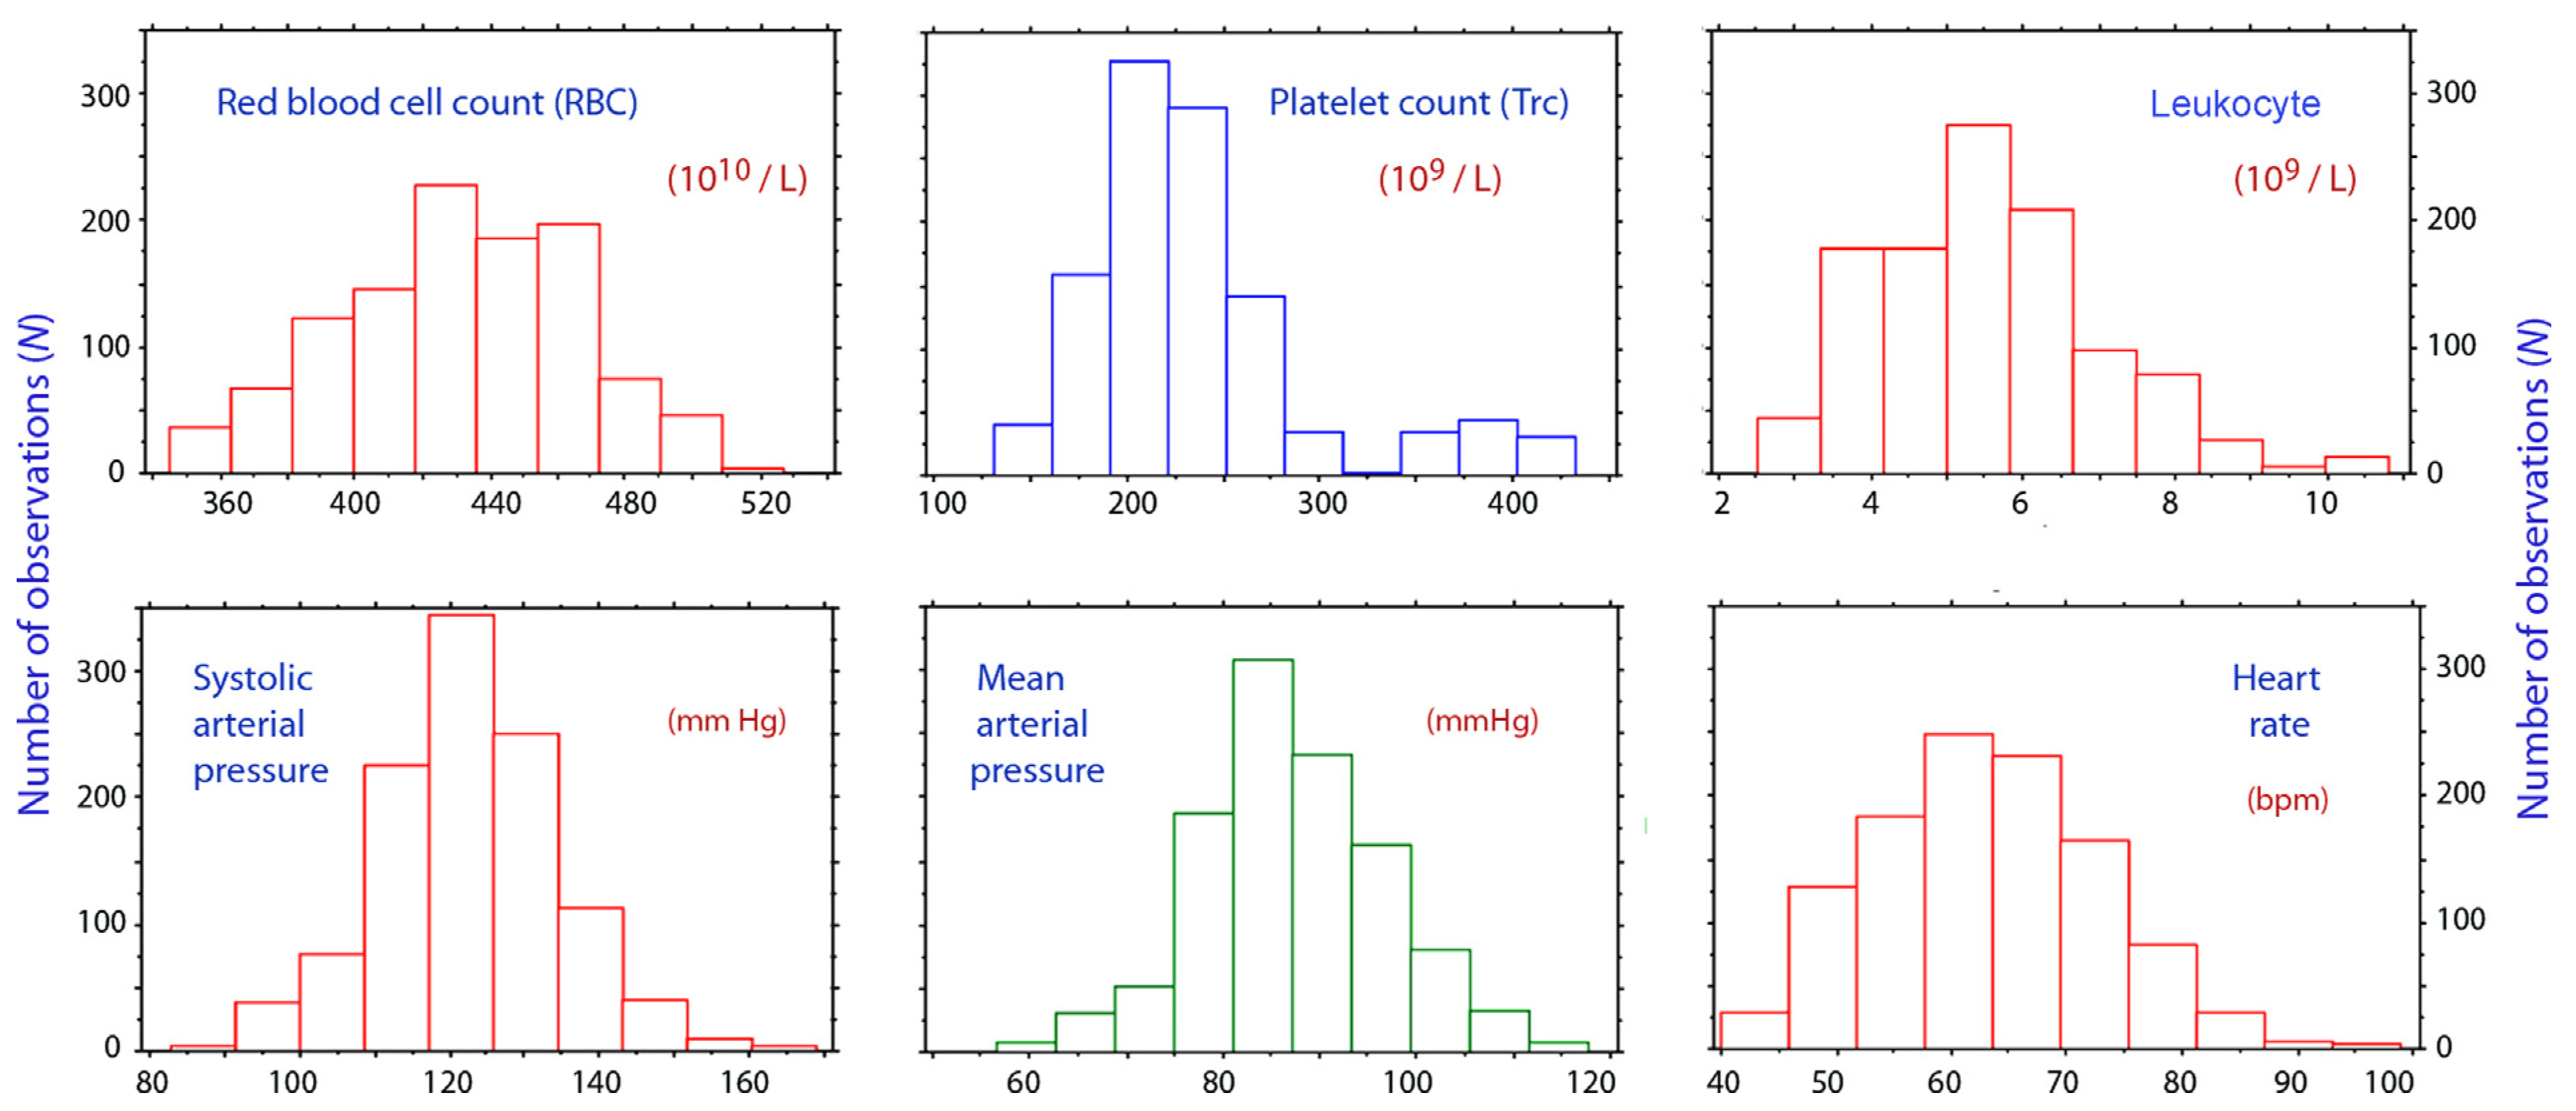
The covariate search was performed with the exponential error model for the between-subject variation, as suggested by random-effect plots. The following characteristics were evaluated as potential covariates in the model: the body weight and the use of Ringer's lactate, Ringer's acetate, or isotonic saline. The following parameters were evaluated as time-varying covariates in the model, which means that a new value was included for each point of measurement: the RBC count, the platelet count, the leukocyte count, and the systolic, diastolic, and mean arterial pressures, as well as the changes, in all these parameters from baseline.
The goodness-of-fit of the model was illustrated by comparing the measured with the predicted fractional plasma volume expansion (using the base model parameters only) and the measured with the individual predicted plasma volume expansion (full model).
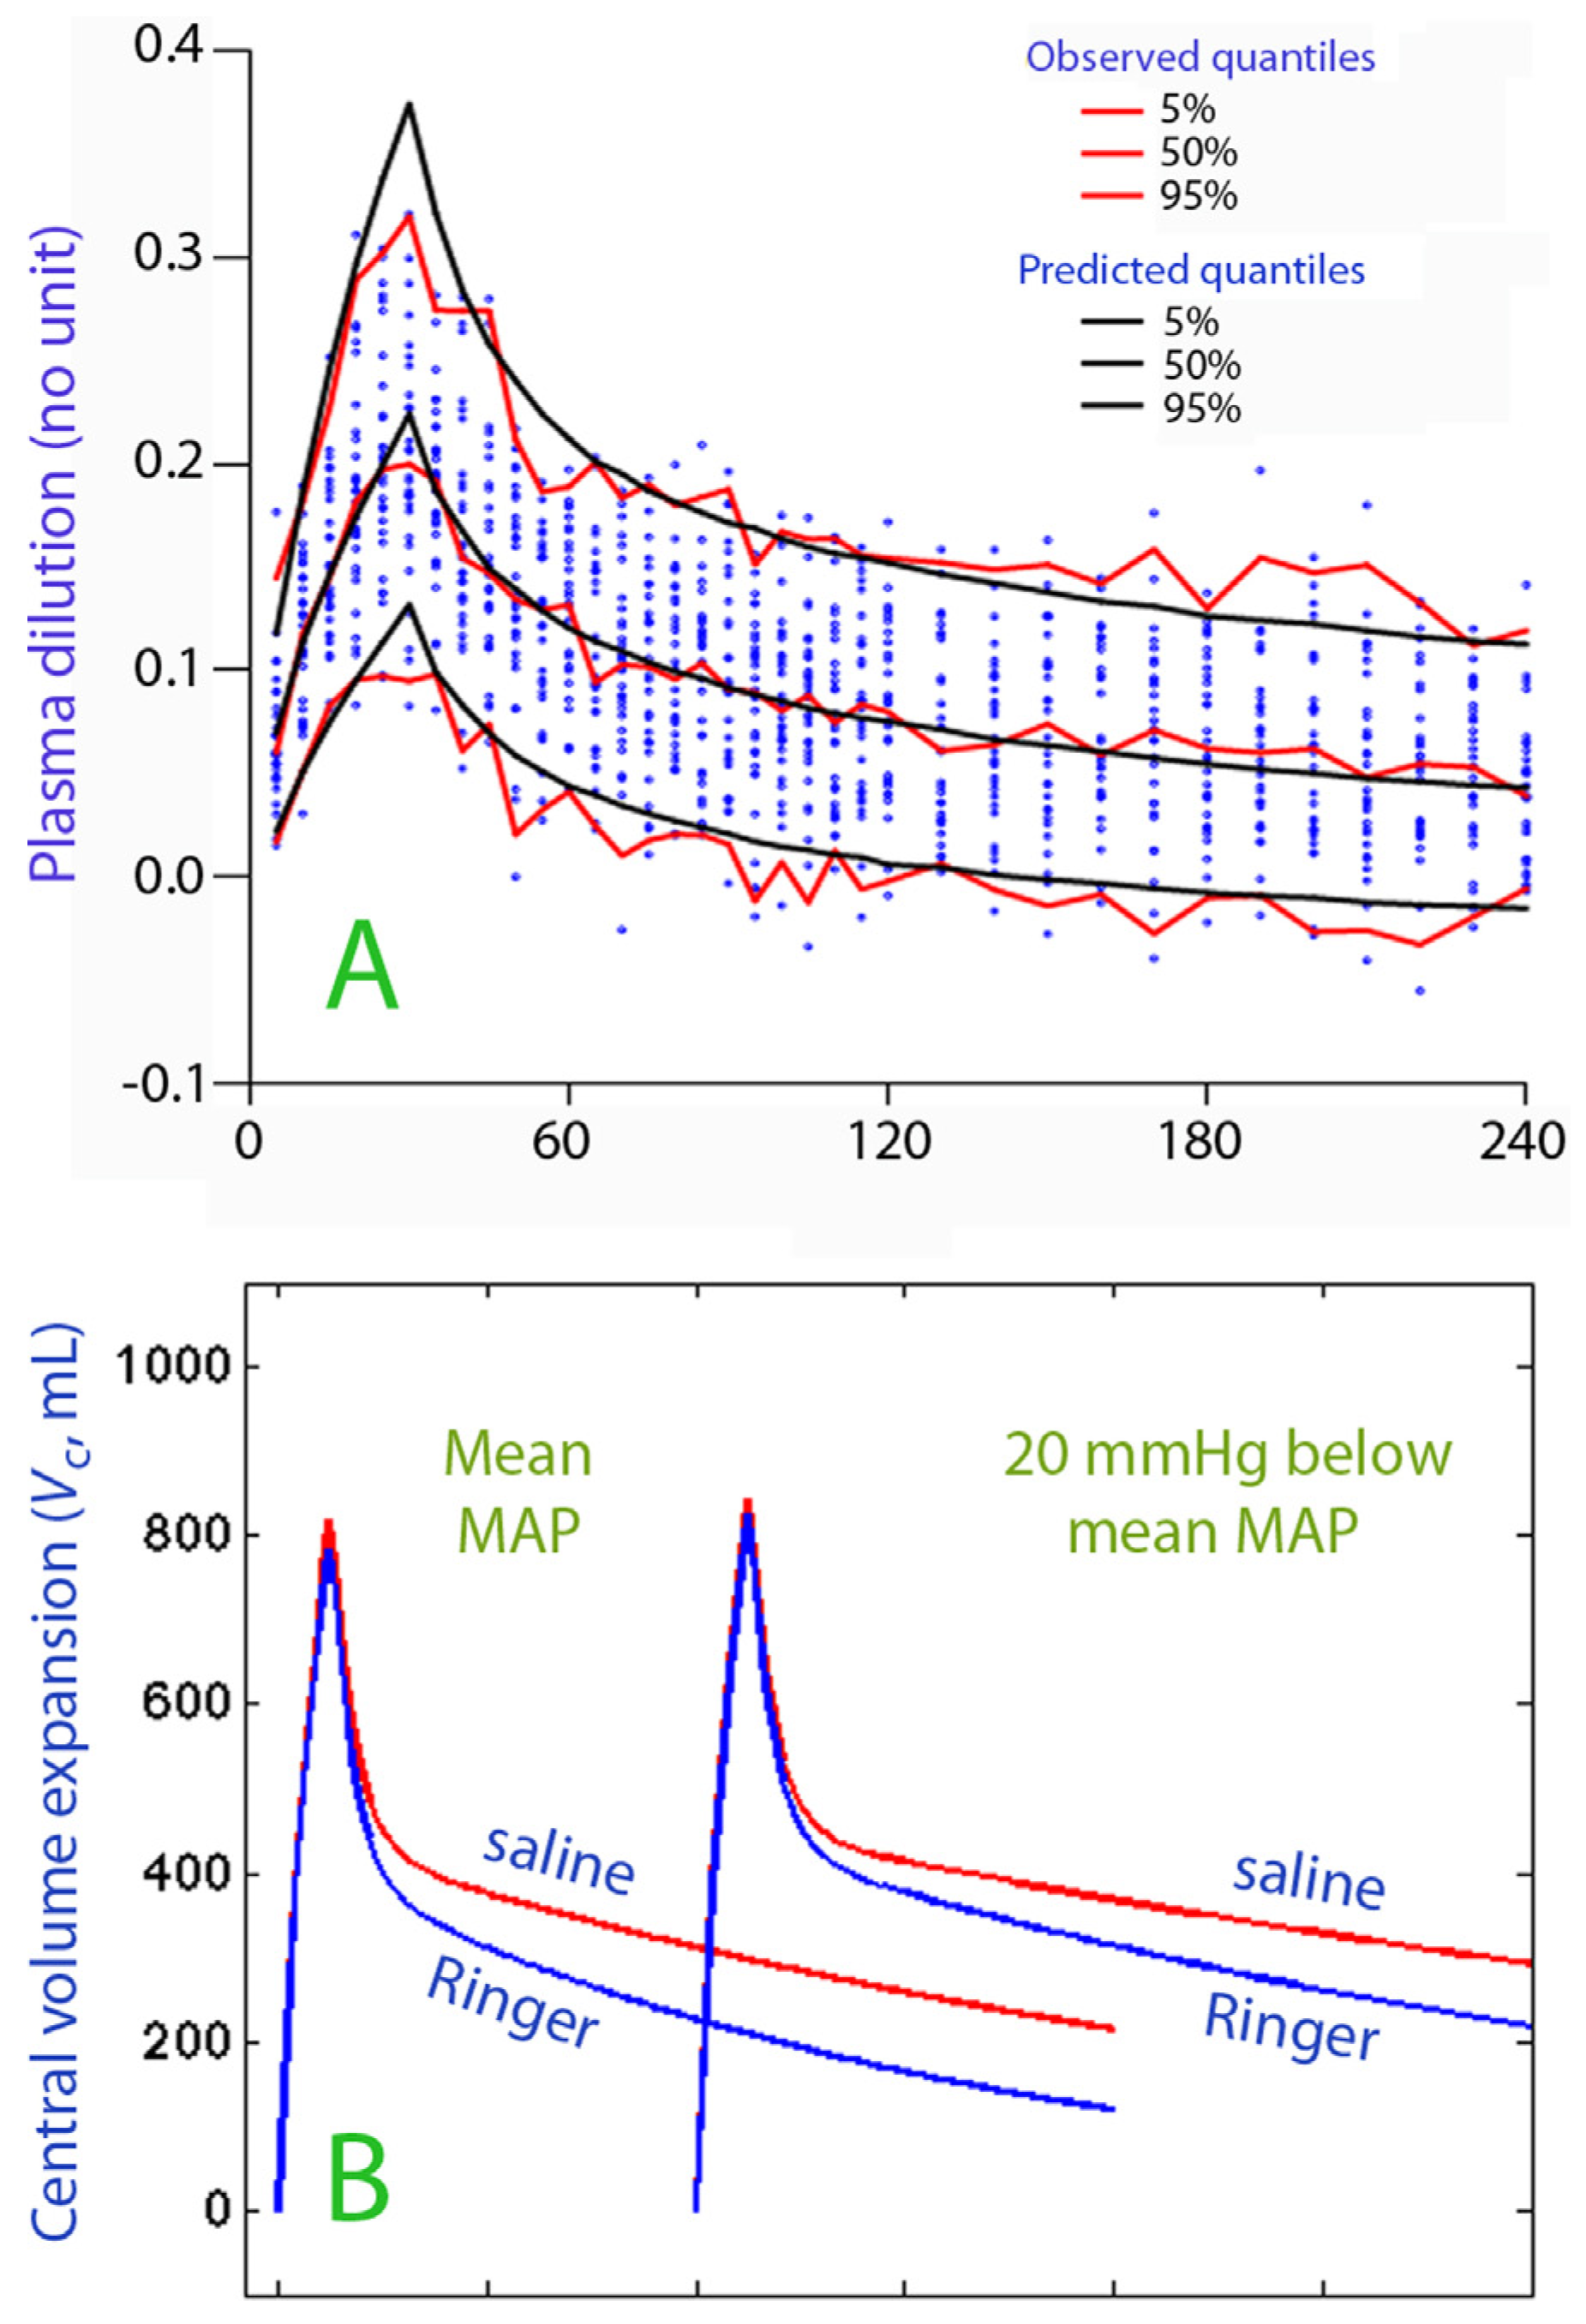
The performance of the model was studied by predictive checks based on 1000 simulations using a built-in function in the Phoenix NLME software. Close agreement between the percentiles for the predictive check (predicted) and the original data (observed) is evidence of good model performance and indicates that the model is robust.
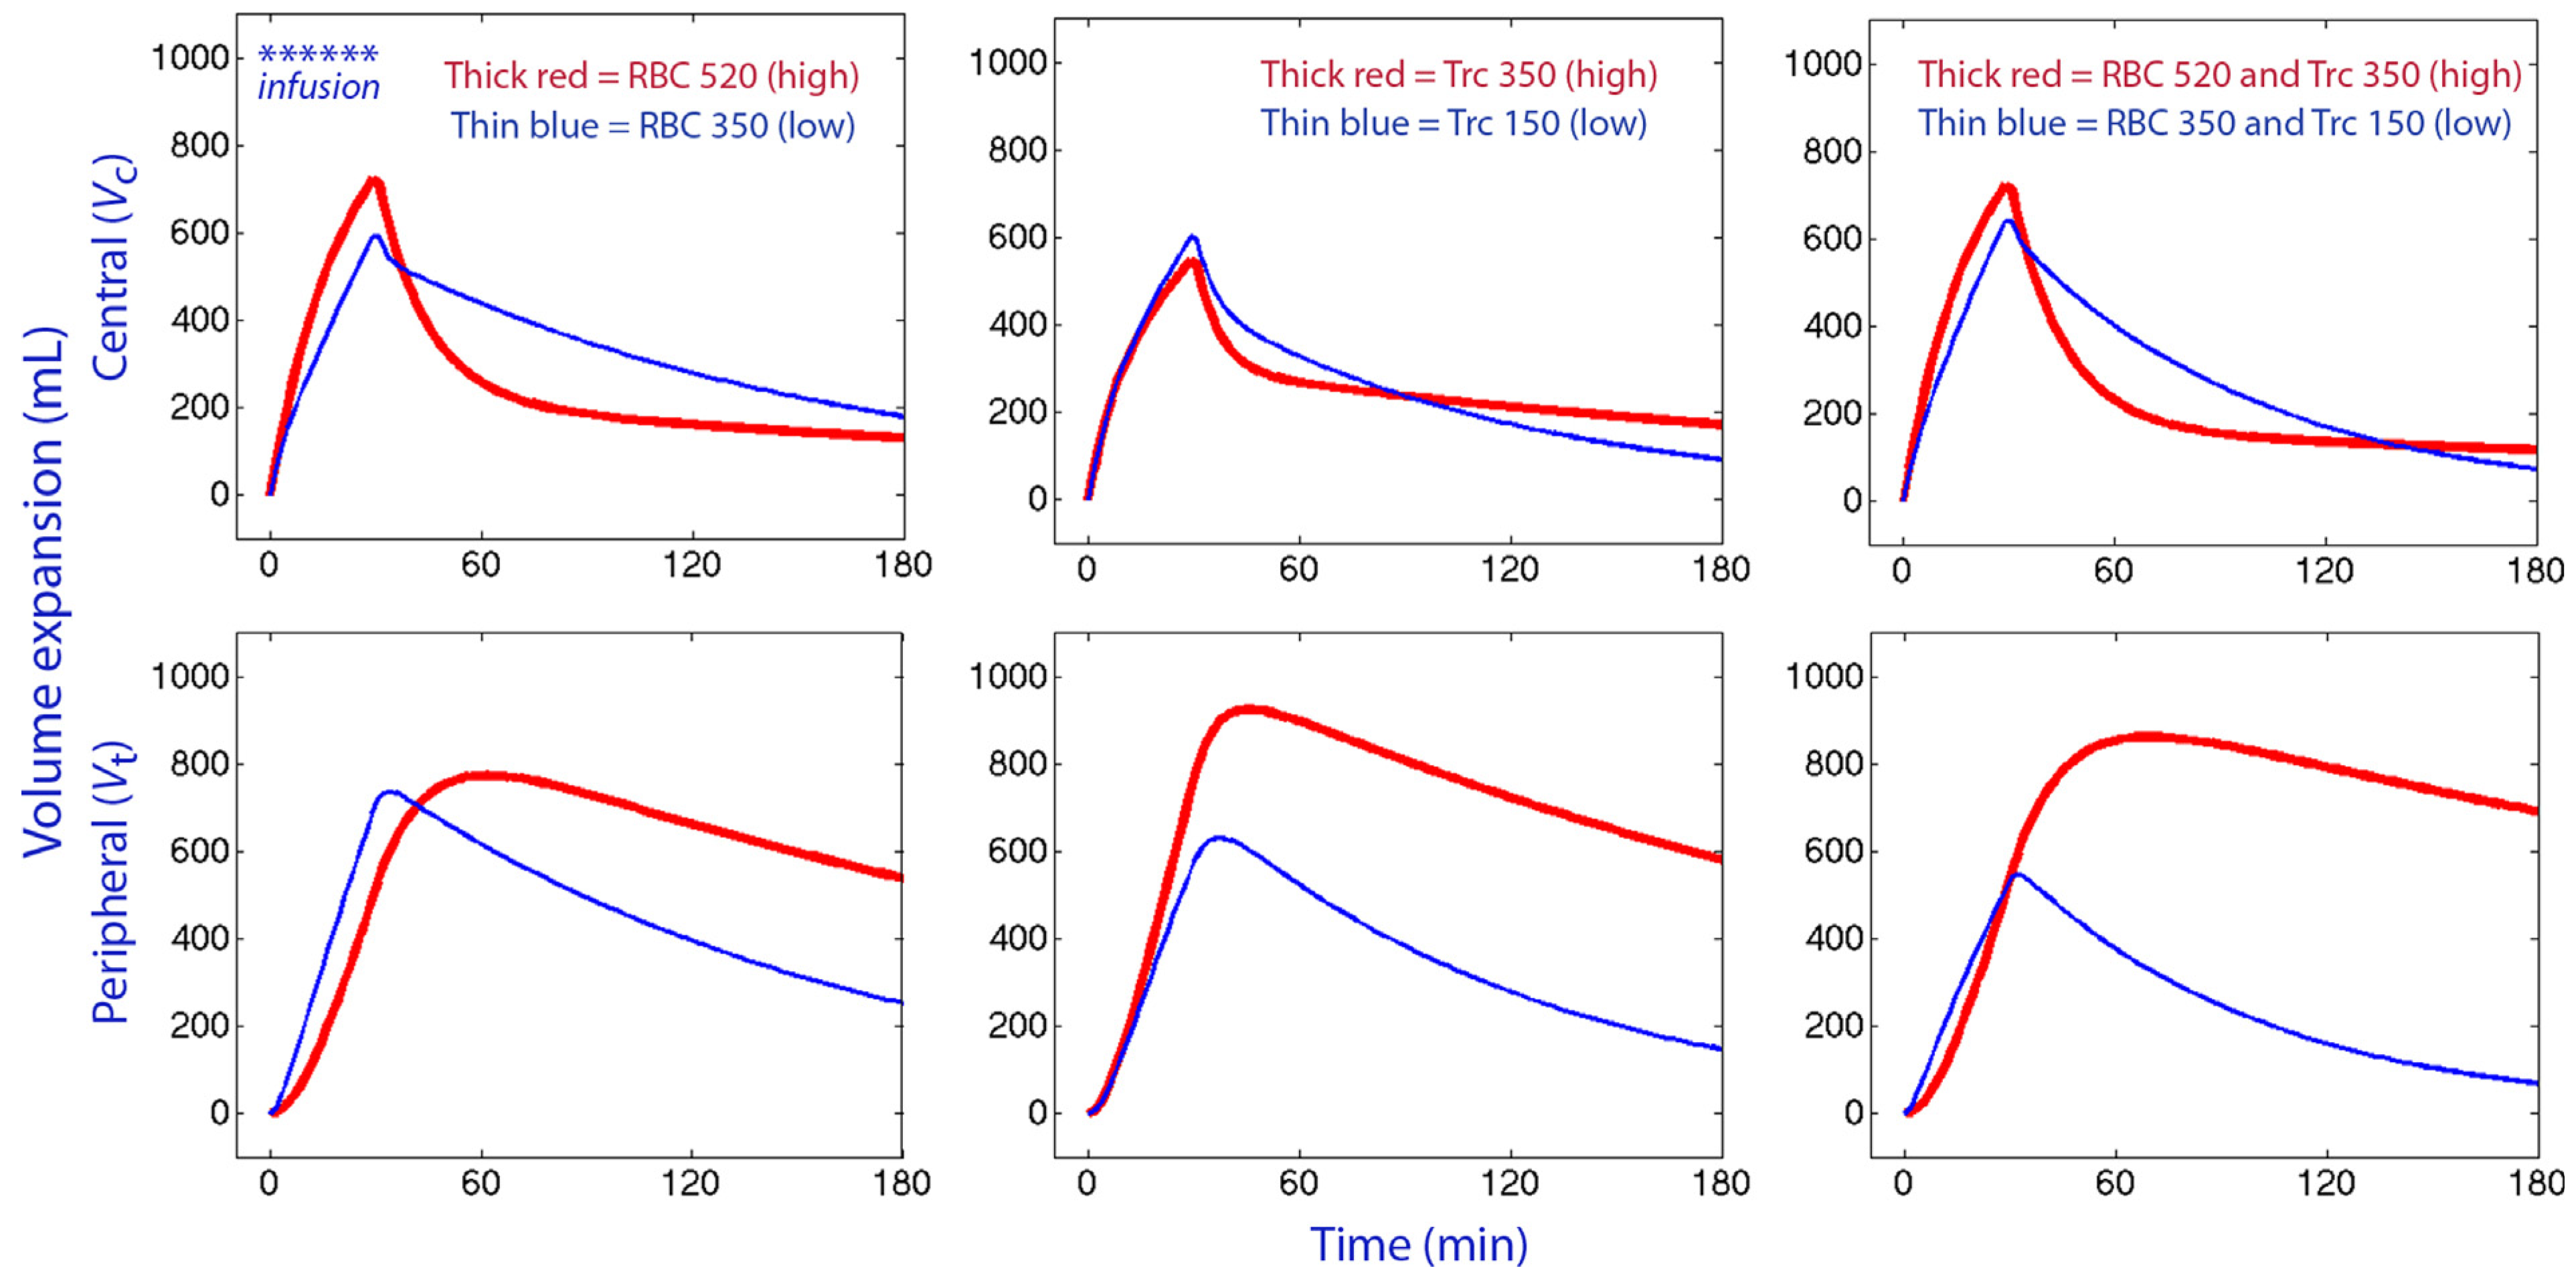
Computer simulations using Matlab R2013b (Math Works Inc., Natick, MA) were used to illustrate the influence of the key covariates on the distribution of fluid between central (Vc) and peripheral body fluid space (Vt). The best estimates of the model parameters and their covariates (if any) were entered into the solutions (solved by optODE) to the two differential equations describing the kinetic model.
Demographic data were reported as the mean (standard deviation) and the kinetic data are reported as the mean (95% confidence interval). Changes in hemodynamic parameters during the experiments were assessed by repeated-measures ANOVA and the paired t test. P < 0.05 was considered statistically significant.
4. Discussion
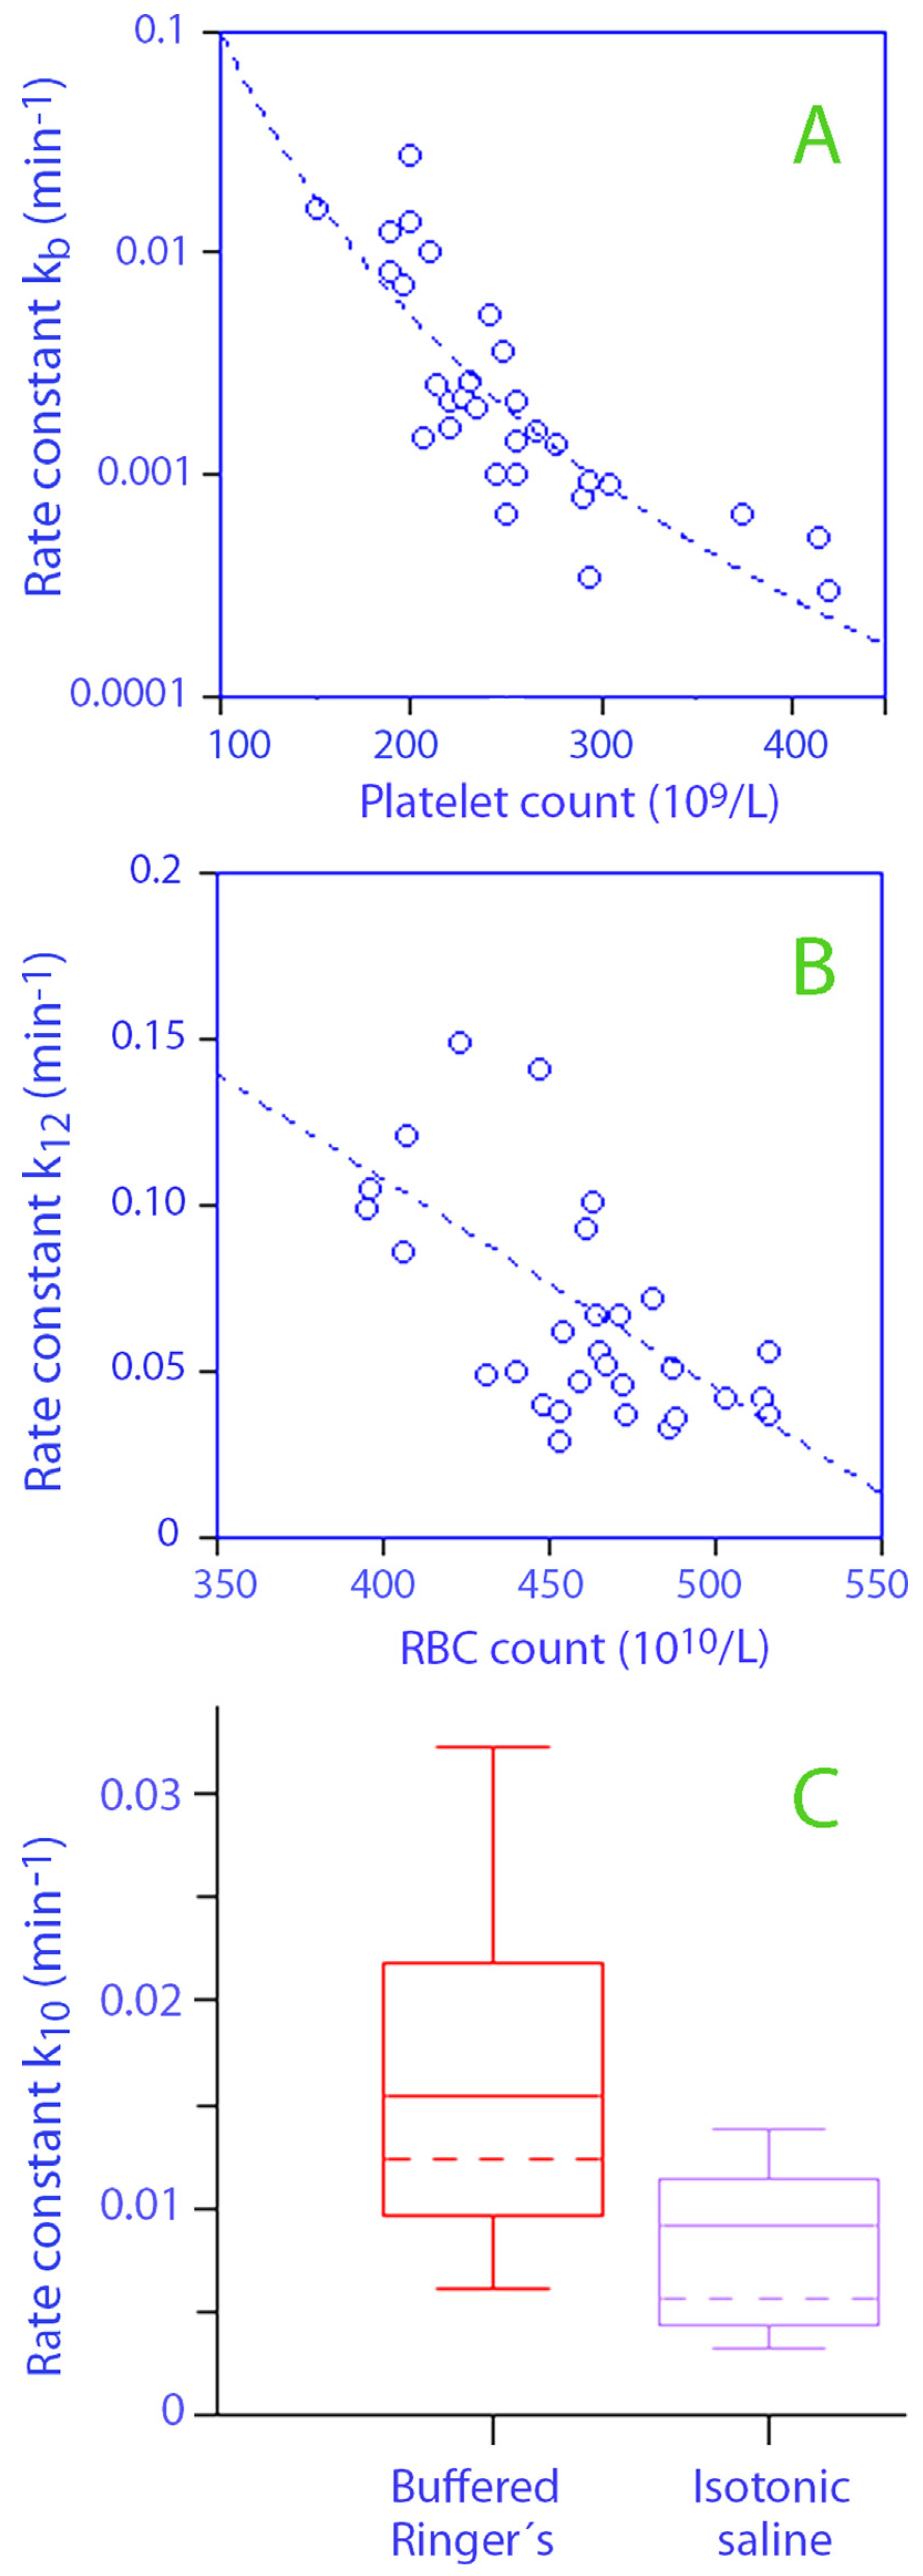
Several rate constants in the kinetic model showed lower values when the RBC and Trc counts were high. Both k12 and k21 were affected by the RBCs, while k21 and kb became reduced when the Trc count was high. Thus, both fluid distribution and re-distribution occurred more slowly when these cell counts were at the upper end of the normal range. Conversely, the equilibration of fluid between the body fluid compartments, as identified by the volume kinetic analysis, occurred faster when the RBC and Trc counts were at the lower end of the normal range.
A possible explanation for the reduced
k12 that hemocon- centration changes the blood viscosity and blood flow rates so as to retain fluid in the bloodstream. The composite effect of the different cell counts, as illustrated by computer simulations, was still only a limited change in the volume expansion of the central space (the plasma volume) while fluid accumulation in the peripheral space (the interstitium) was markedly greater when the RBC and/or Trc counts were high. The greater retardation of re-distributional flow, as compared to distributional flow, promoted peripheral edema. This difference can also explain the poorer plasma volume expansion that was maintained after the infusions ended in the presence of high RBC and Trc counts, which is otherwise a paradoxical effect of retarded distribution (
Fig. 5).
Another factor that contributed to the variations in fluid distribution was a high Trc count was associated with lower
kb values (
Fig. 3A). This covariance could possibly involve reduced lymphatic drainage, as
kb represents elimination from the kinetic model that cannot be recovered as urine. Platelets function to maintain the blood–lymph separation throughout life [
10,
11], may affect blood viscosity [
12], and are present at high concentrations along the capillary wall, where they plug small leaks in the endothelium. The overall effect of a raised Trc count then seems to be to reduce fluid movements between compartments.
Other covariates are known from previous work. The use of isotonic saline instead of Ringer's acetate retards urinary excretion [
13,
14], as shown by the statistically significant covariance between saline and
k10 (
Table 2;
Fig. 4B). The half-life was then twice as long for isotonic saline as it was for the two Ringer solutions, assuming that the mean arterial pressures were the same. However, this difference is valid for males only. The half-life of infused crystalloid fluid seems to be shorter in females than in males [
8]. A recent evaluation that used the same set-up and kinetic analysis showed that the half-life of Ringer's acetate was only 24 min in a cohort of females [
15]. The half-life of isotonic saline in females does not seem to have been published.
The covariance effect of MAP on
k10 was also statistically significant (
Table 2) and implies that less urine is excreted when MAP is low. However, the hemodynamics differed very little during and between the infusions, and the variability in arterial pressure was too small to explain the full strength of its influence on urinary excretion. A recent and more complete exploration of this issue can be found elsewhere [
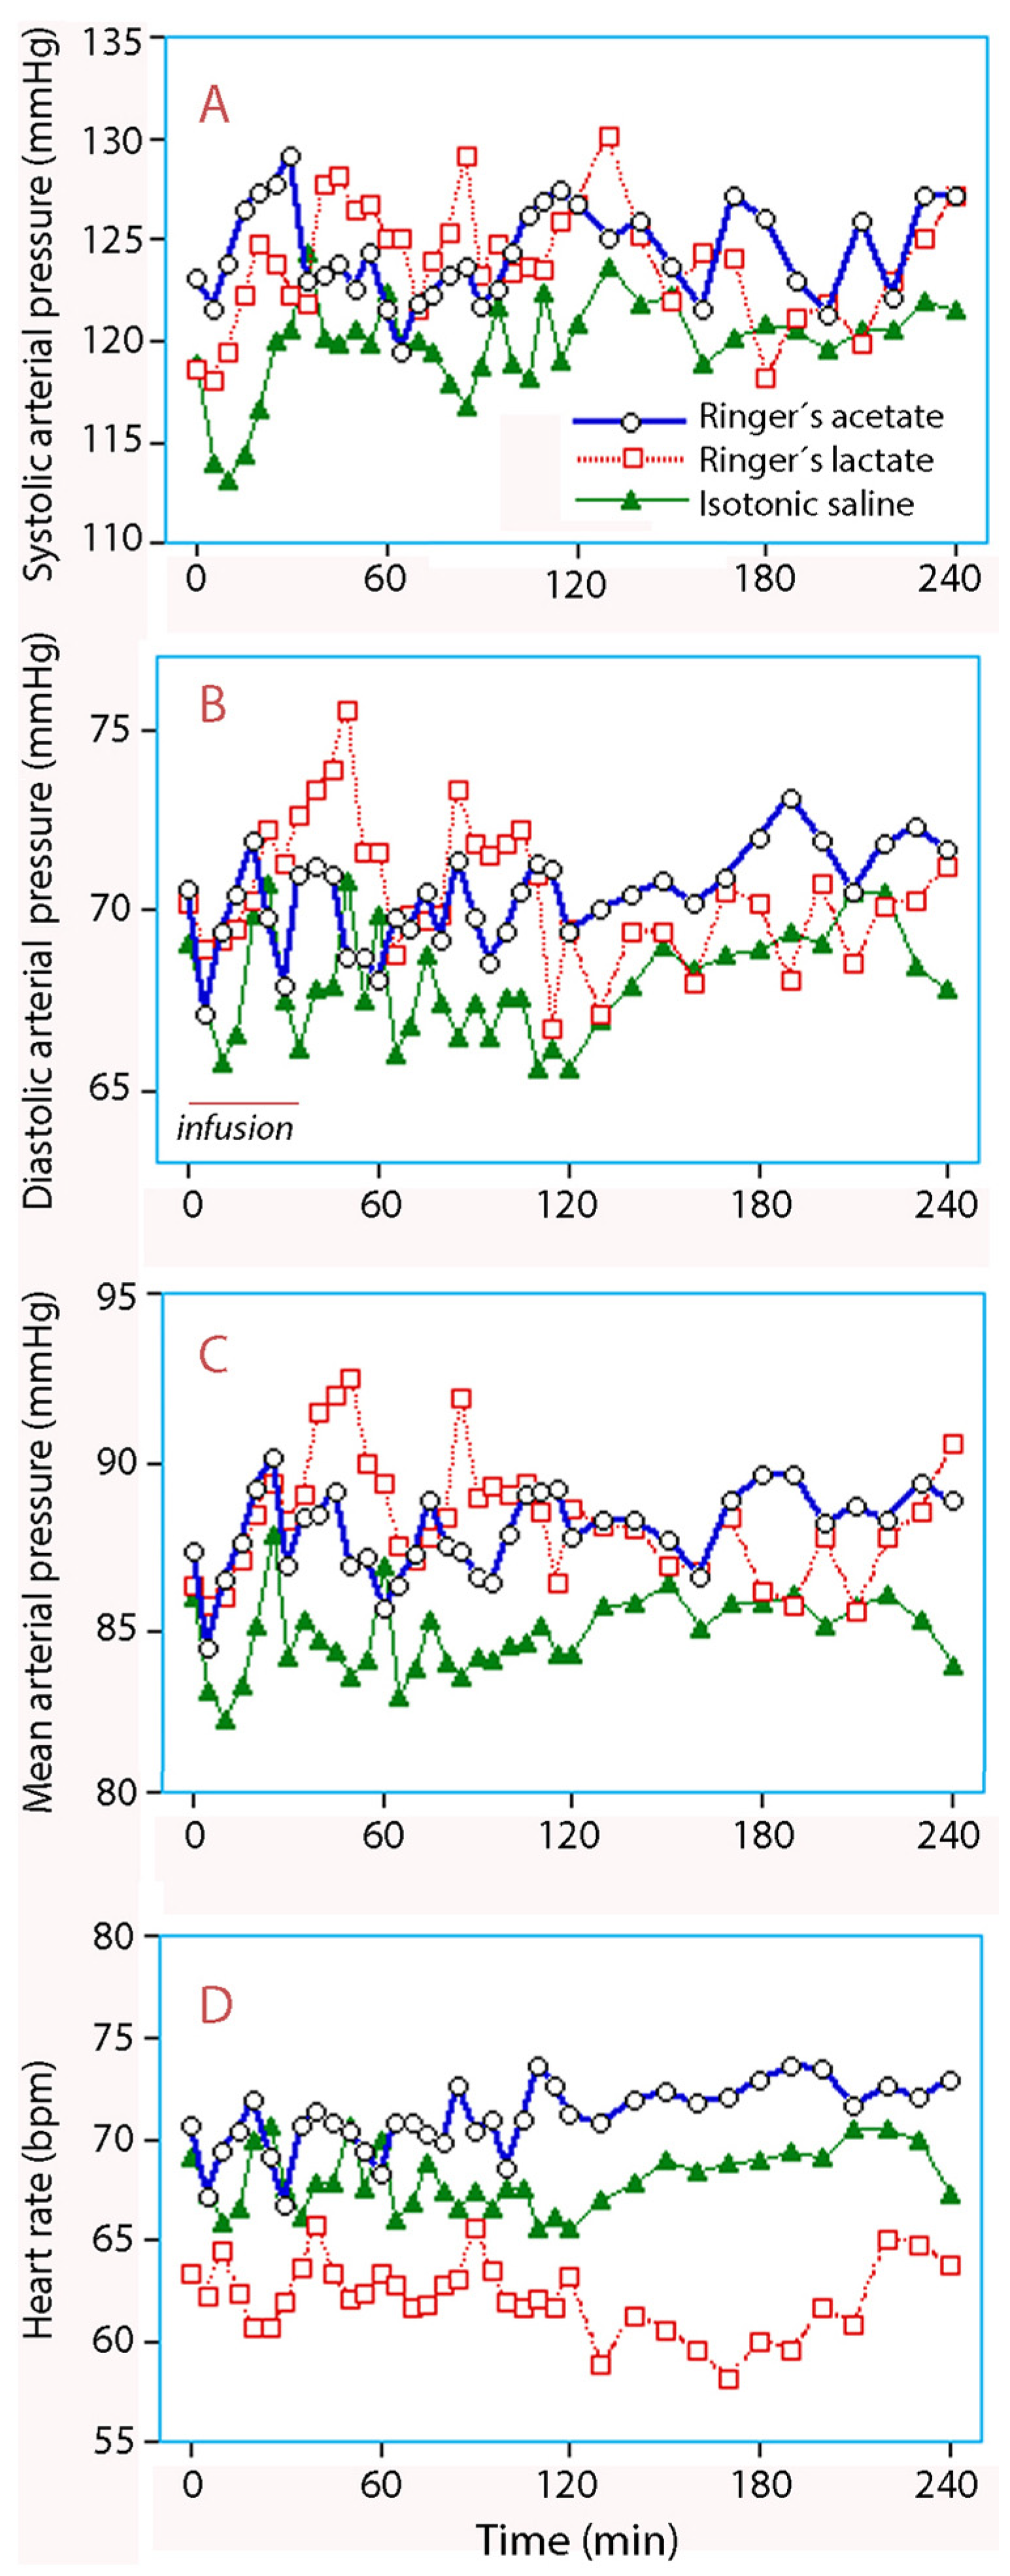
6]. The only significant change in response to fluid consisted of a transient reduction in the systolic pressure during the infusions of isotonic saline, which is probably due to the negative inotropic effect of chloride-induced acidosis (
Fig. 6). The diastolic pressure seemed to increase after Ringer's lactate use, but the change was not statistically significant.
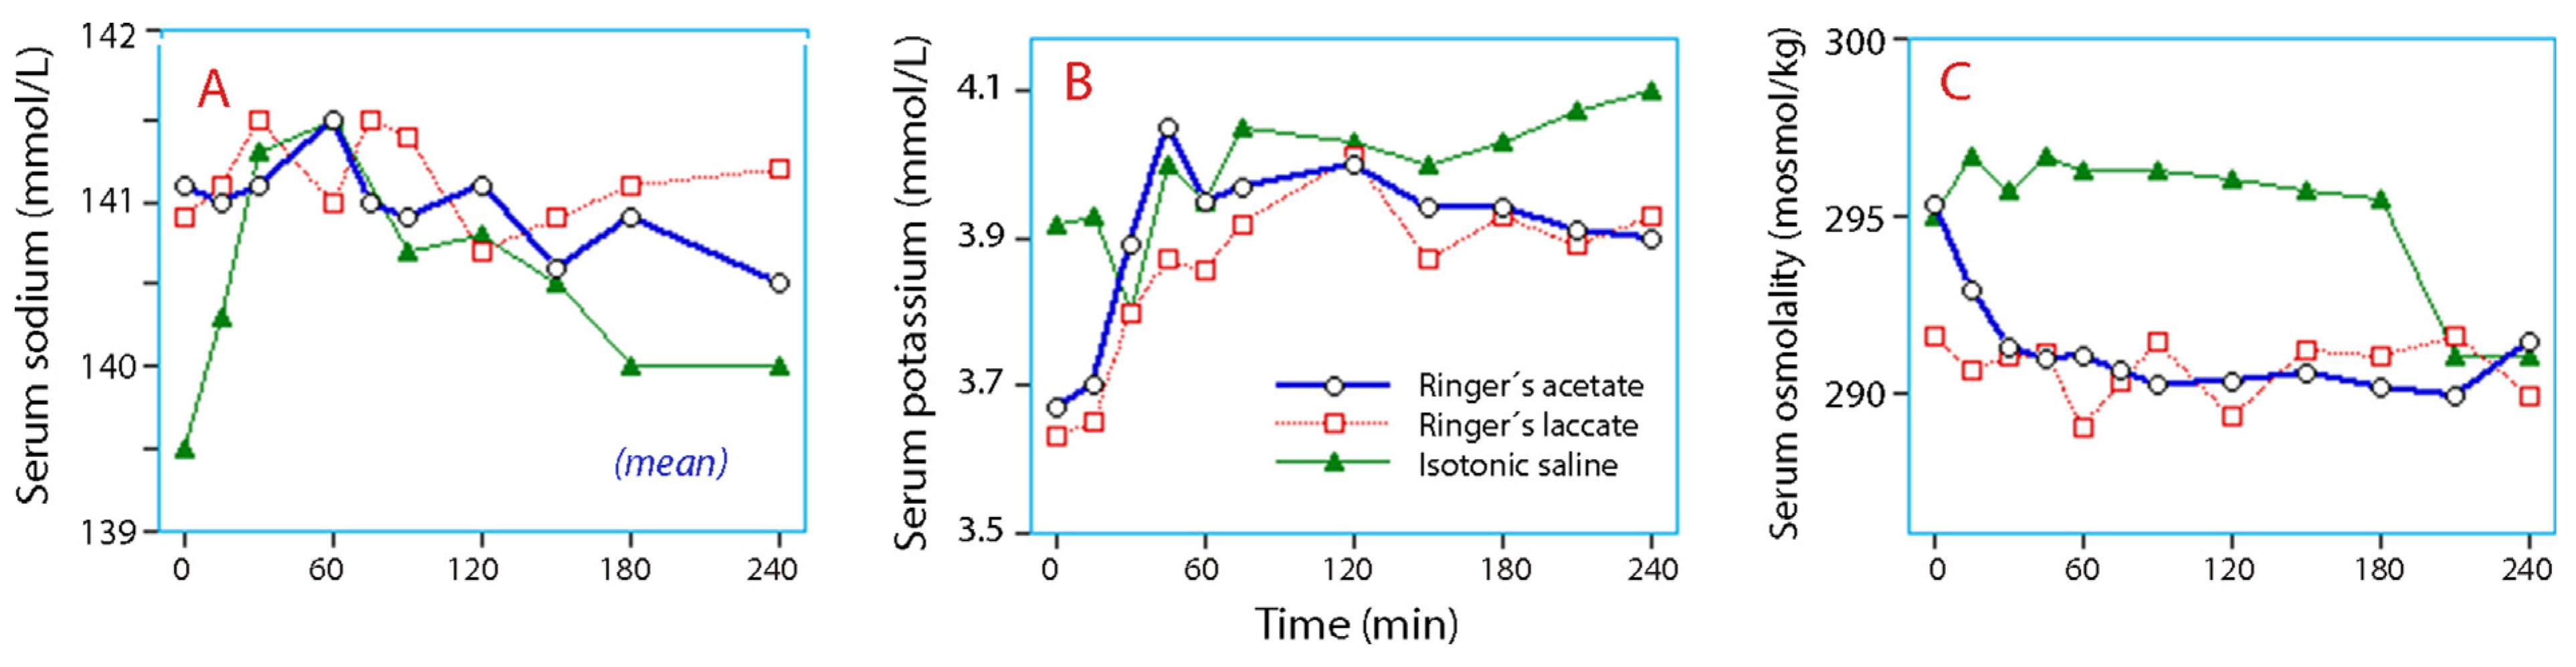
Variations in serum electrolytes and osmolality reflect the differences in ionic composition between the infusions and the extracellular fluid. An exception was that serum potassium did not decrease after infusion of isotonic saline, which confirms that saline is not a useful tool for decreasing serum potassium concentrations by dilution (
Fig. 7B). The limited changes in serum osmolality ensured that no major shift between the intra- and extracellular fluid spaces occurred.
The volume kinetic model was built up by first estimating the five fixed parameters in the structural (base) model (
Fig. 1A) which was then followed by sequential inclusion of the covariates that significantly reduced the in prediction error (cf.
Fig. 1B and C). In the base model, the distributions of fluid between body compartments are determined by the rate constants
k12,
k21,
k10, and
kb. These are inversely proportional to the half-life of the fluid volume added to the respective body fluid space, and are therefore independent of the infused fluid volume and body weight.
By contrast, the size of the two expanded body fluid spaces,
Vc and
Vt, serve as scaling factors between plasma dilution, which is the input function, and the volume expansion, which is the output.
Vc equals the plasma volume if the Hb molecules are, on average, evenly distributed in the blood volume during an experiment. In the present study, the kinetic analysis indicated an average volume of 3.8 L for
Vc. The size of
Vt is not obtained directly from the model, but an estimate based on the relationship
Vt =
Vc k12/
k21 yields 8.1 L. This equation is valid if fluid can pass freely to and from
Vt. The volume 8.1 L is less than the physiological size of the interstitial fluid space because
Vt only indicates parts that can be expanded by fluid [
2]. These expandable spaces vary according to body size [
4], but the body weights of the male volunteers who participated in the present experiments were too similar to challenge an influence on
Vc.
Simulations of the plasma volume expansion over time show a marked distribution effect of crystalloid fluid. A sharp peak is reached at the end of each infusion, which levels off over a period of 30 min. Hence, during and shortly after an infusion, the plasma volume expansion is much greater than that observed at 30 min postinfusion, and it then reaches 50% of the infused volume (
Fig. 4B). Both the magnitude and the timespan of the distribution effect are determined by
k12 and
k21. The reason why equilibration requires a relatively long time for completion is probably that the jelly-like interstitial fluid matrix retards the flow of fluid (but not of nutrients) to resist the gravitational redistribution of body water that, to some degree, affects the circulating blood. The apparent distribution effect of crystalloid fluid has been demonstrated many times, but awareness of the phenomenon is still limited among those who practice fluid therapy [
2]. After distribution is completed, further reduction in the volume expansion occurs by elimination, at a rate given by
k10 and
kb. Evaporation contributes slightly to
kb, while losses of Hb molecules and fluid by the sampling is corrected by other measures.
One limitation of the present study is that the experiments induced hypervolemia, as the volunteers were reasonably normovolemic when the infusions were initiated. The results are also based on only 30 experiments, although more than one thousand data points were analyzed. The reported kinetic data are all statistically significant, but a larger number of experiments is needed to confirm the present findings. The retrospective nature of the evaluation must also be considered to represent a drawback.


