Article

Identifying Network Biomarkers in Early Diagnosis of Hepatocellular Carcinoma via miRNA–Gene Interaction Network Analysis

1
School of Artificial Intelligence, Hangzhou Dianzi University, Hangzhou 310018, China
2
School of Physics and Key Laboratory of Molecular Biophysics of the Ministry of Education, Huazhong University of Science and Technology, Wuhan 430074, China
*
Author to whom correspondence should be addressed.
Curr. Issues Mol. Biol. 2023, 45(9), 7374-7387; https://doi.org/10.3390/cimb45090466
Submission received: 4 July 2023 / Revised: 26 August 2023 / Accepted: 7 September 2023 / Published: 10 September 2023
(This article belongs to the Special Issue Advances in Molecular Pathogenesis Regulation in Cancer)

Abstract

:
Background: Hepatocellular carcinoma (HCC) is a highly heterogeneous cancer at the histological level. Despite the emergence of new biological technology, advanced-stage HCC remains largely incurable. The prediction of a cancer biomarker is a key problem for targeted therapy in the disease. Methods: We performed a miRNA–gene integrated analysis to identify differentially expressed miRNAs (DEMs) and genes (DEGs) of HCC. The DEM–DEG interaction network was constructed and analyzed. Gene ontology enrichment and survival analyses were also performed in this study. Results: By the analysis of healthy and tumor samples, we found that 94 DEGs and 25 DEMs were significantly differentially expressed in different datasets. Gene ontology enrichment analysis showed that these 94 DEGs were significantly enriched in the term “Liver” with a statistical p-value of 1.71 × 10⁻²⁶. Function enrichment analysis indicated that these genes were significantly overrepresented in the term “monocarboxylic acid metabolic process” with a p-value = 2.94 × 10⁻¹⁸. Two sets (fourteen genes and five miRNAs) were screened by a miRNA–gene integrated analysis of their interaction network. The statistical analysis of these molecules showed that five genes (CLEC4G, GLS2, H2AFZ, STMN1, TUBA1B) and two miRNAs (hsa-miR-326 and has-miR-331-5p) have significant effects on the survival prognosis of patients. Conclusion: We believe that our study could provide critical clinical biomarkers for the targeted therapy of HCC.

1. Introduction

Hepatocellular carcinoma (HCC) is a high-mortality disease with no effective curable treatments and is the major cause of cancer death worldwide [1]. This disease is also known as the fifth most common tumor worldwide. HCC is a primary malignancy of the liver and occurs predominantly in patients with underlying chronic liver disease. Some cases of HCC are associated with viruses, such as hepatitis B virus and hepatitis C virus [2]. Surgery and liver transplantation are usually thought to be potentially curative treatments for patients with early hepatocellular carcinoma. Currently, high-throughput sequencing technology has been developed to identify gene expression profiling and distinct genetic alterations in HCC patients [3]. The progression of this disease appears to be closely related to gene mutations and oncogenic pathways. The increased understanding of the heterogeneous molecular pathogenesis of HCC has led to significant developments in novel targeted therapies.
Biomarkers are essential for optimized clinical decision-making by providing prognostic information and predicting response to specific therapies. Understanding the prognostic biomarkers is central to quality oncology care. With biomarkers, the abnormal biological processes and disease states of each patient can be accurately predicted. Alpha-fetoprotein (AFP) is one of the commonly used markers for early diagnosis of HCC [4]. AFP is a protein that the liver makes when its cells are growing and dividing to make new cells. Recent advancements in genomics have ushered in a new era of precision medicine [5]. Novel attempts have led to the development of a growing list of corresponding biomarkers in different types of cancers, such as lung cancer [6], cholangiocarcinoma [7] and brain tumor glioma [8]. Therefore, identifying specific biomarkers in early stage has great clinical significance in the treatment of HCC.
In the field of molecular biology, miRNA in regulating cancer pathogenesis has been a major achievement over the past decade [9]. This type of RNA comprises nearly 5% of transcriptome and regulates approximately 25% of genes in humans [10]. The miRNA can inversely modulate gene expression via directly inducing messenger RNA degradation by base pairing with complementary sites in the 3′-untranslated regions. Scientific evidence indicates that specific miRNAs are associated with the pathological features of HCC, such as hsa-miR-766 and hsa-miR-203. The hsa-miR-766 promotes cancer progression of HCC cells by targeting NR3C2 in vivo and has been reported to be an effective biomarker for liver cancer [11]. The hsa-miR-203 serves as a tumor suppressor in many types of cancer including esophageal cancers, breast cancer and hepatocellular carcinoma. This miRNA was reported to play an important role in the progression and carcinogenesis of HCC by targeting with the MAPK signaling pathway [12]. However, most of these studies only focus on the miRNA expression of the samples but do not take the miRNA–gene interaction into consideration; thus, a miRNA–gene integrated analysis was applied to identify novel biomarkers in this study.
Here, we carried out a large, comprehensive multiomic study for the identification of miRNAs associated with genes in HCC. The expression profiles of miRNAs were elucidated from several independent cohorts of HCC cases and noncancer controls. Furthermore, we report a miRNA–gene integrated model based on the multiomic expression level of HCC and identify several useful molecules in this study.

2. Materials and Methods

2.1. Screening Differentially Expressed Genes and miRNAs

To find suitable datasets for the analysis, we searched the keywords “liver cancer” in the Gene Expression Omnibus (GEO) database [13] in April 2022. By filtering the results with “Homo sapiens” in organism and “Expression profiling by array” in study type, we obtained 871 datasets. We then checked these 871 datasets one by one according to the following criteria: (a) the dataset was published in the past two years; (b) the dataset must include enough effective samples (total number of samples ≥ 10, normal samples ≥ 5 and HCC samples ≥ 5; (c) the dataset must include a sufficient number of sequenced miRNAs (≥500) or genes (≥5000).
Based on the above-mentioned criteria, three datasets (GSE101685, GSE176271, GSE164760) were obtained for gene expression analysis. In order to analyze the differences between normal and HCC samples, we used GEO2R tool to analyze the three datasets (GSE101685, GSE176271, GSE164760) and obtained the differentially expressed genes (DEGs). The criterion for DEGs was set as a statistical p-value ≤ 0.05. We then compared the difference in the DEGs among these three datasets and drew a Venn diagram to show our results.
Similarly, two datasets containing miRNA expression (GSE176288, GSE158523) were obtained for miRNA expression analysis. GSE176288 contains 32 available samples, while GSE158523 contains 10 available samples. The criterion for differentially expressed miRNAs (DEMs) was set as a statistical p-value ≤ 0.05. The common DEM section of GSE176288 and GSE158523 was then screened. The patient flowchart is shown in Figure 1.

2.2. Functional Enrichment Analysis

Functional enrichment analysis could provide significant biological insights into the characteristics of studied genes. Metascape is a web-based tool providing a comprehensive gene annotation and analysis resource for scientists [14]. DAVID provides a comprehensive set of tools to identify enriched gene ontology terms and biological processes of studied genes [15]. By Metascape and DAVID analyses, we obtained the function enrichment results of DEGs.

2.3. miRNA–Gene Integrated Analysis

The miRWalk is a common tool to predict miRNA–target interaction by an effective machine learning algorithm [16]. For target prediction, the lower binding value indicated the higher binding possibility of the miRNA and gene. We defined the binding values above −15 kcal/mol as high energy, the binding values below −25 kcal/mol as low energy and the binding values between −25 and −15 kcal/mol as medium energy. This method can effectively classify the target prediction level of miRNA. To enhance our prediction results, the miRTarbase [17] database was also applied to predict the target genes of miRNAs. By using miRWalk and miRTarbase, the connection between DEGs and DEMs was built. The metabolic pathways of miRNA–target genes were analyzed using the WikiPathways database [18] and miRPathDB tool [19].

2.4. Construct miRNA–Gene Integrated Network

To strengthen the completeness of the network, the DEG–DEG interaction network was also obtained from STRING database [20]. The two interaction networks (DEG–DEG and DEM–DEG) were then combined to construct a full miRNA–gene network. The Cytoscape software is one of the most common network biology analysis tools [21]. This tool was applied to analyze the network topology and node attributes. The interaction network was considered as a graph composed of the edges of miRNA–gene and gene–gene. The edge betweenness centrality is defined as the number of the shortest paths that go through an edge in a graph [22]. The edge betweenness value is a commonly used index to represent the centrality of edges and is often used in the analysis of biological networks [23]. Based on this value, some hub miRNAs and genes of the network were screened for further analysis.

2.5. Survival Analysis of Hub Nodes

Survival analysis is a branch of statistics to study the expected duration and is widely used in cancer research. Survival analysis is especially helpful in analyzing the association of a biomarker and disease. The Cancer Genome Atlas (TCGA) database provides publicly available clinical and high-throughput genomic data for various types of cancers. GEPIA server was utilized to analyze our selected genes in TCGA database [24]. KMplot was applied to conduct the survival analysis of these genes [25] with statistics cutoff p-value ≤ 0.05. The gene satisfying this criterion was then retained for further discussion.

3. Results

3.1. Screening Differentially Expressed Genes

We screened the DEGs in each dataset using as the criterion p-value ≤ 0.05 by the GEO2R tool. GEO2R is a tool that performs differential expression testing on most microarray datasets in NCBI. A set of 1838 DEGs was identified in the dataset GSE101685, while a group of 1559 DEGs was obtained in the dataset GSE176271. In addition, 575 genes were differentially expressed in the dataset GSE164760, which is relatively fewer than in the other two datasets. A set of 94 DEGs was present in all three datasets (Figure 2A) and denoted as core DEGs (cDEGs). Most of these cDEGs showed an extremely low p-value (≤0.001) when compared to the genes in normal and cancer patients (Table S1).

3.2. Function Enrichment

We performed a function enrichment analysis to investigate these 94 cDEGs by the Metascape and DAVID databases. By a tissue-specific analysis of these DEGs, we found that most of these genes could be enriched in different types of tissues. The largest proportion (57.45%) of DEGs was significantly enriched in the keyword “Liver”, with a significant p-value = 1.71 × 10⁻²⁶ (Table 1), which indicated that our identified DEGs are mostly liver-specific genes. The term “monocarboxylic acid metabolic process” (GO:0032787) was significantly overrepresented in our selected DEGs with a p-value = 1 × 10⁻¹⁸ in biological process, which indicated that some of these genes were involved in energy metabolism. The monocarboxylic acid metabolic process is a type of nutrient homeostasis process; thus, these DEGs may reflect the rapid conversion of the liver function in association with the response to a variety of external environments [26].
Besides, the term “fatty acid metabolic process” (GO:0006631) was significantly enriched in our DEGs with a p-value = 2.82 × 10⁻¹¹, which suggested that these genes may contribute to the growth of cancer cells. It is well known that the liver is the central organ for fatty acid metabolism. Fatty acids accrue in liver by hepatocellular uptake from the plasma and by de novo biosynthesis. Fatty acids are eliminated by oxidation within the cell or by secretion into the plasma within low-density lipoproteins [27]. These enrichment results indicated that our identified DEGs were extremely related to liver.

3.3. Identification of cDEM

Two HCC datasets (GSE176288, GSE158523) were found in the NCBI database containing miRNA expression in normal and HCC samples. The results showed that 324 miRNAs in GSE176288 and 107 miRNAs in GSE158523 were significantly differentially expressed. Using the Venn diagram, 25 differentially expressed miRNAs (DEMs) were found shared in these two datasets and denoted as core DEMs (cDEMs) (Figure 3A). Because these miRNA samples were taken from different tissues, this resulted in relatively inconsistent data between them. In addition, currently, there are approximately 2000 known miRNAs in human. The number is significantly lower than the gene number (about 23,000) in human. Therefore, the number of differentially expressed miRNAs was much lower than the number of differentially expressed genes (Table S2).

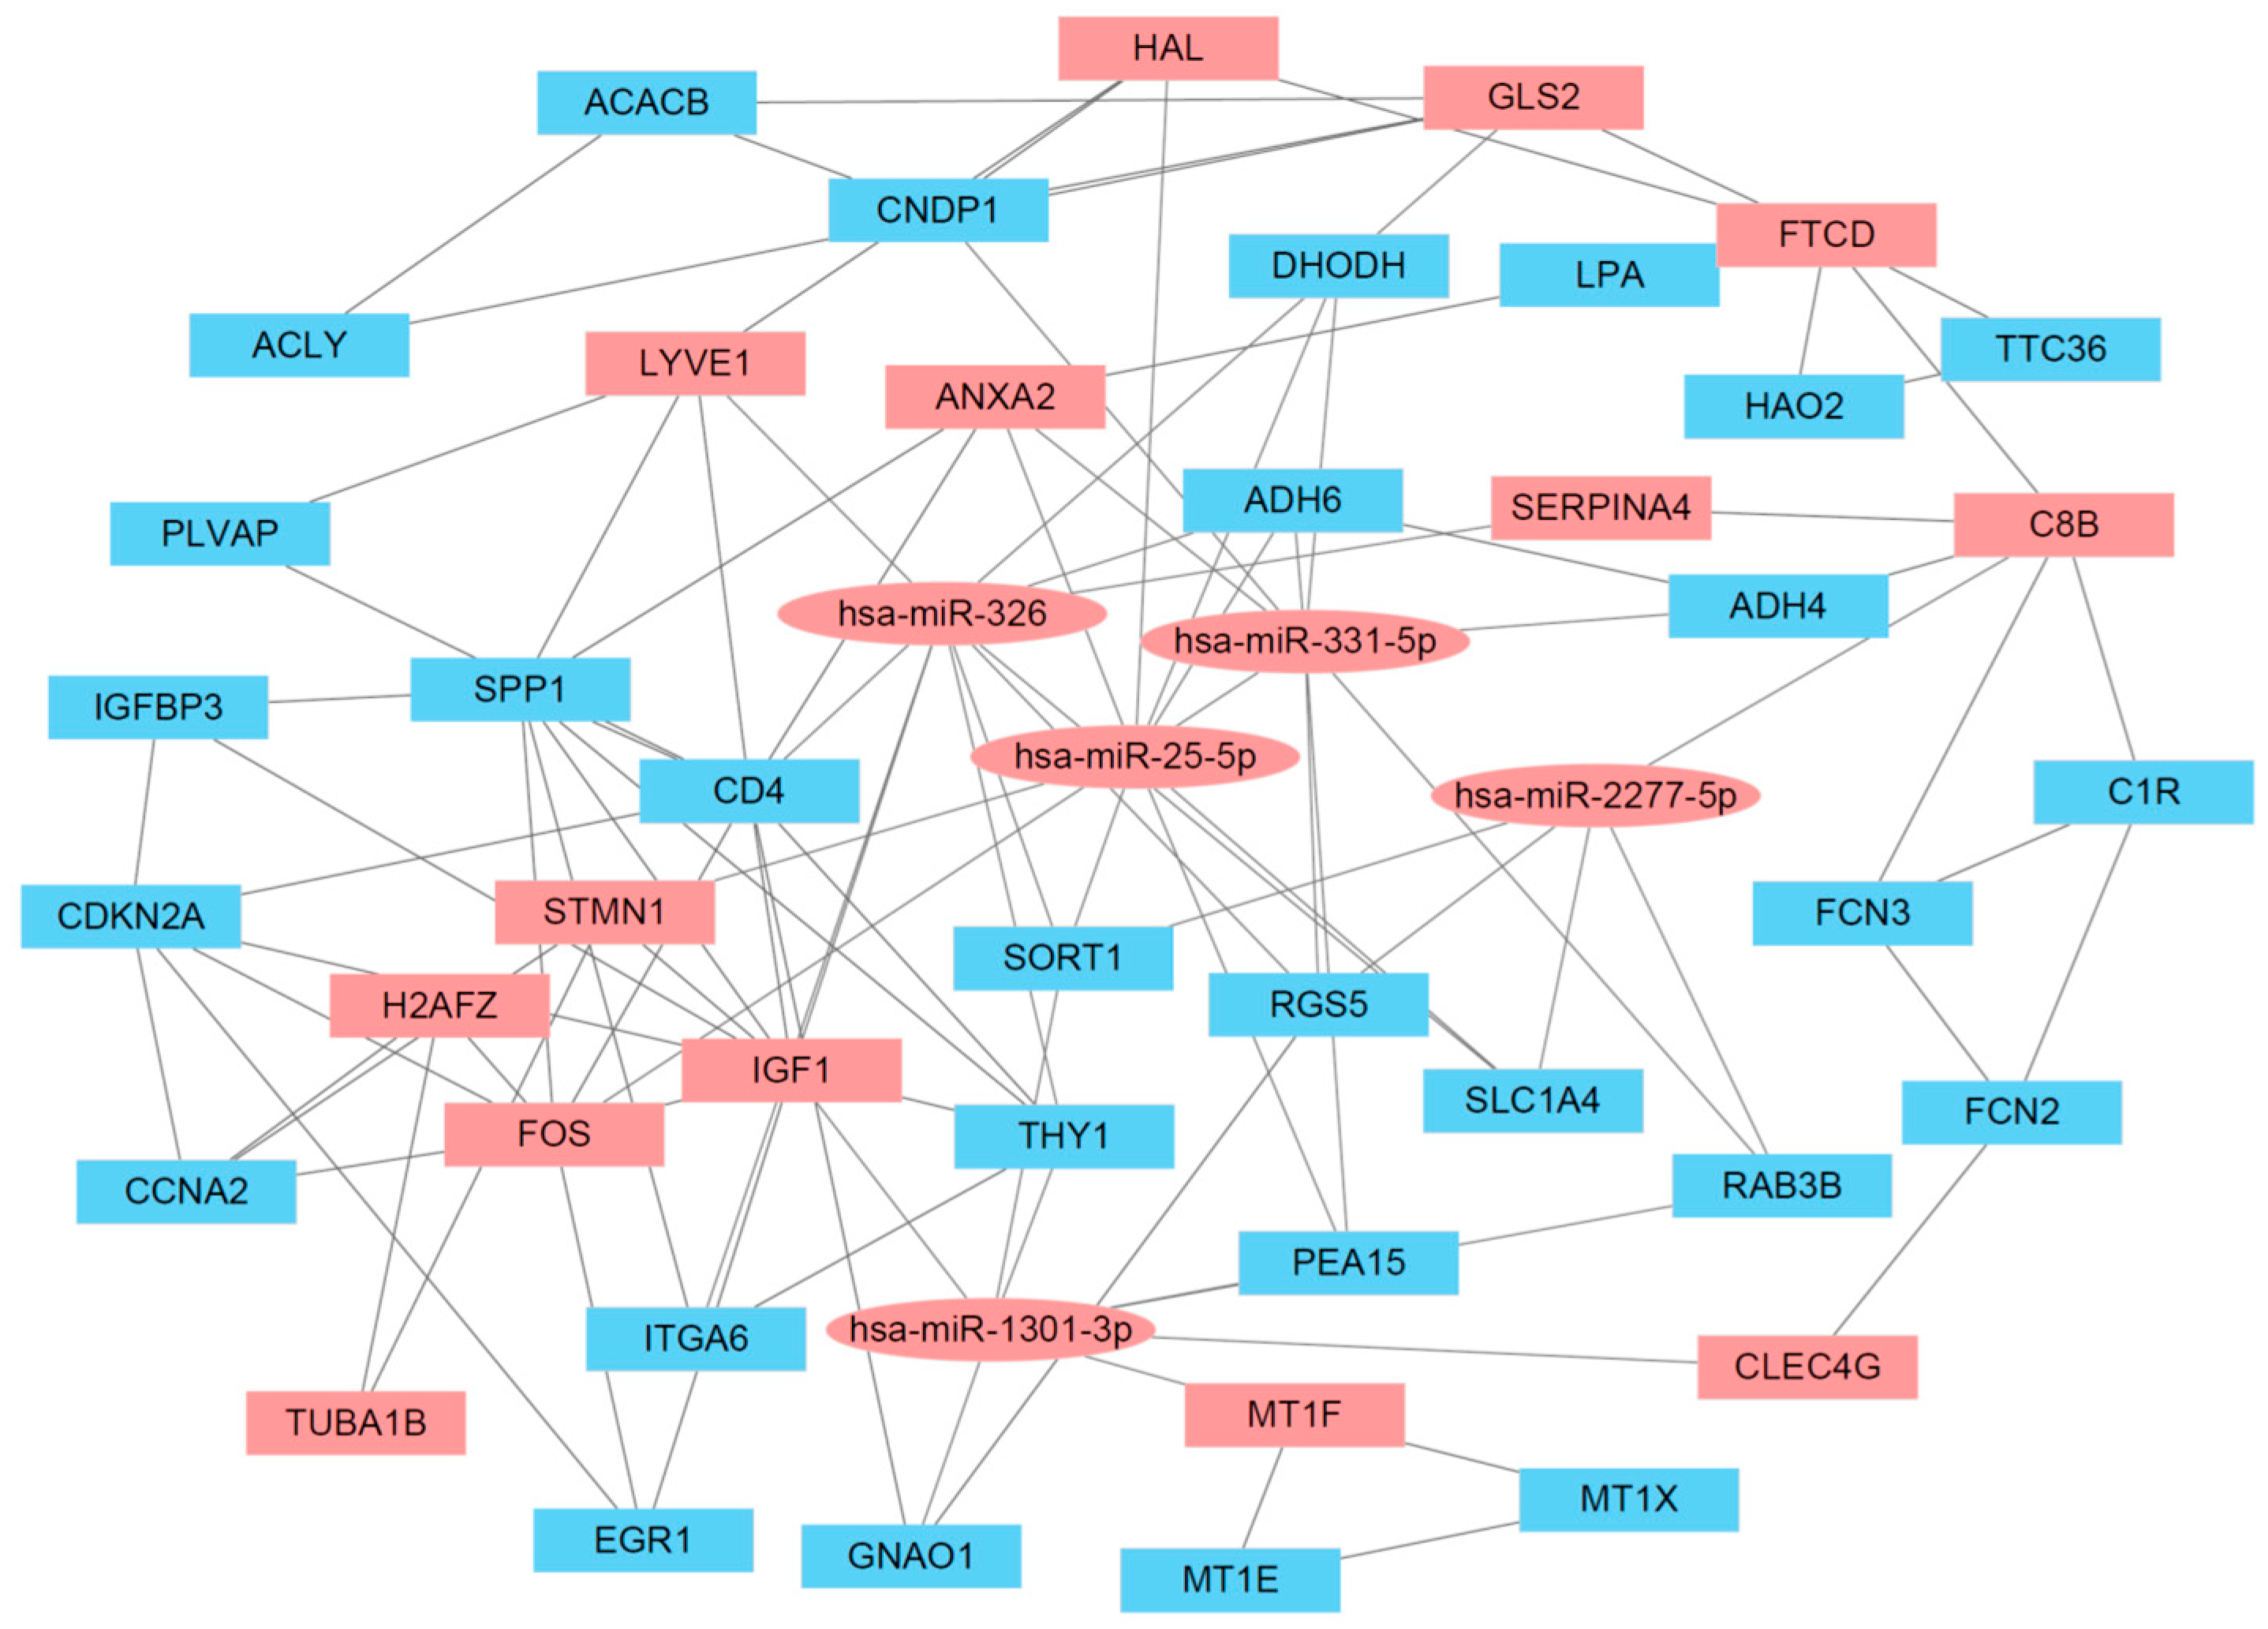
3.4. cDEG–cDEM Interaction Network

Based on the miRWalk, we built an interaction between the cDEGs and cDEMs. A set of 20 miRNAs (cDEMs) was found to interact with cDEGs. These 20 miRNAs were categorized into 19 different families. Only miR-106 family was observed to have more than one member (hsa-miR-106a-5p, hsa-miR-106b-5p) (Table 2). Most of the interactions were predicted with very low binding energy, for example, hsa-miR-2277-5p interacted with CYP39A1 by a critical low binding value −29.3 kcal/mol. CYP39A1 belongs to the member of the cytochrome P450 family, which catalyzes many reactions involved in drug metabolism. This gene is a liver-specific gene with a female-preferential expression and strongly suppressed HCC development [28]. Our findings suggest that these genes could serve as novel targets for the biological therapy for and diagnosis of HCC.

3.5. Target Enrichment Analysis of cDEM

The targeted genes of miRNAs (cDEMs) were enriched by the WikiPathways database and miRPathDB tool. The targets of nine miRNAs (hsa-miR-451a, hsa-miR-106a-5p, hsa-miR-106b-5p, hsa-miR-17-5p, hsa-miR-15b-5p, has-miR-18a-5p, has-miR-376c-3p, has-miR-326, hsa-miR-381-3p) were found to be enriched in the pathway of “Hepatitis C and Hepatocellular Carcinoma” (Table 3). A total of 30 genes were identified as putative targets of hsa-miR-381-3p with a p-value = 0.049. In addition, five genes were identified as hsa-miR-451a targets, with an extremely low p-value = 2.3 × 10⁻⁶. In a previous study, hsa-miR-451a was reported to inhibit the proliferation and migration of hepatocellular carcinoma cells by targeting gene YWHAZ [29]. The YWHAZ protein plays an important role in tumor progression and is involved in many signal transduction pathways in liver cancer [30]. We suggest that other miRNAs in this table may also affect the proliferation of HCC, which needs further investigation in the future.

3.6. Network Analysis of the cDEG–cDEM Network

The cDEG–cDEM network was built and visualized by Cytoscape. Previous studies indicated that betweenness centrality is a robust attribute in the identification of target genes in the molecule–molecule network [31]. The betweenness centrality score is calculated based on the shortest path between a node and other nodes in the network. Based on the betweenness centrality score of the cDEG–cDEM network, we screened out fourteen key genes (ANXA2, C8B, CLEC4G, FOS, FTCD, GLS2, H2AFZ, HAL, IGF1, LYVE1, MT1F, STERPINA4, STMN1, TUBA1B) and five key miRNAs (hsa-miR-1301-3p, hsa-miR-25-5p, hsa-miR-2277-5p, hsa-miR-326, hsa-miR-331-5p) (Table 4). These genes and miRNAs are highlighted with red blocks in Figure 4. The edge of FOS/H2AFZ interaction showed a betweenness score of 512.84, while the edge of hsa-miR-1301-3p/MT1F interaction showed a betweenness score of 387.96. The edge with high betweenness score indicated the most influential molecules in the network involved in spreading the disease.

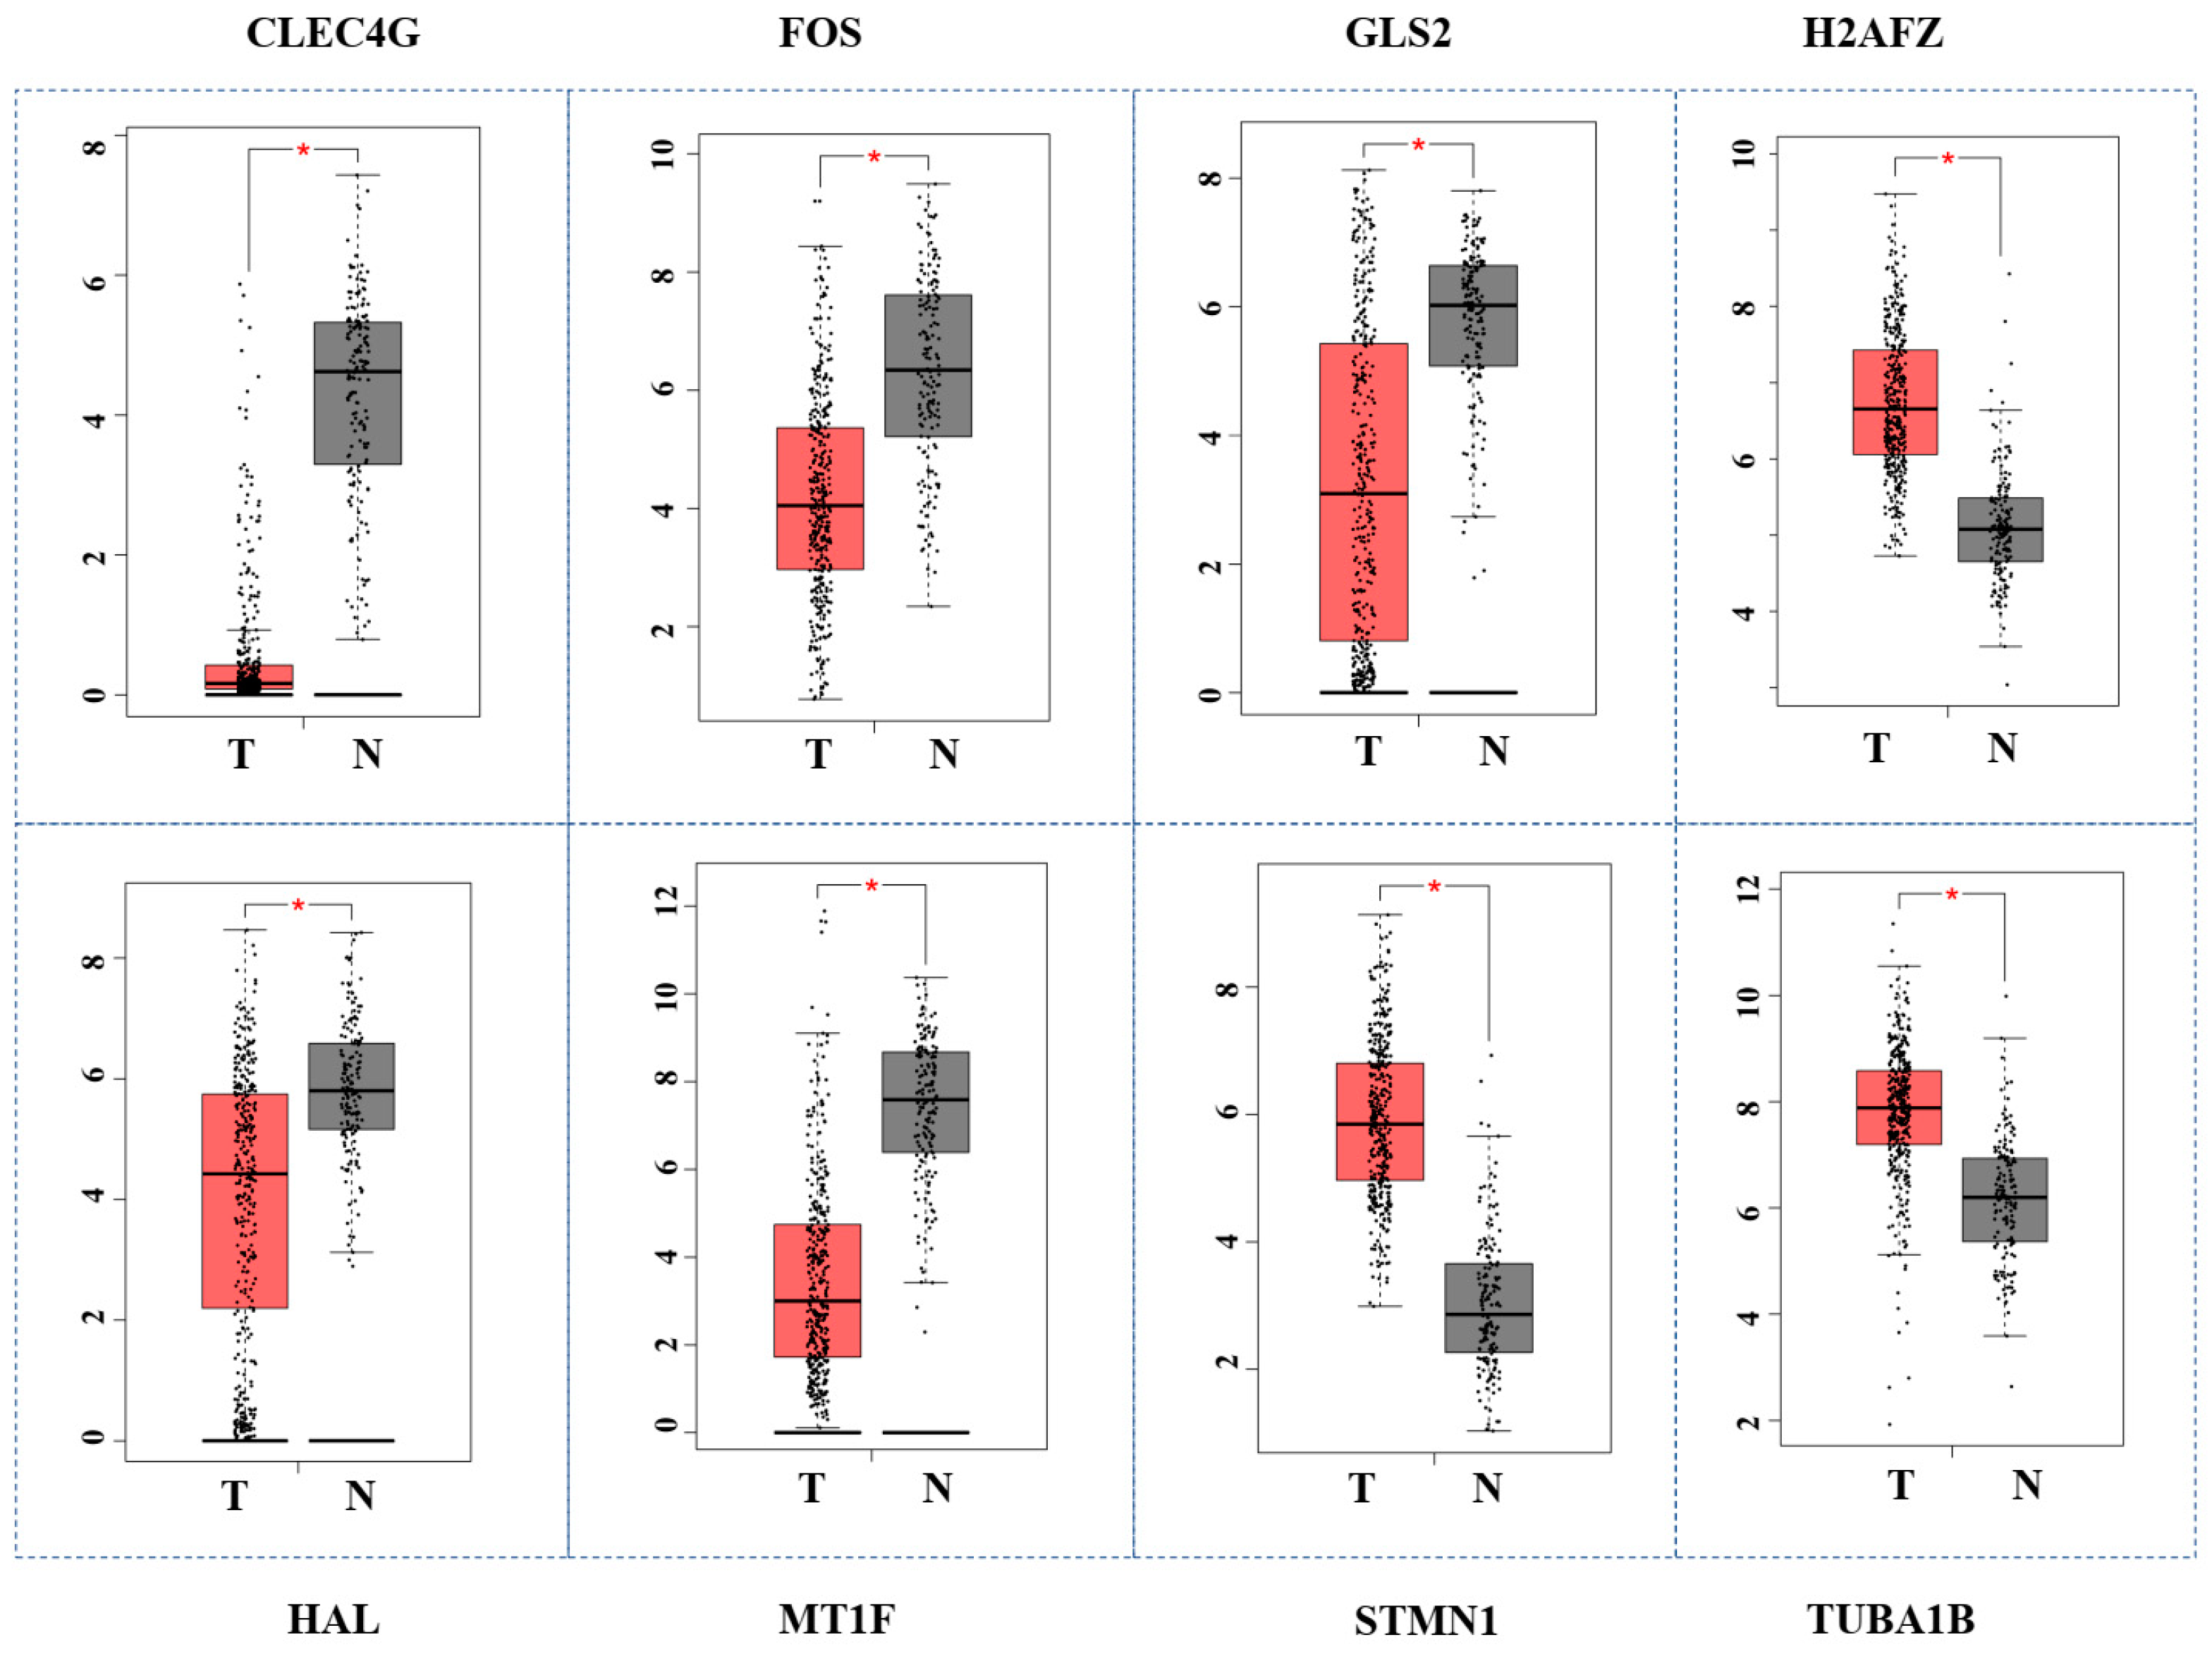
3.7. Validation of Hub Genes by GEPIA

In the above paragraph, we screened out 14 key genes with high betweenness scores in the miRNA–gene interaction network. To verify the reliability of these fourteen genes, we applied the GEPIA tool to test their performance in the TCGA database. The results indicated that eight genes (CLEC4G, FOS, GLS2, H2AFZ, HAL, MT1F, STMN1, TUBA1B) showed significant differential expression between normal and HCC samples in the TCGA database with a p-value ≤ 0.05 (Figure 5). Four genes (CLEC4G, MT1F, STMN1, H2AFZ) obviously diverged between HCC and normal tissue. A dot plot of the expression levels of these genes in all cancer types was drawn. The results showed that the expression levels of CLEC4G in liver cancer were much higher than the expression levels in other cancer types (Figure 6). The CLEC4G gene encodes a glycan-binding receptor, a member of the C-type lectin family, which plays an important role in the immune response. C-type lectin proteins are pattern recognition receptors located on the immune cells that are active in the cell signaling pathways. CLEC4 is associated with the infiltration of various immune cells and is crucial for the development of HCC. The low expression level of CLEC4G may signify the low activity of immune cells in HCC patients. This result indicated that CLEC4G could serve as a specific biomarker for the prediction of HCC progression.

3.8. Survival Analysis of Hub Genes Using KMplot

Survival analysis could provide reliable scientific results in clinical outcomes with a high level of confidence, and this process was conducted by the KMplot. We found that nine genes (ANXA2, CLEC4G, FTCD, GLS2, H2AFZ, IGF1, STERPINA4, STMN1, TUBA1B) showed a significant impact on the poor survival prognosis of HCC patients with a p-value ≤ 0.05. Among them, five genes (CLEC4G, GLS2, H2AFZ, STMN1, TUBA1B) had specific expression in HCC and a significant effect on patient survival (Figure 7). These five genes could be considered critical molecules in the development of HCC. In addition, two miRNAs (has-miR-326 and has-miR-331-5p) have a significant impact on the survival prognosis of this cancer (Figure 8). We believe these miRNAs can also be used as reliable biomarkers in the early detection of hepatocellular carcinoma.

4. Discussion

Hepatocellular carcinoma (HCC) is a leading cause of cancer-related deaths. Because of difficulties in early diagnosis and lack of targeted drugs, the survival rate of HCC is extremely low. Due to the genetic diversity and personal discrepancies, the existence of therapy has greatly limited the progress in early detection and molecular classification of HCC. Based on the progression of molecular biology, a bioinformatic analysis brings a new dimension to targeted treatment and the possibility of pre-clinical screening of tumors. Alternative biomarkers to treat this disease are urgently needed.
MicroRNAs have been regarded as potential epigenetic mechanisms partaking in the pathogenesis of HCC. The dysregulation of miRNAs has been related to poor outcomes in patients with this type of cancer [32]. In recent years, novel approaches to cancer treatment have been based on microRNAs, small noncoding RNA molecules that play a crucial role in cancer progression by regulating gene expression. It has been reported that the dysregulation of miRNA was found in the progression of HCC, such as hsa-miR-155 and hsa-miR-27a-3p. The high expression level of hsa-miR-155 has been related to the microvascular invasion of HCC patients. The expression of hsa-miR-155 has been elevated in tumor tissues from HCC patients with liver transplantation [33]. The hsa-miR-27a-3p overexpressed in mesenchymal stem cells could suppress golgi membrane proteins to inhibit the progression of this disease [34].
However, previous works on identifying biomarkers do not take the miRNA–gene interaction network into consideration. Network biology offers a powerful means to identify more robust biomarkers. The network-based approach exploits observations that genes with similar phenotypic roles tend to co-localize in a specific region of a protein–protein interaction network. Based on this feature, many network biomarkers could be predicted. For example, Kong et al. applied a machine learning approach to predict network biomarkers related to immune checkpoint inhibitors in patients [35]. Therefore, constructing a network to analyze biomarkers becomes an effective method for studying complex diseases.
In this study, we established a miRNA–gene interaction network for biomarker identification in HCC. Five datasets (GSE176288, GSE158523, GSE101685, GSE176271, GSE164760) were obtained from the NCBI database. Two groups (25 cDEMs and 94 cDEGs) were identified between HCC and adjacent normal tissues in the corresponding datasets, respectively. The network of cDEM–cDEG was constructed based on their interaction predicted by miRWalk2.0. By the topological analysis of the miRNA–gene interaction network, five miRNAs (hsa-miR-1301-3p, hsa-miR-25-5p, hsa-miR-2277-5p, hsa-miR-326, hsa-miR-331-5p) and fourteen genes (ANXA2, C8B, CLEC4G, FOS, FTCD, GLS2, H2AFZ, HAL, IGF1, LYVE1, MT1F, STERPINA4, STMN1, TUBA1B) were found with the highest betweenness scores in the interaction network, meaning that they are located in the center of the network. These genes and miRNAs could possibly serve as critical biological molecules in the cell differentiation and migration of the disease. Through the gene expression analysis by the GEPIA and survival analysis by the KMplot, two miRNAs (hsa-miR-326 and has-miR-331-5p) and five genes (CLEC4G, GLS2, H2AFZ, STMN1, TUBA1B) were further picked out. These seven molecules could be used as novel biomarkers for early diagnosis in HCC patients. The following are some examples of detailed descriptions.
The hsa-miR-326 has been previously reported to participate in chemotherapy resistance and embryonic development in many cancer types. The low expression of has-miR-326 is dramatically related to unfavorable prognosis and metastasis in HCC. A similar phenomenon was also discovered for hsa-miR-331-5p. Researchers found that the downregulation of hsa-miR-331-5p can lead to anticancer drug resistance to doxorubicin by targeting p-glycoprotein [36]. We may predict the prognosis of HCC patients by detecting the expression level of these miRNA biomarkers and artificially inhibiting cancer growth by their mimics.
The CLEC4G gene, which belongs to C-type lectin receptors, showed regulatory roles on immune cell to affect cell activity. Recent studies have indicated that the expression of CLEC4G affects the development and microenvironment of tumors [37]. GLS2 exhibits a tumor-suppressive function by inhibiting Rac1 activity, which in turn inhibits the migration, invasion and metastasis of malignancy cells. A previous study showed that GLS2 is a key glutaminolysis synthase implicated in activities consistent with HCC suppression [38]. H2AFZ, which belongs to the H2A family, regulated DNA replication and cell cycle signaling by several cancer-related transcription factors in this disease [39]. H2AFZ may restrain liver cancer cell proliferation and cause many alternative splicing events. This study has demonstrated that STMN1 upregulation promotes the occurrence and development of liver cancer via activating a signaling pathway [37]. It is also reported that overexpressing STMN1 was closely associated with vascular invasion, drug resistance and shorter survival time in cancer patients in vivo [40]. TUBA1B, a type of tubulin protein, was reported to associate with the formation of the cytoskeleton and immune cell infiltration [41]. Thus, based on the above analysis, we have high confidence that our identified miRNAs and genes can be used as novel biomarkers for the understanding and diagnosis of HCC.

5. Conclusions

We applied a robust pipeline of the miRNA–gene interaction network analysis to investigate the molecule expression in HCC samples. Through the topological analysis of the miRNA–gene interaction network, we screened five genes (CLEC4G, GLS2, H2AFZ, STMN1, TUBA1B) and two miRNAs (hsa-miR-326 and has-miR-331-5p) according to their network betweenness scores. These molecules could be used as novel biomarkers for the diagnosis and survival prognosis of hepatocellular carcinoma patients.

Supplementary Materials

The following supporting information can be downloaded at https://www.mdpi.com/article/10.3390/cimb45090466/s1. Table S1: Significant DEGs in three datasets (GSE101685, GSE176271, GSE164760); Table S2: Significant DEMs in GSE176288 and GSE158523; Table S3: Full table of DEG–DEM interaction prediction; Table S4: Full table of target enrichment analysis. Table S5: Full table of edge betweenness of the interaction network.

Author Contributions

Conceptualization: Z.Y. and X.Z.; methodology, formal analysis, investigation, data curation, writing—original draft preparation, visualization: Y.Q., Y.W. (Yijing Wang), X.C. and Y.W. (Yuerong Wang); writing—review and editing—and supervision: Z.Y. All authors have read and agreed to the published version of the manuscript.

Funding

This research was funded by Zhejiang Provincial Natural Science Foundation (grant number LQ22C050003) and the National Natural Science Foundation of China (grant number 61903107).

Institutional Review Board Statement

Not applicable.

Informed Consent Statement

Not applicable.

Data Availability Statement

The datasets that were created during this study is publicly available in the GEO database (https://www.ncbi.nlm.nih.gov/geo) (accessed on 30 April 2022) with the accession numbers (GSE101685, GSE176271, GSE164760, GSE176288, GSE158523).

Conflicts of Interest

The authors declare no conflict of interest.

References

  1. Llovet, J.M.; Kelley, R.K.; Villanueva, A.; Singal, A.G.; Pikarsky, E.; Roayaie, S.; Lencioni, R.; Koike, K.; Zucman-Rossi, J.; Finn, R.S. Hepatocellular carcinoma. Nat. Rev. Dis. Primers 2021, 7, 6. [Google Scholar] [CrossRef]
  2. Wangensteen, K.J.; Chang, K.M. Multiple Roles for Hepatitis B and C Viruses and the Host in the Development of Hepatocellular Carcinoma. Hepatology 2021, 73 (Suppl. 1), 27–37. [Google Scholar] [CrossRef] [PubMed]
  3. Calderaro, J.; Ziol, M.; Paradis, V.; Zucman-Rossi, J. Molecular and histological correlations in liver cancer. J. Hepatol. 2019, 71, 616–630. [Google Scholar] [CrossRef] [PubMed]
  4. Galle, P.R.; Foerster, F.; Kudo, M.; Chan, S.L.; Llovet, J.M.; Qin, S.; Schelman, W.R.; Chintharlapalli, S.; Abada, P.B.; Sherman, M.; et al. Biology and significance of alpha-fetoprotein in hepatocellular carcinoma. Liver Int. 2019, 39, 2214–2229. [Google Scholar] [CrossRef]
  5. Pattan, V.; Kashyap, R.; Bansal, V.; Candula, N.; Koritala, T.; Surani, S. Genomics in medicine: A new era in medicine. World J. Methodol. 2021, 11, 231–242. [Google Scholar] [CrossRef]
  6. Vargas, A.J.; Harris, C.C. Biomarker development in the precision medicine era: Lung cancer as a case study. Nat. Rev. Cancer 2016, 16, 525–537. [Google Scholar] [CrossRef]
  7. Macias, R.I.R.; Kornek, M.; Rodrigues, P.M.; Paiva, N.A.; Castro, R.E.; Urban, S.; Pereira, S.P.; Cadamuro, M.; Rupp, C.; Loosen, S.H.; et al. Diagnostic and prognostic biomarkers in cholangiocarcinoma. Liver Int. 2019, 39 (Suppl. 1), 108–122. [Google Scholar] [CrossRef] [PubMed]
  8. Panizza, E.; Regalado, B.D.; Wang, F.; Nakano, I.; Vacanti, N.M.; Cerione, R.A.; Antonyak, M.A. Proteomic analysis reveals microvesicles containing NAMPT as mediators of radioresistance in glioma. Life Sci. Alliance 2023, 6, e202201680. [Google Scholar] [CrossRef]
  9. Forterre, A.; Komuro, H.; Aminova, S.; Harada, M. A Comprehensive Review of Cancer MicroRNA Therapeutic Delivery Strategies. Cancers 2020, 12, 1852. [Google Scholar] [CrossRef]
  10. Afshari, A.; Yaghobi, R.; Karimi, M.H.; Mowla, J. Alterations in MicroRNA gene expression profile in liver transplant patients with hepatocellular carcinoma. BMC Gastroenterol. 2021, 21, 262. [Google Scholar] [CrossRef]
  11. Yang, C.; Ma, X.; Guan, G.; Liu, H.; Yang, Y.; Niu, Q.; Wu, Z.; Jiang, Y.; Bian, C.; Zang, Y.; et al. MicroRNA-766 promotes cancer progression by targeting NR3C2 in hepatocellular carcinoma. FASEB J. 2019, 33, 1456–1467. [Google Scholar] [CrossRef]
  12. Yalçınkaya, B.; Güzel, E.; Taştekin, D.; Pençe, S. Role of mir-33a, mir-203b, mir361-3p, and mir-424 in hepatocellular carcinoma. Turk. J. Med. Sci. 2021, 51, 638–643. [Google Scholar] [CrossRef]
  13. Barrett, T.; Wilhite, S.E.; Ledoux, P.; Evangelista, C.; Kim, I.F.; Tomashevsky, M.; Marshall, K.A.; Phillippy, K.H.; Sherman, P.M.; Holko, M.; et al. NCBI GEO: Archive for functional genomics data sets-update. Nucleic Acids Res. 2013, 41, D991–D995. [Google Scholar] [CrossRef]
  14. Zhou, Y.; Zhou, B.; Pache, L.; Chang, M.; Khodabakhshi, A.H.; Tanaseichuk, O.; Benner, C.; Chanda, S.K. Metascape provides a biologist-oriented resource for the analysis of systems-level datasets. Nat. Commun. 2019, 10, 1523. [Google Scholar] [CrossRef]
  15. Sherman, B.T.; Hao, M.; Qiu, J.; Jiao, X.L.; Baseler, M.W.; Lane, H.C.; Imamichi, T.; Chang, W.Z. DAVID: A web server for functional enrichment analysis and functional annotation of gene lists (2021 update). Nucleic Acids Res. 2022, 50, W216–W221. [Google Scholar] [CrossRef]
  16. Sticht, C.; De La Torre, C.; Parveen, A.; Gretz, N. miRWalk: An online resource for prediction of microRNA binding sites. PLoS ONE 2018, 13, e0206239. [Google Scholar] [CrossRef] [PubMed]
  17. Huang, H.Y.; Lin, Y.C.D.; Cui, S.D.; Huang, Y.X.; Tang, Y.; Xu, J.T.; Bao, J.Y.; Li, Y.L.; Wen, J.; Zuo, H.L.; et al. miRTarBase update 2022: An informative resource for experimentally validated miRNA-target interactions. Nucleic Acids Res. 2022, 50, D222–D230. [Google Scholar] [CrossRef]
  18. Martens, M.; Ammar, A.; Riutta, A.; Waagmeester, A.; Slenter, D.N.; Hanspers, K.; Miller, R.A.; Digles, D.; Lopes, E.N.; Ehrhart, F.; et al. WikiPathways: Connecting communities. Nucleic Acids Res. 2021, 49, D613–D621. [Google Scholar] [CrossRef] [PubMed]
  19. Kehl, T.; Kern, F.; Backes, C.; Fehlmann, T.; Stockel, D.; Meese, E.; Lenhof, H.P.; Keller, A. miRPathDB 2.0: A novel release of the miRNA Pathway Dictionary Database. Nucleic Acids Res. 2020, 48, D142–D147. [Google Scholar] [CrossRef] [PubMed]
  20. Szklarczyk, D.; Kirsch, R.; Koutrouli, M.; Nastou, K.; Mehryary, F.; Hachilif, R.; Gable, A.L.; Fang, T.; Doncheva, N.T.; Pyysalo, S. The STRING database in 2023: Protein–protein association networks and functional enrichment analyses for any sequenced genome of interest. Nucleic Acids Res. 2023, 51, D638–D646. [Google Scholar] [CrossRef]
  21. Doncheva, N.T.; Morris, J.H.; Gorodkin, J.; Jensen, L.J. Cytoscape StringApp: Network Analysis and Visualization of Proteomics Data. J. Proteome Res. 2019, 18, 623–632. [Google Scholar] [CrossRef]
  22. Lu, L.; Zhang, M. Edge Betweenness Centrality. In Encyclopedia of Systems Biology; Dubitzky, W., Wolkenhauer, O., Cho, K.H., Yokota, H., Eds.; Springer: New York, NY, USA, 2013; pp. 647–648. [Google Scholar]
  23. Valera-Calero, J.A.; Arendt-Nielsen, L.; Cigaran-Mendez, M.; Fernandez-De-Las-Penas, C.; Varol, U. Network Analysis for Better Understanding the Complex Psycho-Biological Mechanisms behind Fibromyalgia Syndrome. Diagnostics 2022, 12, 1845. [Google Scholar] [CrossRef]
  24. Li, C.W.; Tang, Z.F.; Zhang, W.J.; Ye, Z.C.; Liu, F. GEPIA2021: Integrating multiple deconvolution-based analysis into GEPIA. Nucleic Acids Res. 2021, 49, W242–W246. [Google Scholar] [CrossRef] [PubMed]
  25. Lanczky, A.; Gyorffy, B. Web-Based Survival Analysis Tool Tailored for Medical Research (KMplot): Development and Implementation. J. Med. Internet Res. 2021, 23, e27633. [Google Scholar] [CrossRef] [PubMed]
  26. Chen, L.; Li, J.; Yuan, R.; Wang, Y.; Zhang, J.; Lin, Y.; Wang, L.; Zhu, X.; Zhu, W.; Bai, J.; et al. Dynamic 3D genome reorganization during development and metabolic stress of the porcine liver. Cell Discov. 2022, 8, 56. [Google Scholar] [CrossRef] [PubMed]
  27. Alves-Bezerra, M.; Cohen, D.E. Triglyceride Metabolism in the Liver. Compr. Physiol. 2017, 8, 1–8. [Google Scholar]
  28. Kotsiliti, E. Understanding HCC sex disparities. Nat. Rev. Gastroenterol. Hepatol. 2022, 19, 147. [Google Scholar] [CrossRef]
  29. Wei, G.Y.; Hu, M.; Zhao, L.; Guo, W.S. MiR-451a suppresses cell proliferation, metastasis and EMT via targeting YWHAZ in hepatocellular carcinoma. Eur. Rev. Med. Pharmacol. Sci. 2019, 23, 5158–5167. [Google Scholar]
  30. Gan, Y.; Ye, F.; He, X.X. The role of YWHAZ in cancer: A maze of opportunities and challenges. J. Cancer 2020, 11, 2252–2264. [Google Scholar] [CrossRef]
  31. Duron, C.; Pan, Y.; Gutmann, D.H.; Hardin, J.; Radunskaya, A. Variability of Betweenness Centrality and Its Effect on Identifying Essential Genes. Bull. Math. Biol. 2019, 81, 3655–3673. [Google Scholar] [CrossRef]
  32. Yerukala, S.; Ho, S.Y. Novel miRNA signature for predicting the stage of hepatocellular carcinoma. Sci. Rep. 2020, 10, 14452. [Google Scholar] [CrossRef] [PubMed]
  33. Ghafouri-Fard, S.; Honarmand Tamizkar, K.; Hussen, B.M.; Taheri, M. MicroRNA signature in liver cancer. Pathol. Res. Pract. 2021, 219, 153369. [Google Scholar] [CrossRef] [PubMed]
  34. Bongolo, C.C.; Thokerunga, E.; Yan, Q.; Yacouba, M.B.M.; Wang, C. Exosomes Derived from microRNA-27a-3p Overexpressing Mesenchymal Stem Cells Inhibit the Progression of Liver Cancer through Suppression of Golgi Membrane Protein 1. Stem Cells Int. 2022, 12, 9748714. [Google Scholar] [CrossRef] [PubMed]
  35. Kong, J.; Ha, D.; Lee, J.; Kim, I.; Park, M.; Im, S.H.; Shin, K.; Kim, S. Network-based machine learning approach to predict immunotherapy response in cancer patients. Nat. Commun. 2022, 13, 3703. [Google Scholar] [CrossRef] [PubMed]
  36. Shee, S.; Koh, R.; Voon, K.; Chye, S.; Othman, I.; Ng, K. The roles of microRNA-331 Family in Cancers. J. Cancer Res. Pract. 2019, 6, 1–6. [Google Scholar]
  37. Aizarani, N.; Saviano, A.; Sagar, N.; Mailly, L.; Durand, S.; Herman, J.S.; Pessaux, P.; Baumert, T.F.; Grün, D. A human liver cell atlas reveals heterogeneity and epithelial progenitors. Nature 2019, 572, 199–204. [Google Scholar] [CrossRef]
  38. Suzuki, S.; Venkatesh, D.; Kanda, H.; Nakayama, A.; Hosokawa, H.; Lee, E.Y.; Miki, T.; Stockwell, B.R.; Yokote, K.; Tanaka, T.; et al. GLS2 Is a Tumor Suppressor and a Regulator of Ferroptosis in Hepatocellular Carcinoma. Cancer Res. 2022, 82, 3209–3222. [Google Scholar] [CrossRef]
  39. Bongiovanni, L.; Andriessen, A.; Silvestri, S.; Porcellato, I.; Brachelente, C.; De Bruin, A. H2AFZ: A Novel Prognostic Marker in Canine Melanoma and a Predictive Marker for Resistance to CDK4/6 Inhibitor Treatment. Front. Vet. Sci. 2021, 8, 705359. [Google Scholar] [CrossRef] [PubMed]
  40. Žujović Janko, T.; Stojanović Marko, M.; Brzački Vesna, M.; Kujović Aleksandar, D.; Đorđević Miodrag, N.; Jančić Snežana, A.; Milenković Sanja, M.; Milošević Velimir, S. Influence of stathmin 1 (STMN1) expression on neoangiogenesis in colorectal adenocarcinoma. Pathol. Res. Pract. 2022, 238, 154057. [Google Scholar] [CrossRef]
  41. Leca, I.; Phillips, A.W.; Ushakova, L.; Cushion, T.D.; Keays, D.A. Codon modification of Tuba1a alters mRNA levels and causes a severe neurodevelopmental phenotype in mice. Sci. Rep. 2023, 13, 1215. [Google Scholar] [CrossRef]
Figure 1. Patient flow diagram of this study.
Cimb 45 00466 g001
Figure 2. Analysis of differentially expressed genes in HCC. (A) Venn diagram analysis of three datasets; (B) volcano plot of GSE101685; (C) volcano plot of GSE176271; (D) volcano plot of GSE164760.
Cimb 45 00466 g002
Figure 3. Analysis of differentially expressed miRNAs in hepatocellular carcinoma. (A) Venn diagram analysis of two datasets; (B) volcano plot of GSE176288; (C) volcano plot of GSE158523.
Cimb 45 00466 g003
Figure 4. The interaction network of cDEMs and cDEGs in HCC. The red blocks are the identified nodes with high betweenness scores.
Cimb 45 00466 g004
Figure 5. The validation of hub genes by GEPIA. The star indicates the significant difference between normal and HCC samples.
Cimb 45 00466 g005
Figure 6. Dot plot of CLEC4G gene in different types of cancer. The red dots indicate the gene expression in tumor tissue, while the green dots indicate the gene expression in normal tissue.
Cimb 45 00466 g006
Figure 7. Survival analysis of hub genes by the KMplot tool. The red line indicates high expression, and the black line indicates low expression.
Cimb 45 00466 g007
Figure 8. Survival analysis of hub miRNAs by the KMplot tool. The red line indicates high expression, and the black line indicates low expression.
Cimb 45 00466 g008
Table 1. Function enrichment analysis of 94 cDEGs by Metascape and DAVID.
CategoryTermCountProportionp-Value
UP_TISSUELiver5457.45%1.71 × 10⁻²⁶
UP_TISSUEKidney1515.96%1.77 × 10−02
UP_TISSUEPlasma1313.83%1.88 × 10−08
UP_TISSUEPCR rescued clones99.57%3.28 × 10−02
UP_TISSUEHippocampus77.45%2.52 × 10−02
UP_TISSUEFetal liver66.38%3.46 × 10−03
UP_TISSUEMyometrium22.13%4.25 × 10−02
GO Biological ProcessesMonocarboxylic acid metabolic process2122.34%2.94 × 10⁻¹⁸
GO Biological ProcessesAlcohol metabolic process1313.83%1.99 × 10⁻¹¹
GO Biological ProcessesFatty-acid metabolic process1313.83%2.82 × 10⁻¹¹
Reactome Gene SetsBiological oxidation1212.77%5.20 × 10⁻¹²
GO Biological ProcessesOlefinic compound metabolic process1111.70%9.69 × 10⁻¹³
GO Biological ProcessesTerpenoid metabolic process1010.64%5.26 × 10⁻¹³
GO Biological ProcessesIsoprenoid metabolic process1010.64%2.98 × 10⁻¹²
GO Biological ProcessesCellular hormone metabolic process1010.64%7.48 × 10⁻¹²
GO Biological ProcessesEpoxygenase P450 pathway66.38%2.03 × 10⁻¹¹
Reactome Gene SetsSynthesis of hydroxyeicosatetraenoic acids55.32%3.27 × 10⁻¹¹
Table 2. DEG–DEM interaction prediction. This table only shows one interaction of one DEM. The full table is shown in Table S3.
No.miRNATranscribed mRNAGene SymbolBinding Energy
1hsa-miR-106a-5pNM_001361DHODH−22.8
2hsa-miR-106b-5pNM_001102470ADH6−21.4
3hsa-miR-1180-3pNM_001145454STMN1−27.5
4hsa-miR-1301-3pNM_033304ADRA1A−26.9
5hsa-miR-136-5pNM_001237CCNA2−20.8
6hsa-miR-15b-5pNM_001280797GLS2−19.0
7hsa-miR-18a-5pNM_152545RASGEF1B−20.9
8hsa-miR-2277-5pNM_016593CYP39A1−29.3
9hsa-miR-25-5pNM_018281ECHDC2−24.2
10hsa-miR-324-5pNM_001257CDH13−23.9
11hsa-miR-326NM_001289033SERPINA4−29.0
12hsa-miR-331-5pNM_001306171ADH4−27.4
13hsa-miR-374b-3pNM_001144911CLEC4M−17.1
14hsa-miR-379-5pNM_001363587CYP4A11−22.4
15hsa-miR-17-5pNM_001297576PEA15−18.7
16hsa-miR-301a-3pNM_001297576PEA15−16.4
17hsa-miR-369-5pNM_001205228SORT1−16.8
18hsa-miR-376c-3pNM_152545RASGEF1B−18.0
19hsa-miR-381-3pNM_001311160THY1−23.3
20hsa-miR-451aNM_001311160THY1−17.0
Table 3. Enrichment analysis of targeted cDEM gene by WikiPathways. The full table is shown in Table S4.
miRNADatabasePathwayHitsp-Value
hsa-miR-451aWikiPathwaysHepatitis C and Hepatocellular Carcinoma52.3 × 10−6
hsa-miR-106a-5pWikiPathwaysHepatitis C and Hepatocellular Carcinoma139.1 × 10−5
hsa-miR-106b-5pWikiPathwaysHepatitis C and Hepatocellular Carcinoma72.1 × 10−4
hsa-miR-17-5pWikiPathwaysHepatitis C and Hepatocellular Carcinoma85.6 × 10−4
hsa-miR-15b-5pWikiPathwaysHepatitis C and Hepatocellular Carcinoma102.0 × 10−3
hsa-miR-18a-5pWikiPathwaysHepatitis C and Hepatocellular Carcinoma50.012
hsa-miR-376c-3pWikiPathwaysHepatitis C and Hepatocellular Carcinoma20.025
hsa-miR-326WikiPathwayHepatitis C and Hepatocellular Carcinoma30.037
hsa-miR-381-3pWikiPathwaysHepatitis C and Hepatocellular Carcinoma300.049
Table 4. Edge betweenness of cDEG–cDEM interaction network. The type score of one indicated the gene–miRNA interaction and the type score of two indicated the gene–gene interaction. The full table is shown in Table S5.
No.EdgeEdge BetweennessType
1FOS interacts with H2AFZ512.842
2C8B interacts with FTCD423.062
3STMN1 interacts with TUBA1B408.922
4hsa-miR-1301-3p interacts with MT1F387.961
5hsa-miR-25-5p interacts with HAL380.971
6hsa-miR-331-5p interacts with FOS377.001
7hsa-miR-326 interacts with GLS2370.501
8FTCD interacts with HAL369.992
9hsa-miR-1301-3p interacts with CLEC4G348.001
10hsa-miR-25-5p interacts with STMN1343.131
11hsa-miR-326 interacts with SERPINA4313.911
12hsa-miR-2277-5p interacts with C8B307.481
13hsa-miR-1301-3p interacts with IGF1279.781
14hsa-miR-25-5p interacts with ANXA2275.021
15HAL interacts with LYVE1270.902
Disclaimer/Publisher’s Note: The statements, opinions and data contained in all publications are solely those of the individual author(s) and contributor(s) and not of MDPI and/or the editor(s). MDPI and/or the editor(s) disclaim responsibility for any injury to people or property resulting from any ideas, methods, instructions or products referred to in the content.

