
Alteration of Mesenchymal Stem Cells Isolated from Glioblastoma Multiforme under the Influence of Photodynamic Treatment
 , , , , , , and
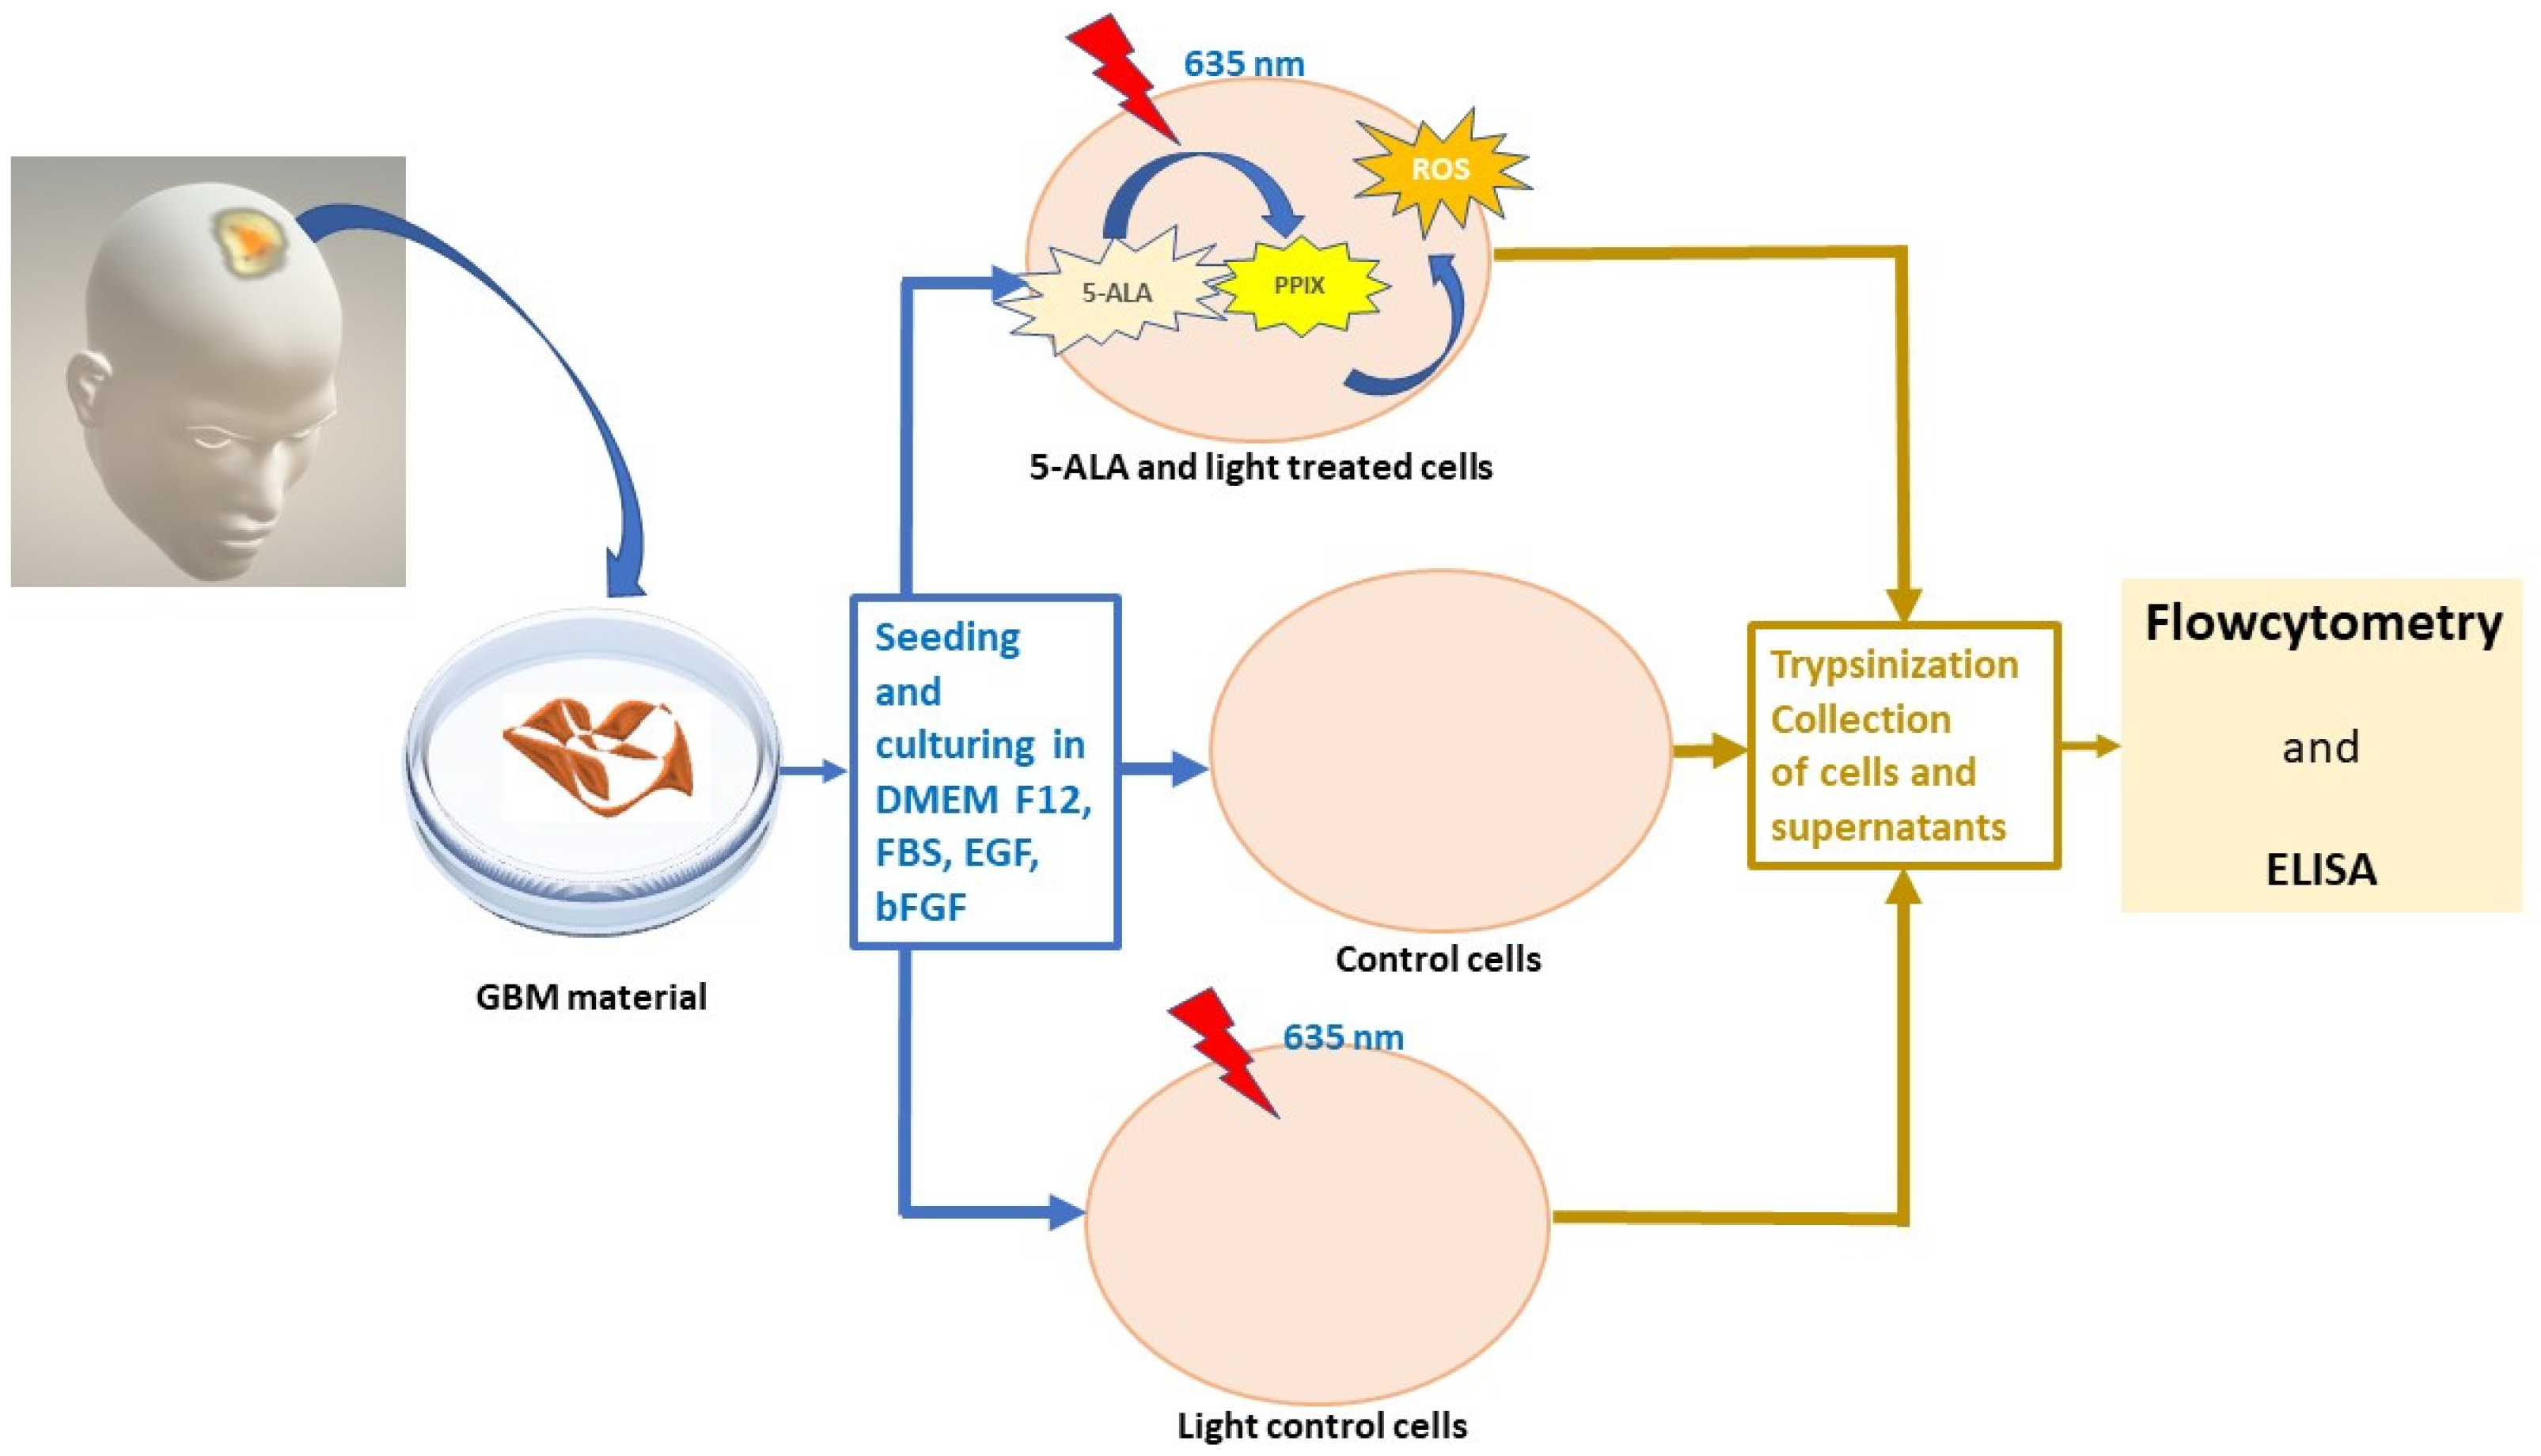
Abstract
:1. Introduction
2. Materials and Methods
2.1. Materials
2.2. Methods
2.2.1. Cell Culture
2.2.2. Photodynamic Treatment
2.2.3. Flow Cytometry
2.2.4. Immunoenzyme Assay (ELISA)
2.2.5. Statistical Processing
3. Results
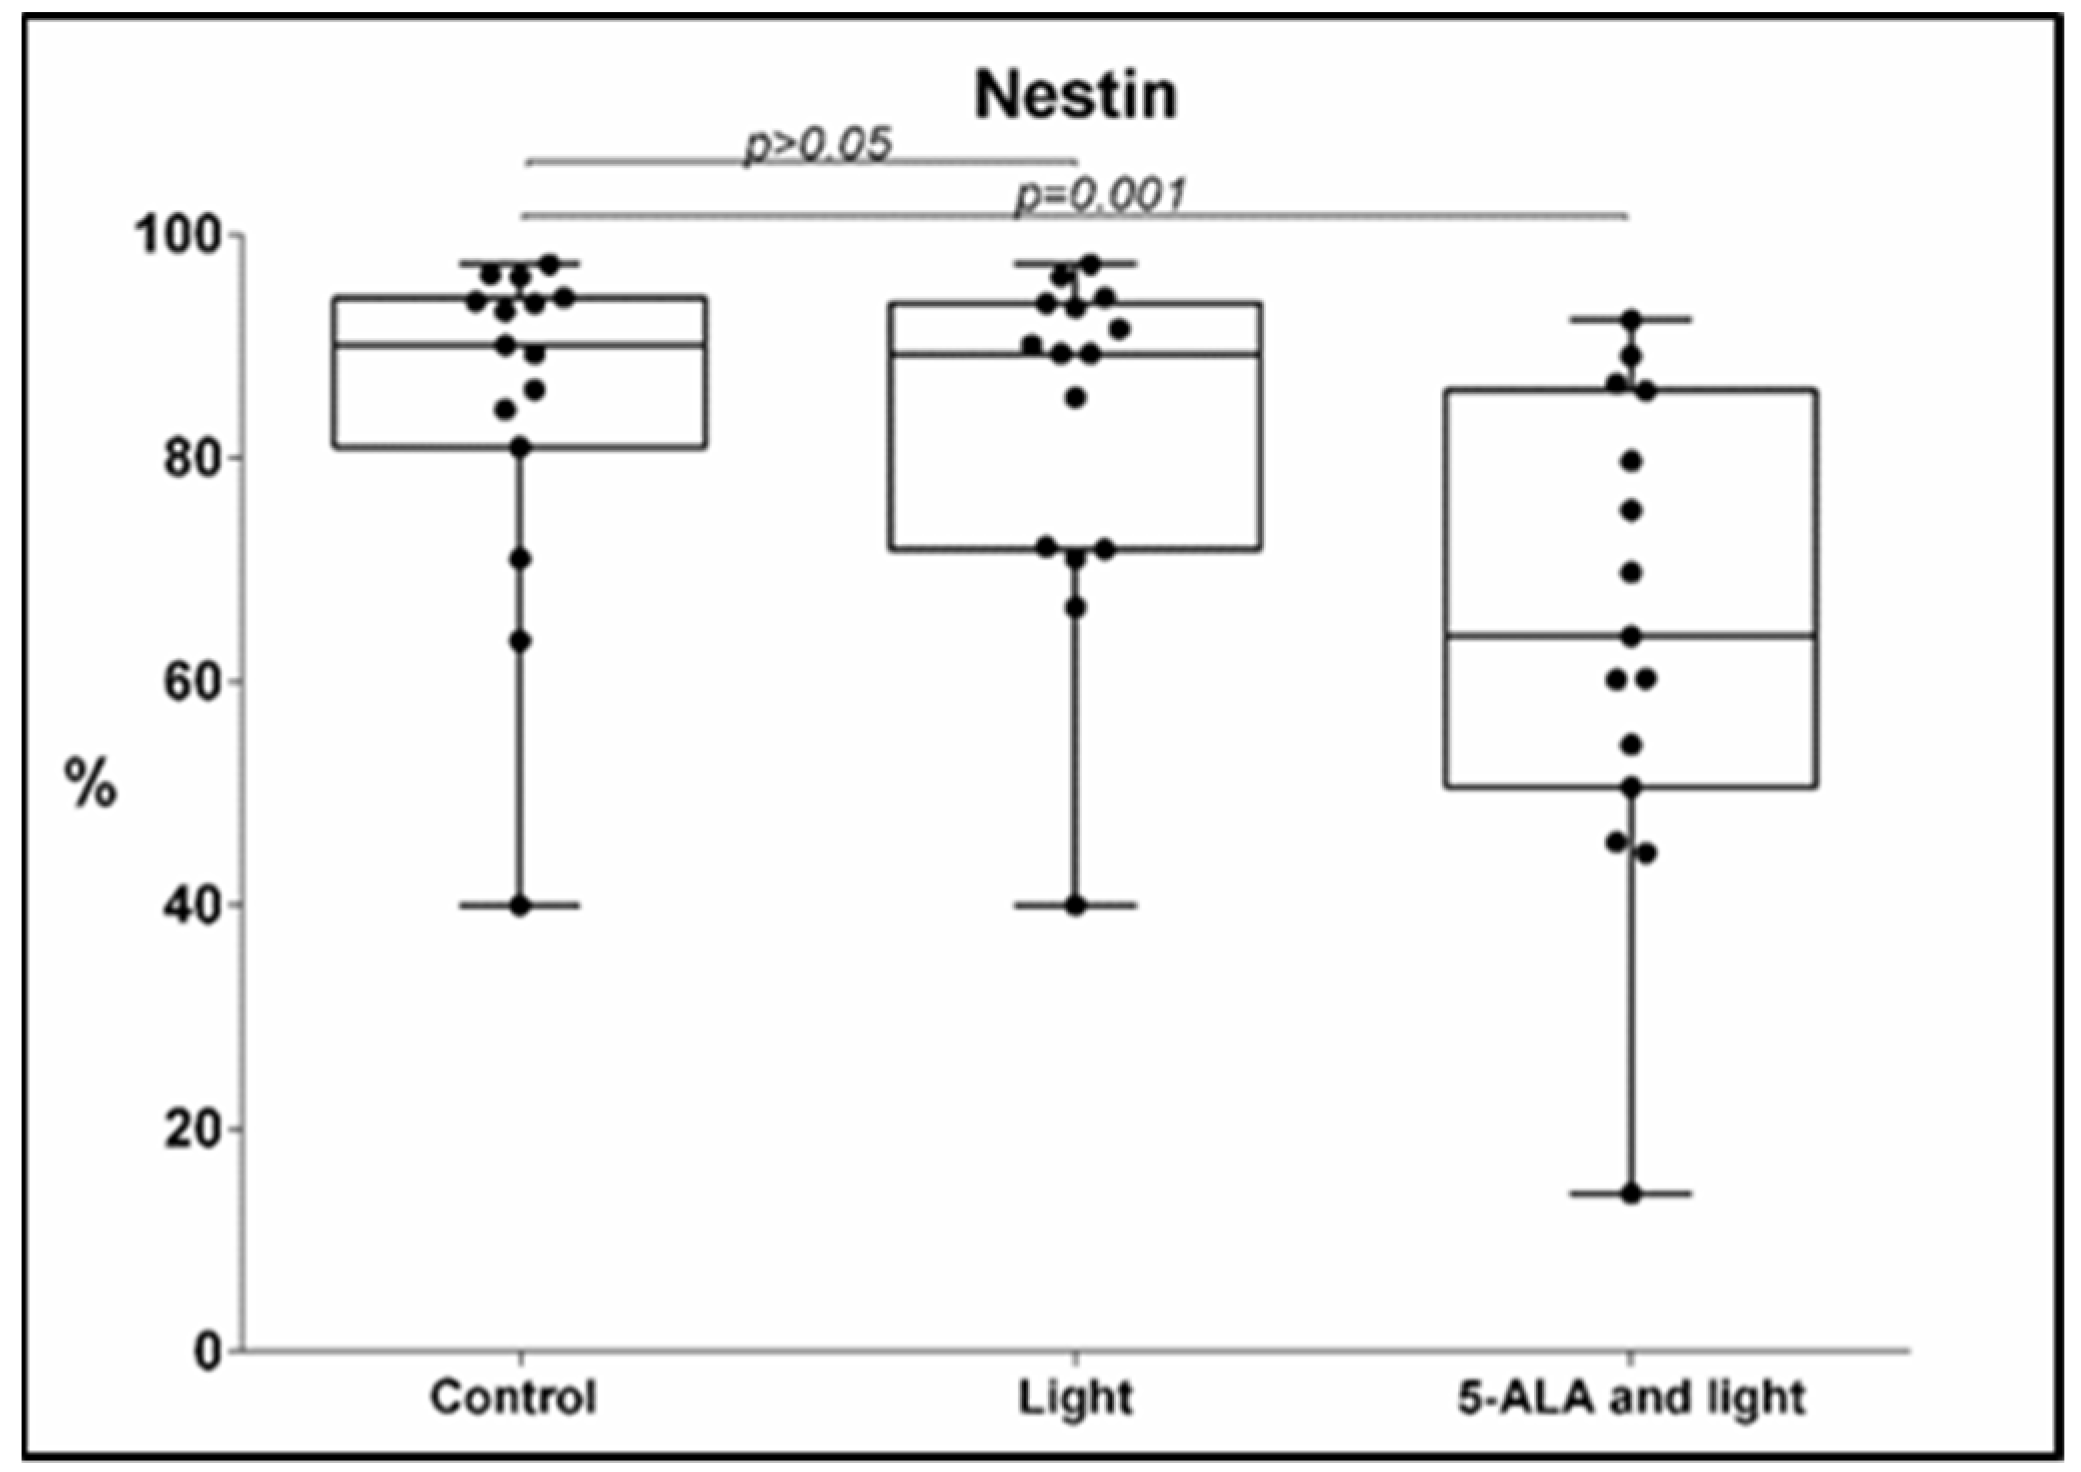
3.1. Nestin Expression
3.2. GFAP Expression
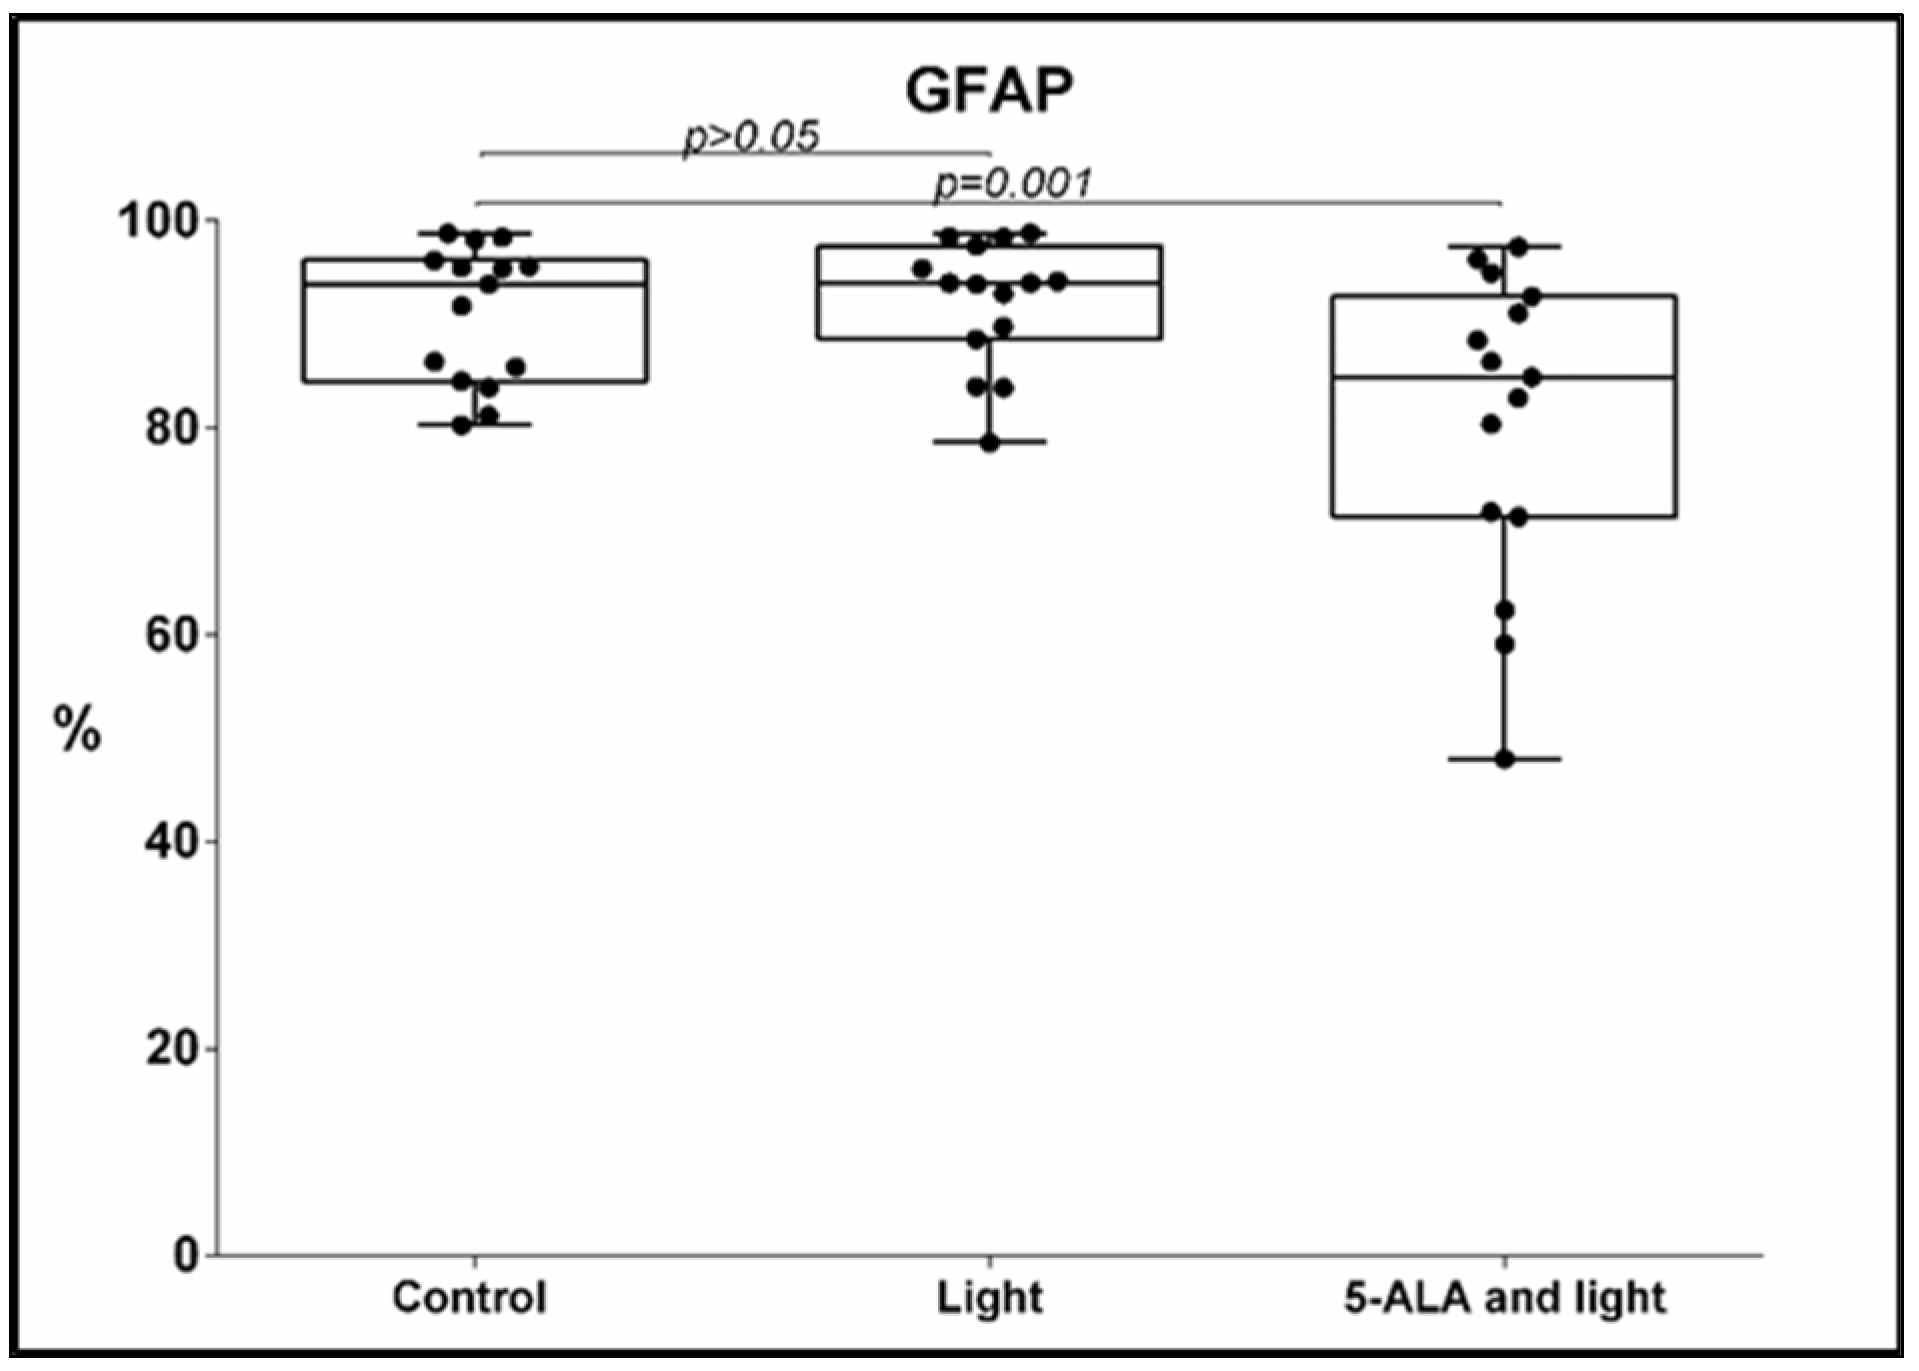
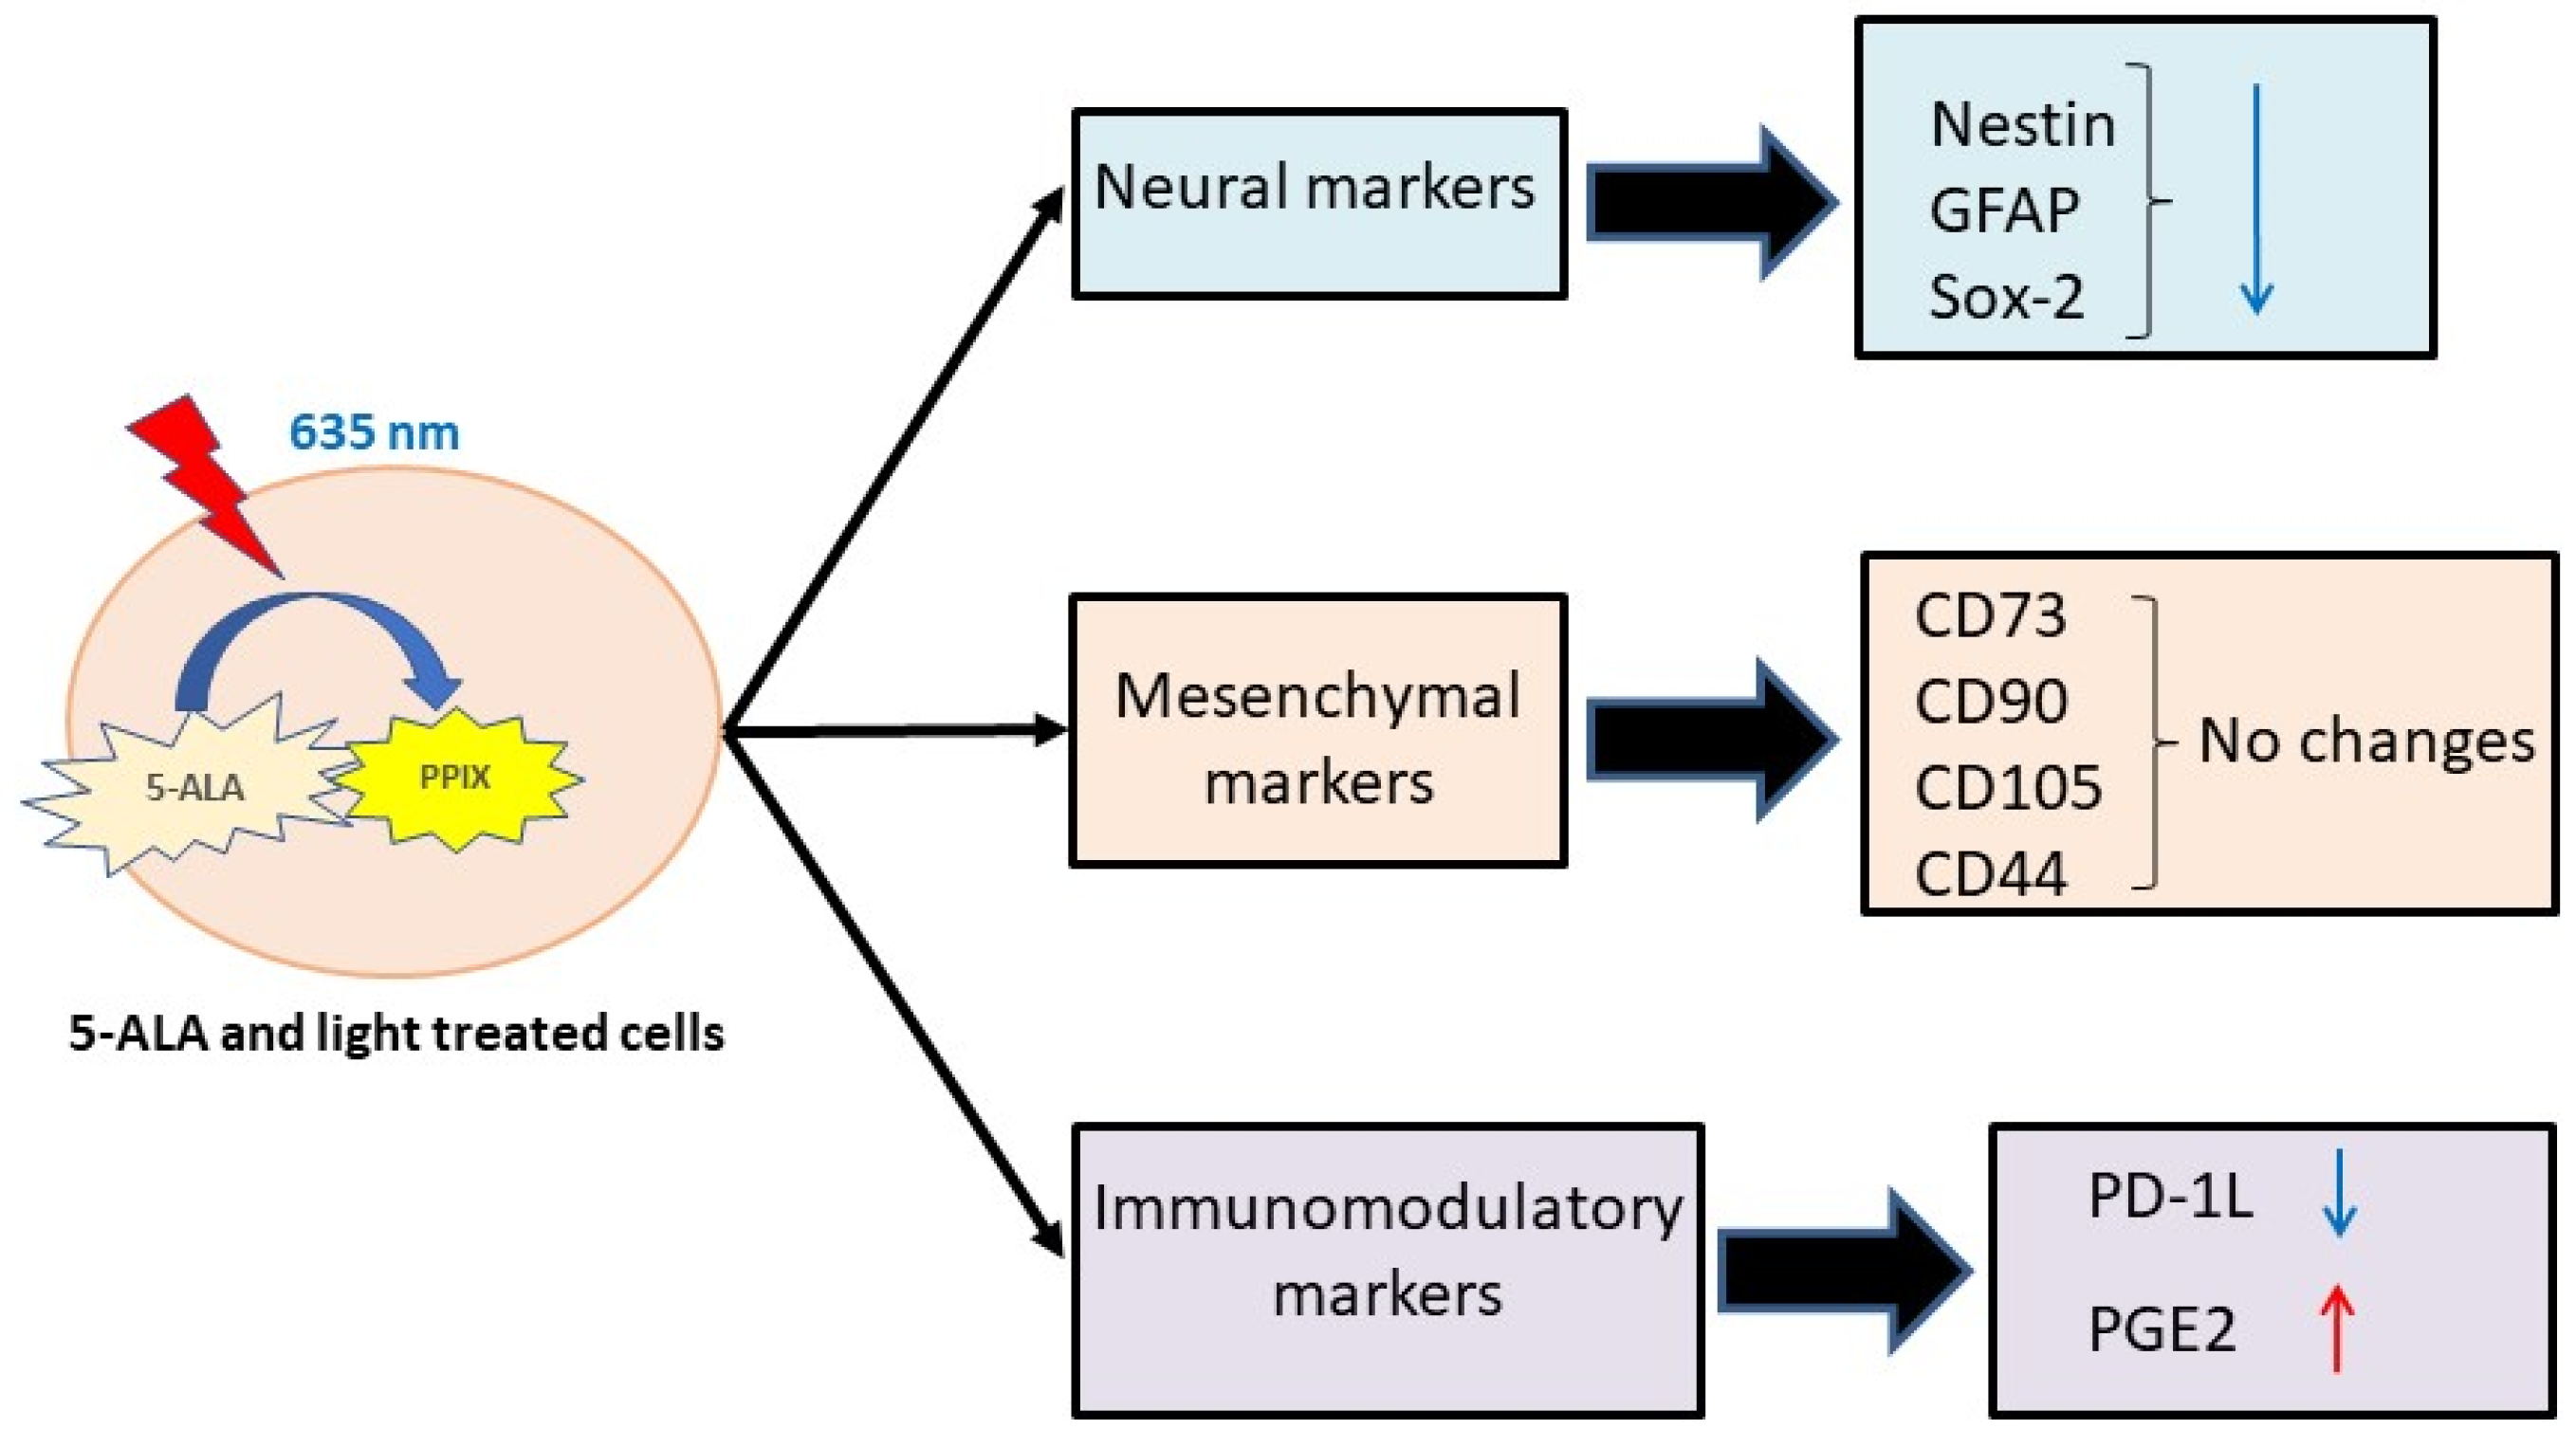
- Under the influence of 5-ALA and light, a significant decrease in the percentage of GFAP-positive GB-MSCs was observed compared to the control GB-MSCs, 91 ± 6.6% (mean ± std. deviation), 93.9%, 80–90.8% (median, min.–max.) vs. 80.6 ± 15% (mean ± std. deviation), 84.9%, 48–97.5% (median, min.–max.), p = 0.001, q = 0.0025, Figure 3. The decrease in the percentage of GFAP-positive GB-MSC cells was positively correlated with the diminishment in the percentage of Nestin- positive GB-MSC, s Spearman’s rho = 0.614, p = 0.015.
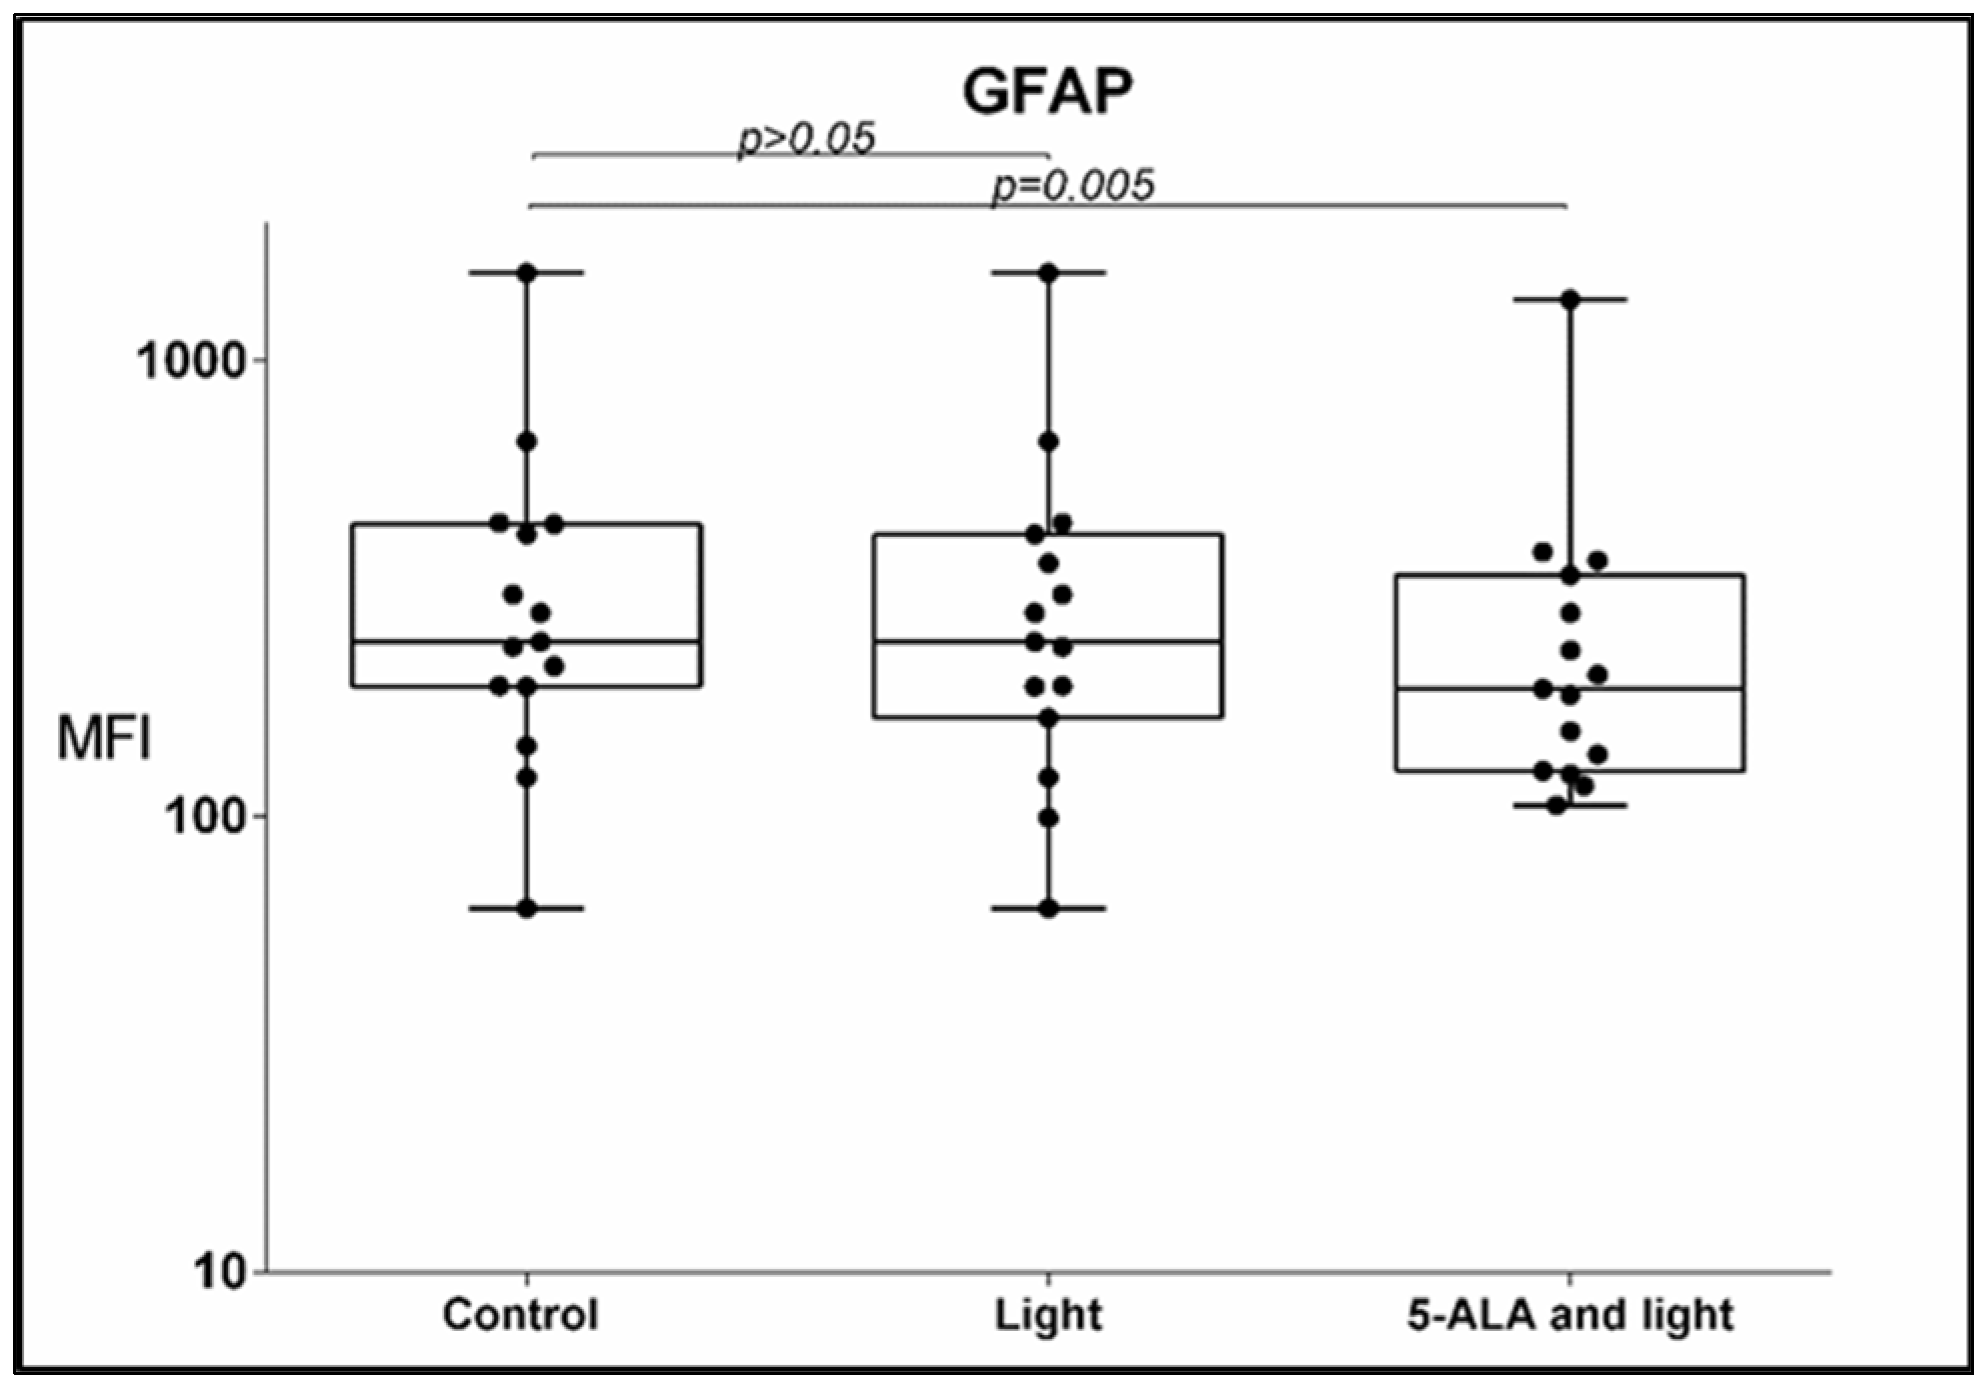
- The mean fluorescent intensity (MFI) of the GFAP expression also diminished after 5-ALA and light exposure—367 ± 364 (mean ± std. deviation), 242, 63–1562 (median, min.–max.) in the control GB-MSCx vs. 287 ± 312 (mean ± std. deviation), 191, 106–136 (median, min.–max.) in treated cells, p = 0.005, q = 0.0083, Figure 4.
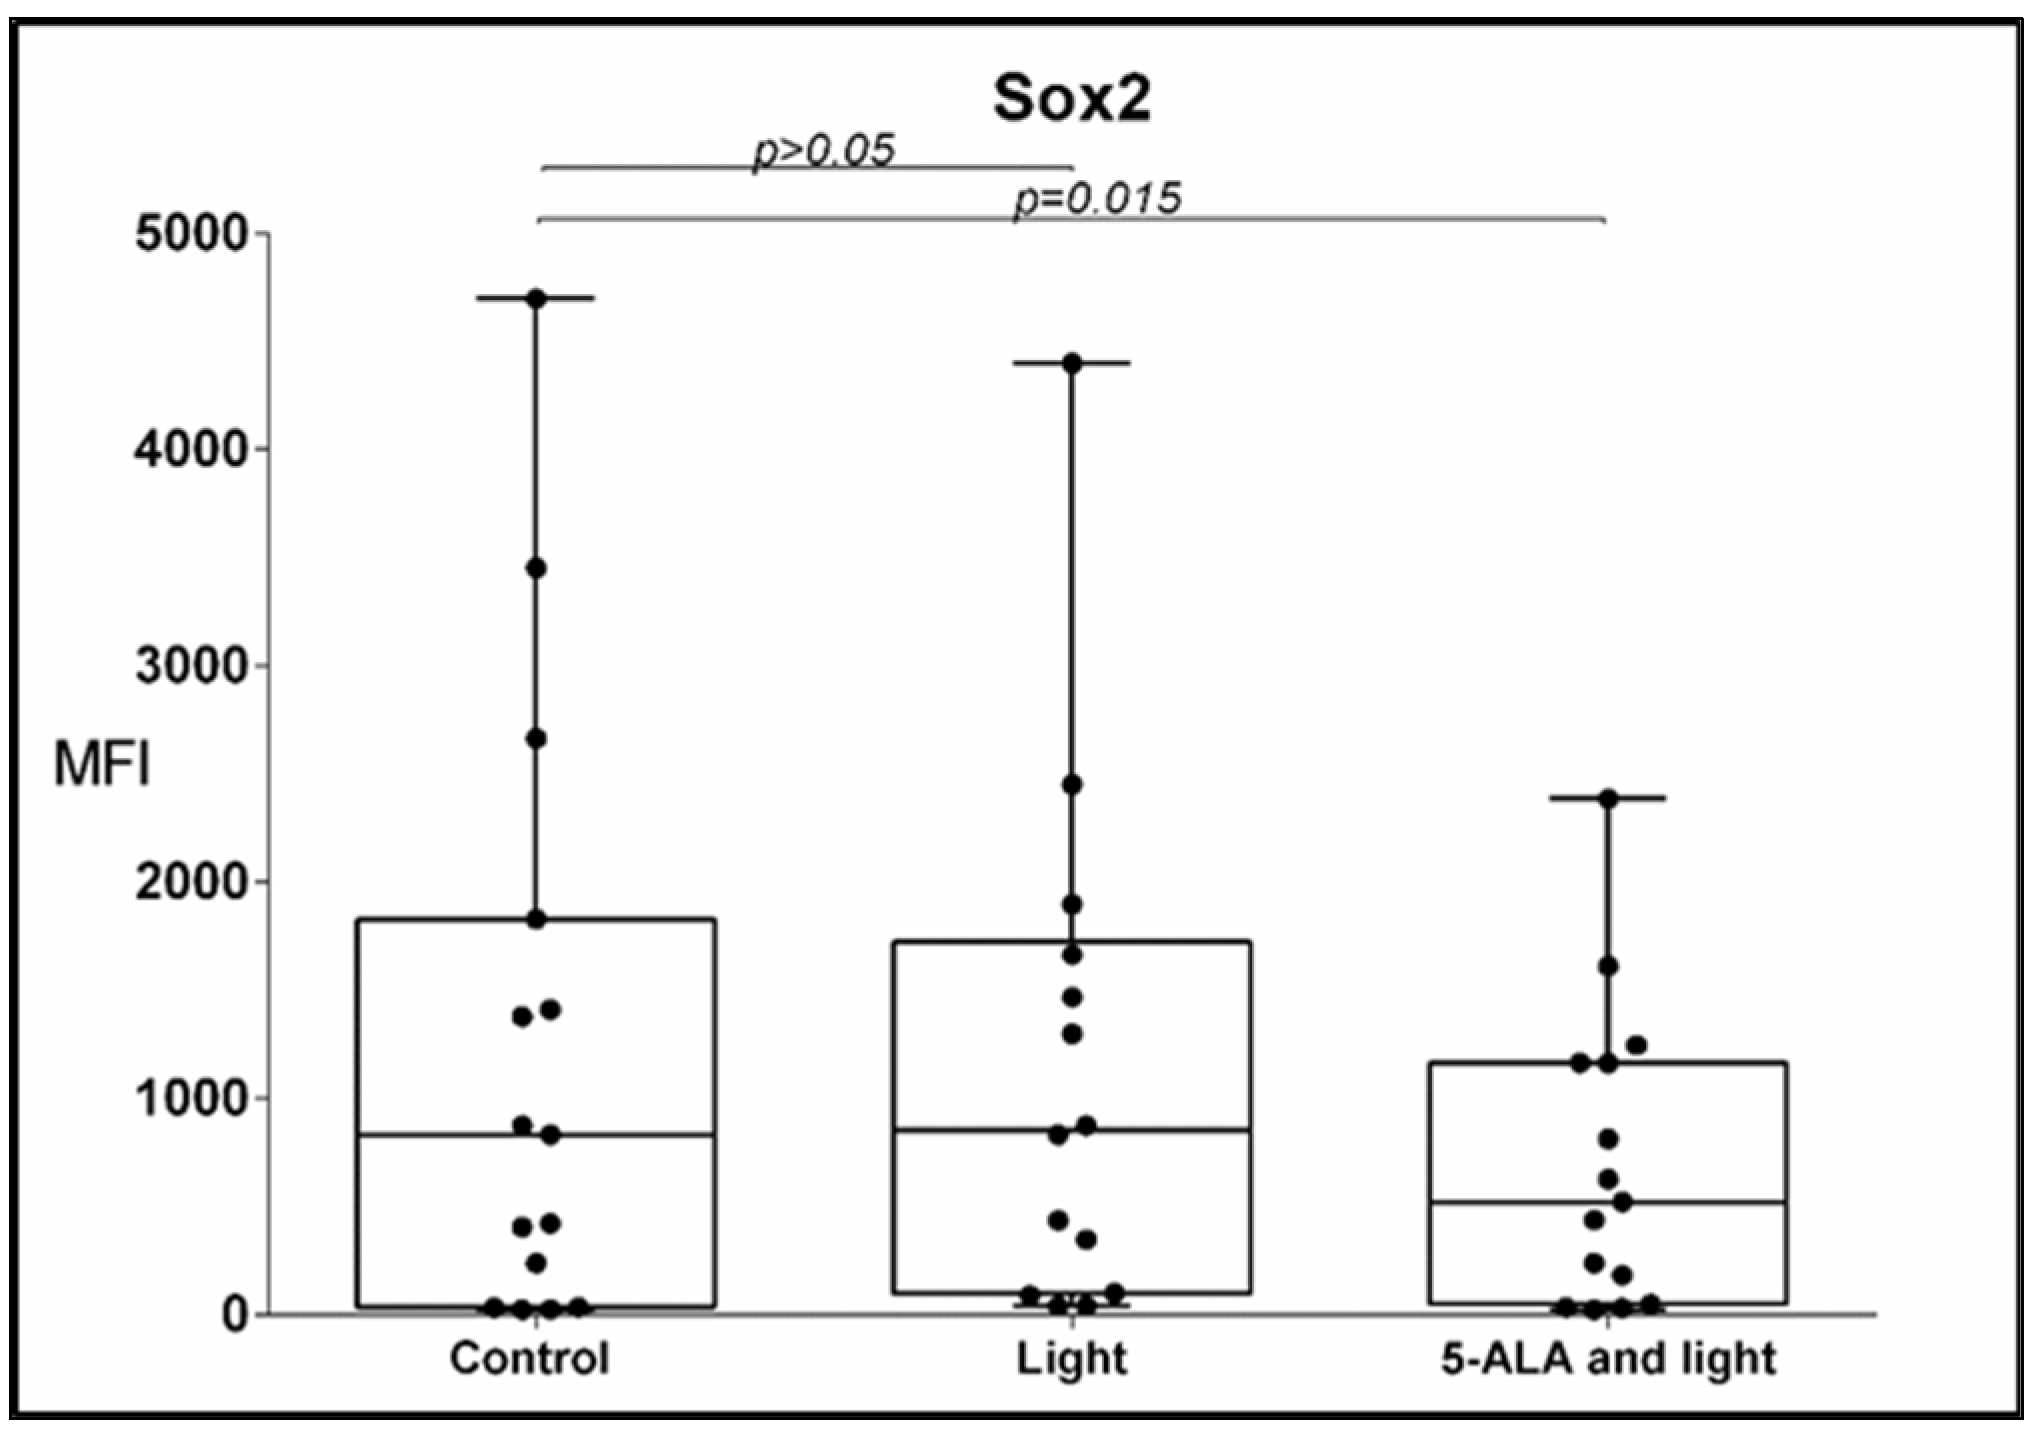
3.3. Sox2 Expression
3.4. PD-L1 Expression
3.5. Expression of CD105, CD73, CD90, and CD44
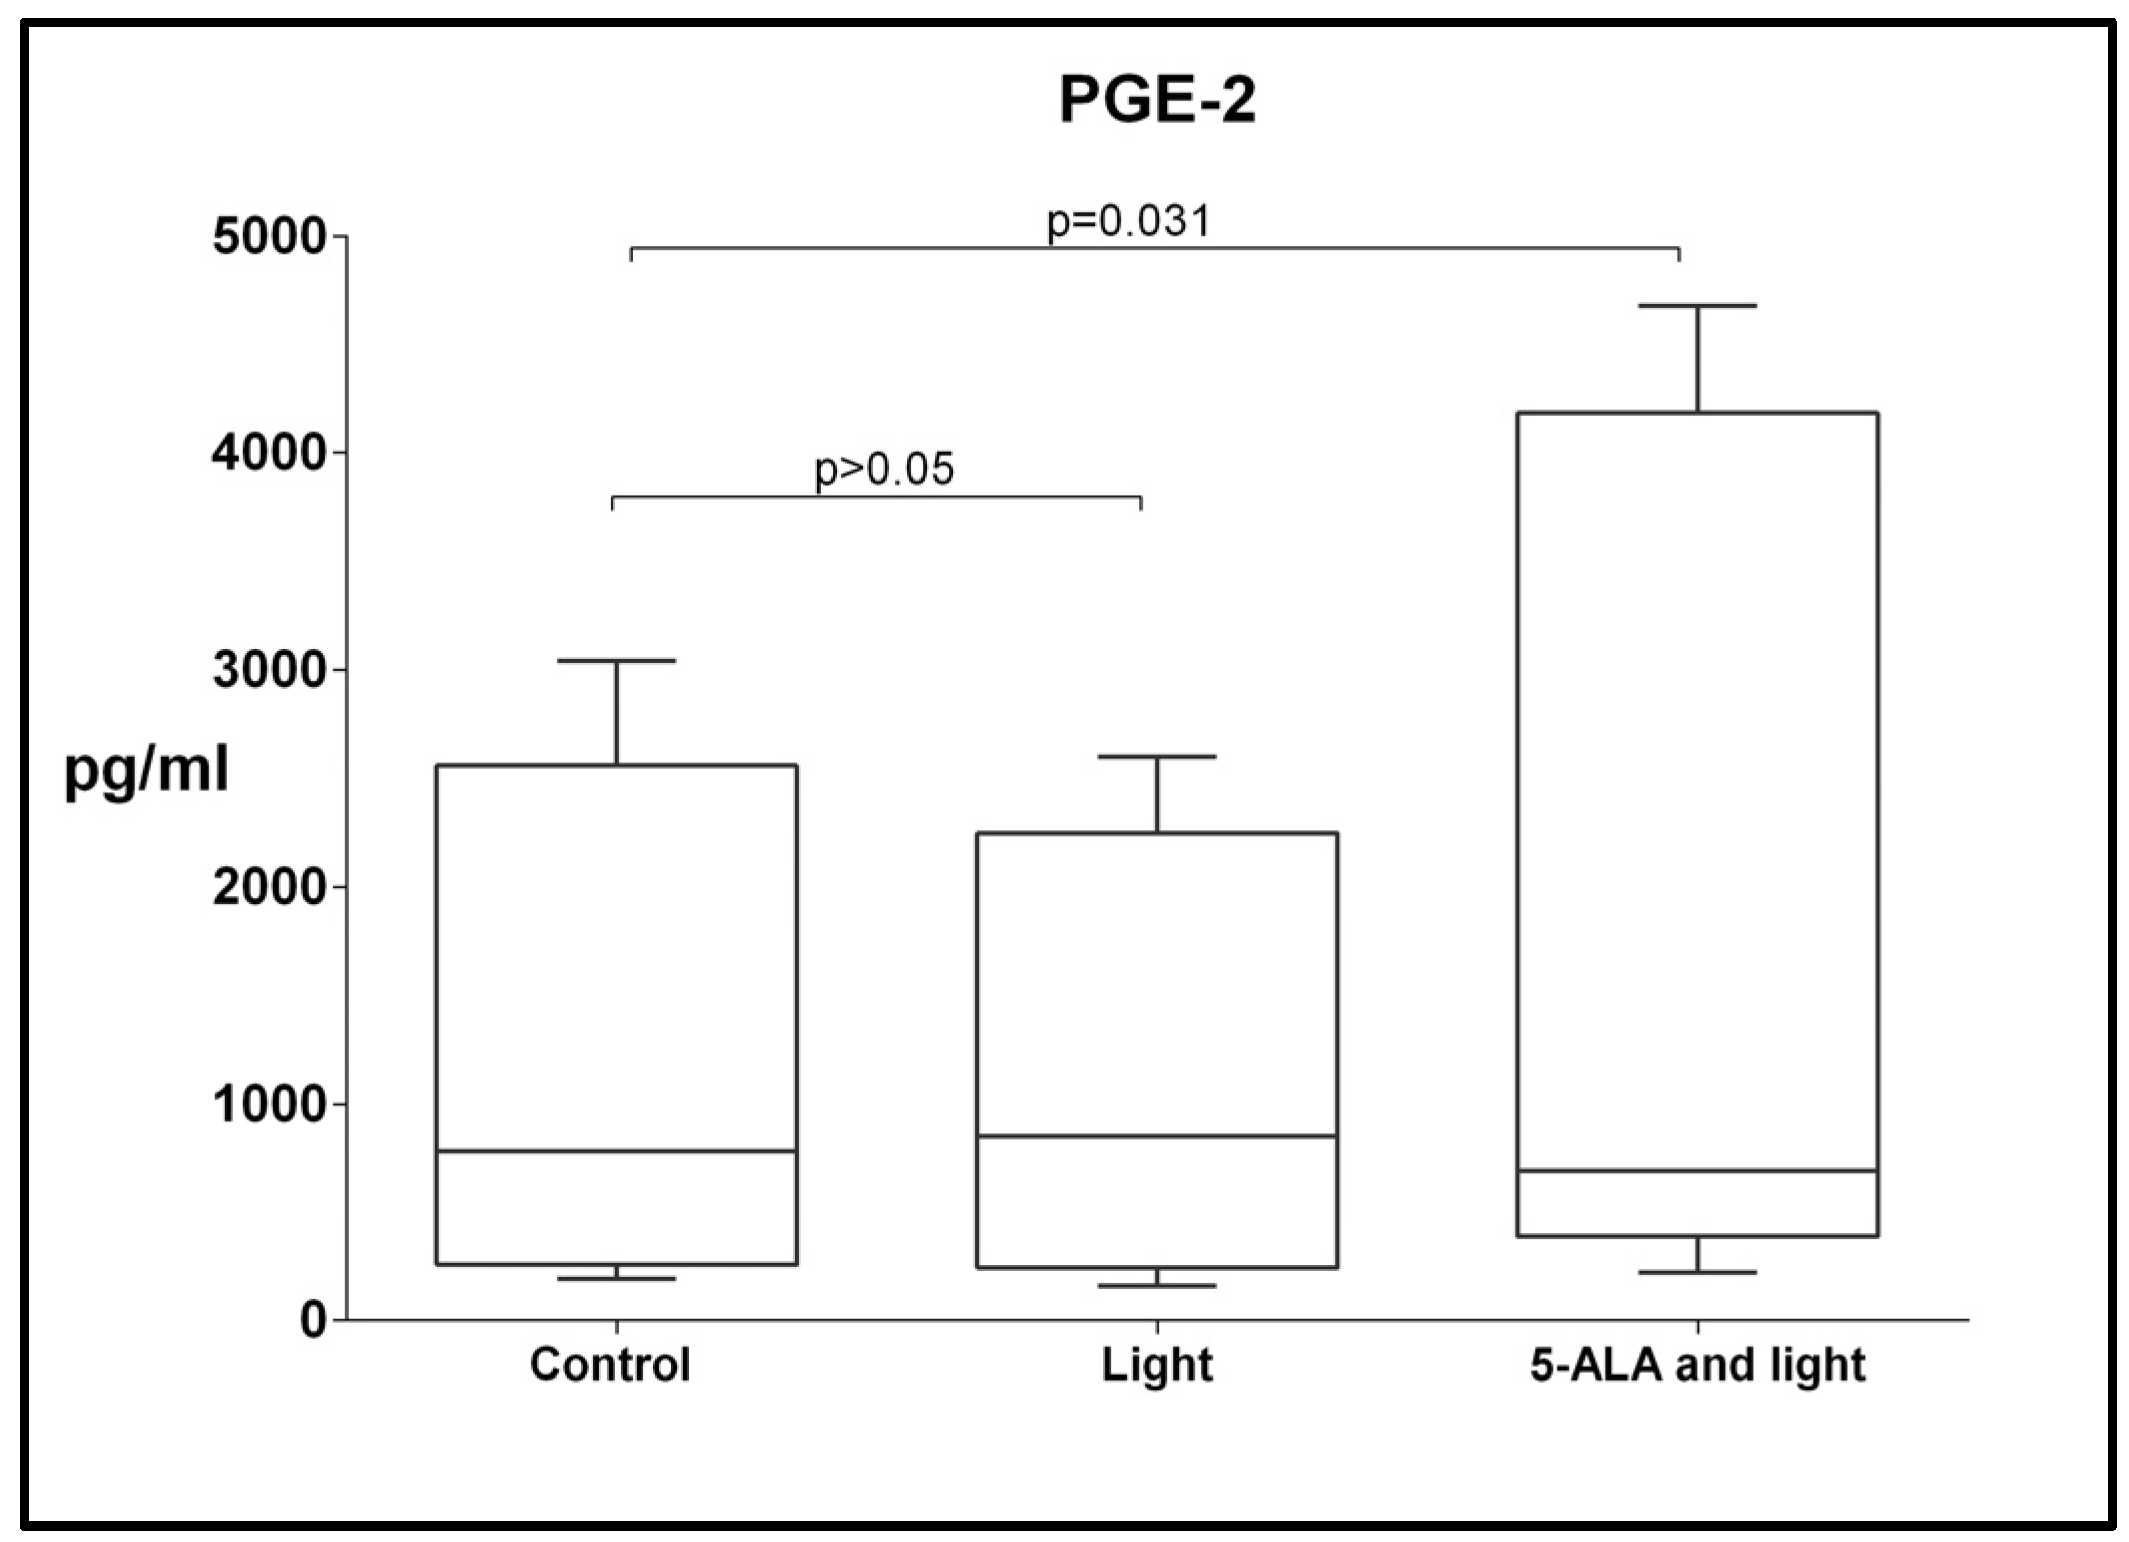
3.6. Changes in Levels of TGF-β, CCL-2, CCL-5, IL-1RA, and PGE2
4. Discussion
5. Conclusions
6. Limitations
Author Contributions
Funding
Institutional Review Board Statement
Informed Consent Statement
Data Availability Statement
Acknowledgments
Conflicts of Interest
References
- Tumangelova-Yuzeir, K.; Naydenov, E.; Ivanova-Todorova, E.; Krasimirova, E.; Vasilev, G.; Nachev, S.; Kyurkchiev, D. Mesenchymal stem cells derived and cultured from glioblastoma multiforme increase Tregs, downregulate th17, and induce the tolerogenic phenotype of monocyte-derived cells. Stem Cells Int. 2019, 2019, 6904638. [Google Scholar] [CrossRef] [PubMed]
- Kyurkchiev, D.S. Cancer stem cells from glioblastoma multiforme: Culturing and phenotype. OA Stem Cells 2014, 10, 3. [Google Scholar]
- Xue, L.; Ding, P.; Xiao, L.; Hu, M.; Hu, Z. Nestin is induced by hypoxia and is attenuated by hyperoxia in Müller glial cells in the adult rat retina. Int. J. Exp. Pathol. 2011, 92, 377–381. [Google Scholar] [CrossRef] [PubMed]
- Bajetto, A.; Thellung, S.; Dellacasagrande, I.; Pagano, A.; Barbieri, F.; Florio, T. Cross talk between mesenchymal and glioblastoma stem cells: Communication beyond controversies. Stem Cells Transl. Med. 2020, 9, 1310–1330. [Google Scholar] [CrossRef]
- Nwabo, K.A.; Kamga, P.T.; Simo, R.T.; Vecchio, L.; Seke, E.P.; Muller, J.M.; Bassi, G.; Lukong, E.; Goel, R.K.; Amvene, J.M.; et al. Mesenchymal stromal cells’ role in tumor microenvironment: Involvement of signaling pathways. Cancer Biol. Med. 2017, 14, 129. [Google Scholar] [CrossRef] [PubMed]
- Weinberg, F.; Ramnath, N.; Nagrath, D. Reactive oxygen species in the tumor microenvironment: An overview. Cancers 2019, 11, 1191. [Google Scholar] [CrossRef] [Green Version]
- Kyurkchiev, D.; Naydenov, E.; Tumangelova-Yuzeir, K.; Ivanova-Todorova, E.; Belemezova, K.; Bochev, I.; Minkin, K.; Mourdjeva, M.; Velikova, T.; Nachev, S.; et al. Cells isolated from human glioblastoma multiforme express progesterone-induced blocking factor (PIBF). Cell. Mol. Neurobiol. 2014, 34, 479–489. [Google Scholar] [CrossRef]
- Günther, H.S.; Schmidt, N.O.; Phillips, H.S.; Kemming, D.; Kharbanda, S.; Soriano, R.; Modrusan, Z.; Meissner, H.; Westphal, M.; Lamszus, K. Glioblastoma-derived stem cell-enriched cultures form distinct subgroups according to molecular and phe-notypic criteria. Oncogene 2007, 27, 2897–2909. [Google Scholar] [CrossRef]
- Lee, J.; Kotliarova, S.; Kotliarov, Y.; Li, A.; Su, Q.; Donin, N.M.; Pastorino, S.; Purow, B.W.; Christopher, N.; Zhang, W.; et al. Tumor stem cells derived from glioblastomas cultured in bFGF and EGF more closely mirror the phenotype and genotype of primary tumors than do serum-cultured cell lines. Cancer Cell 2006, 9, 391–403. [Google Scholar] [CrossRef] [Green Version]
- Nakahata, A.M.; Suzuki, D.E.; Rodini, C.O.; Pereira, M.C.; Janjoppi, L.; Okamoto, O.K. Human glioblastoma cells display mesenchymal stem cell features and form intracranial tumors in immunocompetent rats. J. Stem Cells 2011, 5, 103–111. [Google Scholar]
- Hossain, A.; Gumin, J.; Gao, F.; Figueroa, J.; Shinojima, N.; Takezaki, T.; Priebe, W.; Villarreal, D.; Kang, S.-G.; Joyce, C.; et al. Mesenchymal stem cells isolated from human gliomas increase proliferation and maintain stemness of glioma stem cells through the IL-6/gp130/stat3 pathway. Stem Cells 2015, 33, 2400–2415. [Google Scholar] [CrossRef] [PubMed] [Green Version]
- Appaix, F. Brain mesenchymal stem cells: The other stem cells of the brain? World J. Stem Cells 2014, 6, 134. [Google Scholar] [CrossRef] [PubMed]
- Kyurkchiev, D. Secretion of immunoregulatory cytokines by mesenchymal stem cells. World J. Stem Cells 2014, 6, 552. [Google Scholar] [CrossRef] [PubMed]
- Inoue, K.; Fukuhara, H.; Yamamoto, S.; Karashima, T.; Kurabayashi, A.; Furihata, M.; Hanazaki, K.; Lai, H.W.; Ogura, S.I. Current status of photodynamic technology for Urothelial Cancer. Cancer Sci. 2021, 113, 392–398. [Google Scholar] [CrossRef]
- Hagiya, Y.; Fukuhara, H.; Matsumoto, K.; Endo, Y.; Nakajima, M.; Tanaka, T.; Okura, I.; Kurabayashi, A.; Furihata, M.; Inoue, K.; et al. Expression levels of PEPT1 and ABCG2 play key roles in 5-aminolevulinic acid (ala)-induced tumor-specific protoporphyrin IX (PPIX) accumulation in bladder cancer. Photodiagnosis Photodyn. Ther. 2013, 10, 288–295. [Google Scholar] [CrossRef]
- Allison, R.R.; Moghissi, K. Photodynamic therapy (PDT): PDT mechanisms. Clin. Endosc. 2013, 46, 24. [Google Scholar] [CrossRef]
- Sadahiro Kaneko, S.; Sadao Kaneko, S. Fluorescence-Guided Resection of Malignant Glioma with 5-ALA. IJBM Int. J. Biomed. Imaging 2016, 2016, 6135293. [Google Scholar]
- Hosmann, A.; Millesi, M.; Wadiura, L.I.; Kiesel, B.; Mercea, P.A.; Mischkulnig, M.; Borkovec, M.; Furtner, J.; Roetzer, T.; Wolfsberger, S.; et al. 5-ala fluorescence is a powerful prognostic marker during surgery of low-grade gliomas (who grade ii)—Experience at two specialized centers. Cancers 2021, 13, 2540. [Google Scholar] [CrossRef]
- Sun, R.; Cuthbert, H.; Watts, C. Fluorescence-guided surgery in the surgical treatment of gliomas: Past, present and future. Cancers 2021, 13, 3508. [Google Scholar] [CrossRef]
- Malik, Z. Fundamentals of 5-aminolevulinic acid photodynamic therapy and diagnosis: An overview. Transl. Biophotonics 2020, 2, e201900022. [Google Scholar] [CrossRef] [Green Version]
- Stepp, H.; Stummer, W. 5-Ala in the management of malignant glioma. Lasers Surg. Med. 2018, 50, 399–419. [Google Scholar] [CrossRef] [PubMed] [Green Version]
- Kwiatkowski, S.; Knap, B.; Przystupski, D.; Saczko, J.; Kędzierska, E.; Knap-Czop, K.; Kotlińska, J.; Michel, O.; Kotowski, K.; Kulbacka, J. Photodynamic therapy—Mechanisms, photosensitizers and combinations. Biomed. Pharmacother. 2018, 106, 1098–1107. [Google Scholar] [CrossRef] [PubMed]
- Borisova, E.G.; Kyurkchiev, D.; Minkin, K.; Semyachkina-Glushkovskaya, O.; Genova-Hristova, T.; Tumangelova-Yuzeir, K.; Angelov, I. Evaluation of photodynamic treatment efficiency on glioblastoma cells received from malignant lesions: Initial studies. In Proceedings of the Saratov Fall Meeting 2017: Optical Technologies in Biophysics and Medicine XIX 2018, Saratov, Russia, 26–30 September 2017. [Google Scholar]
- Nugud, A.; Sandeep, D.; El-Serafi, A.T. Two faces of the coin: Minireview for dissecting the role of reactive oxygen species in stem cell potency and lineage commitment. J. Adv. Res. 2018, 14, 73–79. [Google Scholar] [CrossRef] [PubMed]
- Bigarella, C.L.; Liang, R.; Ghaffari, S. Stem Cells and the impact of Ros Signaling. Development 2014, 141, 4206–4218. [Google Scholar] [CrossRef] [PubMed] [Green Version]
- Quinlan, C.L.; Treberg, J.R.; Perevoshchikova, I.V.; Orr, A.L.; Brand, M.D. Native rates of superoxide production from multiple sites in isolated mitochondria measured using endogenous reporters. Free. Radic. Biol. Med. 2012, 53, 1807–1817. [Google Scholar] [CrossRef] [Green Version]
- Sena, L.A.; Chandel, N.S. Physiological roles of mitochondrial reactive oxygen species. Mol. Cell 2012, 48, 158–167. [Google Scholar] [CrossRef] [Green Version]
- Piccirillo, S.G.; Dietz, S.; Madhu, B.; Griffiths, J.; Price, S.J.; Collins, V.P.; Watts, C. Fluorescence-guided surgical sampling of glioblastoma identifies phenotypically distinct tumour-initiating cell populations in the tumour mass and margin. Br. J. Cancer 2012, 107, 462–468. [Google Scholar] [CrossRef] [Green Version]
- Carro, M.S.; Lim, W.K.; Alvarez, M.J.; Bollo, R.J.; Zhao, X.; Snyder, E.Y.; Sulman, E.P.; Anne, S.L.; Doetsch, F.; Colman, H.; et al. The transcriptional network for mesenchymal transformation of brain tumours. Nature 2009, 463, 318–325. [Google Scholar] [CrossRef] [Green Version]
- Quinn, L.M.; Hannan, R.D. MLK4 activates the NF-ΚB network to drive mesenchymal transition in glioblastoma. Transl. Cancer Res. 2016, 5, S1033–S1038. [Google Scholar] [CrossRef]
- Molina, E.S.; Pillat, M.M.; Moura-Neto, V.; Lah, T.T.; Ulrich, H. Glioblastoma stem-like cells: Approaches for isolation and characterization. J. Cancer Stem Cell Res. 2014, 1, 1. [Google Scholar] [CrossRef]
- Blondheim, N.R.; Levy, Y.S.; Ben-Zur, T.; Burshtein, A.; Cherlow, T.; Kan, I.; Barzilai, R.; Bahat-Stromza, M.; Barhum, Y.; Bulvik, S.; et al. Human mesenchymal stem cells express neural genes, suggesting a neural predisposition. Stem Cells Dev. 2006, 15, 141–164. [Google Scholar] [CrossRef]
- Foudah, D.; Monfrini, M.; Donzelli, E.; Niada, S.; Brini, A.T.; Orciani, M.; Tredici, G.; Miloso, M. Expression of neural markers by undifferentiated mesenchymal-like stem cells from different sources. J. Immunol. Res. 2014, 2014, 987678. [Google Scholar] [CrossRef] [PubMed] [Green Version]
- Phinney, D.G.; Prockop, D.J. Concise review: Mesenchymal STEM/multipotent stromal cells: The state of transdifferentiation and modes of tissue repair—Current views. Stem Cells 2007, 25, 2896–2902. [Google Scholar] [CrossRef] [PubMed]
- Fomchenko, E.I.; Dougherty, J.D.; Helmy, K.Y.; Katz, A.M.; Pietras, A.; Brennan, C.; Huse, J.T.; Milosevic, A.; Holland, E.C. Recruited cells can become transformed and overtake PDGF-induced murine gliomas in vivo during tumor progression. PLoS ONE 2011, 6, e20605. [Google Scholar] [CrossRef] [Green Version]
- Birnbaum, T.; Hildebrandt, J.; Nuebling, G.; Sostak, P.; Straube, A. Glioblastoma-dependent differentiation and angiogenic potential of human mesenchymal stem cells in vitro. J. Neuro-Oncol. 2011, 105, 57–65. [Google Scholar] [CrossRef]
- Cairns, R.A.; Harris, I.S.; Mak, T.W. Regulation of cancer cell metabolism. Nat. Rev. Cancer 2011, 11, 85–95. [Google Scholar] [CrossRef] [Green Version]
- Shi, Y.; Wang, S.; Yang, R.; Wang, Z.; Zhang, W.; Liu, H.; Huang, Y. Ros promote hypoxia-induced keratinocyte epithelial-mesenchymal transition by inducing SOX2 expression and subsequent activation of Wnt/β-catenin. Oxidative Med. Cellular Longevity 2022, 2022, 1084006. [Google Scholar] [CrossRef] [PubMed]
- Shadel, G.S.; Horvath, T.L. Mitochondrial Ros signaling in organismal homeostasis. Cell 2015, 163, 560–569. [Google Scholar] [CrossRef] [Green Version]
- Zaharieva, L.; Borisova, E.; Kyurkchiev, D.; Tumangelova-Yuzeir, K.; Ivanova-Todorova, E.; Angelov, I.; Genova, T.; Kolev, B.; Gisbrecht, A.; Avramov, L.; et al. Photodiagnostics and photody-namic treatment of stem cells cultivated from human glioblastoma tumors. J. Phys. Conf. Ser. 2021, 1859, 012047. [Google Scholar] [CrossRef]
- Garrison, B.S.; Rossi, D.J. Reactive oxygen species resulting from mitochondrial mutation diminishes stem and progenitor cell function. Cell Metab. 2012, 15, 2–3. [Google Scholar] [CrossRef] [Green Version]
- Mori, H.; Yoshida, Y.; Hara, M. Neural stem/progenitor cells damaged by reactive oxygen species evolved in photosensitizing reaction. Neurosci. Lett. 2011, 493, 24–28. [Google Scholar] [CrossRef] [PubMed]
- Shi, Y.; Hu, Y.; Lv, C.; Tu, G. Effects of reactive oxygen species on differentiation of bone marrow mesenchymal stem cells. Ann. Transplant. 2016, 21, 695–700. [Google Scholar] [CrossRef] [PubMed]
- Gürsel, D.B.; Shin, B.J.; Burkhardt, J.-K.; Kesavabhotla, K.; Schlaff, C.D.; Boockvar, J.A. Glioblastoma stem-like cells—Biology and therapeutic implications. Cancers 2011, 3, 2655–2666. [Google Scholar] [CrossRef] [Green Version]
- Gilbert, C.A.; Ross, A.H. Cancer stem cells: Cell culture, markers, and targets for new therapies. J. Cell. Biochem. 2009, 108, 1031–1038. [Google Scholar] [CrossRef] [PubMed] [Green Version]
- Nahirnyj, A.; Livne-Bar, I.; Guo, X.; Sivak, J.M. Ros detoxification and proinflammatory cytokines are linked by p38 MAPK signaling in a model of mature astrocyte activation. PLoS ONE 2013, 8, e83049. [Google Scholar] [CrossRef] [PubMed] [Green Version]
- Zhu, G.; Wang, X.; Chen, L.; Lenahan, C.; Fu, Z.; Fang, Y.; Yu, W. Crosstalk between the oxidative stress and glia cells after stroke: From mechanism to therapies. Front. Immunol. 2022, 13, 852416. [Google Scholar] [CrossRef] [PubMed]
- González, A.; Pariente, J.A.; Salido, G.M. Ethanol stimulates ROS generation by mitochondria through ca2+ mobilization and increases GFAP content in rat hippocampal astrocytes. Brain Res. 2007, 1178, 28–37. [Google Scholar] [CrossRef]
- Sarkar, A.; Hochedlinger, K. The Sox family of transcription factors: Versatile regulators of STEM and progenitor cell fate. Cell Stem Cell 2013, 12, 15–30. [Google Scholar] [CrossRef] [Green Version]
- Weina, K.; Utikal, J. Sox2 and cancer: Current research and its implications in the clinic. Clin. Transl. Med. 2014, 3, 19. [Google Scholar] [CrossRef] [Green Version]
- Novak, D.; Hüser, L.; Elton, J.J.; Umansky, V.; Altevogt, P.; Utikal, J. Sox2 in development and Cancer Biology. Semin. Cancer Biol. 2020, 67, 74–82. [Google Scholar] [CrossRef]
- Kretsovali, A. Dissecting the role of Sox2 in Stemness Regulation and regenerative medicine. J. Stem Cell Res. Transplant. 2017, 4, 1026. [Google Scholar] [CrossRef]
- Wang, P.; Wan, W.-W.; Xiong, S.-L.; Feng, H.; Wu, N. Cancer stem-like cells can be induced through dedifferentiation under hypoxic conditions in glioma, Hepatoma and Lung Cancer. Cell Death Discov. 2017, 3, 16105. [Google Scholar] [CrossRef] [PubMed] [Green Version]
- Chaudhari, P.; Ye, Z.; Jang, Y.-Y. Roles of reactive oxygen species in the fate of Stem Cells. Antioxid. Redox Signal. 2014, 20, 1881–1890. [Google Scholar] [CrossRef] [PubMed] [Green Version]
- Gholizadeh, M.; Doustvandi, M.A.; Mohammadnejad, F.; Shadbad, M.A.; Tajalli, H.; Brunetti, O.; Argentiero, A.; Silvestris, N.; Baradaran, B. Photodynamic therapy with zinc phthalocyanine inhibits the stemness and development of colorectal cancer: Time to overcome the challenging barriers? Molecules 2021, 26, 6877. [Google Scholar] [CrossRef]
- He, J.; Hu, Y.; Hu, M.; Li, B. Development of PD-1/PD-L1 pathway in tumor immune microenvironment and treatment for non-small cell lung cancer. Sci. Rep. 2015, 5, 13110. [Google Scholar] [CrossRef] [Green Version]
- Bardhan, K.; Anagnostou, T.; Boussiotis, V.A. The PD1:PD-L1/2 pathway from discovery to clinical implementation. Front. Immunol. 2016, 7, 550. [Google Scholar] [CrossRef] [PubMed] [Green Version]
- Chamoto, K.; Al-Habsi, M.; Honjo, T. Role of PD-1 in immunity and diseases. Curr. Top. Microbiol. Immunol. 2017, 410, 75–97. [Google Scholar]
- Dong, P.; Xiong, Y.; Yue, J.; Hanley, S.J.; Watari, H. Tumor-intrinsic PD-L1 signaling in cancer initiation, development and treatment: Beyond immune evasion. Front. Oncol. 2018, 8, 386. [Google Scholar] [CrossRef] [PubMed] [Green Version]
- Qiu, X.Y.; Hu, D.X.; Chen, W.-Q.; Chen, R.Q.; Qian, S.R.; Li, C.Y.; Li, Y.J.; Xiong, X.X.; Liu, D.; Pan, F.; et al. PD-L1 confers glioblastoma multiforme malignancy via Ras binding and Ras/Erk/EMT Activation. Biochim. Et Biophys. Acta (BBA)-Mol. Basis Dis. 2018, 1864, 1754–1769. [Google Scholar] [CrossRef]
- Zhong, F.; Cheng, X.; Sun, S.; Zhou, J. Transcriptional activation of PD-L1 by SOX2 contributes to the proliferation of hepatocellular carcinoma cells. Oncol. Rep. 2017, 37, 3061–3067. [Google Scholar] [CrossRef] [PubMed] [Green Version]
- Chinnadurai, R.; Copland, I.B.; Patel, S.R.; Galipeau, J. Ido-independent suppression of T cell effector function by IFN-γ–licensed human mesenchymal stromal cells. J. Immunol. 2014, 192, 1491–1501. [Google Scholar] [CrossRef] [PubMed] [Green Version]
- Bailly, C. Regulation of PD-L1 expression on cancer cells with Ros-modulating drugs. Life Sci. 2020, 246, 117403. [Google Scholar] [CrossRef] [PubMed]
- Zhou, L.; Cha, G.; Chen, L.; Yang, C.; Xu, D.; Ge, M. hif1α/PD-L1 axis mediates hypoxia-induced cell apoptosis and tumor progression in follicular thyroid carcinoma. OncoTargets Ther. 2019, 12, 6461–6470. [Google Scholar] [CrossRef] [PubMed] [Green Version]
- Tung, J.-N.; Lin, P.-L.; Wang, Y.-C.; Wu, D.-W.; Chen, C.-Y.; Lee, H. PD-L1 confers resistance to EGFR mutation-independent tyrosine kinase inhibitors in non-small cell lung cancer via upregulation of Yap1 expression. Oncotarget 2017, 9, 4637–4646. [Google Scholar] [CrossRef] [PubMed] [Green Version]
- Liu, K.; Du, S.; Gao, P.; Zheng, J. Verteporfin suppresses the proliferation, epithelial-mesenchymal transition and stemness of head and neck squamous carcinoma cells via inhibiting YAP1. J. Cancer 2019, 10, 4196–4207. [Google Scholar] [CrossRef] [Green Version]
- Dominici, M.; Le Blanc, K.; Mueller, I.; Slaper-Cortenbach, I.; Marini, F.C.; Krause, D.S.; Deans, R.J.; Keating, A.; Prockop, D.J.; Horwitz, E.M. Minimal criteria for defining multipotent mesenchymal stromal cells. The International Society for Cellular Therapy Position Statement. Cytotherapy 2006, 8, 315–317. [Google Scholar] [CrossRef]
- Alvarez, Y.; Briones, A.M.; Balfagón, G.; Alonso, M.J.; Salaices, M. Hypertension increases the participation of vasoconstrictor prostanoids from cyclooxygenase-2 in phenylephrine responses. J. Hypertens. 2005, 23, 767–777. [Google Scholar] [CrossRef]
- Adeagbo, A.S.O.; Zhang, X.; Patel, D.; Joshua, I.G.; Wang, Y.; Sun, X.; Igbo, I.N.; Oriowo, M.A. Cyclo-oxygenase-2, endo-thelium and aortic reactivity during deoxycorticosterone acetate salt-induced hypertension. J. Hypertens. 2005, 23, 1025–1036. [Google Scholar] [CrossRef]
- Jia, Z.; Guo, X.; Zhang, H.; Wang, M.-H.; Dong, Z.; Yang, T. Microsomal prostaglandin synthase-1–derived prostaglandin E 2 protects against angiotensin II–induced hypertension via inhibition of oxidative stress. Hypertension 2008, 52, 952–959. [Google Scholar] [CrossRef] [Green Version]
- Jia, Z.; Aoyagi, T.; Yang, T. MPGES-1 protects against DOCA-salt hypertension via inhibition of oxidative stress or stimulation of NO/cgmp. Hypertension 2010, 55, 539–546. [Google Scholar] [CrossRef]
- Falk-Mahapatra, R.; Gollnick, S.O. Photodynamic therapy and immunity: An update. Photochem. Photobiol. 2020, 96, 550–559. [Google Scholar] [CrossRef] [PubMed] [Green Version]
- Hirschberg, H.; Sun, C.H.; Tromberg, B.J.; Yeh, A.T.; Madsen, S.J. Enhanced cytotoxic effects of 5-aminolevulinic acid-mediated photodynamic therapy by concurrent hyperthermia in glioma spheroids. J. Neuro-Oncol. 2004, 70, 289–299. [Google Scholar] [CrossRef] [PubMed] [Green Version]
- Neumann, L.M.; Beseoglu, K.; Slotty, P.J.; Senger, B.; Kamp, M.A.; Hänggi, D.; Steiger, H.J.; Cornelius, J.F. Efficacy of 5-aminolevulinic acid based photodynamic therapy in pituitary adenomas—Experimental study on rat and human cell cultures. Photodiagnosis Photodyn. Ther. 2016, 14, 77–83. [Google Scholar] [CrossRef] [PubMed]


Disclaimer/Publisher’s Note: The statements, opinions and data contained in all publications are solely those of the individual author(s) and contributor(s) and not of MDPI and/or the editor(s). MDPI and/or the editor(s) disclaim responsibility for any injury to people or property resulting from any ideas, methods, instructions or products referred to in the content. |
© 2023 by the authors. Licensee MDPI, Basel, Switzerland. This article is an open access article distributed under the terms and conditions of the Creative Commons Attribution (CC BY) license (https://creativecommons.org/licenses/by/4.0/).
Share and Cite
Tumangelova-Yuzeir, K.; Minkin, K.; Angelov, I.; Ivanova-Todorova, E.; Kurteva, E.; Vasilev, G.; Arabadjiev, J.; Karazapryanov, P.; Gabrovski, K.; Zaharieva, L.; et al. Alteration of Mesenchymal Stem Cells Isolated from Glioblastoma Multiforme under the Influence of Photodynamic Treatment. Curr. Issues Mol. Biol. 2023, 45, 2580-2596. https://doi.org/10.3390/cimb45030169
Tumangelova-Yuzeir K, Minkin K, Angelov I, Ivanova-Todorova E, Kurteva E, Vasilev G, Arabadjiev J, Karazapryanov P, Gabrovski K, Zaharieva L, et al. Alteration of Mesenchymal Stem Cells Isolated from Glioblastoma Multiforme under the Influence of Photodynamic Treatment. Current Issues in Molecular Biology. 2023; 45(3):2580-2596. https://doi.org/10.3390/cimb45030169
Chicago/Turabian StyleTumangelova-Yuzeir, Kalina, Krassimir Minkin, Ivan Angelov, Ekaterina Ivanova-Todorova, Ekaterina Kurteva, Georgi Vasilev, Jeliazko Arabadjiev, Petar Karazapryanov, Kaloyan Gabrovski, Lidia Zaharieva, and et al. 2023. "Alteration of Mesenchymal Stem Cells Isolated from Glioblastoma Multiforme under the Influence of Photodynamic Treatment" Current Issues in Molecular Biology 45, no. 3: 2580-2596. https://doi.org/10.3390/cimb45030169