Article

SRY-Related Transcription Factors in Head and Neck Squamous Cell Carcinomas: In Silico Based Analysis

by
Tomasz Kolenda
1,2,*,
Zuzanna Graczyk
3,4,
Barbara Żarska
3,
Wojciech Łosiewski
3,
Mikołaj Smolibowski
3,
Adrian Wartecki
3,
Joanna Kozłowska-Masłoń
1,2,5,
Kacper Guglas
1,2,6,
Anna Florczak
3,7,
Urszula Kazimierczak
3,7,
Anna Teresiak
1,2 and
Katarzyna Lamperska
1,2
1
Laboratory of Cancer Genetics, Greater Poland Cancer Centre, Garbary 15, 61-866 Poznan, Poland
2
Research and Implementation Unit, Greater Poland Cancer Centre, Garbary 15, 61-866 Poznan, Poland
3
Department of Cancer Immunology, Poznan University of Medical Sciences, 8 Rokietnicka Street, 60-806 Poznan, Poland
4
Institute of Human Genetics, Polish Academy of Sciences, Strzeszynska 32, 60-479 Poznan, Poland
5
Institute of Human Biology and Evolution, Faculty of Biology, Adam Mickiewicz University, Uniwersytetu Poznańskiego 6, 61-614 Poznan, Poland
6
Postgraduate School of Molecular Medicine, Medical University of Warsaw, Żwirki i Wigury 61, 02-091 Warsaw, Poland
7
Department of Diagnostics and Cancer Immunology, Greater Poland Cancer Centre, Garbary 15, 61-688 Poznan, Poland
*
Author to whom correspondence should be addressed.
Curr. Issues Mol. Biol. 2023, 45(12), 9431-9449; https://doi.org/10.3390/cimb45120592
Submission received: 7 July 2023 / Revised: 15 November 2023 / Accepted: 17 November 2023 / Published: 24 November 2023
(This article belongs to the Special Issue Adhesion, Metastasis and Inhibition of Cancer Cells)

Abstract

:
Head and neck squamous cell carcinoma (HNSCC) is the sixth leading cancer and the fifth cause of cancer-related deaths worldwide with a poor 5-year survival. SOX family genes play a role in the processes involved in cancer development such as epithelial–mesenchymal transition (EMT), the maintenance of cancer stem cells (CSCs) and the regulation of drug resistance. We analyzed the expression of SOX2-OT, SOX6, SOX8, SOX21, SOX30 and SRY genes in HNSCC patients using the Cancer Genome Atlas (TCGA) and Gene Expression Omnibus (GEO) datasets, to assess their biological role and their potential utility as biomarkers. We demonstrated statistically significant differences in expression between normal and primary tumor tissues for SOX6, SOX8, SOX21 and SOX30 genes and pointed to SOX6 as the one that met the independent diagnostic markers criteria. SOX21 or SRY alone, or the panel of six SRY-related genes, could be used to estimate patient survival. SRY-related genes are positively correlated with immunological processes, as well as with keratinization and formation of the cornified envelope, and negatively correlated with DNA repair and response to stress. Moreover, except SRY, all analyzed genes were associated with a different tumor composition and immunological profiles. Based on validation results, the expression of SOX30 is higher in HPV(+) patients and is associated with patients’ survival. SRY-related transcription factors have vast importance in HNSCC biology. SOX30 seems to be a potential biomarker of HPV infection and could be used as a prognostic marker, but further research is required to fully understand the role of SOX family genes in HNSCC.

1. Introduction

Head and neck squamous cell carcinoma (HNSCC) is localized in the oral cavity, oropharynx, hypopharynx and nasopharynx [1,2,3]. The most important risk factors are tobacco use, alcohol consumption and human papillomavirus (HPV) infection [3,4]. HNSCC is the sixth leading cancer and the fifth cause of cancer-related deaths worldwide [3,4], with 600,000 new cases every year. HNSCC has a poor 5-year survival (40–60%), causing 2% of all deaths in men (data for larynx cancers) in the Greater Poland Region [1,2]. Treatment is based on surgery, radiation and chemotherapy [1]. HNSCC can be divided into two main groups, HPV-positive and HPV-negative, and such a status constitutes a significant prognostic factor. HPV(+) cancers are mainly caused by oral sex and mainly located in the oropharynx and HPV(−) cancers are mostly caused by smoking and excessive alcohol use and they have different molecular features [4,5,6,7].
Based on gene expression profiles, the four subtypes of HNSCC have been distinguished: basal (31%), mesenchymal (27%), atypical (24%) and classical (18% of cases). They differ clinically, histologically and molecularly. Genetic heterogeneity results in the activation of protein-coding oncogenes, e.g., EGFR and PIK3CA, and a loss of function in tumor-suppressor genes, e.g., p53 and p16 [4]. In spite of the identification of the genes involved in the development and prognosis of HNSCC [8,9], no dramatic changes in recovery rates have been observed. However, these protein-coding transcripts constitute only about 2% of the human genome, and most of the genome consists of the non-coding genes which are responsible for regulation of cellular processes [10,11,12]. Among them, we can distinguish long non-coding RNAs (lncRNAs) which are about 200 nucleotide-length transcripts constituting more than 80% of the eukaryotic transcriptome [11]. Many lncRNAs are dysregulated in some cancers and can be used as biomarkers [13,14,15,16]. lncRNAs participate in stem cell differentiation by regulating the pluripotency and are involved in tumorigenesis as tumor oncogenes or suppressors regulating cancer-related signaling pathways [17].
The SOX family is the SRY-related transcription factor family and includes 30 members [18]. These proteins are involved in several growth and development processes, e.g., embryonic development, sex determination, stem cell formation and angiogenesis [19]. SOX genes also have a role in cancer development including important cancer-related processes such as epithelial–mesenchymal transition (EMT) and the maintenance of cancer stem cells (CSCs) population, as well as the regulation of drug resistance [20]. Moreover, long non-coding RNAs associated with the SOX gene, such as SOX2 overlapping transcript (SOX2-OT), are dysregulated in various tumors and function as oncogenes [21]. The role of SRY-related transcription factors and their non-coding-related transcripts is not fully understood in the case of HNSCC. In spite of many different strategies for improving the diagnosis [22,23,24] and chemo- [25] and/or radiotherapy treatment of HNSCC patients, an improvement in patients’ outcomes is still challenging [26,27,28]. Probably, treatment personalization based on a molecular transcription profile including both coding and non-coding genes could help in overcoming the high mortality rate.
In this study, the selected SRY-related transcription factors, SOX2-OT, SOX6, SOX8, SOX21, SOX30 and SRY, were analyzed, and their biological role and their potential utility as biomarkers for HNSCC were tested.

2. Materials and Methods

2.1. TGCA Data

The TCGA expression and clinical data of SOX2-OT, SOX6, SOX8, SOX21, SOX30 and SRY were downloaded from cBioPortal and from the Santa Cruz University of California dataset (Head and Neck Squamous Cell Carcinoma, TCGA, dataset: gene expression RNAseq—IlluminaHiSeq pancan-normalized; RNA expression pan-cancer-normalized log2(norm_count + 1); accessed on 1 November 2021 from https://xenabrowser.net/) and from the UALCAN databases (http://ualcan.path.uab.edu; accessed on 1 November 2021) [29,30]. All data are available online; access is unrestricted and does not require patient’s consent or other permissions. The use of the data does not violate the rights of any person or any institution.

2.2. Data Analysis

The expression levels of SOX2-OT, SOX6, SOX8, SOX21, SOX30 and SRY genes were analyzed and correlated with clinicopathological parameters: age (<61 vs. >61), smoking category (No vs. Yes and Ex-smoker), gender (women vs. men), alcohol history (negative vs. positive), cancer stage (I + II vs. III + IV), T-stage (T1 + T2 vs. T3 + T4), N-stage (N0 + N1 vs. N2 + N3), grade (G1 + G2 vs. G3 + G4), perineural invasion (negative vs. positive), lymph node neck dissection (negative vs. positive), lymphovascular invasion (negative vs. positive) and HPV in p16 test (negative vs. positive) in all localizations of the HNSCC samples as described previously [31,32]. The GEPIA2 tool was used to estimate the survival rates for patients taken for the TCGA using the mean of the SRY-related genes expression as the cut-off.

2.3. Gene Analysis

Association between SOX2-OT, SOX6, SOX8, SOX21, SOX30 and SRY expression levels was analyzed using the UALCAN database. Receiver operating characteristic (ROC) analysis with an area under the curve (AUC) estimation in a group of 43 adjacent-matched healthy and neoplastic tissues was applied to determine the utility of diagnostic markers for distinguishing healthy from cancer samples. Next, a correlation between expression levels of SOX2-OT, SOX6, SOX8, SOX21, SOX30 and SRY was obtained using the Spearman test (positive correlation: r > 0.3; negative correlation: r < −0.3) and a heatmap was created using Morpheus Software (https://software.broadinstitute.org/morpheus; accessed on 1 March 2021). Next, expression levels of SRY-related genes were checked depending on localizations in the oral cavity (n = 346), pharynx (n = 88) and larynx (n = 130) according to National Institutes of Health (NIH) classification.

2.4. Association of SRY-Related Transcripts in Context to Stromal and Immune Scores and Immune Profile

Tumor composition scores for this analysis were acquired from the ESTIMATE (https://bioinformatics.mdanderson.org/public-software/estimate/; accessed on 2 January 2021) database. Data from ESTIMATE contains information about the presence of stroma in tumor tissues (stromal score), representation inflation of immune cells in tumor tissues (immune score) and tumor purity (estimate score). We separated each gene expression group in two, low and high relative to average in all samples, as described previously [30,31,32,33,34].

2.5. Validation of the Results

We used the Gene Expression Omnibus (GEO) data repository, with GSE65858 [35] and GSE3292 [36] datasets to validate our results for SOX2-OT, SOX6, SOX8, SOX21, SOX30 and SRY genes. The expression levels of SRY-related transcripts were compared between HPV(−) and HPV(+), types of HPV and between an active infection and inactive infection. Next, we evaluated the differences between the expression levels of SRY-related transcripts and various clinicopathological parameters such as age, gender, smoking history, alcohol consumption, disease stage, T stage, N stage, cancer molecular clusters types and tumor localization. Next, we analyzed patients’ progression-free interval (PFI) and overall survival (OS) in all patients, only in the HPV(+) and only in the HPV(−) groups of patients, using the mean of expression in analyzed groups as a cut-off (low vs. high). The validation of the results was performed similarly to described previously [30]. The statistical analyses were performed as described in point 2.6.

2.6. Statistical Analysis

Statistical analyses were performed using GraphPad Prism 5/8 (GraphPad, San Diego, CA, USA). The Shapiro–Wilk normality test and Mann–Whitney U test were used for measuring SOX2-OT, SOX6, SOX8, SOX21, SOX30 and SRY levels (depending on clinical parameters). The expression in each of SOX2-OT, SOX6, SOX8, SOX21, SOX30 and SRY genes was compared depending on the location of the tumor using one-way ANOVA, obtained using the Tukey test. All TCGA data are presented as a median with SEM (standard error of the mean). Disease-free survival (PFS) and OS survival rates and statistics for data from the TCGA were generated using GEPIA2 tool. PFI and OS for data from GEO datasets were calculated using the log-rank (Mantel–Cox) test and the Gehan–Breslow–Wilcoxon test. In all analyses, p < 0.05 was used to determine statistical significance, as described previously [30,31,32,33,34].

3. Results

3.1. SOX Family Gene Expression Levels Distinguish between Healthy and Cancer Tissues

We observed statistically significant differences in the expression of SOX6, SOX8, SOX21 and SOX30 genes in healthy tissue vs. primary tumor samples. In all cases, except for SOX30, the expression of these genes was lower in cancer tissues compared to the healthy ones. No differences between tumor and normal tissues were indicated for SOX2-OT and SRY genes (p > 0.05), Figure 1A.
Next, receiver operating characteristic curve (ROC) analyses for SOX2-OT, SOX6, SOX8, SOX30 and SRY were performed to describe the potency of SRY-related genes to distinguish between healthy and cancerous samples. We showed that the analysis of the expression levels of SOX6, SOX8 and SRY correlated with the AUC (area under the curve) estimated to 0.6360, 0.7588 and 0.7188, respectively, p < 0.05. SOX2-OT, SOX21 and SOX30 did not meet the criteria of the diagnostic markers (p > 0.05, AUC < 0.6), Figure 1B.
To analyze the correlation between all SRY-related genes in HNSCC samples, the Spearman test was used. The results showed that SOX2-OT expression was positively correlated with SOX21 (R = 0.6153, p < 0.0001), and also, SOX6 expression was positively correlated with SOX21 (R = 0.3130, p < 0.0001). No correlations (p > 0.05) between SOX30 and SOX6, SOX30 and SRY or SRY and SOX2-OT were indicated, Figure 1C.

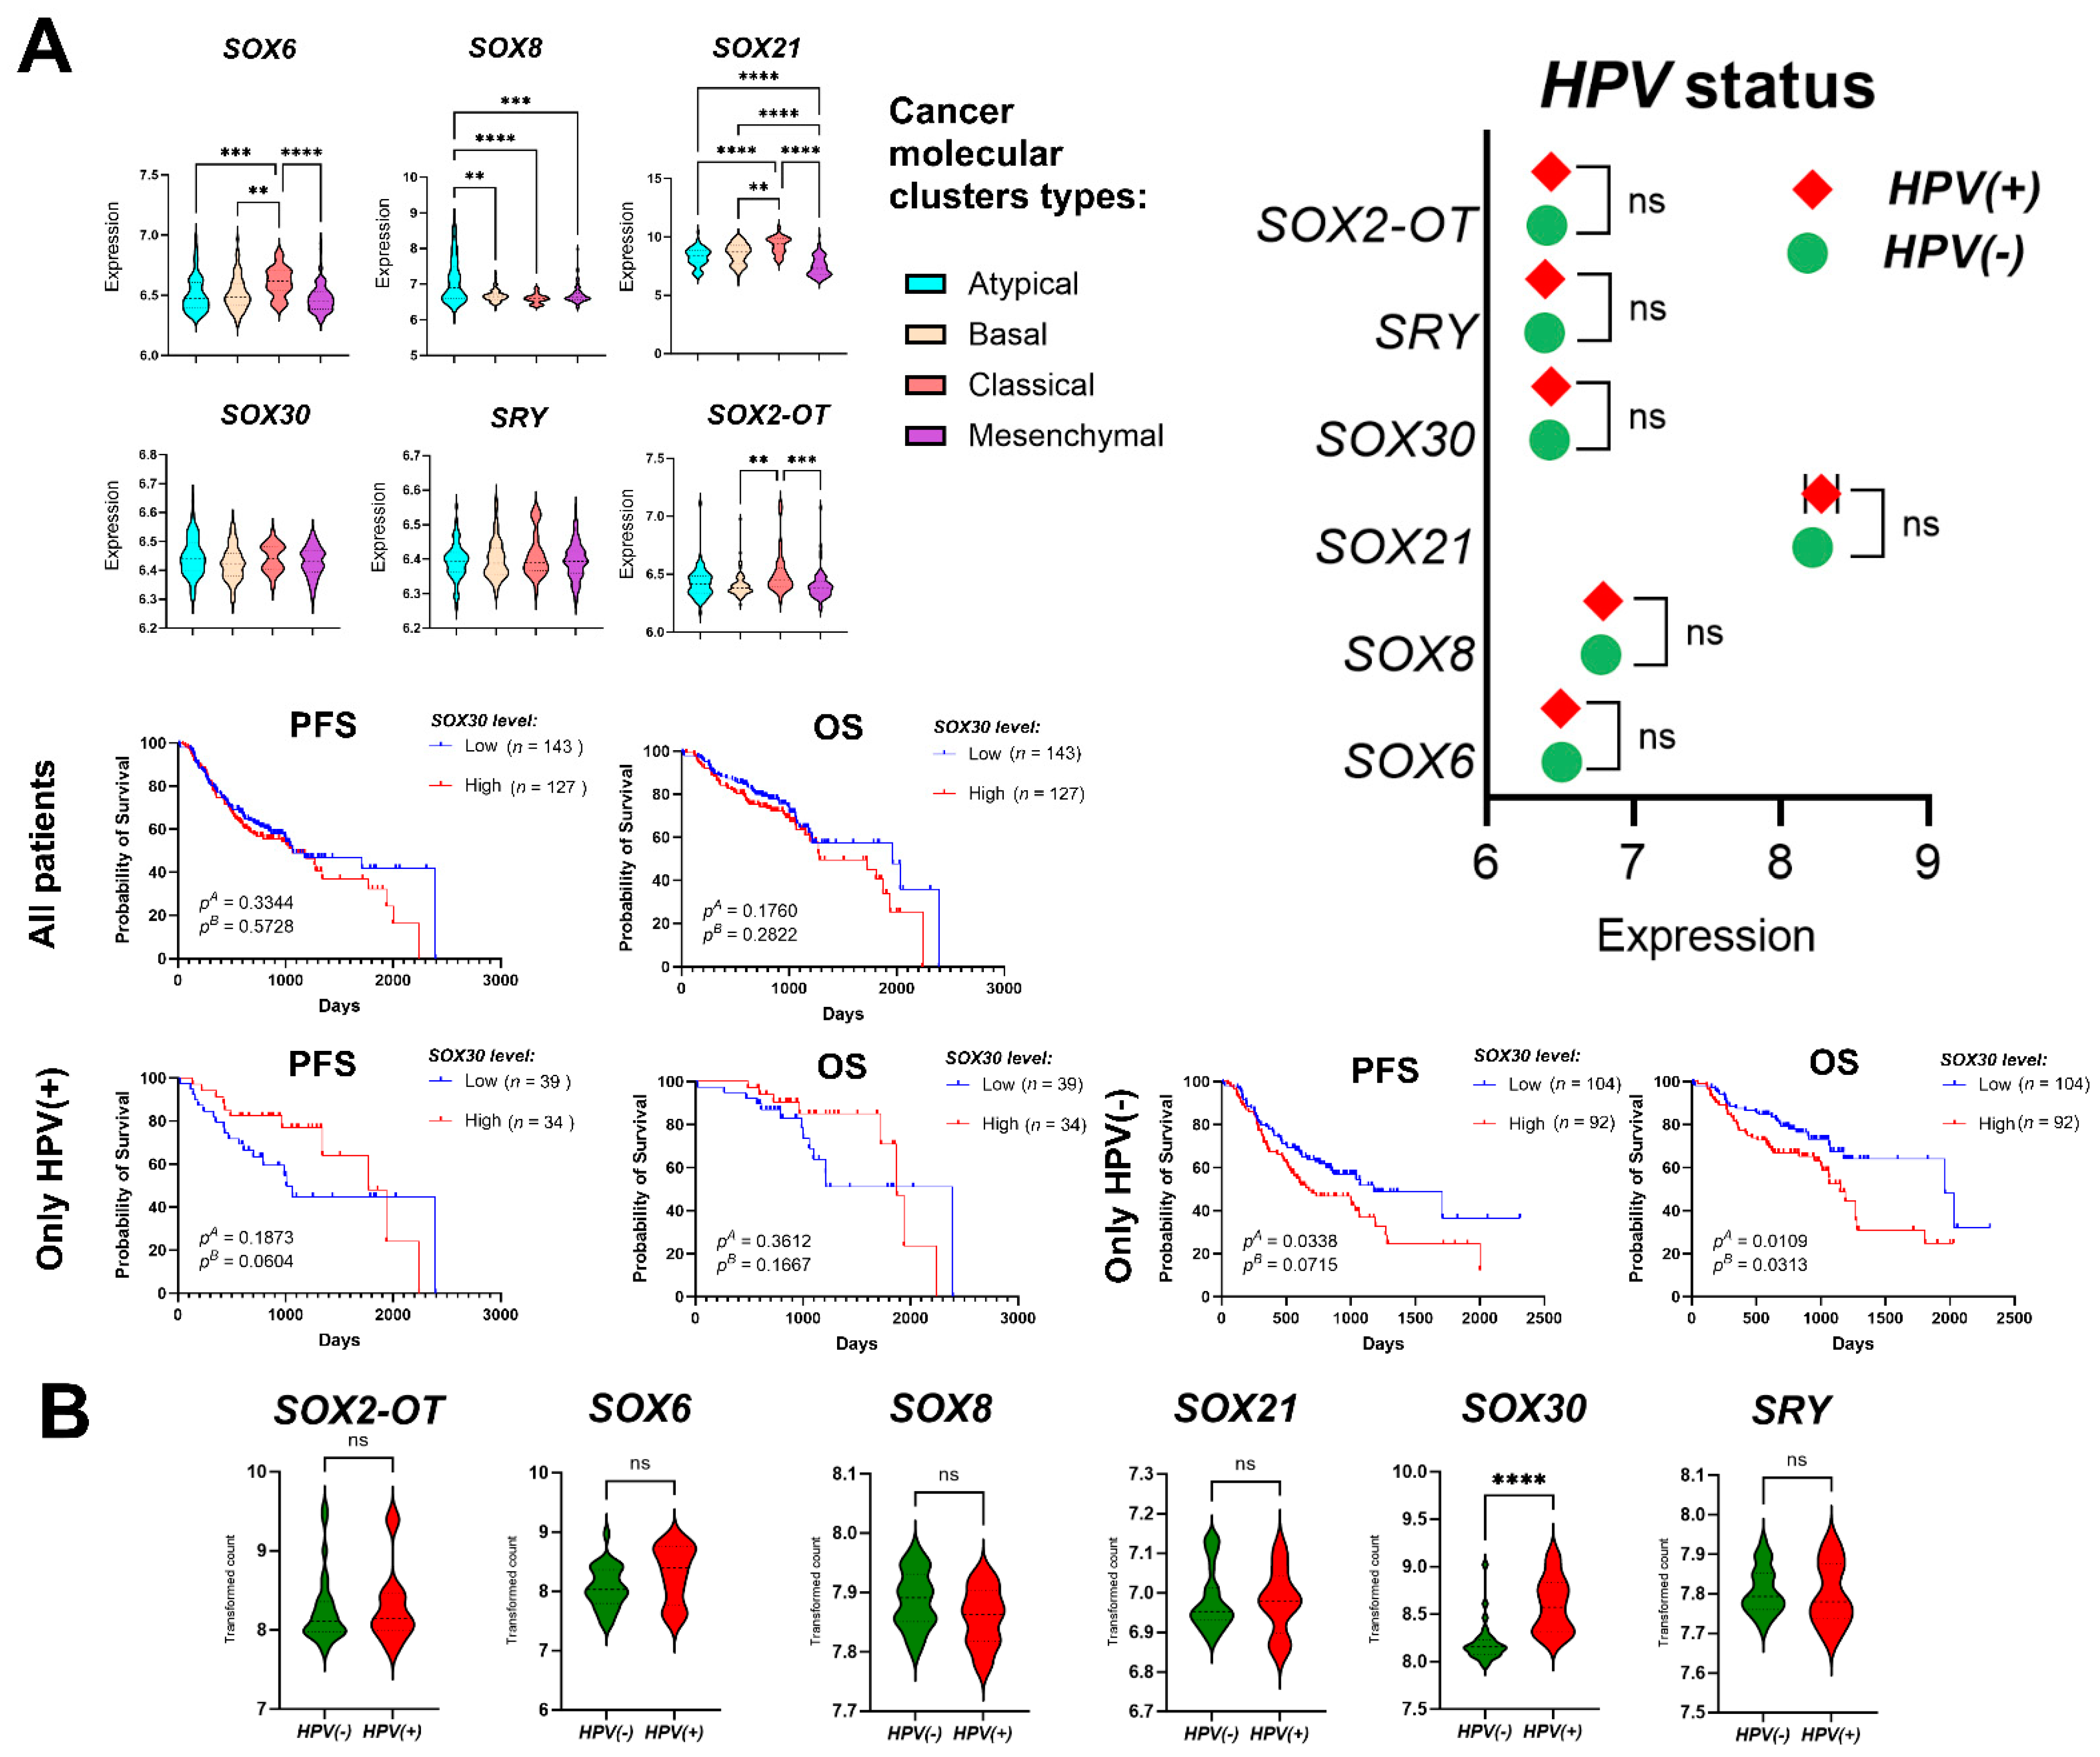
3.2. Expression Levels of SRY-Related Transcription Factors Depend on Tumor Localization

In our analyses, we divided the patients into three groups, oral cavity (n = 346), pharynx (n = 88) and larynx (n = 130), depending on the tumor localization based on the National Institutes of Health (NIH) classification. The gene expression in each group was compared for SOX2-OT, SOX6, SOX8, SOX21, SOX30 and SRY genes. For the oral vs. pharynx comparison, there were significant differences between expressions in all genes except SOX6 (p > 0.05). There were no significant differences between the pharynx and larynx in all genes other than SOX2-OT, SOX30 and SRY. Between the oral cavity and larynx, there were significant differences in SOX2-OT, SOX8 and SOX21, Figure 2.

3.3. Expression Levels of SRY-Related Transcription Factors Depend on Specific Clinicopathological Parameters

Differences in expression levels of all studied genes in HNSCC patients were analyzed in the context of selected clinicopathological parameters. In all parameters, the expression of at least one of the six studied genes showed a significant difference. SOX2-OT, SOX6, SOX8, SOX21 and SRY genes were connected with tobacco smoking; SOX2-OT, SOX6, SOX21 and SOX30- were connected with lymph node neck dissection and lymphovascular invasion; and SOX2-OT, SOX8 and SOX30 were connected with HPV in p16 test two with regard to gender (SOX21, SRY), cancer stage (SOX6, SOX21) and grade (SOX8, SOX30) and one gene with age (SRY), alcohol (SRY), T stage (SOX8) and N stage (SOX30). Data are summarized in detail in Table 1 and Table 2.

3.4. Higher Survival Rates Are Associated with High SOX21 and SRY Expression Levels

Patients were divided into two groups with low and high expression levels of the selected genes. The high expression group was distinguished from the low expression group on the basis of the median of all patients gene expression levels. For each gene, both groups had their overall survival and disease-free survival rates compared. There were no significant differences (p > 0.05) in any of the analyzed genes, except for disease-free survival in SOX21 and for overall survival for the SRY, which had a better survival rate when the expression of this gene was higher than the median. HNSCC patients with higher levels of the six examined SRY-related transcription factors have longer DFS and OS in comparison to the patients with lower levels of these transcripts, Figure 3.

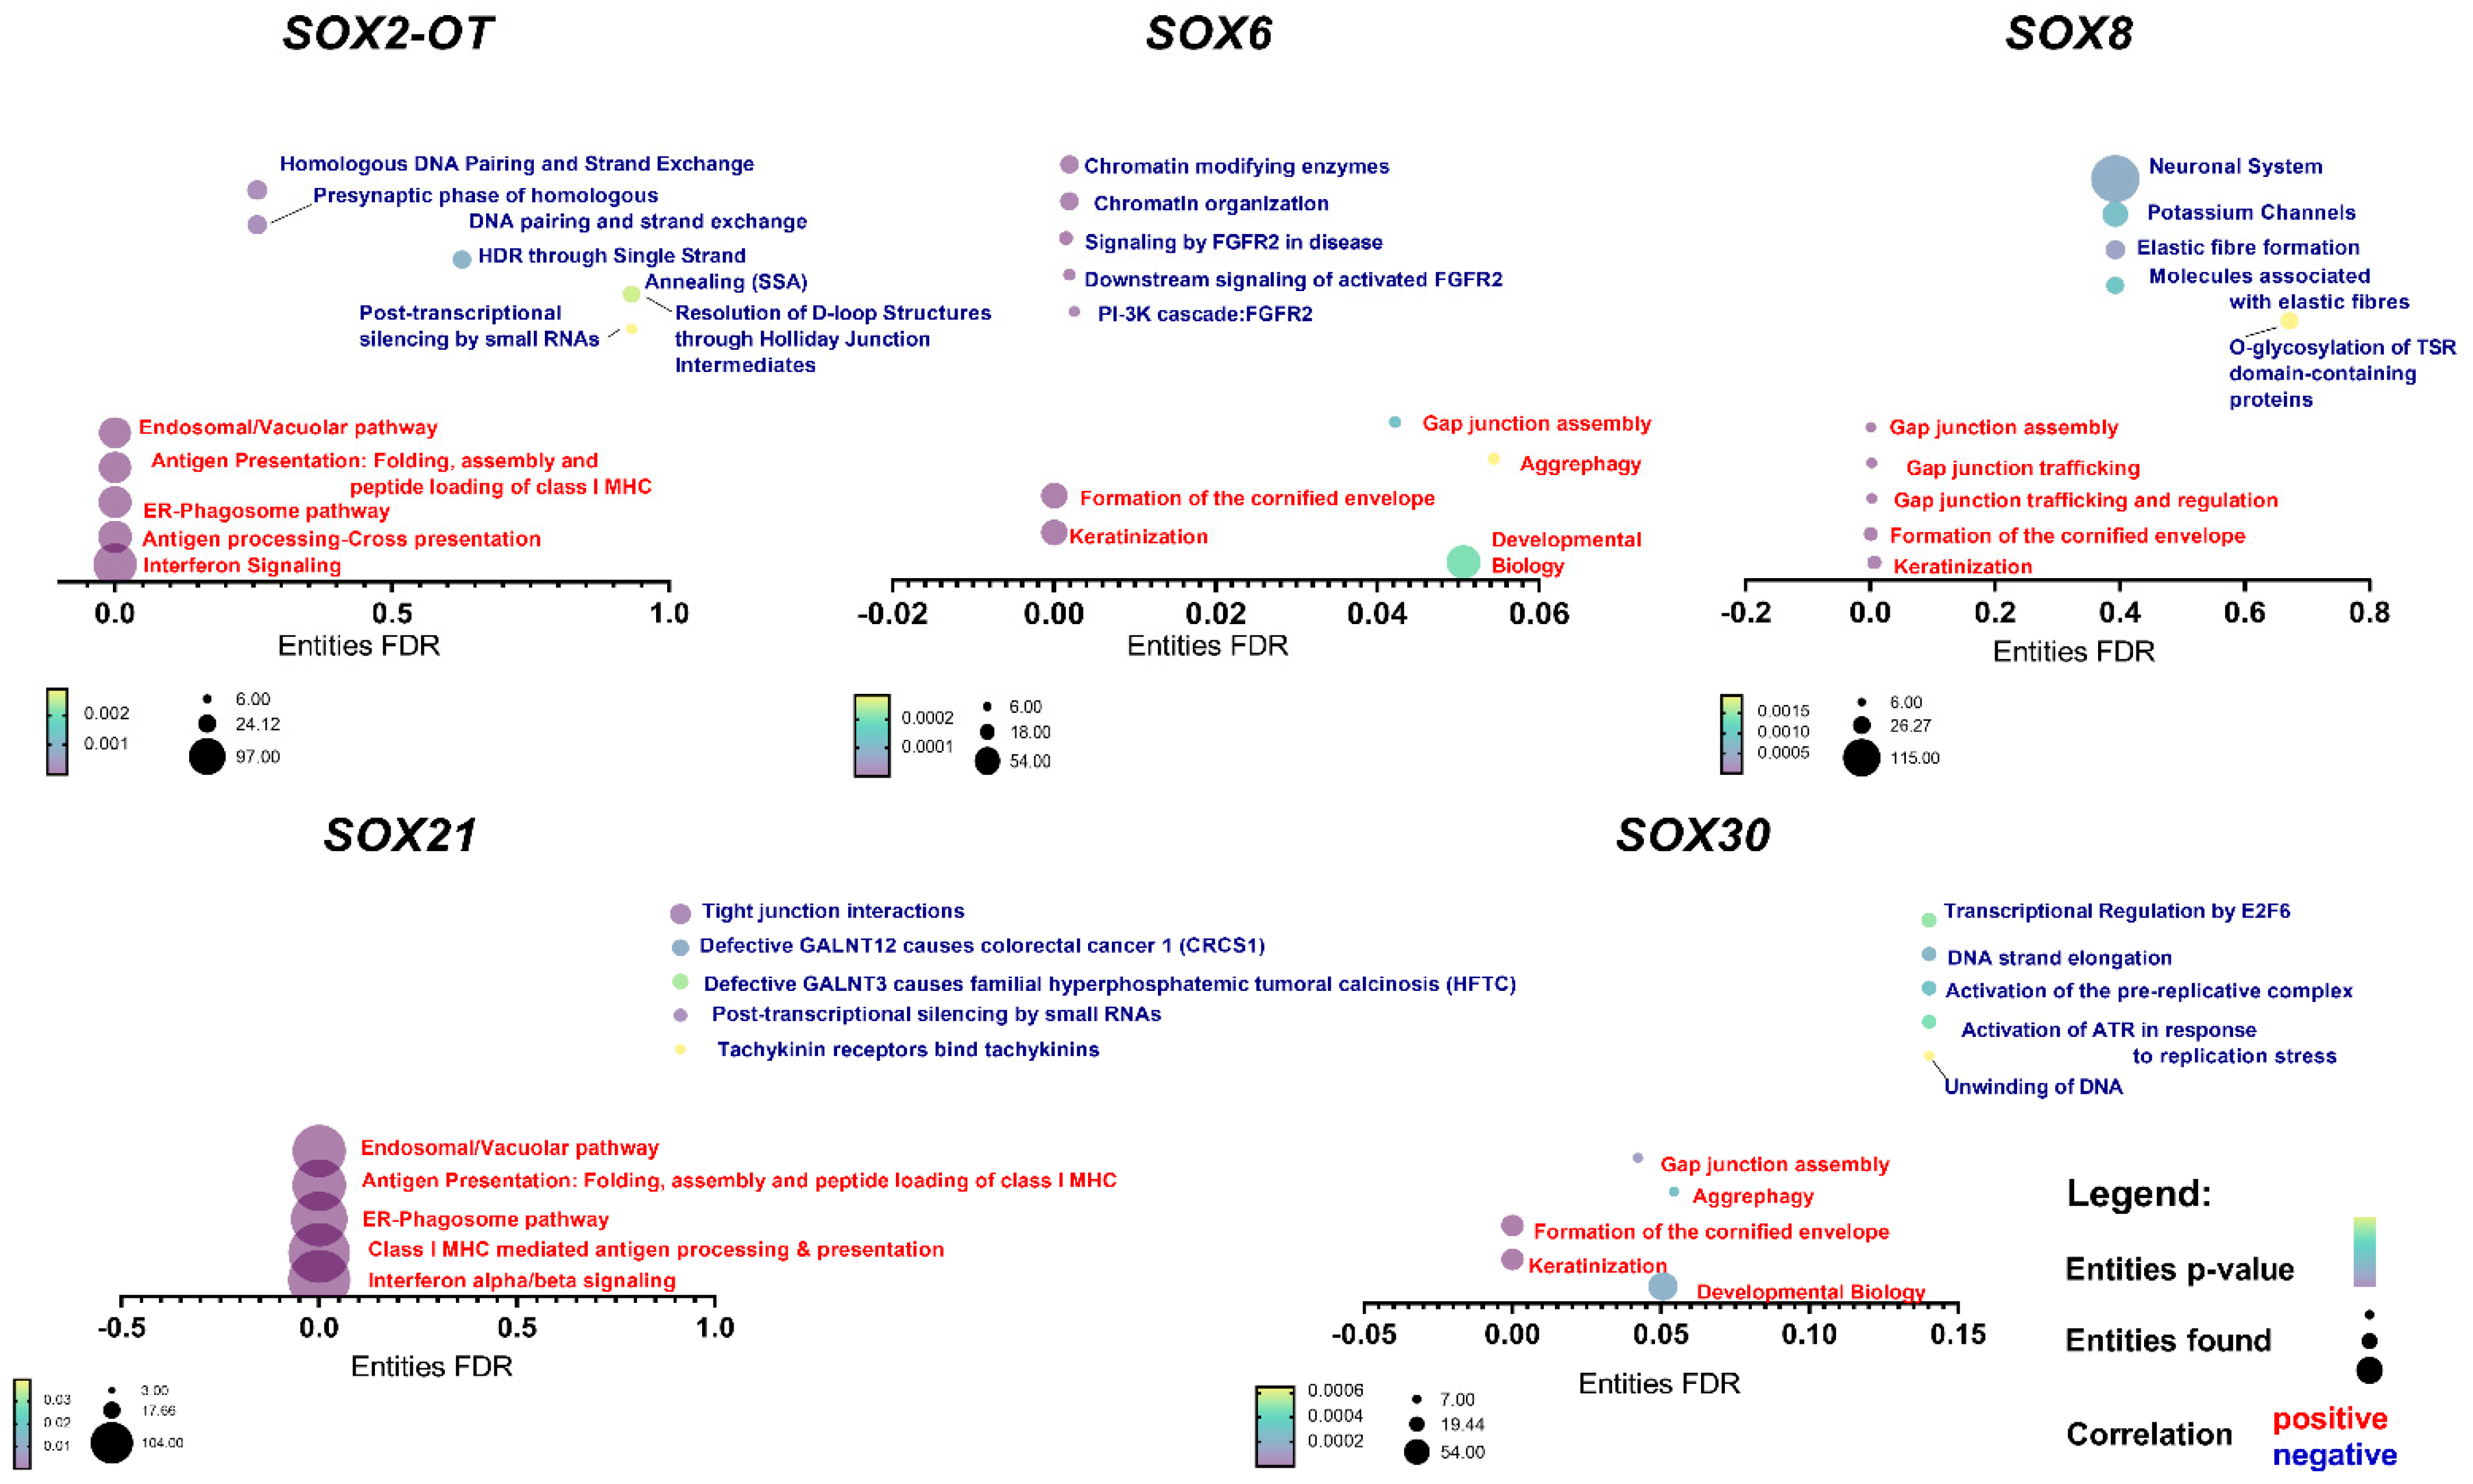
3.5. SOX Genes’ Expression Levels Correlate with Important Cellular Processes

Positively and negatively (Spearman positive correlation: R > 0.3; negative correlation: R < −0.3) correlated genes with SOX2-OT, SOX6, SOX8, SOX21, SOX30 and SRY were downloaded from cBioPortal.com, accessed on 2 January 2021, see Supplementary Materials. The gene-pathways association analysis was performed using the Reactome web tool reactome.org (accessed on 1 March 2021). Five pathways were selected representing each set with the lowest p value. SRY was not included in the analysis due to the insufficient number of documented correlations. For SOX6, negatively correlated genes were associated with chromatin organization and FGFR2 signaling, and positively correlated genes were associated with developmental biology processes, keratinization and formation of the cornified envelope. For SOX8, processes such as O-glycosylation of the TSR domain-containing proteins, fiber formation and potassium channels were connected with negatively correlated genes, and those which were positively correlated were similar to the SOX6 with additional processes connected with the gap junction. In the case of SOX30, positively correlated genes were also similar to those described for SOX6 and SOX8, but negatively correlated genes were associated with DNA replication processes. The last protein-coding gene, SOX21, correlated with genes associated with very different processes in comparison to the rest of SRY-related genes. Positively correlated genes were connected with immunological processes and cellular transport, and negatively correlated ones with tight junction interactions and with N-acetylgalactosaminyltransferase (GALNT3 and GALNT12). Finally, our analysis indicated that SOX2-OT lncRNA were positively correlated with genes associated with immunological processes and cellular transport, similar to SOX21. On the other hand, negatively correlated genes were connected with DNA repair. All data are presented in Figure 4 and in Supplementary Table S1.

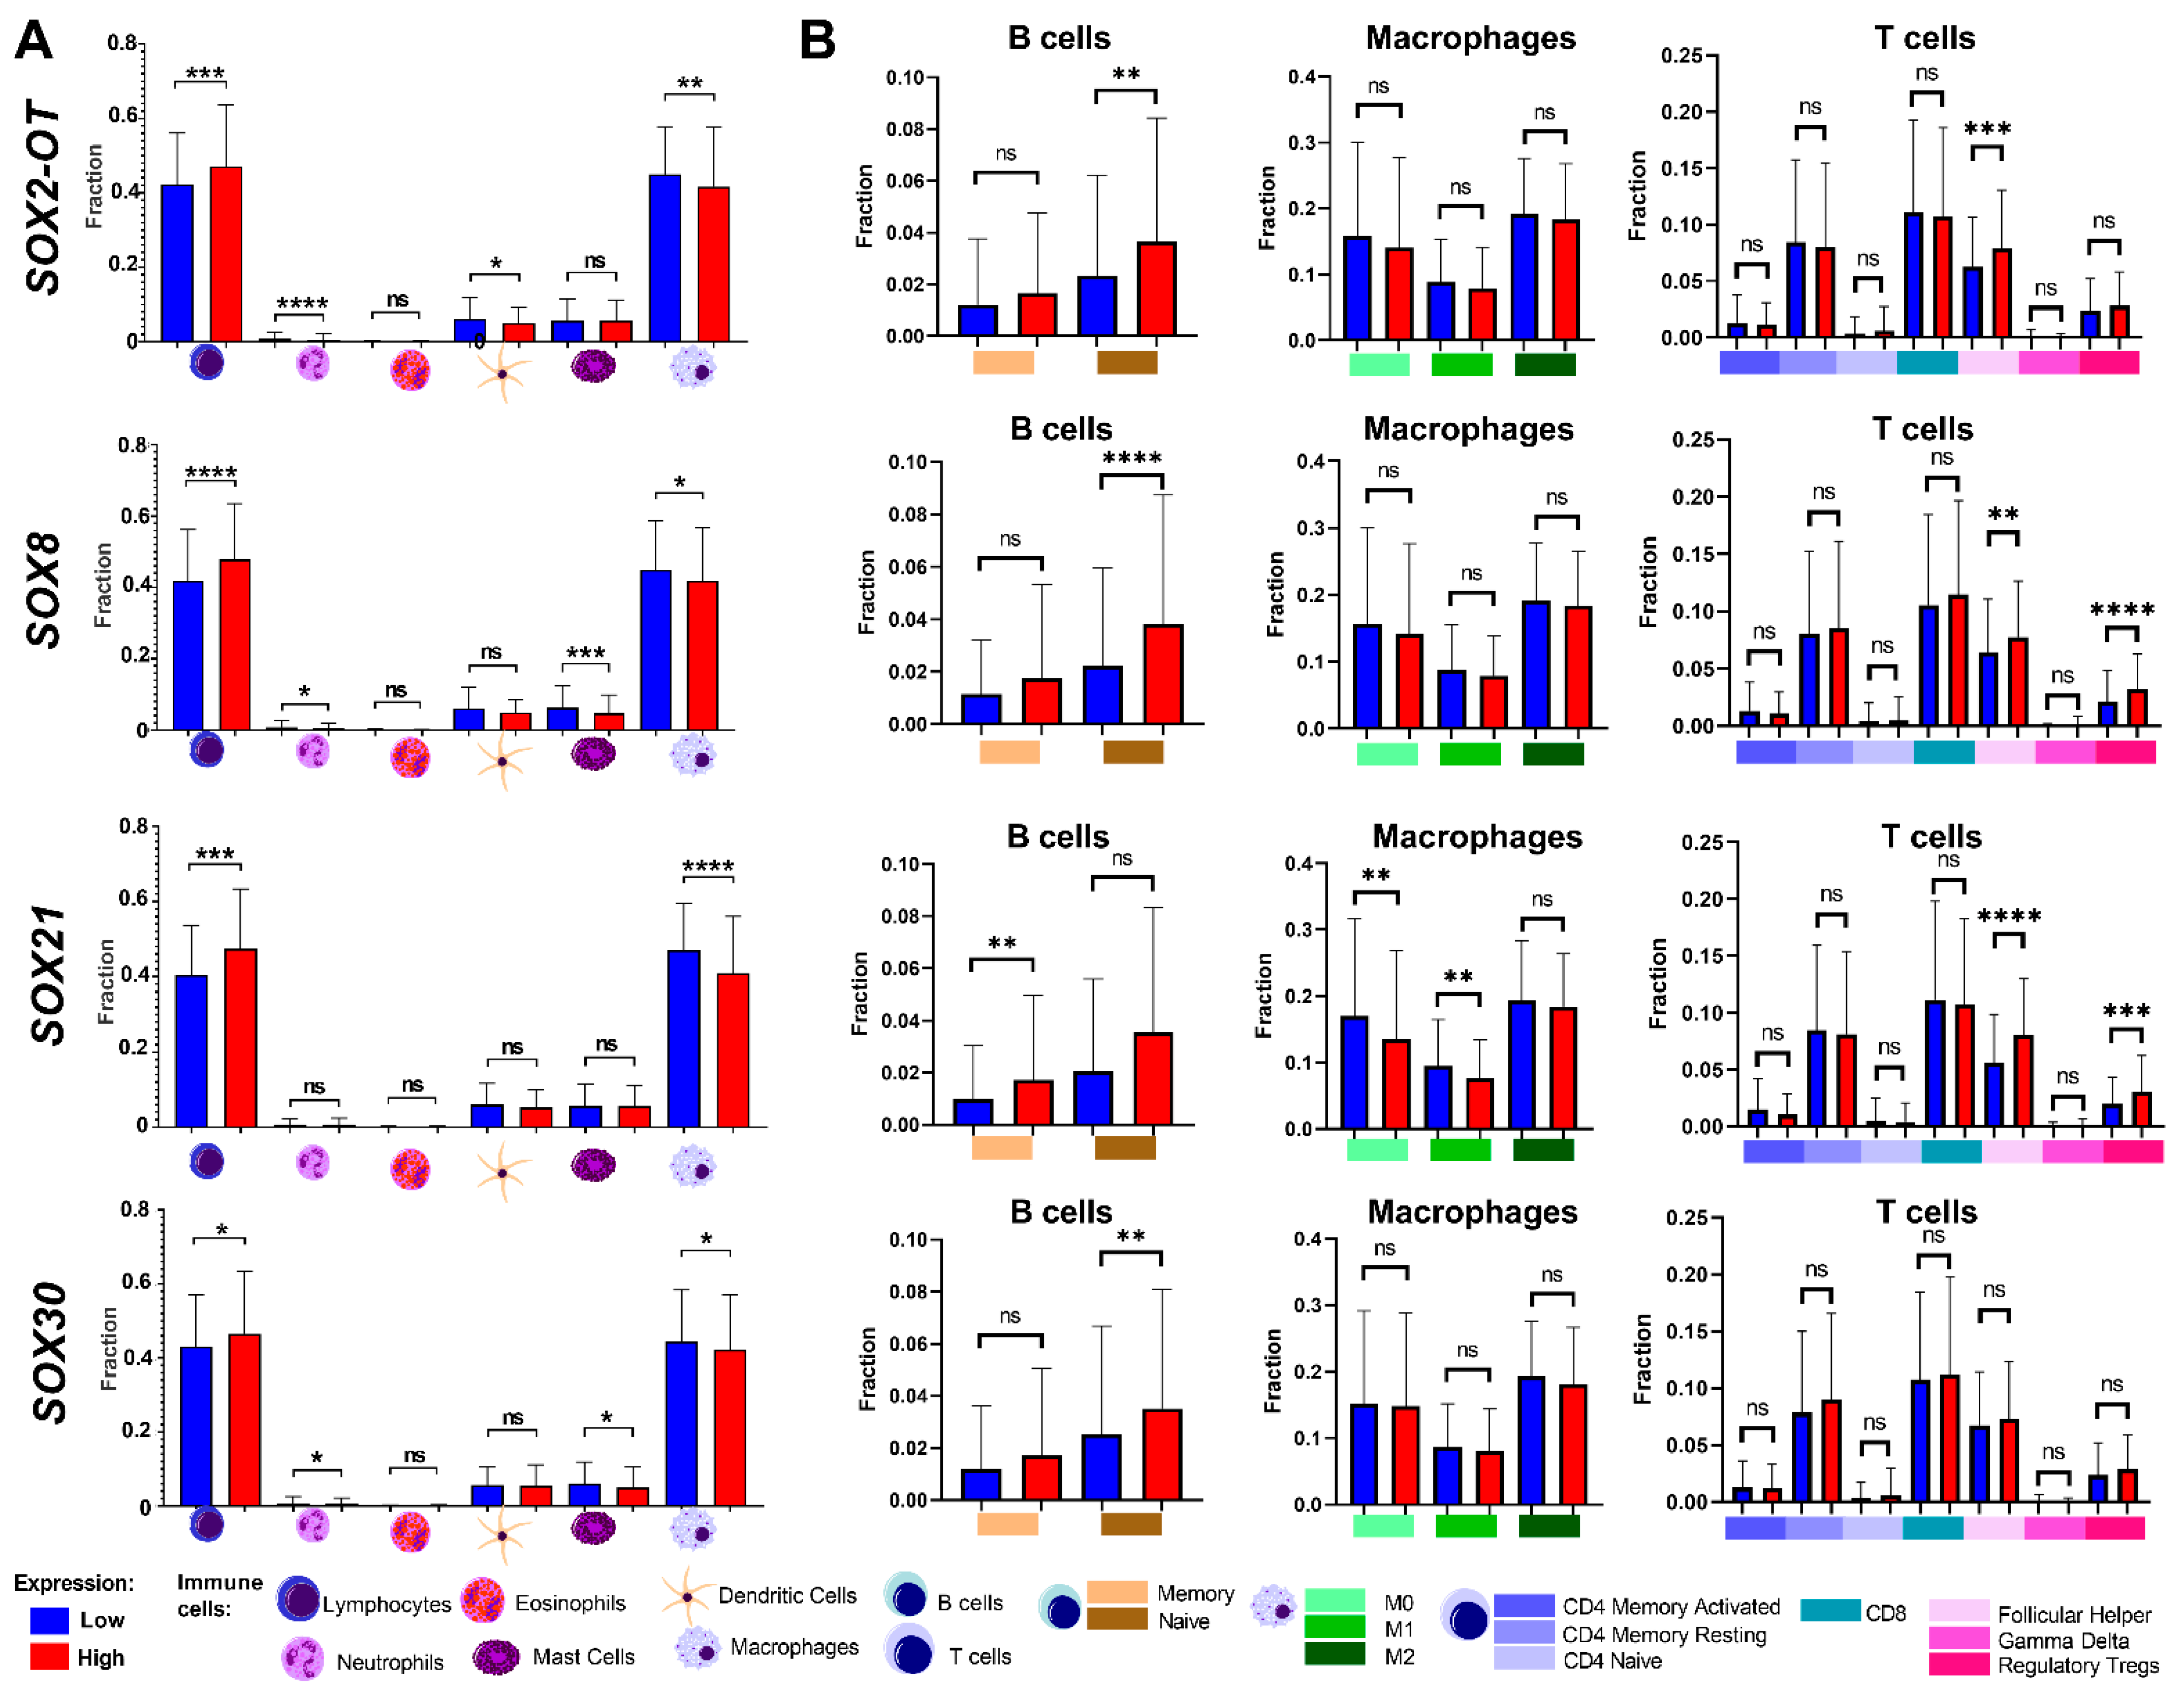
3.6. Tumor Composition Is Associated with Differences in the Expression of SRY-Related Transcription Factors

Next, we focused on the tumor composition using a stromal score that indicates the presence of stroma in tumor tissue, an immune score describing the infiltration of immune cells in tumor tissue and an estimate score that describes the tumor purity.
We found that the stromal score, immune score and estimate score were lower in patients with a higher expression of SOX2-OT and SOX21 and with a lower expression of SOX8. Stromal and estimated scores were higher in samples with lower SOX6 expression. The immune score was higher in samples with higher SOX30 expression, Figure 5 and Supplementary Table S2.
For genes with significant correlations with the immune scores, we analyzed the specific populations of immune cells, Figure 6. We found that in patients with a higher expression of SOX2-OT, the population of lymphocytes was significantly elevated, and the populations of neutrophils, mast cells and macrophages were lowered. Similar results were found in SOX8, SOX21 and SOX30 analyses. The population of neutrophils and dendritic cells were lowered in patients with a higher expression of SOX8 and SOX30. A higher expression of SOX8, SOX21 and SOX2-OT correlated with the lowered population of macrophages, Figure 6A and Supplementary Table S3A.
We also analyzed the subpopulations of B cells, macrophages and T cells. The subpopulation of naive B cells was higher in patients with a higher expression of SOX2-OT, SOX8 and SOX30, and in patients with a higher expression of SOX21, the subpopulation of memory B cells was higher. The significant differences of the subpopulation of macrophages were found in SOX21. The subpopulation of M0 and M1 macrophages were lower in patients with a higher expression of this gene. There were no significant differences in subpopulations of T cells in the SOX30 gene. In SOX8 and SOX21, the subpopulation of follicular helper T cells and regulatory Tregs were higher in patients with a higher expression, and in SOX2-OT, the subpopulation of follicular helper T cells was higher in patients with a higher expression. All data are presented in Figure 6B and in Supplementary Table S3B.

3.7. Validation of the Results for SRY-Related Transcription Factors Using the GEO Datasets

Next, we decided to validate the TCGA data using the GSE65858 and GSE3292 GEO datasets [35,36]. First, we analyzed the GSE65858 dataset and analyzed only HPV(−) patients. We observed no significant differences (p > 0.05) in expression levels of all SRY-related transcription factors and gender, age, alcohol consumption, smoking status, cancer stage, T-stage or N-stage. Moreover, there were no differences (p > 0.05) in the case of HPV(+) and HPV(−) patients, nor in the case of viral activity, when the active (DNA+RNA+) and inactive infection (DNA+RNA-) status were compared, for all SRY-related transcription factors were indicated in the set of GSE65858 data. However, in the case of molecular clusters, we observed no differences between the atypical vs. basal vs. classical vs. mesenchymal subtypes in the case of SOX30 and SRY (p = 0.1622 and p = 0.883, respectively). However, in the cases of the apical vs. basal subtypes for SOX8 and atypical vs. classical for SOX6, SOX8 and SOX21, as well as of the atypical vs. mesenchymal for SOX8 and SOX21, significant differences were noticed (p = 0.0012; p = 0.0007, p < 0.0001 and p < 0.0001; p = 0.0003 and p < 0.0001, respectively). Surprisingly, we observed a similar pattern of expression in the case of SOX2-OT, SOX6 and SOX21 genes between the basal vs. classical as well as the classical vs. mesenchymal subtypes (p = 0.0018, p = 0.0033, p = 0.0094; and p = 0.0005, p < 0.0001, p < 0.0001; respectively). Only the expression level of SOX21 was significantly higher in the basal than in the mesenchymal subtype of HNSCC (p < 0.0001). Next, we analyzed the association between high and low expression levels of SRY-related transcription factors and patients OS, and no significant differences between high and low expression levels were observed in the groups of all patients and only HPV(+). However, when expression levels of SOX30 were compared in only HPV(−) groups of patients, we observed significantly longer PFS (p = 0.0338 and p = 0.0715) and OS for the patients with a lower expression level of SOX30 than those with a higher expression of this gene (p = 0.0109 and p = 0.0313). All data are presented in Figure 7A and in Supplementary Table S4.
For the GSE329 dataset, we chose only HPV(−) patients and differences in expression levels of SRY-related transcription factors, depending on the clinicopathological parameters that were measured. We observed differences in the case of age (for SOX30: p = 0.0395), alcohol consumption (for SOX30: p = 0.0093; for SRY: p = 0.0102), pathological stage (for SOX21; p = 0.0064), pathological T-stage (for SOX21; p = 0.0005) and pathological N-stage (for SOX21; p = 0.0114 and for SOX30: p = 0.0114) and no differences in the expression levels of all SRY-related transcription factors for gender, tumor grade, clinical stage and clinical cervical lymph nodes status (p > 0.05).
Next, the association between HPV status and expression levels of SRY-related transcription factors was analyzed. We observed that only for SOX30 a significant up-regulation of expression level in the case of HPV+ patients (p < 0.0001) and no significant differences for SOX2-OT, SOX6, SOX8, SOX21 and SRY genes (p > 0.05). All data are presented in Figure 7B and in Supplementary Table S5.

4. Discussion

The SOX gene family, also known as SRY-related HMG-box genes, constitutes the transcription factors which bind to the minor groove of DNA and regulate the transcription. In humans, 20 different protein-coding SOX genes have been described [37]. The SOX gene family plays a role in cancer development including important cancer-related processes such as epithelial–mesenchymal transition (EMT), the maintenance of cancer stem cell (CSC) population, metastasis and the regulation of drug resistance [38,39]. In this study, the selected SRY-related transcription factors, including lncRNA SOX2-OT, and protein-coding SOX6, SOX8, SOX21, SOX30 and SRY genes were analyzed for the first time in HNSCC. Our results clearly point to SOX6, SOX8 and SRY as factors which are characteristic for a tumor tissue. We correlated the expression levels of the SOX genes with a panel of clinicopathological parameters and observed the significant correlations between the gene expression and cancer site (oral cavity vs. pharynx or larynx). Moreover, we found a longer disease-free survival for patients with a higher SOX21 expression and better survival rate for patients with a higher SOX6 expression. Our study also showed the relevance of the analyzed genes with the immune response, as there were significant correlations between the expression of SOX genes and the estimate scores.
SOX2-OT is the lncRNA SOX2 overlapping transcript. Its gene consists of 10 exons and more than two transcription start sites. Some SOX2-OT lncRNA transcription variants can be up- or down-regulated in various cancer cell lines and tissues, since they are related to the cancer and the stem-cell-related pathways affecting tumor progression [40]. The SOX2-OT gene is placed within over 700 kb of a highly conserved region and is overexpressed in embryonic stem cells, and its expression decreases upon differentiation. In breast cancer, SOX2-OT takes part in the induction and/or maintenance of SOX2 expression [38]. SOX2 is a transcription factor responsible for maintaining the self-renewal and pluripotency of undifferentiated embryonic stem cells [21]. Its overexpression has been associated with tumorigenicity in HNSCC. SOX2 drives the proliferation and expansion of tumor cells and inhibits their apoptosis. SOX2 is described as the stem cell marker, and it has been detected in various cancer stem cell subpopulations including lung squamous cell carcinoma, medulloblastoma or CD44-positive prostate cancer [38,41]. We discovered that SOX2-OT expression is positively correlated with SOX21 expression. In glioma, the increased SOX21 expression inhibits SOX2 leading to cancer cell apoptosis. A decreased SOX2/SOX21 ratio results in the loss of stem cell features in glioma cells [42].
SOX6 plays a role in cell growth, development and proliferation, especially during the development of the central nervous system, and the shaping of early embryonic muscle tissue and cartilage. SOX6 can also be involved in tumorigenesis as an oncogene or tumor suppressor in different types of cancer [18]. It was demonstrated that transgenic mice with SOX6 overexpression developed antitumor activity, caused by cytotoxic T cell activity. SOX6 overexpression correlated with a longer survival in these mice compared to untreated mice [38]. The analyses of The Cancer Genome Atlas, Cancer Cell Line Encyclopedia and Genotype-Tissue Expression datasets, indicate that SOX6 expression is decreased in breast cancer samples. Oppositely, SOX6 overexpression inhibits the proliferation of cancer cells and promotes apoptosis. Moreover, methylation of the SOX6 promoter is elevated when compared to non-cancerous tissues [43]. It has been demonstrated that SOX6 expression is positively correlated with SOX21 expression in glioma patients. Both SOX6 and SOX21 high-expression patients had a worse survival prognosis than those with a low expression of these genes [42].
SOX8 is a transcription factor involved in the nervous system and mammalian testis development. It was identified as an oncogene, and it maintains the stemness in cancer stem cells [20]. In the study on SOX8 in tongue squamous cell carcinoma, it was discovered that the knockout of this gene inhibited stem-like capacities, mesenchymal features and tumor metastasis in cancer chemoresistant cells. In tongue squamous cell carcinoma (TSCC), patients’ higher expression of SOX8 caused lymph node metastasis, chemotherapeutic resistance and a poor prognosis [20]. Shuwei et al. conducted a study in which they identified SOX8 as a regulator of a common oncogene—Golgi phosphoprotein 3 (GOLPH3) in TSCC. The knockdown of SOX8 correlated with the suppression of GOLPH3 promoter activity and the inhibition of TSCC cell proliferation in vivo and in vitro. Moreover, overexpressed SOX8 was linked to GOLPH3 promoter activation and elevated TSCC development. Additionally, SOX8 was upregulated in tumor tissues in comparison to a non-cancerous control, which again correlated with GOLPH3 levels [44]. In breast cancer patients, amplification of SOX8 caused poor overall survival [45].
Another member of the SRY-related family, SOX21, is expressed in the anterior neural plate of mouse embryos and causes the progression of neurogenesis. The role of SOX21 in human neural development is still unclear [14]. In glioma, SOX21 is a tumor suppressor with a repression activity during tumorigenesis. It also reduces the stemness of tumor cells, leading to differentiation. The increased expression of SOX21 in glioma cells inhibits the tumor progression and reduces the tumor size [38]. It is consistent with our results, as patients with a higher expression of SOX21 have a longer disease-free survival. It can be assumed that a higher expression of SOX21 reduces the number of cancer stem cells, resulting in a longer DFS.
SOX30 participates in spermatogonial differentiation and the regulation of spermatogenesis. It can also function as a tumor suppressor in various cancers [46]. For example, in lung cancer, SOX30 inhibits cell proliferation, migration, invasion, growth and tumor metastasis. The product of this gene stimulates p53 production, which promotes apoptosis [38]. Kumar et al. indicated that a lower expression of SOX30 correlates with a poor prognosis and is associated with the malignant tumor type in bladder cancer [20]. Similarly, Yang et al. studied SOX30 mRNA expression in bladder cancer and they discovered that it was lower in cancer cells than in noncancerous control tissues. Moreover, low SOX30 expression correlated with reduced survival rates and its overexpression impaired cell proliferation, invasion and migration, and at the same time, it elevated the apoptosis of bladder cancer cells [46]. Another study indicated that the expression level of SOX30 might be used as a prognostic biomarker in patients with ovarian cancer. Fai Han et al. demonstrated that a high SOX30 expression is associated with a better overall survival in patients with the advanced-stage disease, but it is not associated with early stage patients. SOX30 can also inhibit tumor metastasis by upregulating e-cadherin and downregulating n-catherin, vimentin and fibronectin and preventing epithelial-mesenchymal transmission (EMT) [47].

5. Conclusions

We demonstrated that the selected SRY-related transcription factors may act as prognostic biomarkers in HNSCC. In general, they show a lower expression in primary tumors than in normal tissue. Patients with a higher expression of these factors have higher OS and DFS rates, thus, a better prognosis. Moreover, SOX30 seems to be a potential biomarker of HPV infection and could be used as a prognostic marker, but further research is required to fully understand the role of SOX family genes in HNSCC.

Supplementary Materials

The following supporting information can be downloaded at: https://www.mdpi.com/article/10.3390/cimb45120592/s1, Supplementary Table S1: Positive and negative correlation of SOX2-OT, SOX6, SOX8, SOX21 and SOX30 with genes involved in the important cellular processes. Only genes with Spearman’s correlation R > 0.3, R < –0.3 and p < 0.05 were indicated in REACTOME pathway analysis; Supplementary Table S2: Differences between patients with low and high expression of SRY-related genes in context of their stromal score, immune score and estimate score; t-test or Mann–Whitney U test; p < 0.05 considered as significant; Supplementary Table S3: Immunological profile of HSNCC patients depending on the expression levels of SOX2-OT, SOX8, SOX21 and SOX30. Differences in the population of lymphocytes, neutrophils, eosinophils, mast cells, dendritic cells and macrophages (A), and in the specific subpopulation of B cells, macrophages and T cells (B). t-test or Mann–Whitney U test; p < 0.05 considered as significant; Supplementary Table S4: Validation of the results for SRY-related transcription factors using the GSE65858 dataset; Supplementary Table S5: Validation of the results for SRY-related transcription factors using the GSE65858 dataset.

Author Contributions

Conceptualization, T.K. and K.L.; methodology, T.K.; investigation, Z.G., B.Ż., W.Ł., M.S., A.W., J.K.-M., K.G. and T.K.; data curation, T.K.; writing: original draft preparation, Z.G., B.Ż., W.Ł., M.S., A.W. and T.K.; writing: review and editing, T.K., J.K.-M., K.G., A.F., U.K., A.T. and K.L.; visualization, Z.G., B.Ż., W.Ł., M.S., A.W., J.K.-M., K.G. and T.K.; data curation, T.K.; supervision, T.K., U.K. and K.L.; funding acquisition, T.K. and K.L.; T.K. and Z.G. have contributed equally to this work. All authors have read and agreed to the published version of the manuscript.

Funding

This work was supported by Poznan University of Medical Sciences (Department of Cancer Immunology, Chair of Medical Biotechnology—budget for scientific activities) and by the Greater Poland Cancer Center grant no.: 1/2023(263), 13/01/2023/PGN/WCO/001.

Institutional Review Board Statement

This study is based on the analysis of freely available datasets and does not need any ethics committee’s agreement and does not violate the rights of other persons or institutions.

Informed Consent Statement

This study used the data from the TCGA and GEO datasets, which are freely available and do not disturb any rights of people or institutions.

Data Availability Statement

The datasets used and/or analyzed during the current study are available from the corresponding author on reasonable request. Raw data are available from the XenaBrowser, Ualcan, cBioportal, GEPIA2 and ESTIMATE databases.

Acknowledgments

Publication was made during the class “Analysis of experimental data”, performed in the Chair of Medical Biotechnology, Department of Cancer Immunology, Poznan University of Medical Sciences, in 2020/2021.

Conflicts of Interest

The authors declare that there are no conflicts of interest regarding the publication of this paper. In the preparation of the figures, images from motifolio.com were used in accordance with the purchased license.

References

  1. Marur, S.; Forastiere, A.A. Head and neck cancer: Changing epidemiology, diagnosis, and treatment. Mayo Clin. Proc. 2008, 83, 489–501. [Google Scholar] [CrossRef]
  2. Dyzmann-Sroka, A.; Malicki, J.; Jędrzejczak, A. Cancer incidence in the Greater Poland region as compared to Europe. Rep. Pract. Oncol. Radiother. J. Greatpoland Cancer Cent. Pozn. Pol. Soc. Radiat. Oncol. 2020, 25, 632–636. [Google Scholar] [CrossRef] [PubMed]
  3. Leemans, C.R.; Braakhuis, B.J.; Brakenhoff, R.H. The molecular biology of head and neck cancer. Nat. Rev. Cancer 2011, 11, 9–22. [Google Scholar] [CrossRef] [PubMed]
  4. Cancer Genome Atlas Network. Comprehensive genomic characterization of head and neck squamous cell carcinomas. Nature 2015, 517, 576–582. [Google Scholar] [CrossRef] [PubMed]
  5. Dok, R.; Nuyts, S. HPV Positive Head and Neck Cancers: Molecular Pathogenesis and Evolving Treatment Strategies. Cancers 2016, 8, 41. [Google Scholar] [CrossRef] [PubMed]
  6. Alsahafi, E.; Begg, K.; Amelio, I.; Raulf, N.; Lucarelli, P.; Sauter, T.; Tavassoli, M. Clinical update on head and neck cancer: Molecular biology and ongoing challenges. Cell Death Dis. 2019, 10, 540. [Google Scholar] [CrossRef] [PubMed]
  7. Rupar, M.J.; Golusinski, P.; Golusinski, W.; Masternak, M.M. Human Papillomavirus and the use of nanoparticles for immunotherapy in HPV-related cancer: A review. Rep. Pract. Oncol. Radiother. J. Greatpoland Cancer Cent. Pozn. Pol. Soc. Radiat. Oncol. 2019, 24, 544–550. [Google Scholar] [CrossRef] [PubMed]
  8. Rajabi-Moghaddam, M.; Abbaszadeh, H. Gene polymorphisms and prognosis of head and neck squamous cell carcinoma: A systematic review. Rep. Pract. Oncol. Radiother. J. Greatpoland Cancer Cent. Pozn. Pol. Soc. Radiat. Oncol. 2022, 27, 1045–1057. [Google Scholar] [CrossRef]
  9. Rajabi-Moghaddam, M.; Abbaszadeh, H. Gene polymorphisms and risk of head and neck squamous cell carcinoma: A systematic review. Rep. Pract. Oncol. Radiother. J. Greatpoland Cancer Cent. Pozn. Pol. Soc. Radiat. Oncol. 2022, 27, 1058–1076. [Google Scholar] [CrossRef]
  10. Guglas, K.; Kozłowska-Masłoń, J.; Kolenda, T.; Paszkowska, A.; Teresiak, A.; Bliźniak, R.; Lamperska, K. Midsize noncoding RNAs in cancers: A new division that clarifies the world of noncoding RNA or an unnecessary chaos? Rep. Pract. Oncol. Radiother. J. Greatpoland Cancer Cent. Pozn. Pol. Soc. Radiat. Oncol. 2022, 27, 1077–1093. [Google Scholar] [CrossRef]
  11. Kolenda, T.; Guglas, K.; Ryś, M.; Bogaczyńska, M.; Teresiak, A.; Bliźniak, R.; Łasińska, I.; Mackiewicz, J.; Lamperska, K.M. Biological role of long non-coding RNA in head and neck cancers. Rep. Pract. Oncol. Radiother. J. Greatpoland Cancer Cent. Pozn. Pol. Soc. Radiat. Oncol. 2017, 22, 378–388. [Google Scholar] [CrossRef] [PubMed]
  12. Kolenda, T.; Guglas, K.; Kopczyńska, M.; Sobocińska, J.; Teresiak, A.; Bliźniak, R.; Lamperska, K. Good or not good: Role of miR-18a in cancer biology. Rep. Pract. Oncol. Radiother. J. Greatpoland Cancer Cent. Pozn. Pol. Soc. Radiat. Oncol. 2020, 25, 808–819. [Google Scholar] [CrossRef] [PubMed]
  13. Kolenda, T.; Paszkowska, A.; Braska, A.; Kozłowska-Masłoń, J.; Guglas, K.; Poter, P.; Wojtczak, P.; Bliźniak, R.; Lamperska, K.; Teresiak, A. Host gene and its guest: Short story about relation of long-noncoding MIR31HG transcript and microRNA miR-31. Rep. Pract. Oncol. Radiother. J. Greatpoland Cancer Cent. Pozn. Pol. Soc. Radiat. Oncol. 2023, 28, 114–134. [Google Scholar] [CrossRef] [PubMed]
  14. Kolenda, T.; Kopczyńska, M.; Guglas, K.; Teresiak, A.; Bliźniak, R.; Łasińska, I.; Mackiewicz, J.; Lamperska, K. EGOT lncRNA in head and neck squamous cell carcinomas. Pol. J. Pathol. Off. J. Pol. Soc. Pathol. 2018, 69, 356–365. [Google Scholar] [CrossRef]
  15. Kopczyńska, M.; Kolenda, T.; Guglas, K.; Sobocińska, J.; Teresiak, A.; Bliźniak, R.; Mackiewicz, A.; Mackiewicz, J.; Lamperska, K. PRINS lncRNA Is a New Biomarker Candidate for HPV Infection and Prognosis of Head and Neck Squamous Cell Carcinomas. Diagnostics 2020, 10, 762. [Google Scholar] [CrossRef]
  16. Kolenda, T.; Guglas, K.; Baranowski, D.; Sobocińska, J.; Kopczyńska, M.; Teresiak, A.; Bliźniak, R.; Lamperska, K. cfRNAs as biomarkers in oncology—Still experimental or applied tool for personalized medicine already? Rep. Pract. Oncol. Radiother. J. Greatpoland Cancer Cent. Pozn. Pol. Soc. Radiat. Oncol. 2020, 25, 783–792. [Google Scholar] [CrossRef]
  17. Kozłowska, J.; Kolenda, T.; Poter, P.; Sobocińska, J.; Guglas, K.; Stasiak, M.; Bliźniak, R.; Teresiak, A.; Lamperska, K. Long Intergenic Non-Coding RNAs in HNSCC: From “Junk DNA” to Important Prognostic Factor. Cancers 2021, 13, 2949. [Google Scholar] [CrossRef]
  18. Lv, L.; Zhou, M.; Zhang, J.; Liu, F.; Qi, L.; Zhang, S.; Bi, Y.; Yu, Y. SOX6 suppresses the development of lung adenocarcinoma by regulating expression of p53, p21CIPI, cyclin D1 and β-catenin. FEBS Open Bio 2020, 10, 135–146. [Google Scholar] [CrossRef]
  19. Liang, Z.; Xu, J.; Gu, C. Novel role of the SRY-related high-mobility-group box D gene in cancer. Semin. Cancer Biol. 2020, 67 Pt 1, 83–90. [Google Scholar] [CrossRef]
  20. Xie, S.L.; Fan, S.; Zhang, S.Y.; Chen, W.X.; Li, Q.X.; Pan, G.K.; Zhang, H.Q.; Wang, W.W.; Weng, B.; Zhang, Z.; et al. SOX8 regulates cancer stem-like properties and cisplatin-induced EMT in tongue squamous cell carcinoma by acting on the Wnt/β-catenin pathway. Int. J. Cancer 2018, 142, 1252–1265. [Google Scholar] [CrossRef] [PubMed]
  21. Shahryari, A.; Jazi, M.S.; Samaei, N.M.; Mowla, S.J. Long non-coding RNA SOX2OT: Expression signature, splicing patterns, and emerging roles in pluripotency and tumorigenesis. Front. Genet. 2015, 6, 196. [Google Scholar] [CrossRef]
  22. Staniewska, E.; Tomasik, B.; Tarnawski, R.; Łaszczych, M.; Miszczyk, M. The prognostic value of red cell distribution width (RDW), neutrophil-to-lymphocyte ratio (NLR), and platelet-to-lymphocyte ratio (PLR) in radiotherapy for oropharyngeal cancer. Rep. Pract. Oncol. Radiother. J. Greatpoland Cancer Cent. Pozn. Pol. Soc. Radiat. Oncol. 2021, 26, 1010–1018. [Google Scholar] [CrossRef] [PubMed]
  23. Ganesh, M.S.; Narayanan, G.S.; Kumar, R. Change of telomerase activity in peripheral blood of patients with head and neck squamous cell carcinoma pre and post curative treatment. Rep. Pract. Oncol. Radiother. J. Greatpoland Cancer Cent. Pozn. Pol. Soc. Radiat. Oncol. 2020, 25, 28–34. [Google Scholar] [CrossRef] [PubMed]
  24. Pietrzak, A.K.; Kazmierska, J.; Marszalek, A.; Golusinski, P.; Heydrych, A.; Wiechec, K.; Cholewinski, W. Dual-time-point PET/CT study protocol can improve the larynx cancer diagnosis. Rep. Pract. Oncol. Radiother. J. Greatpoland Cancer Cent. Pozn. Pol. Soc. Radiat. Oncol. 2020, 25, 533–538. [Google Scholar] [CrossRef]
  25. Sindhu, S.K.; Bauman, J.E. Current Concepts in Chemotherapy for Head and Neck Cancer. Oral Maxillofac. Surg. Clin. N. Am. 2019, 31, 145–154. [Google Scholar] [CrossRef] [PubMed]
  26. Gordon, K.; Gulidov, I.; Semenov, A.; Golovanova, O.; Koryakin, S.; Makeenkova, T.; Ivanov, S.; Kaprin, A. Proton re-irradiation of unresectable recurrent head and neck cancers. Rep. Pract. Oncol. Radiother. J. Greatpoland Cancer Cent. Pozn. Pol. Soc. Radiat. Oncol. 2021, 26, 203–210. [Google Scholar] [CrossRef] [PubMed]
  27. Koiwai, K.; Hirasawa, D.; Sugimura, M.; Endo, Y.; Mizuhata, K.; Ina, H.; Fukazawa, A.; Kitoh, R.; Sakai, H.; Fujinaga, Y. Impact of upgraded radiotherapy system on outcomes in postoperative head and neck squamous cell carcinoma patients. Rep. Pract. Oncol. Radiother. J. Greatpoland Cancer Cent. Pozn. Pol. Soc. Radiat. Oncol. 2022, 27, 954–962. [Google Scholar] [CrossRef] [PubMed]
  28. Viani, G.A.; Faustino, A.C.; Danelichen AF, B.; Matsuura, F.K.; Neves LV, F.; Fernandes, M.H.; Fernandes, J.P. Radiotherapy for locally advanced head and neck cancer in elderly patients: Results and prognostic factors a single cohort. Rep. Pract. Oncol. Radiother. J. Greatpoland Cancer Cent. Pozn. Pol. Soc. Radiat. Oncol. 2021, 26, 12–19. [Google Scholar] [CrossRef]
  29. Chandrashekar, D.S.; Karthikeyan, S.K.; Korla, P.K.; Patel, H.; Shovon, A.R.; Athar, M.; Netto, G.J.; Qin, Z.S.; Kumar, S.; Manne, U.; et al. UALCAN: An update to the integrated cancer data analysis platform. Neoplasia 2022, 25, 18–27. [Google Scholar] [CrossRef]
  30. Sobocińska, J.; Nowakowska, J.; Molenda, S.; Olechnowicz, A.; Guglas, K.; Kozłowska-Masłoń, J.; Kazimierczak, U.; Machnik, M.; Oleksiewicz, U.; Teresiak, A.; et al. Zinc Finger Proteins in Head and Neck Squamous Cell Carcinomas: ZNF540 May Serve as a Biomarker. Curr. Oncol. (Tor. Ont.) 2022, 29, 9896–9915. [Google Scholar] [CrossRef]
  31. Tomaszewska, W.; Kozłowska-Masłoń, J.; Baranowski, D.; Perkowska, A.; Szałkowska, S.; Kazimierczak, U.; Severino, P.; Lamperska, K.; Kolenda, T. miR-154 Influences HNSCC Development and Progression through Regulation of the Epithelial-to-Mesenchymal Transition Process and Could Be Used as a Potential Biomarker. Biomedicines 2021, 9, 1894. [Google Scholar] [CrossRef]
  32. Koteluk, O.; Bielicka, A.; Lemańska, Ż.; Jóźwiak, K.; Klawiter, W.; Mackiewicz, A.; Kazimierczak, U.; Kolenda, T. The Landscape of Transmembrane Protein Family Members in Head and Neck Cancers: Their Biological Role and Diagnostic Utility. Cancers 2021, 13, 4737. [Google Scholar] [CrossRef]
  33. Paszkowska, A.; Kolenda, T.; Guglas, K.; Kozłowska-Masłoń, J.; Podralska, M.; Teresiak, A.; Bliźniak, R.; Dzikiewicz-Krawczyk, A.; Lamperska, K. C10orf55, CASC2, and SFTA1P lncRNAs Are Potential Biomarkers to Assess Radiation Therapy Response in Head and Neck Cancers. J. Pers. Med. 2022, 12, 1696. [Google Scholar] [CrossRef]
  34. Kolenda, T.; Poter, P.; Guglas, K.; Kozłowska-Masłoń, J.; Braska, A.; Kazimierczak, U.; Teresiak, A. Biological role and diagnostic utility of ribosomal protein L23a pseudogene 53 in cutaneous melanoma. Rep. Pract. Oncol. Radiother. J. Greatpoland Cancer Cent. Pozn. Pol. Soc. Radiat. Oncol. 2023, 28, 255–270. [Google Scholar] [CrossRef]
  35. Wichmann, G.; Rosolowski, M.; Krohn, K.; Kreuz, M.; Boehm, A.; Reiche, A.; Scharrer, U.; Halama, D.; Bertolini, J.; Bauer, U.; et al. The role of HPV RNA transcription, immune response-related gene expression and disruptive TP53 mutations in diagnostic and prognostic profiling of head and neck cancer. Int. J. Cancer 2015, 137, 2846–2857. [Google Scholar] [CrossRef] [PubMed]
  36. Wang, K.P.; Yuan, Y.J.; Zhu, J.Q.; Li, B.L.; Zhang, T.T. Analysis of key genes and signal pathways of human papilloma virus-related head and neck squamous cell carcinoma. Chin. J. Stomatol. 2020, 55, 571–577. [Google Scholar] [CrossRef]
  37. Bowles, J.; Schepers, G.; Koopman, P. Phylogeny of the SOX family of developmental transcription factors based on sequence and structural indicators. Dev. Biol. 2000, 227, 239–255. [Google Scholar] [CrossRef] [PubMed]
  38. Grimm, D.; Bauer, J.; Wise, P.; Krüger, M.; Simonsen, U.; Wehland, M.; Infanger, M.; Corydon, T.J. The role of SOX family members in solid tumours and metastasis. Semin. Cancer Biol. 2020, 67 Pt 1, 122–153. [Google Scholar] [CrossRef] [PubMed]
  39. Pouremamali, F.; Vahedian, V.; Hassani, N.; Mirzaei, S.; Pouremamali, A.; Kazemzadeh, H.; Faridvand, Y.; Jafari-Gharabaghlou, D.; Nouri, M.; Maroufi, N.F. The role of SOX family in cancer stem cell maintenance: With a focus on SOX2. Pathology 2022, 231, 153783. [Google Scholar] [CrossRef]
  40. Wang, Y.; Wu, N.; Luo, X.; Zhang, X.; Liao, Q.; Wang, J. SOX2OT, a novel tumor-related long non-coding RNA. Biomed. Pharmacother. = Biomed. Pharmacother. 2020, 123, 109725. [Google Scholar] [CrossRef]
  41. Kumar, P.; Mistri, T.K. Transcription factors in SOX family: Potent regulators for cancer initiation and development in the human body. Semin. Cancer Biol. 2020, 67 Pt 1, 105–113. [Google Scholar] [CrossRef]
  42. Jiang, L.; Yang, H.; Chen, T.; Zhu, X.; Ye, J.; Lv, K. Identification of HMG-box family establishes the significance of SOX6 in the malignant progression of glioblastoma. Aging 2020, 12, 8084–8106. [Google Scholar] [CrossRef] [PubMed]
  43. Zhang, L.; Niu, X.; Zhang, X.; Zhan, G.; Xue, X.; Wang, X.; Zhang, H.; Guo, Z. SRY-related high-mobility-group box 6 suppresses cell proliferation and is downregulated in breast cancer. Anti-Cancer Drugs 2021, 32, 306–313. [Google Scholar] [CrossRef] [PubMed]
  44. Chen, S.; Li, H.; Li, X.; Chen, W.; Zhang, X.; Yang, Z.; Chen, Z.; Chen, J.; Zhang, Y.; Shi, D.; et al. High SOX8 expression promotes tumor growth and predicts poor prognosis through GOLPH3 signaling in tongue squamous cell carcinoma. Cancer Med. 2020, 9, 4274–4289. [Google Scholar] [CrossRef]
  45. Mehta, G.A.; Khanna, P.; Gatza, M.L. Emerging Role of SOX Proteins in Breast Cancer Development and Maintenance. J. Mammary Gland Biol. Neoplasia 2019, 24, 213–230. [Google Scholar] [CrossRef] [PubMed]
  46. Liu, C.; Liu, Y.; Tian, J.; Zhang, S.; Li, X.; Zhai, X.; Feng, Q. High expression of SRY-box transcription factor 30 associates with well differentiation, absent lymph node metastasis and predicts longer survival in nonsmall-cell lung cancer patients. Medicine 2020, 99, e20122. [Google Scholar] [CrossRef]
  47. Han, F.; Liu, W.B.; Li, J.J.; Zhang, M.Q.; Yang, J.T.; Zhang, X.; Hao, X.L.; Yin, L.; Mao, C.Y.; Jiang, X.; et al. SOX30 is a prognostic biomarker and chemotherapeutic indicator for advanced-stage ovarian cancer. Endocr.-Relat. Cancer 2019, 26, 303–319. [Google Scholar] [CrossRef]
Figure 1. The expression level of SOX2-OT, SOX6, SOX8, SOX21, SOX30 and SRY in HNSCC patients: (A) differences in gene expression between normal (blue boxes) and cancer tissues (red boxes), data from UALCAN presented as log2(TPM + 1), modified; (B) receiver operating characteristic curve (ROC) analyses of SOX2-OT, SOX6, SOX8, SOX21, SOX30 and SRY expression levels in HNSCC patients; (C) the correlation matrix between expression levels of SRY-related genes in HNSCC patients; Spearman correlation test with p < 0.05 considered as significant; ns: not significant, * p < 0.05; ** p < 0.01; *** p < 0.001; **** p < 0.0001.
Cimb 45 00592 g001
Figure 2. Expression levels of SOX2-OT, SOX6, SOX8, SOX21, SOX30 and SRY genes in patients with head and neck squamous cell carcinoma depending on the localization of the tumor. Graphs show the mean value of transcripts per million; t-test or Mann–Whitney U test; p < 0.05 considered as significant; ns: not significant, * p < 0.05; ** p < 0.01; **** p < 0.0001.
Cimb 45 00592 g002
Figure 3. Disease-free survival and overall survival rates of HNSCC patients with low and high expression of each of the transcripts (A) separately and (B) together. Patients were divided into low and high groups based on the median expression of each gene; graphs generated using GEPIA2 tool; p < 0.05 considered as significant.
Cimb 45 00592 g003
Figure 4. Positive and negative correlation of SOX6, SOX2-OT, SOX8, SOX21 and SOX30 with genes involved in the important cellular processes. Only genes with Spearman’s correlation R > 0.3, R < −0.3 and p < 0.05 were indicated in the REACTOME pathway analysis. Green color indicates negatively correlated genes, and positively correlated genes are in orange.
Cimb 45 00592 g004
Figure 5. Differences between patients with low and high expression of SRY-related genes in context of their stromal score, immune score and estimate score; t-test or Mann–Whitney U test; p < 0.05 considered as significant; ns: not significant, * p < 0.05; ** p < 0.01; **** p < 0.0001.
Cimb 45 00592 g005
Figure 6. Immunological profile of HSNCC patients depending on the expression levels of SOX2-OT, SOX8, SOX21 and SOX30. Differences in the population of lymphocytes, neutrophils, eosinophils, mast cells, dendritic cells and macrophages (A), and in the specific subpopulation of B cells, macrophages and T cells (B). t-test or Mann–Whitney U test; p < 0.05 considered as significant; ns: not significant, * p < 0.05; ** p < 0.01; *** p < 0.001; **** p < 0.0001.
Cimb 45 00592 g006
Figure 7. Validation of the results for SRY-related transcription factors using the GSE65858 and GSE3292 datasets. Expression level of SRY-related transcription factors depending on the viral status, molecular clusters and association between expression level of SOX30 and patients’ OS and PFS in all patients, only in the HPV(+) and only in the HPV(−) groups of patients using the mean (Low vs. High) of gene expression level as cut-off based on GSE65858 dataset (A). Differences of SRY-related transcription factors expression levels depending on the viral status HPV(−) and HPV(+) based on GSE3292 dataset (B). t-test or Mann–Whitney U test, or ANOVA with Kruskal–Wallis post-test; pA—log-rank (Mantel–Cox) test; pB—Gehan–Breslow–Wilcoxon test; p < 0.05 considered as significant; ns: not significant, ** p < 0.01; *** p < 0.001; **** p < 0.0001.
Cimb 45 00592 g007
Table 1. Differences in expression levels of SOX2-OT, SOX6, SOX8, SOX21, SOX30 and SRY genes depending on chosen clinical parameters. t-test or Mann–Whitney U test; p < 0.05 considered as significant.
ParameterGroupSOX2-OTSOX6SOX8SOX21SOX30SRY
Mean ± SEMp-ValueMean ± SEMp-ValueMean ± SEMp-ValueMean ± SEMp-ValueMean ± SEMp-ValueMean ± SEMp-Value
Age≤610.04783 ± 0.1198; n = 2810.7991−0.1924 ± 0.1048; n = 2810.2216−1.653 ± 0.1087; n = 2810.28733.078 ± 0.1578; n = 2810.33610.6262 ± 0.1301; n = 2810.25680.8572 ± 0.08776; n = 2810.04
>610.1532 ± 0.1391; n = 240−0.3326 ± 0.1070; n = 240−1.885 ± 0.09462; n = 2402.780 ± 0.1798; n = 2400.3228 ± 0.1224; n = 2400.6531 ± 0.09133; n = 240
GenderFemale0.04783 ± 0.1198; n = 2810.7991−0.1165 ± 0.1309; n = 1370.4837−1.964 ± 0.1156; n = 1370.17972.373 ± 0.2214; n = 1370.00130.1220 ± 0.1505; n = 1370.0556−0.3659 ± 0.005930; n = 137<0.0001
Male0.1532 ± 0.1391; n = 240−0.3071 ± 0.09033; n = 384−1.687 ± 0.09008; n = 3843.144 ± 0.1393; n = 3840.6164 ± 0.1093; n = 3841.166 ± 0.07612; n = 384
AlcoholPositive0.1556 ± 0.1136; n = 3480.5642−0.2460 ± 0.09173; n = 3480.7338−1.713 ± 0.08719; n = 3480.14592.857 ± 0.1488; n = 3480.42520.5789 ± 0.1124; n = 3480.22880.8373 ± 0.07675; n = 3480.023
Negative0.002347 ± 0.1577; n = 163−0.2776 ± 0.1351; n = 163−1.856 ± 0.1399; n = 1633.109 ± 0.1999; n = 1630.2951 ± 0.1521; n = 1630.6343 ± 0.1169; n = 163
SmokingYes- and Ex-smoker0.2712 ± 0.1096; n = 3920.0023−0.3185 ± 0.08872; n = 392<0.0001−1.751 ± 0.08042; n = 392< 0.00013.082 ± 0.1368; n = 392<0.00010.4488 ± 0.1002; n = 3920.11630.8309 ± 0.07446; n = 3920.0472
Non-smoker−0.4950 ± 0.1496; n = 117−1.805 ± 0.1676; n = 1172.525 ± 0.2500; n = 1170.6635 ± 0.2126; n = 1170.5933 ± 0.1253; n = 1170.5933 ± 0.1253; n = 117
Table 2. Differences in expression levels of SOX2-OT, SOX6, SOX8, SOX21, SOX30 and SRY genes depending on chosen pathological parameters. t-test or Mann–Whitney U test; p < 0.05 considered as significant.
ParameterGroupSOX2-OTSOX6SOX8SOX21SOX30SRY
Mean ± SEMp-ValueMean ± SEMp-ValueMean ± SEMp-ValueMean ± SEMp-ValueMean ± SEMp-ValueMean ± SEMp-Value
Cancer StageI + II0.2040 ± 0.2092; n = 1170.9240.1695 ± 0.1433; n = 1170.0014−1.904 ± 0.1304; n = 1170.54062.957 ± 0.2369; n = 1170.70.2561 ± 0.1733; n = 1170.22270.7084 ± 0.1211; n = 1170.9845
III + IV0.06481 ± 0.1033; n = 390−0.3372 ± 0.08720; n = 390−1.700 ± 0.08909; n = 3902.964 ± 0.1389; n = 3900.5903 ± 0.1072; n = 3900.7934 ± 0.07595; n = 390
T StageT1 + T20.2248 ± 0.2679; n = 490.5677−0.01565 ± 0.2695; n = 490.1375−1.401 ± 0.2418; n = 490.07333.178 ± 0.3608; n = 490.39880.4485 ± 0.3039; n = 490.82320.9239 ± 0.2115; n = 490.2598
T3 + T40.04335 ± 0.1013; n = 410−0.3313 ± 0.08443; n = 410−1.861 ± 0.07732; n = 4102.832 ± 0.1321; n = 4100.2970 ± 0.09282; n = 4100.6437 ± 0.06757; n = 410
N StageN0 + N1−0.1296 ± 0.1123; n = 2420.2572−0.2025 ± 0.1081; n = 2420.1625−1.845 ± 0.1005; n = 2420.17632.988 ± 0.1669; n = 2420.53510.05867 ± 0.1205; n = 2420.00080.7524 ± 0.09294; n = 2420.4682
N2 + N30.2947 ± 0.1767; n = 179−0.4931 ± 0.1364; n = 179−1.685 ± 0.1211; n = 1792.815 ± 0.2017; n = 1790.5726 ± 0.1409; n = 1790.6242 ± 0.09903; n = 179
GradeG1 + G20.01121 ± 0.1074; n = 3680.2242−0.2435 ± 0.08779; n = 3680.3276−1.940 ± 0.07623; n = 3680.00042.958 ± 0.1342; n = 3680.85030.1451 ± 0.09247; n = 368<0.00010.6729 ± 0.07275; n = 3680.1391
G3 + G40.1540 ± 0.1750; n = 131−0.4276 ± 0.1544; n = 131−1.361 ± 0.1612; n = 1312.765 ± 0.2660; n = 1311.177 ± 0.2132; n = 1310.9374 ± 0.1368; n = 131
Perineural invasionPositive−0.3446 ± 0.1501; n = 1690.0003−0.4608 ± 0.1270; n = 1690.2902−1.985 ± 0.08808; n = 1690.74622.222 ± 0.1991; n = 1690.00070.1076 ± 0.1265; n = 1690.3210.5787 ± 0.09613; n = 1690.6863
Negative0.3188 ± 0.1490; n = 195−0.3495 ± 0.1333; n = 195−1.720 ± 0.1292; n = 1953.116 ± 0.1936; n = 1950.3887 ± 0.1430; n = 1950.5730 ± 0.09789; n = 195
Lymph node neck dissectionPositive−0.01959 ± 0.1016; n = 4210.0018−0.3538 ± 0.08515; n = 4210.0165−1.811 ± 0.07666; n = 4210.45132.774 ± 0.1316; n = 4210.00190.2630 ± 0.09197; n = 421<0.00010.7351 ± 0.06894; n = 4210.6681
Negative0.6196 ± 0.2022; n = 970.1205 ± 0.1519; n = 97−1.527 ± 0.2069; n = 973.620 ± 0.2725; n = 971.505 ± 0.2486; n = 970.9131 ± 0.1620; n = 97
Lymphovascular invasionPositive0.4095 ± 0.2077; n = 1250.0242−0.4722 ± 0.1745; n = 1250.7387−1.706 ± 0.1411; n = 1250.04493.139 ± 0.2387; n = 1250.03710.5804 ± 0.1807; n = 1250.00890.6793 ± 0.1221; n = 1250.2787
Negative−0.2250 ± 0.1262; n = 225−0.3567 ± 0.1143; n = 225−1.973 ± 0.09506; n = 2252.538 ± 0.1816; n = 2250.02504 ± 0.1149; n = 2250.5405 ± 0.08737; n = 225
HPV in p16 testPositive1.157 ± 0.2662; n = 390.009−0.1204 ± 0.3127; n = 390.2585−0.5596 ± 0.4108; n = 390.01474.145 ± 0.3795; n = 390.05593.471 ± 0.3312; n = 39<0.00011.423 ± 0.2762; n = 390.1264
Negative0.3251 ± 0.2632; n = 73−0.3236 ± 0.2012; n = 73−1.633 ± 0.1988; n = 733.295 ± 0.2976; n = 73−0.1825 ± 0.1713; n = 730.8632 ± 0.1700; n = 73
Disclaimer/Publisher’s Note: The statements, opinions and data contained in all publications are solely those of the individual author(s) and contributor(s) and not of MDPI and/or the editor(s). MDPI and/or the editor(s) disclaim responsibility for any injury to people or property resulting from any ideas, methods, instructions or products referred to in the content.

